ADDIS ABABA UNIVERSITY SCHOOL OF COMMERCE, LCSM DEPARTMENT - AAU-ETD
←
→
Page content transcription
If your browser does not render page correctly, please read the page content below

ADDIS ABABA UNIVERSITY
  SCHOOL OF COMMERCE, LCSM DEPARTMENT

CHALLENGE OF INTEGRATION OF FUEL SUPPLY CHAIN
                 IN ETHIOPIA
                       BY
               MELAKU MAMMO

A SUTUDY SUBMITTED IN PARTIAL FULFILMENT OF THE
REQUIREMENTS FOR THE AWARD OF MASTER OF ARTS
DEGREE IN LOGISTICS & SUPPLY CHAIN MANAGEMENT

                 Advisor: - Teklegiorgis A. (Asst. Prof.)
                            June, 2017
                            Addis Ababa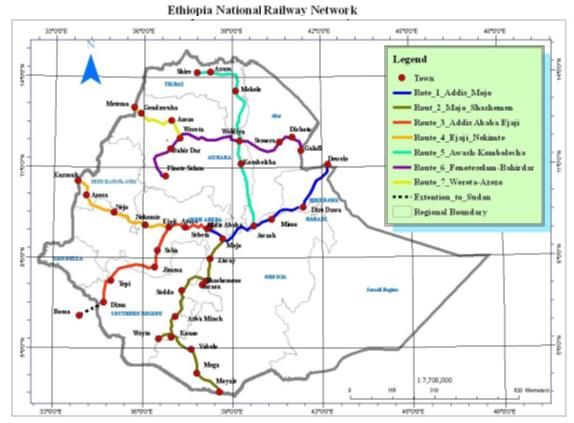
APPROVED BY BOARD OF EXAMINERS

_______________________     _________________________
      CHAIRPERSON                 SIGNATURE

_______________________     _________________________
          ADVISOR                 SIGNATURE

________________________    __________________________
    EXTERNAL EXAMINER             SIGNATURE

_________________________   _________________________
     INTERNAL EXAMINER            SIGNATURE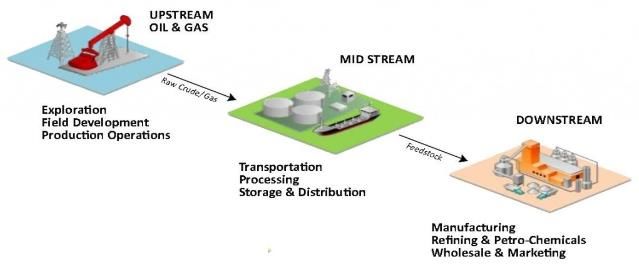
SIGNED DECLARATION

This thesis is my original work and all sources of materials used
           for the thesis have been duly acknowledged.

         Addis Ababa University School of Commerce
            _________________________________
                   MELAKU MAMMO
                       JUNE, 2017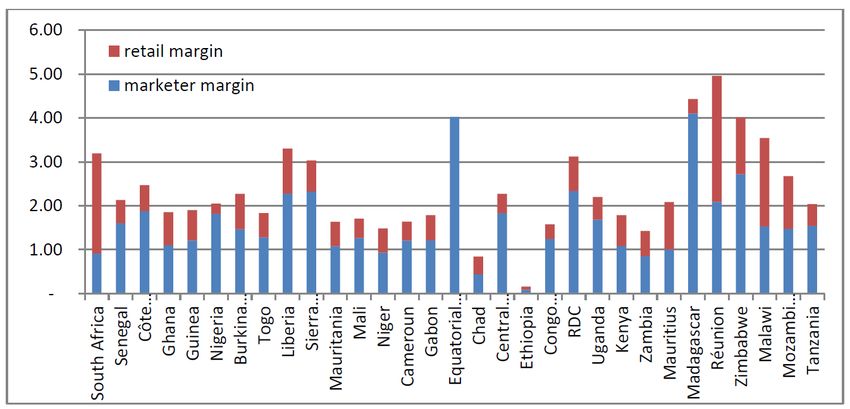
The Thesis has been submitted for examination with my approval as an
                              Advisor

                 ________________________________
             Advisor: Teklegiorgis A. (Asst. Prof.)
ACKNOWLEDGEMENTS

I would like to sincerely thank to my advisor Teklegiorgis A. (Asst. Prof), who is
a lecturer at Addis Ababa University School of Commerce, for his enduring
patience, and timely remarks and inputs to this study.
I would also like to thank Abayneh Awel, EPSE’s Supply and Sales Department
Head, for providing detail information on the role on EPSE in the fuel supply
chain of Ethiopia and other secondary data that was very helpful for the study.
Special thanks to Birhanu D. (PhD), who is a lecturer at Addis Ababa University
School of Commerce, for his valuable guidance and encouragement during
project proposal defense.
Last, but not least, I thank the seven Oil Companies (NOC, Total, Oilibya, YBP,
TAF, Nile & Dallol) for their support and kind permission to collect data from
their fuel stations and for filling in the questionnaire timely.

                                          I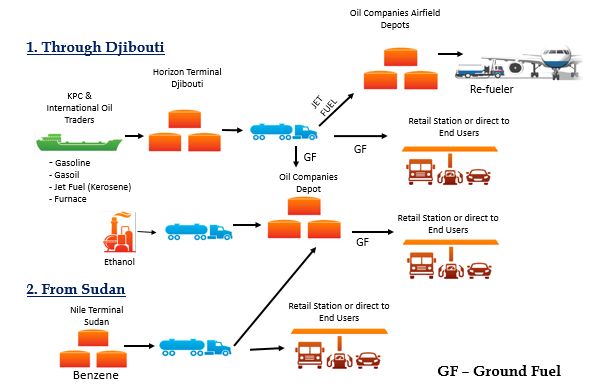
Table of content
                                                                        Page
Acknowledgment                                                            i
Table of contents                                                         ii
List of Tables                                                            iv
List of Figures                                                           v
List of Abbreviations/Acronyms                                            vi
Abstracts                                                                 vii

Chapter 1: Introduction

    1.1          Background                                               1
    1.2          Downstream Petroleum Sector in Ethiopia                  6
    1.3          Statement of the problem                                 10
    1.4          Research questions                                       11
    1.5          Objectives of the study                                  11
Chapter 2: Preliminary Research Review

    2.1          Supply Chain of fuel                                     13
    2.2          Supply Chain integration                                 14
    2.3          Challenges and obstacles of logistics of fuel supply     20
    2.4          Management decisions in Supply Chain of fuel             24
    2.5          Benefits of Supply Chain integration                     25
    2.6          Supply chain process integration model                   26
Chapter 3: Research methodology & design

    3.1          Research Design                                          28
    3.2          Conceptual framework                                     28
    3.3          Measures or variables                                    29
    3.4          Research methodology                                     29
    3.5          Sample size and sampling method                          29
    3.6          Method of data collection                                30
    3.7          Data analysis techniques                                 30
    3.8          Ethical consideration                                    30
    3.9          Reliability & validity test of instruments               31

                                                  II
Chapter 4: Analysis of result
4.1 Fuel supply chain integration between EPSE & its Suppliers 32
4.2 Fuel supply chain integration between EPSE & Oil Companies 39
4.3 Fuel supply chain integration between Oil Companies & Fuel Stations 50
4.4 Fuel supply chain integration between Oil Companies & Com. Cust. 56
Chapter 5: Conclusion & Recommendations
5.1 Summary of findings 58
5.2 Conclusions 58
5.3 Recommendations 59
5.4 Directions for further research 59
References 60
APPENDICES
APPENDIX-A: Questionnaire to Oil Companies 66
APPENDIX-B: Questionnaire to Fuel Stations 69
APPENDIX-C: Tank Capacity of NOC – Addis Ababa Station 70
APPENDIX-D: Tank Capacity of Oilibya – Addis Ababa Station 71
APPENDIX-E: Import forecasting using SPSS V 20 73
APPENDIX-F: Test- Retest result of the questionnaire 75
APPEBDEX-G Tank capacity of Oil Companies 76
APPENDEX-H Fuel Imported into the Country 77
IIIList of tables
Page
Table 1: Strata Size of population and the actual size of the sample 30
Table 2: Horizon Terminal storage capacity 34
Table 3: Average daily loading capacity of Horizon Terminal 34
Table 4: Storage capacity in terms of average daily consumption 35
Table 5: Forecast for Fuel to be imported from 2017- 2022 35
Table 6: Location of NPRDA depot 37
Table 7: Periods where there was shortage of Gasoline at the main supply 42
Table 8: Periods where there was shortage of Gasoil at the main supply 42
Table 10: Feet size of the respondents ‘companies 48
IVList of figures
Page
Figure 1 – The Oil and Gas Industry 1
Figure 2 - Sub-Saharan Africa oil production by country and total demand 2
Figure 3 - Car ownership in selected countries in Africa, 2012 3
Figure 4 - Oil demand growth by sub-region 2000-2012 3
Figure 5 – Pricing mechanism of fuel in Africa 4
Figure 6 - Company and retail margin components 4
Figure 7 – Petroleum product imported into the countries from 1998-2016 5
Figure 8 – Importation trend of Gasoline 6
Figure 9 – Importation trend of Gasoil 6
Figure 10 – Importation trend of JET/Kerosene 6
Figure 11 – Fuel Supply Chain of Ethiopia 7
Figure 12 - The national railway network 8
Figure 13– Integration in Supply Chain 16
Figure 14 –Integrated Supply Chain 17
Figure 15 - The supply chain process integration model 26
Figure 16 - Dimensions of supply chain integration 28
Figure 17 – Djibouti Oil Terminal 34
Figure 18 – Location of NPRDA (Strategic) depots 38
Figure 19 - Means of Information Integration (EPSE and Oil Companies) 40
Figure 20 – Demand variability in the supply of Gasoline 41
Figure 21 – Demand variability in the supply of Gasoil 42
Figure 22 – Demand variability in the supply of Kerosene 43
Figure 23 – Demand variability in the supply of JET-A1 44
Figure 24 - Demand and variability in the supply of HFO 46
Figure 25 - Demand and variability in the supply of FFO 46
Figure 26 - Means of Collaboration & Coordination (EPSE & Oil Companies) 47
Figure 27 - Means of Process Integration (EPSE & Oil Companies) 49
Figure 28 - Means of Information Integration (Oil Companies & Fuel Station) 51
Figure 29 - Means of coordination and collaboration (Oil Companies & Retail Station) 52
Figure 30 - Means of Process Integration (Oil Companies and Retail Station) 54
VList of Abbreviations/Acronyms
BRV Bulk Road Vehicle
CFR Cost and Freight
CODO Company owned & dealer operated
DODO Dealer owned & dealer operated
EAL Ethiopian Air Lines
EIA United States Energy Information Administration
ENOC Emirates National Oil Company
EPSE Ethiopian Petroleum Supply Enterprise
ERP Enterprise Resource Planning
GDP Gross Domestic Product
HTL Horizon Terminal Limited
IEA International Energy Association
KMC Kilo Meter Cube
KPC Kuwait Petroleum Corporation
LPG Liquefied Petroleum Gas
MC Meter Cube
MoMPNG Ministry of Mines, Petroleum and Natural Gas
MoT Ministry of Trade
NOC National Oil Ethiopia
NPRDA National Petroleum Reserve Depot Administration
SCI Supply Chain Integration
SCM Supply Chain Management
SLA Service Level Agreement
WAS Wadi Alsundus
YBP Yetebaberut Beherawi Petroleum
YTD Year to Date
VIAbstract
The oil industry is involved in a global supply-chain that includes ordering,
transportation, import/export facilitation, inventory visibility and control, depot
administration, distribution management, customer service and information technology.
Realizing the synergies that exists in these functions, many companies have extended the
concept further upstream and downstream; the supplier of suppliers and customer of
customers.
The country is facing sporadic shortage of fuel at different times and the supply chain
members give different reasons, sometimes contradicting to each other. The purpose of
this paper is to assess the existing fuel supply chain integration practices, identify the gap
and potential constraints for a seamless integration that would ensure reliable supply of
fuel in the country. To meet the purpose, qualitative assessment of the existing
information integration, coordination and collaboration, and process integration within
the supply chain partners are made. From different literatures, the study identified factors
that are considered as a good measure of the three aspects of the supply chain integration.
Then, information from primary & secondary sources is used to conduct out the
assessment.
The relative importance index run on the mean factors indicated that, most of the factors
that are essential for internal (within Ethiopia Petroleum Supply Enterprise), customer
and supplier integrations are not implemented effectively. The study further revealed that
capacity constraints of Horizon Terminal, low profit margin of Oil Companies, vehicle
shortage, dealers (retailers) & transporters have adversely affected the synergy of the
partners involved in the supply chain. Implementing a complete integration both on
upstream, and downstream of the supply chain is a better solution. Some of the major
challenges identified are lack of information sharing, lack of collaboration on
development program and decision making, no robust inventory management system, and
lengthy approval process to uplift from NPRAD depots.
Therefore, the supply chain partners and the stakeholders should have a regular open and
transparent meeting, maintain collaborative relationship and work collaboratively on
development program and decision making to address the barriers captioned above and
thereby ensure a seamless integration across their supply chain.
VIICHAPTER 1: INTRDUCTION
1.1 Background of the study
The generic supply chain of fuel includes upstream sectors (companies involved in exploration
and extraction of crude oil), midstream sectors (companies involved in transportation,
processing, storage & distribution), downstream sectors (companies involved in refining,
marketing, distributing and transporting of petroleum product), and the consumers.
Figure 1 – The Oil and Gas Industry
Source: http://avata.com/oil-gas website
In recent years, there have been concerns and many have argued that the oil and gas industry
may have entered an era of very scarce resources. However, in reality, the resources are not the
cause of supply constraints, rather putting these reserves into production and delivering the final
products to consumers. Thus, a solid supply-chain management program will enhance this goal
(Christopher 2007). Supply chain has always been about companies working together to achieve
a common goal; serving the end customer effectively and efficiently.
More than 80% of the world's proven oil reserves are concentrated in just 10 countries. Venezuela
holds the world's biggest oil reserve followed by Saudi Arabia, while Canada and Iran hold the
third and the fourth largest oil reserves. Nigeria holds the tenth largest proven oil reserves in the
world (Hydrocarbons-Technology December 2013).
The five biggest oil consuming countries are United States of America, China, Japan, India and
Russia (Hydrocarbons-Technology October 2013). According to IEA (2014) report, oil demand in
sub-Saharan Africa stood at 1.8 million barrels per day (mb/d) in 2012 and made up 15% of total
energy demand. South Africa accounts for around 30% of oil demand and Nigeria for more than
20%, with the remaining 40-plus countries collectively consuming less oil than the Netherlands
(International Energy Association 2014).
1According to the United States Energy Information Administration (EIA 2016) Oil Market Report
forecast, worldwide average demand for 2016 was nearly 96 million barrels of oil and liquid fuels
per day. It also forecasted that in the next five years, Asia will remain the major source of oil
demand growth and China will be central to demand growth, partly because of the underlying
rise of oil demand but also due to its build-up of strategic reserves which will reach at least 500
million barrels by 2020. Gruenspecht (2011 cited in Richard & Francis 2014) mentioned that EIA
projects that the world’s energy consumption will increases from 2011 by 53% by the 2035.
International Energy Association (2014) study indicates Oil production in sub-Saharan Africa has
doubled since 1990. According to the report, Nigeria is first followed by Angola and Equilateral
Guinea.
Figure 2 - Sub-Saharan Africa oil production by country and total demand
Source: IEA (African Energy Outlook)
Ghana has joined the producers in commercial quantity in 2014. Kenya & Uganda are expected
to join these countries soon.
Energy consumption in transport in sub-Saharan Africa has increased by 4% per year since 2000
and was around 50 Mtoe (million Tones) in 2012. The consumption is heavily concentrated on
vehicles IEA (2014). The report also mentions that road transport in sub-Saharan Africa is
typically characterized by a high degree of diesel use (almost 0.4 mb/d) which accounts for 39%
of oil consumption in road transport. In most of African countries diesel has a share of around
45% in road transport, except in countries where gasoline prices are relatively low (such as
Nigeria, with only 12% diesel).
The report continued, and mentions that transport fuel is subsidized in several countries in
Africa, but is still expensive relative to average incomes of the population. Poor condition of the
roads and the low affordability of fuels also lead to relatively low use of cars and trucks,
compared with the global average. As a result, the cost of transporting goods in Africa is among
the highest in the world.
2Although the number of truck ownership in Ethiopia is the lowest, the average demand growth
for Ethiopia (10% per year) is higher than for the sub-region (4% per year). This is mainly due to
the fact that many construction projects are undergoing in the country that use heavy
construction machineries and also increase of import & export activities that need transportation
service from and to Djibouti which covers on the average 1,854 km for a round trip.
Figure 3 - Car ownership in selected countries in Africa, 2012
Source: IEA (African Energy Outlook)
The IEA report also shows that, except in Nigeria where the demand for gasoline has grown
significantly, in all other sub regions the diesel demand has increased significantly.
Figure 4 - Oil demand growth by sub-region 2000-2012
3Since fuel has a considerable impact on the economy of a country, through cost of transportation
which in turn affects cost of goods, in most African Countries, the price of fuel is regulated by the
government and so is the profit margin of Oil Companies & Retailers.
Figure 5 – Pricing mechanism of fuel in Africa
Source: Kundi Consultants Pls (2016) obtained from CITAC
Figure 6 - Company and retail margin components
Source: Kundi Consultants Pls (2016) obtained from CITAC
4In Ethiopia, so far, there has been no discovery of oil in commercial quantities. However,
exploration for oil and natural gas is currently taking place in different areas of the country,
including the parts of the Ogaden Basin, in Southern Rift Basin, the Gambela Basin, the Mekele
Basin, Metema Basin, the Abay Basin in North Western and main Ethiopia Rift Basin regions. The
sector is currently at a very early stage of development. However, it shows a good potential for
development in the future (The World Bank 2016).
Over the past 50 years, the fuel supply chain management of Ethiopia had been regulated by
government, including the price of fuel and the transport rate to be paid for Bulk Road Vehicle
owners.
At present, Ethiopia spends 2.5 billion USD annually on imported petroleum products (The
Reporter 2016), 20% of the country’s imports of goods is purely spent on fuel (Euromoney 2014).
The fuel demand would call for significant resources and put pressure on foreign current reserves
which is currently absorbing more than 4% of the GDP, roughly equals the foreign currency and
gold reserves and would increase to around 7% of GDP in 2030 (Federal Democratic Republic of
Ethiopia, 2011 CRGE report). The country consumes daily one million liters of benzene, 6.5
million liters of diesel and two million liters of jet fuel. The annual kerosene consumption is
260,000 metric tons. The country’s annual fuel consumption has been growing at a rate of ten
percent per year. In 2017 the fuel consumption is expected to surge to 3.4 million metric tons.
Figure 7 – Petroleum product imported into the countries from 1998-2016
EPSE - Fuel and Petroleum Products Import (1998-2016)
3,500,000
3,000,000
2,500,000
2,000,000
1,500,000
1,000,000
500,000
0
1997/98
1998/99
1999/2000
2000/2001
2001/2002
2002/2003
2003/2004
2004/2005
2005/2006
2006/2007
2007/2008
2008/2009
2009/2010
2010/2011
2011/2012
2012/2013
2013/2014
2014/2015
2015/2016
MGR JET/Kerosene Gasoil LFO HFO
Data source EPSE - in metric tons
In Ethiopia, during the last five years the oil demand has increased on the average by 10% per
year. Diesel accounts for 85%-87% of oil consumption. In the country, the fuel demand is more of
driven by demand of the transport sector. Lewin (2003) states the importance of the sector in
fulfilling most transportation needs, providing power and serving as a foundation for
petrochemical business underpins the survival of other essential industries.
The figure below shows the trend of importation of main fuel into the country by product type.
5Figure 8 – Importation trend of Gasoline
Trend of Gasoline demand
350,000
300,000 The demand is growing due to
250,000
increasing number of automobile in
200,000
150,000
the country and introduction of
100,000 Bajaj into the country
50,000
0
1998
2003
2008
1997
1999
2000
2001
2002
2004
2005
2006
2007
2009
2010
2011
2012
2013
2014
2015
Year Gasoline
Source: EPSE - in metric tons
Figure 9 – Importation trend of Gasoil
Trend of Gasoil demand
2,500,000
2,000,000 The demand is growing due to
1,500,000
boosting of infrastructure projects
in the country, such as road, rail &
1,000,000
dam.
500,000
0
1999
2008
1997
1998
2000
2001
2002
2003
2004
2005
2006
2007
2009
2010
2011
2012
2013
2014
2015
Year Gasoil
Source: EPSE - in metric tons
Figure 10 – Importation trend of JET/Kerosene
Trend of JET/Kerosene demand
800,000
700,000
600,000
500,000 The demand is growing due to
400,000 increasing number of EAL
300,000
destination.
200,000
100,000
0
2011
1997
1998
1999
2000
2001
2002
2003
2004
2005
2006
2007
2008
2009
2010
2012
2013
2014
2015
Year JET/Kerosene
Source: EPSE - in metric tons
6The key players in fuel supply chain of Ethiopia, from importing the product up to distributing
the product to the end customers are discussed on the next section.
1.2 Downstream Petroleum Sector in Ethiopia
Since Ethiopia does not produce oil, to meet the country’s oil requirement, the country imports
fuels from oversea. Accordingly, the study focuses on downstream petroleum sector of the supply
chain, particularly in purchase and distribution of petroleum product to customers.
Ethiopia buys 100 percent of the country’s jet fuel consumption, 800,000 metric tons and 60
percent of diesel, 1.2 million metric tons from state-owned Kuwait Petroleum Corporation (KPC)
that supplies the products directly from Kuwait using its own fuel tanker vessels. 30%-80%
percent of Ethiopia’s benzene consumption is bought from Sudan. The remaining are bought
from international oil trading firms through an international open tender process.
A supply chain consists of all stages involved, either directly or indirectly, in fulfilling a customer
request. The relationships among these companies have always involved some degree of
collaboration and coordination to solve bottlenecks in the supply chain network and overcome
bumps in demand and supply (Gonewa & Henry 2003). Through supply chain integration, the
total supply chain network in the industry will work more efficiently by sharing valuable
information, resources, knowledge and expertise with each other (Tamzidul 2012). Larry (2016)
stressed that all partners of the network should be working together to satisfy end customers;
organizations should work in a coordinated manner toward a common goal.
Figure 11 – Fuel Supply Chain of Ethiopia
Source: Developed by the author
7In Ethiopia, the demand for oil is growing exponentially. Fekadu (2013) mentioned that at
present, liquid bulk cargo tanker trucks are transporting fuel from Duraleh petroleum terminal
of Djibouti port and from Sudanese refinery at El Geli located 42kms north of Khartoum to the
hinterland. The government has an intention of increasing the number of depots, but also to
elevate the capacity of the existing depots. Accordingly, in Awash NPRDA depot a project for
installation of additional 30,000 cubic meter tank is undergoing.
There is also a plan to use rail wagons using the electricity-powered railway system that has just
been completed from Djibouti to Sebeta. The aim for the National Railway Network of Ethiopia
is to build eight new railway lines for freight and passengers covering a total distance of 5,000
kilometers working across the country by 2020 (www.ethiopianembassy.be/en/2017). But the
railway that connect to Duraleh petroleum terminal of Djibouti port and then from Awash main
line to the Awash NPRDA depots have not been started yet. The areas to be supplied from this
depot depends mainly on the number of trains to be dedicated for the purpose and the storage &
loading capacity of the terminal. Using the railway will reduce the demand for fuel since part of
the dry cargo and bulk fuels will be transported using the train which uses electricity as a source
of power. There is also a plan to build a depot at a location some 30km south of Addis Ababa at
Dukem connected with the newly built railway (The Reporter 2016) and BRVs to uplift from this
depot. This will further reduce the total distance to be covered by the BRVs to deliver fuel to
customers as well as the time required to deliver.
Figure 12 - The national railway network
Source - ERC, 2010 cited in Fekadu 2013
8Fekadu (2013) stated that two Chinese state-owned companies have been involved in building of
the rail way and transportation cost can be reduced further and environmental impact of fuel
transport can be minimized by using train tankers and/or pipelines.
Besides, their rail transportation, there is a plan to stretch a pipeline up to Awash, the main stock
reserve depot. The Reporter (2016) mentioned it is found viable a 550km-long pipeline that will
stretch form Djibouti port to Awash national reserve depot, which is 250km to the east of Addis
Ababa with a capacity of 100,000 cubic meters, so that the whole country can be supplied directly
from Awash.
Key players in the overall supply and distribution of fuel in Ethiopia and their key roles are listed
below.
Ministry of Mines, Petroleum and Natural Gas (MoMPNG): Until recently, the oversight of the
oil and natural gas sector was split between ministries. The Ministry of Mines was responsible
for upstream issues, including the allocation of exploration and production areas. The Ministry
of Water Resources, Irrigation and Energy was responsible for downstream activities related to
the use of domestic and imported fuels.
The consolidation of upstream and downstream activities under the MoMPNG provides the
opportunity to adopt and implement a comprehensive strategy for the sector under a sector
master plan (The World Bank, January 2016).
Ethiopian Petroleum Supply Enterprise (EPSE): EPSE is a government agency which is licensed
by MoMPNG as a bulk supplier. EPSE imports oil, stores and sells petroleum products to Oil
Companies. It was established in 2012 by the Council of Ministers Regulation No. 265/2012. It is
an amalgamation of the Ethiopian Petroleum Enterprise (EPE) and the National Petroleum
Reserve Depot Administration (NPRDA).
The EPE, established in 1995, was the sole entity established to meet the country’s demand for
petroleum, with the exception of liquefied petroleum gas (LPG), bitumen products, and
lubricants. The NPRDA established in 1997, was an autonomous institution responsible for
overseeing Ethiopia’s petroleum reserves to maintain the regular petroleum supply in case of
interruption or shortage (Fortune 2015).
Besides being the sole importer of fuel into the country, EPSE has a plan to build 160 retail stations
across the country and involve in retailing fuel to public, to resolve the occasional shortage of
petroleum (Oil Review Africa 2015).
International Oil Traders: They supply oil through an international open tender process.
Horizon Terminal Limited and Nile Petroleum Terminal: Since Ethiopia is a land locked county
and does not produce oil, it is necessary to use as intermediate storage terminal of the countries
through which the oil is imported. About 85% of the countries Gasoline consumption is
purchased from Sudan Petroleum Corporation and loaded from Nile Petroleum Terminal whilst
the rest of the product is imported via Djibouti port and stored at Horizon Terminal before it
enters the country.
9Horizon Terminal is operated by to Horizon Terminal Limited (HTL) and owned by ENOC. The
terminal is located at Doraleh village, which is 10 kilometers from Djibouti Port, strategically
located on the Red Sea. It provides service to both Djibouti and Ethiopia.
Bulk Distribution Companies (Oil Companies): These companies have been licensed by the
MoT as bulk distributors. They purchase oil from EPSE and distribute the product either through
their Retail Network or directly to commercial customers. At present, there are thirteen Oil
Companies in the country; namely Oil Libya, Total, National Oil Ethiopia (NOC), Yetebaberut
Beherawi Petroleum (YBP), Kobil, TAF, Nile Petroleum, Wadi Alsundus (WAS), Dallol, Olway,
Gomeju, Yeshi, and Getnet. All are local companies, except Libya, Total, Nile and WAS.
As per the monthly fuel uplift report compiled by EPSE Oil Libya, Total, National Oil Ethiopia
(NOC), Yetebaberut Beherawi Petroleum (YBP) and TAF uplift more than 85% of the countries
consumption.
Ministry of Trade (MoT): The MoT was re-established in August 1995 under the proclamation
No. 4/1995. The Ministry was again reorganized with a proclamation No. 619/2003. The main
objectives of the ministry is to ensure a modern fair trading practices. The ministry has three main
responsibilities:
a) Provides a trade license for Oil Companies and dealers (fuel station operators).
b) Regulates and establishes the price of fuel in the country by preparing a price build up
that shows the price structure from purchasing price at Djibouti and Sudan up to the
pumping price at the station. The price build-up is used by all stakeholders involved in
the marketing and distribution process (including transport rate to be paid to Bulk Road
Vehicles).
c) Calibrates Bulk Road Vehicles and dispensing pumps/meters installed at depots and
stations.
The Ministry retains regulation of the entry of petroleum marketing firms in the downstream
sector. It requires the Oil Company to construct a depot that can store a minimum of 500,000 liters
and have a minimum of 6 filling stations before issuing a license to operate as oil distributor in
Ethiopia. Although, the requirement is not implemented strictly.
Retailers (Dealers): They procure oil from Oil Companies and sell to bulk consumers and the
general public through fuel stations. There are more than 300 retailers in the country and are
either company owned & dealer operated (CODO) or dealer owned & dealer operated (DODO).
101.3 Statement of the Problem
Ethiopia is implementing the second 5-year growth and economic transformation plan that aims
to sustain or exceed the decade long double digit growth trajectory. This vibrant economic growth
needs to be supported by a robust, safe and operationally sustainable downstream oil sector.
In recent years, it has been witnessed a sporadic shortage of supply of fuel in the country. Even
though the level of intensity has reduced to a certain extent, the problem persists. For example,
there was shortage of Gasoil from November 24-29, 2016 and from December 14-17, 2016. Even
recently, from May 1-12, 2017. (Fortune 2017). In some of the events, it is observed Ethiopian
Petroleum Supply Enterprise (EPSE), Oil Companies, and Retailers giving different reasons
sometimes contradicting each other.
EPSE mentions there is adequate product, but Oil Companies and fuel stations are hoarding the
product or not uplifting adequately from the supply points speculating price decrease
respectively. Or there was shortage of product just for few days and now we have adequate
supply, but it is vague why still there is shortage of product in the cities. On the other hand, Oil
Companies states there was shortage of supply at the main supply points and still the problem
persist or stabilizing the supply needs more time. Whereas, fuel stations mention that they have
placed orders but are not supplied by Oil Companies and there is no product that we hoard from
our customer.
This shows there is some sort of integration problem in the supply chain network. Christopher
(2007) emphasizes one of the weaknesses of a supply-chain is that each company is likely to act
in its best interests. The goal of satisfying the ultimate customer is easily lost and opportunities
that could arise from some coordination of decisions across stages of the supply-chain could also
be lost. Most SCI related problems emanate, either from uncertainties or an inability to co-
ordinate several activities and partners (Sweeney 2011).
When the shortage occurs, customers suffer since at present there is no other substitutes that serve
the same purpose. It touches on people’s everyday lives with services ranging from
transportation, electricity, heating, etc. (Richard & Francis 2014) and construction works which
involve heavy machineries such as construction of dams and road. As soon as motorists notice
there is no fuel in one of the stations or there is queue of cars in stations, they will get panic, join
the line and purchase more fuel than they usually purchase, thinking the shortage will continue
for some time. This will further aggravate the issues by depleting the stock earlier than expected.
To achieve a smooth and reliable supply of fuel in the country, all partners involved in the fuel
supply chain need to follow integrated approaches and always share a big picture.
Regardless of the impact of the problem on the country’s economy and every one’s life, no study
has been made on the root cause of the shortage and thereby to look for a sustainable solution.
This study is a modest contribution to this end.
111.4 Research Question
To achieve the objectives of the study presented on section 1.5, the questions below will be
investigated.
Q1: What are the challenges for integrating the fuel supply chain between EPSE and
International Oil Traders (suppliers to EPSE)?
Q2: What are the challenges for integrating the fuel supply chain between the Oil Companies
and EPSE?
Q3: What are the challenges for integrating the fuel supply chain between the Oil Companies
and the Fuel stations?
Q4: What are the challenges for integrating the fuel supply chain between the Oil Companies
and Commercial customers?
1.5 Objective of the Study
1.5.1 The main objective
The main objective of the study is to establish challenges which inhibits effective implementation
and use of supply chain integration in the industry and how these affect the supply of oil in the
country.
1.5.2 The specific objectives
Based on the above main objective of the study and the problem statement, the study will have
the following specific objectives:
a) To examine the country’s end to end fuel supply chain activities and processes - identify
if there is misalignment of processes and activities and device a mechanism how it can be
streamlined;
b) To examine the information flow within the supply chain partners - identify if there is
information gap and advise what information can be shared consistently across the
supply chain members on timely manner.
c) To examine how the supply chain partners coordinate and collaborate their effort –
identify if there is lack of coordination or collaboration and see how to achieve seamless
coordination and collaboration towards serving the end customer.
12CHAPTER 2: PRELIMINARY LITERATURE REVIEW
2.1 Supply Chain of fuel
Commodities such as oil, gas, and petrochemicals are transported using different mode of
transportation such as pipe-lines, vessels or tankers, roads, and railroads. These commodities are
produced in limited places of the world, yet they are demanded all over the globe since they are
an essential source of energy and raw material for many other industries (Raed, Tiravat, Basheer,
2006).
The boom in global demand of oil along with the ease of international trade and the inflexibility
involved in the petroleum industry’s supply chain has made its management more complex and
more challenging (Coia 1999 cited in Barua 2010).
A supply chain consists of all stages involved, either directly or indirectly, in fulfilling a
customer’s request (Chopra & Meindl 2001). John, C. John, Rober & Brain (2013) describe supply
chain as an extended enterprise that crosses the boundaries of individual firms to span the related
activities of all the companies involved in the total supply chain. There is a tremendous need to
get everyone to pull together in the same direction (Handfield 2016); should attempt to execute
or implement a coordinated, two-way flow that bring products or services to market (Lambert,
Stock, and Ellram 1998). It includes coordination and collaboration with channel partners, which
can be suppliers, intermediaries, third party service providers, and customers (CSCMP 1984).
Organizations have realized that effective and efficient management of supply chains is essential
for present and future survival (Olhager, Perssom, Parborg, & Rosén 2002 cited in Gupta, Abidi
& Bandyopadhayay 2013).
Shah, Li, and Ierapetritou (2011 cited in Shatina, Zulkifli & Norlena 2014) state that, a typical
petroleum industry supply chain is composed of an exploration phase at the wellhead, crude
procurement and storage logistics, transportation to the oil refineries, refinery operations, and
distribution and transportation of the final products.
Christopher (2007) states in a supply-chain, a company will link to its suppliers upstream and to
its distributors downstream in order to serve its customers. The links shown below represent the
major supply-chain links in the oil and gas industry. The links represent the interface between
companies and materials that flow through the supply-chain. Currently, more opportunities exist
for coordinating supply chain activities across oil and gas operations due to improved
information and communication systems and technologies (Christopher 2007 cited in Richard &
Francis 2014).
Exploration → Production → Refining → Marketing → Consumer
A hiccup in one of links early in the supply chain can have a ripple effect on a link further down
the chain (Norman 1996). Thus, a breakdown anywhere in the supply chain has the potential of
bringing production to a halt (e.g., strikes at two GM parts plants in 1998 resulted in the shutdown
of virtually all assembly operations within days). Supply chain participants must individually
and collectively assess the probability of production-stopping events and their tolerance for risk,
which must be balanced against the savings from increased sole-sourcing, tighter integration with
the remaining suppliers, and reduced inventories and production capacities (National Research
Council 2000).
13Shatina, Zulkifli & Norlena (2014) mention the petroleum industry can be characterized as a
typical supply chain where all levels of decisions (strategic, tactical, and operational) may arise
in it. Oil companies have formed a key part of the global economy for the last decade since
petroleum or crude oil has become the main fuel source.
Shah, Li, and Ierapetritou (2011 cited in Shatina, Zulkifli & Norlena 2014) mentioned that in the
exploration and production sectors of the oil industry, the product from the source is the same
for all competing firms. Consequently, many of these firms cannot differentiate themselves from
one another by differentiating their product. Thus, companies can only differentiate themselves
based on the ability to economically find and produce oil and gas more efficiently than their
competitors. The differentiating factor can lie in the ability to adapt a sound supply-chain
management program.
They recommended the following eight strategies for improving oil and gas industry supply-
chains.
a) Segment customers based upon service needs - matching of what is produced, when it
is produced and the quantities to be produced to the specific customer requirement.
b) Customize the Logistics Network - deliver the product-service bundle in the quantities
and particularly, timing requirements set by the customer.
c) Watch for market signals and plan accordingly – to minimize bullwhip effect.
d) Form partnerships to enhance supply-chains – the relationship should not be adversarial.
e) Apply strategic sourcing - suppliers who have consistently demonstrated superior
performance to be provided a favorable status, including customer loyalty and
preferential treatment.
f) Adapt a supply-chain wide technology strategy – more integrated approach to
exploration, production, refining and marketing operations.
g) Develop channel spanning performance measures – developing supply-chain-wide
performance measurement.
h) Adapt or create operational innovation – “news ways of doing work” (Close 2006)”.
The same applies to downstream sector players (EPSE, Oil companies and Retailers) that are
involved in the distribution of oil, besides they must ensure:
Maintaining reliable supply to the customer.
Reaching the customer by opening site near the customs – increasing access and choice
for consumers in terms of driving distance and time to reach a Retail Station.
Providing clean product (none-contaminated).
Having good Customer Service Management.
2.2 Supply Chain Integration (SCI)
Supply chain management will be able to run optimally when there is a synergy between all the
components involved in every activity from upstream to downstream (Ketchen & Hult 2007).
SCM seeks to enhance competitive performance by closely integrating the internal cross-
functions within a company and effectively linking them with the external process of suppliers,
customers, and other channel members to be successful (Narasimhan & Jayaram 1998 cited in
Alexander, Jonathan & Emmanuel 2013).
14Supply chain integration, is the degree to which an organization strategically collaborates with
its supply chain partners and collaboratively manages intra and inter-organizational processes,
in order to achieve effective and efficient flows of products and services, information, money and
decisions, to provide maximum value to the customer (RMS Consulting 2014). These partners
either succeed as a whole in delivering superior value to the end customer or they do not
(Christopher 2007).
Clancy (1997) cited in Putzger (1998) describes SCI as an attempt to elevate the linkages within
each component of the chain, to facilitate better decision making and to get all the pieces of the
chain to interact in a more efficient way. Supply chain integration is the extent a manufacturer
strategically collaborates with its supply chain partners and collaboratively manages intra- and
inter-organizational processes (Flynn, Huo & Zhao 2010 cited in Krishnapriya & Baral 2014).
Sezen (2008) argued that proper implementation of supply chain integration in the organizations
will meet individual customers’ demand, reduce delivery time, decrease logistics and purchasing
cost, reduce the level of inventories and increase work force efficiency and market share by
sharing the supply and demand information. Integration is a process of redefining and
connecting parts of a whole in order to form a new one (Craft 2006). Supply chain integration is,
to a great extent, concerned with the development of more integrated approaches that hold out
the prospect of eliminating many of the inefficiencies directly attributable to supply chain
fragmentation (Sweeney 2011).
Singh and Power (2009), Ou, C. S., Liu, F. C., Hung, Y. C., Yen & D. C. (2010), Wiengarten,
Humphreys, Guangming, Fynes & McKittrick (2010) cited in Alexander (2013) indicated that in
recent years, there has been a great deal of empirical evidence to show that successful SCI can
improve a firm’s performance and competitive advantage. Gimenez, Vaart, and Donk (2012 cited
in Krishnapriya & Baral 2014) in their research show that supply chain integration increases
performance moderated by a context variable like supply chain complexity.
SCI problems and inefficiencies can consume a considerable amount of resources, money and
time, and ultimately lead to customer dissatisfaction. Most supply chain management related-
problems stem either from uncertainties or an inability to co-ordinate several activities and
partners (Turban, McLean, & Wetherbe 2004).
Researchers tried to define SCI from different dimensions and perspective, but all have
mentioned about the need for collaborative relationship, information sharing and to work as a
single entity with a common objective to serve the end customer. Although, the importance of
supply chain relations is widely acknowledged, seamless coordination is rarely achieved in
practice coupled with several challenges (Alexander et al, 2013).
According to (Amue1 & Ozuru 2013), SCI is the integration on information, knowledge, processes
and through which different functions within and outside of the sector can work together to
enhance the level of efficiency as well as reduce the cost of operation to increase organizational
effectiveness. Integration in this context refers to the extent to which various supply chain
activities and processes work together in as seamless manner as possible (Sweeney 2011). He
continues, and mentions that there is significant evidence confirming effective implementation of
integrated SCM has the potential to generate significant improvements in the performance of
firms.
15Handfield and Nichols (cited in Power 2005) outlined the main drivers of integration are:
The information revolution;
Increased levels of global competition creating a more demanding customer and demand
driven markets; and
The emergence of new types of inter-organizational relationships.
According to them, the three principal elements of an integrated supply chain are information
system, inventory management, and supply chain relationships.
Langley and Holcomb (1992) and Shapiro, Singhal & Wagner (1993) mention that literatures
suggest that there are two interrelated forms of integration that manufacturers regularly employ
(Fig. 9). The first type of integration involves coordinating and integrating the forward physical
flow of deliveries between suppliers, manufacturers, and customers. The other predominant type
of integration involves the backward coordination of information technologies and the flow of
data from customers to suppliers. Information technologies allow “multiple organizations to
coordinate their activities in an effort to truly manage a supply chain”.
Figure 13 – Integration in Supply Chain
Source: (T. Frohlic; Westbrook, 2001)
Besides, they depicted the strategic position of each respondent with respect to the extent of
supply chain integration development using “arc of integration” and empirically proofed that
Companies with the greatest arcs of supplier and customer integration will have the largest rates
of performance improvement. Researchers cited in Alexander et al. (2013) argue the best
integration strategy must involve “complete integration”.
Lambert and Cooper (2000 cited in Power 2005) mentioned that integrating and managing all
process links throughout the entire supply chain is likely not appropriate. Since the drivers for
integration are different from process link to process link, the levels of integration should vary
from link to link, and over time.
Bask and Juga (2001) state the relationships between organizations are delicate and complex and
no one recipe exists on how the supply chains achieve best performance. For some companies,
tight integration is the answer under regimes like efficient consumer response, quick response,
etc. For others, intensive integration may be the goal in selected areas of SCM, while in other areas
it can be beneficial to strive for limited integration.
16There are researchers who consider SCI as two dimension: internal integration and external
integration (Tutuncu and Kucukusta 2008).
According to Katunzi (2010), the pillars of supply chain integration are cooperation,
collaboration, information sharing, trust, partnership, shared technology, and a fundamental shift
away from managing individual function processes, to managing integrated chains of process.
Alexander et al. (2013) argue that SCM has three independent variables: internal, suppliers and
customer integrations. Flynn et al. (2010 cited in Alexander et al.) established the link between SC
integration (customer, supplier and internal integration) and their interactions on performance.
Frohlic and Westbrook (2001) argue that over the past decade there has been a growing consensus
among researches concerning the strategic importance of integrating suppliers, manufacturers,
and customers.
Similarly, Whipple (2016) mentioned in a more comprehensive way that to have a complete SCI
to essential to have internal integration, supplier integration and customer integration which
focus on the alignment of value creation, value delivery and value maintenance processes with
effective follow of information across the boundaries.
Figure 14 –Integrated Supply Chain
Source: (Judy Whipple Professor, 2016)
17Awad & Nassar (2010) try to classify supply chain challenges into three part,
a. The Business Micro-environmental challenges - challenges related to the challenges that effect
the supply chain integration from inside the organization's environment.
b. The Business Macro-environmental challenges (relationships) - challenges related to the
challenges that effect the supply chain integration from outside the organization's
environment and
c. The Technical challenges of SCI - challenges related to the technical challenges that effect the
supply chain integration from inside-outside the organization's environment which is more
or less related to information technology.
Stevens (1989) classifies SCI into three levels, from functional integration to internal integration
and to external integration. He mentioned that the result of his study confirms with the existing
literature and aligned with organizational theory as proposed by other researchers, which
suggests that, there are three levels of integration that leads to improved performance and
competitive advantage.
Functional Integration is the process of integrating key business processes. As a firm begins to
divide labor and seek specialization among organizational members, it is necessary to make
certain that everyone continues to work toward the common goals of the organization. Thus,
coordination and control of actions among firm members become imperative (Mintzberg 1996
cited in Matiwos 2013). While functional excellence is important, it must be supportive of overall
logistical competency.
Internal Integration is a process of inter-functional interaction, collaboration, coordination,
communication and cooperation that bring functional areas together into a cohesive organization
which can be accomplished through automation and standardization of each internal logistics
process, introduction of new technology, and continuous performance control under formalized
and centralized organizational structure (Bowersox 1989).
External Integration is a process where firms collaborate with their customers and suppliers to
obtain information and complementary resources, which they can deploy to build competitive
advantage. It involves: customer integration - refers to the process of interaction and collaboration
between an organization and its‟ customers to ensure an effective flow of products and/or
services to customers (Zhao, Xie, & Zhang 2002) and supplier integration refers to the process of
interaction and collaboration between an organization and its suppliers to ensure an effective
flow of supplies (Zhao, Baofeng, Willem, Jeff Hoi 2011).
Bowersox, Closs and Stank (2001 cited in Katunz 2011) have classified integration in a supply
chain context in six different types. These are customer integration, internal integration, material
and service supplier integration, technology and planning integration, measurement integration,
and relationship integration.
Lee (2000 cited in Skjott-Larsen & Bagchi 2002) outlines three dimensions of supply chain
integration: information, coordination and organizational linkage. Information integration refers
to the sharing of information and knowledge among the members in the supply chain, including
sales forecasts, production plans, inventory status and promotion plans. Coordination refers to
the realignment of decisions and responsibility in the supply chain.
18Organizational linkages include communication channels between the members in the supply
chain, performance measurement, and sharing of common visions and objectives.
Gimenez & Ventura (2005), Stock, Greis & Kasarda (1998) and Amue & Ozur (2013) measure the
strength of supply chain integration from three dimensions: Information integration,
Collaboration and Coordination and Process integration.
Information integration: Sharing online information throughout the supply chain network
enables the connected firms/units to integrate value chain and entire value systems. Through
sharing accurate information timely and maintaining close communication within the supply
chain network, better customer service can be ensured, more accurate demand can be forecasted,
companies can get market information in real time and more accurately (Amue1 & Ozuru 2013).
Rabobank (2013 cited in Krishnapriya & Rupashre 2014) stated that when each member of the
chain enters into longer-term partnerships, information relating to each link could be shared
across parties, enabling greater flexibility (Leach 2013). According to Coyel, Bardi & Langely
(1988), quality of information is characterized by three issues:
a) Having the right information available to make the best possible decisions.
b) Making sure that the information is as accurate as possible.
c) Effectiveness of the various means that are available to communicate information.
The way information is communicated plays an extremely important role in external process
integration (Lambert 2008 cited in Katunzi 2011). According to Lambert and Cooper (2000 cited
in Dannis & Kampton 2010), operating an integrated supply chain requires continuous
information flows which in turn assist to achieve the best product flows.
Collaboration and Coordination: A common feature of these approaches was recognition that
‘the whole is greater than the sum of the parts’. Delaney (2000) states that collaboration allows
companies to “leverage each other on an operational basis so that together they perform better
than they did separately”. Collaborative relationships internally and externally are necessary
ingredient for success (John, C. John, Rober, Brain 2013). Teece, Pisano & Shuen (1997 cited in
Shatina, Zulkifli & Norlena 2014) identified a dynamic collaboration capability should help a
company access, shift and leverage supply chain resources to rapidly respond to a changing
competitive environment.
For cooperation to exist, channel members must agree that they have concerns of mutual interest,
must work together toward the achievement of those goals, and must collectively have the ability
to create logistical and transactional channels that will enable the channel as a whole to be
competitive in the market places (Coyel, Bardi & Langely 1988).
Process integration: it involves collaborative work between buyers and suppliers, joint product
development, common systems and shared information. Lambert and Cooper (2000 cited in
Dannis & Kampton 2010) support the idea that optimizing the product flows cannot be
accomplished without implementing a process approach to the business. Viewing the supply
chain as a set of integrated process capabilities can be used to improve performance; complex
activities can be coordinated to great advantage between functions and redundant or non-value-
added activities, can be eliminated (National Research Council 2000).
19The oil industry is one of the largest and most complex industries in the world that encompasses
many stakeholders, involves huge investment and touches on peoples’ everyday lives with
services ranging from transportation, electricity, heating, etc. (Richard & Francis 2014), using
integrated process across the network will enhance the overall process.
Shared information between supply chain partners can only be fully leveraged through process
integration. By connecting the business process both within the enterprise and between
enterprises, the network moves the information and intelligence by extending the reach and
richness of the information (Westbrook 2002). He continued and emphasizes that information can
be available across the supply chain through a collaborative process and the logistics of making,
distributing and delivering good become more efficient.
Regardless of the petroleum sector existed for decades and the essential role it plays in fulfilling
most transportation needs, literature related to supply chain of oil, in particular on challenges of
integration of oil supply chain are very few.
2.3 Challenges and obstacles of logistics of fuel supply
For the purpose of this research, among many definitions of logistics, the definition used by
Council of Supply Chain Management Professionals will be used “logistics is part of the supply
chain process that plans, implements and controls the efficient, effective flow and storage of
goods, service, and related information from point of origin to point of consumption in order to
meet customer requirements”. Or it is ‘the process of anticipating customer needs and wants;
acquiring the capital, materials, people, technologies, and information necessary to meet those
needs and wants; optimizing the goods- or service-producing network to fulfil customer requests;
and utilizing the network to fulfil customer requests in a timely way’ (Tilanus 1997 cited in Tseng
& Yue 2005).
Oil is produced in a few places, but the demand is everywhere. For more than a century, oil has
been the lifeblood of our transportation system. In the oil industry, product reaches to end
customer through channel of distribution. Where channel of distribution is any series of firms or
individuals who participate in the flow of goods and services from the producer to final user or
consumer (Ammer & Material, 1980). Usually, the lead time from the shipping point to the final
customers’ location takes weeks in this industry (Raed, Tiravat & Basheer 2006). They continued
and mentioned that opening new production sites or distribution centers closer to dispersed
customers is one way to reduce the lead time and transportation costs. However, the acquisition
of such facilities in the oil and petrochemical industries, if feasible, is typically very costly and
often results in higher inventory and operating costs (Hebert 2004). Red Cavaney, president of
the American Petroleum Institute, said that “Most companies are unlikely to undertake the
significant investment needed to even begin the process” (cited in Hebert 2004). Companies
therefore have recognized that improved supply chain efficiencies represent a huge area for cost
savings, specifically in the logistics area; they are estimated to be an average between 10 and 20
percent of revenues (Hamilton 2003).
According to Chopra and Mendhl (2001), a number of factors can impede external process
integration along the supply chain, causing information distortion, longer cycle times, stock-outs,
and bullwhip effect, resulting in higher overall cost and reduced customer service capabilities.
20These obstacles are summarized below (Katunzi 2011):
Silo Mentality - Failing to see the big picture and acting only in regard to a single
department within the firm or a single firm within the supply chain.
Lack of supply chain visibility - The inability to easily share or retrieve trading partner
information in real time, as desired by supply chain participants.
Lack of trust - Unwillingness to work together or share information because of fear that
the other party will take advantage of them or use the information unethically.
Lack of knowledge - Lack of process and information system skills and lack of knowledge
regarding the benefits of SCM among management and other employees, within the firm
and among partners.
On the other hand, Awasthi & Grzybowska (2014) identified 17 factors affecting the integration
of the supply chain through a survey addressed to experts from Poland and Canada. The result
of their study shows the top five barriers in supply chain integration are:
Lack of Resource sharing (integration),
Lack of Organizational compatibility,
Lack of Information sharing,
Lack of Responsibility sharing, and
Lack of Planning of supply chain activities
The study will focus on logistics process which is the main challenge of the downstream sector of
petroleum industry. Special problems and features that relate to logistics of fuel supply are listed
below:
a) The oil and petrochemical industries are global in nature. Thus, these commodities and
products are transferred between locations that are—in many cases—continents apart.
Usually, the lead time from the shipping point to the final customers’ location takes weeks
in this industry. The long distance between supply chain partners and slow modes of
transportation induce not only high transportation costs and in-transit inventory, but also
high inventory carrying costs in terms of safety stocks at the final customer location (Raed,
Tiravat, Basheer 2006). In the case of Ethiopia, according to The Reporter (2016) a truck
takes four and a half days while the rail cargo takes eight hours from Djibouti to Addis
Ababa and with up to 3,000 Tons of cargo transported in one go (www.railway-
technology.com 2016).
b) Opening new production sites or distribution centers closer to dispersed customers is one
way to reduce the lead time and transportation costs. However, now a day the acquisition
of such facilities in the oil and petrochemical industries, if feasible, is typically very costly
and often results in higher inventory and operating costs (Hebert 2004 cited in Raed,
Tiravat & Basheer 2006). In some developed countries, the number of retail stations has
reduced significantly over the last two decades due to competition, for example in UK,
between 2001 and 2011 the number of Retail Station has reduced from 12,258 in 2001 to
8,677 in 2011 (a 29% decrease). On the average a customer is expected to drive 10 minutes
to access petroleum (Deliotte 2012). In Ethiopia, the number of station is increasing, but
not at rate required and customers are expected to drive more distance to get access or
purchase from their choice, especially in rural areas. This is mainly since the cost of
building a distribution center is very high and the payback period is not encouraging.
21You can also read