Resource-Efficient Pathways towards Greenhouse-Gas-Neutrality - RESCUE Summary Report - greenhouse-gas emissions - raw materials use ...
←
→
Page content transcription
If your browser does not render page correctly, please read the page content below

Resource-Efficient Pathways
towards Greenhouse-Gas-
Neutrality – RESCUE
Summary Report

                      greenhouse-gas
                         emissions

                       raw materials use

For our Environment
Imprint

Publisher:
Umweltbundesamt
Wörlitzer Platz 1
06844 Dessau-Roßlau
Tel: +49 340-2103-0
Fax: +49 340-2103-2285
buergerservice@uba.de
Internet: www.umweltbundesamt.de

   /umweltbundesamt.de
   /umweltbundesamt
   /umweltbundesamt
   /umweltbundesamt

Authors:
Jens Günther, Harry Lehmann, Philip Nuss, and Katja Purr

and
Frederike Balzer, Detlef Drosihn, Knut Ehlers, Eric Fee,
Matthias Futterlieb, Dirk Günther, Benno Hain,
Reinhard Herbener, Katja Hofmeier, Guido Knoche,
Matthias Koller, Kora Kristof, Martin Lambrecht, Martin Lange,
Ullrich Lorenz, Felix Müller, Nathan Obermaier, David Pfeiffer,
Marie-Luise Plappert, Sebastian Plickert, Christopher Proske,
Bettina Rechenberg, Manuel Rudolph, Martin Schmied,
Joscha Steinbrenner, Carla Vollmer, Max Werlein

Editors:
Section I 1.1: “Fundamental Aspects, Sustainability Strategies
and Scenarios, Sustainable Resource Use”
Philip Nuss, Antje Kropf and Jens Günther

Section V1.2 “Energy Strategies and Scenarios”
Katja Purr and Kirsten op de Hipt

Layout:
publicgarden GmbH, Berlin

Publications as pdf:
www.umweltbundesamt.de/publikationen

Image source:
shutterstock, Adobe Stock

Status:
Dessau-Roßlau, November 2019

ISSN 1862-4359

Resource-Efficient Pathways towards
Greenhouse-Gas-Neutrality – RESCUE
Summary Report

The results of the scenario modeling shown in
this report are based to a large extent on the
research project “Transformationsprozess zum
treibhausgasneutralen und ressourcenschonenden
Deutschland” (engl. “Transformation process to
a greenhouse-gas neutral and resource -efficient
Germany”) (FKZ: 3715 41 115 0) carried out by a
research consortium consisting of:

ifeu – Institut für Energie- und Umweltforschung GmbH:
M. Dittrich, F. Dünnebeil, A.v. Oehsen, S. Koeppen,
R. Vogt, H. Fehrenbach, K. Biemann, S. Limberger,
B. Ewers, A. Auberger
Fraunhofer IEE – Fraunhofer-Institut für Energiewirtschaft:
N. Gerhardt, S. Becker, D. Böttger, F. Frischmuth
SSG – Sustainable Solutions Germany: K. Schoer
CONSIDEO GmbH: K. Neumann

Inhalt

Executive Summary. . . . . . . . . . . . . . . . . . . . . . . . . . . . . . . . . . . . . . . . . . . . . . . . . . . . . . . . . . . . . . . . . . . . . . . . . . . . . . . . . . . . . . . . . . . . . . . . . . . . . . . . . 7

1 Introduction. . . . . . . . . . . . . . . . . . . . . . . . . . . . . . . . . . . . . . . . . . . . . . . . . . . . . . . . . . . . . . . . . . . . . . . . . . . . . . . . . . . . . . . . . . . . . . . . . . . . . . . . . . . . . . . 8

2 Green-scenarios. . . . . . . . . . . . . . . . . . . . . . . . . . . . . . . . . . . . . . . . . . . . . . . . . . . . . . . . . . . . . . . . . . . . . . . . . . . . . . . . . . . . . . . . . . . . . . . . . . . . . . . 13

3 Action fields. . . . . . . . . . . . . . . . . . . . . . . . . . . . . . . . . . . . . . . . . . . . . . . . . . . . . . . . . . . . . . . . . . . . . . . . . . . . . . . . . . . . . . . . . . . . . . . . . . . . . . . . . . . . . 18
       3.1 Energy system.. . . . . . . . . . . . . . . . . . . . . . . . . . . . . . . . . . . . . . . . . . . . . . . . . . . . . . . . . . . . . . . . . . . . . . . . . . . . . . . . . . . . . . . . . . . . . . . . . . . . . . . . .             20
       3.1.1 Final energy demand. . . . . . . . . . . . . . . . . . . . . . . . . . . . . . . . . . . . . . . . . . . . . . . . . . . . . . . . . . . . . . . . . . . . . . . . . . . . . . . . . . . . . . . . . . . . . . . .                        21
       3.1.2 Electricity Supply. . . . . . . . . . . . . . . . . . . . . . . . . . . . . . . . . . . . . . . . . . . . . . . . . . . . . . . . . . . . . . . . . . . . . . . . . . . . . . . . . . . . . . . . . . . . . . . . . . . .                 24
       3.1.3 Fuels and raw materials supply. . . . . . . . . . . . . . . . . . . . . . . . . . . . . . . . . . . . . . . . . . . . . . . . . . . . . . . . . . . . . . . . . . . . . . . . . . . . . . . . . . . .                                     28
       3.1.4 Conclusions.. . . . . . . . . . . . . . . . . . . . . . . . . . . . . . . . . . . . . . . . . . . . . . . . . . . . . . . . . . . . . . . . . . . . . . . . . . . . . . . . . . . . . . . . . . . . . . . . . . . . . . . . . .           31
       3.2 Building and housing . . . . . . . . . . . . . . . . . . . . . . . . . . . . . . . . . . . . . . . . . . . . . . . . . . . . . . . . . . . . . . . . . . . . . . . . . . . . . . . . . . . . . . . . . . . . . . . . .                      33
       3.2.1 Development of energy demand and supply. . . . . . . . . . . . . . . . . . . . . . . . . . . . . . . . . . . . . . . . . . . . . . . . . . . . . . . . . . . . . . . . . . . .                                                            35
       3.2.2 Development of raw materials requirements . . . . . . . . . . . . . . . . . . . . . . . . . . . . . . . . . . . . . . . . . . . . . . . . . . . . . . . . . . . . . . . . . . .                                                           37
       3.2.3 Conclusions.. . . . . . . . . . . . . . . . . . . . . . . . . . . . . . . . . . . . . . . . . . . . . . . . . . . . . . . . . . . . . . . . . . . . . . . . . . . . . . . . . . . . . . . . . . . . . . . . . . . . . . . . . .           39
       3.3 Mobility. . . . . . . . . . . . . . . . . . . . . . . . . . . . . . . . . . . . . . . . . . . . . . . . . . . . . . . . . . . . . . . . . . . . . . . . . . . . . . . . . . . . . . . . . . . . . . . . . . . . . . . . . . . . . . . . .   40
       3.3.1 Development of transport. . . . . . . . . . . . . . . . . . . . . . . . . . . . . . . . . . . . . . . . . . . . . . . . . . . . . . . . . . . . . . . . . . . . . . . . . . . . . . . . . . . . . . . . . .                               41
       3.3.2 Conclusions.. . . . . . . . . . . . . . . . . . . . . . . . . . . . . . . . . . . . . . . . . . . . . . . . . . . . . . . . . . . . . . . . . . . . . . . . . . . . . . . . . . . . . . . . . . . . . . . . . . . . . . . . . .           46
       3.4 Industry .. . . . . . . . . . . . . . . . . . . . . . . . . . . . . . . . . . . . . . . . . . . . . . . . . . . . . . . . . . . . . . . . . . . . . . . . . . . . . . . . . . . . . . . . . . . . . . . . . . . . . . . . . . . . . . . .   47
       3.4.1 Development within industry. . . . . . . . . . . . . . . . . . . . . . . . . . . . . . . . . . . . . . . . . . . . . . . . . . . . . . . . . . . . . . . . . . . . . . . . . . . . . . . . . . . . . .                                    49
       3.4.2 Conclusions. . . . . . . . . . . . . . . . . . . . . . . . . . . . . . . . . . . . . . . . . . . . . . . . . . . . . . . . . . . . . . . . . . . . . . . . . . . . . . . . . . . . . . . . . . . . . . . . . . . . . . . . . .            52
       3.5 Waste and Wastewater . . . . . . . . . . . . . . . . . . . . . . . . . . . . . . . . . . . . . . . . . . . . . . . . . . . . . . . . . . . . . . . . . . . . . . . . . . . . . . . . . . . . . . . . . . . . . . .                          54
       3.6 Agriculture and LULUCF. . . . . . . . . . . . . . . . . . . . . . . . . . . . . . . . . . . . . . . . . . . . . . . . . . . . . . . . . . . . . . . . . . . . . . . . . . . . . . . . . . . . . . . . . . . . . . .                         54
       3.6.1 Development of agriculture. . . . . . . . . . . . . . . . . . . . . . . . . . . . . . . . . . . . . . . . . . . . . . . . . . . . . . . . . . . . . . . . . . . . . . . . . . . . . . . . . . . . . . . .                                 55
       3.6.2 Development of the sinks. . . . . . . . . . . . . . . . . . . . . . . . . . . . . . . . . . . . . . . . . . . . . . . . . . . . . . . . . . . . . . . . . . . . . . . . . . . . . . . . . . . . . . . . . .                               57
       3.6.3 Conclusions.. . . . . . . . . . . . . . . . . . . . . . . . . . . . . . . . . . . . . . . . . . . . . . . . . . . . . . . . . . . . . . . . . . . . . . . . . . . . . . . . . . . . . . . . . . . . . . . . . . . . . . . . . .           58

4 Results. . . . . . . . . . . . . . . . . . . . . . . . . . . . . . . . . . . . . . . . . . . . . . . . . . . . . . . . . . . . . . . . . . . . . . . . . . . . . . . . . . . . . . . . . . . . . . . . . . . . . . . . . . . . . . . . . . . . 60
       4.1 Territorial Greenhouse Gas (GHG) Emissions. . . . . . . . . . . . . . . . . . . . . . . . . . . . . . . . . . . . . . . . . . . . . . . . . . . . . . . . . . . . . . . . . . . . .                                                         61
       4.1.1 2030 – On the Path towards Greenhouse Gas Neutrality. . . . . . . . . . . . . . . . . . . . . . . . . . . . . . . . . . . . . . . . . . . . . . . . . . . . . .                                                                           61
       4.1.2 2050 – Greenhouse Gas Neutrality. . . . . . . . . . . . . . . . . . . . . . . . . . . . . . . . . . . . . . . . . . . . . . . . . . . . . . . . . . . . . . . . . . . . . . . . . . . . . . .                                             63
       4.1.3 2050 – Greenhouse Gas Neutrality in a global context. . . . . . . . . . . . . . . . . . . . . . . . . . . . . . . . . . . . . . . . . . . . . . . . . . . . . . . .                                                                       65
       4.1.4 Conclusions.. . . . . . . . . . . . . . . . . . . . . . . . . . . . . . . . . . . . . . . . . . . . . . . . . . . . . . . . . . . . . . . . . . . . . . . . . . . . . . . . . . . . . . . . . . . . . . . . . . . . . . . . . .           67
       4.2 Raw Materials. . . . . . . . . . . . . . . . . . . . . . . . . . . . . . . . . . . . . . . . . . . . . . . . . . . . . . . . . . . . . . . . . . . . . . . . . . . . . . . . . . . . . . . . . . . . . . . . . . . . . . . . . .            68
       4.2.1 Development of Raw Materials Consumption (RMC) by Raw Materials Categories. . . . . . . . . . . . . . . . . . . . . . . .                                                                                                                 68
       4.2.2 Level of circularity of the German economy. . . . . . . . . . . . . . . . . . . . . . . . . . . . . . . . . . . . . . . . . . . . . . . . . . . . . . . . . . . . . . . . . . . . .                                                       70
       4.2.3 Overview of single raw materials. . . . . . . . . . . . . . . . . . . . . . . . . . . . . . . . . . . . . . . . . . . . . . . . . . . . . . . . . . . . . . . . . . . . . . . . . . . . . . . . .                                         71
       4.2.4 Development of total raw materials productivity until 2050. . . . . . . . . . . . . . . . . . . . . . . . . . . . . . . . . . . . . . . . . . . . . . . . . .                                                                             73
       4.2.5 Conclusions.. . . . . . . . . . . . . . . . . . . . . . . . . . . . . . . . . . . . . . . . . . . . . . . . . . . . . . . . . . . . . . . . . . . . . . . . . . . . . . . . . . . . . . . . . . . . . . . . . . . . . . . . . .           74

5 Conclusions. . . . . . . . . . . . . . . . . . . . . . . . . . . . . . . . . . . . . . . . . . . . . . . . . . . . . . . . . . . . . . . . . . . . . . . . . . . . . . . . . . . . . . . . . . . . . . . . . . . . . . . . . . . . . . 75

6 Literature. . . . . . . . . . . . . . . . . . . . . . . . . . . . . . . . . . . . . . . . . . . . . . . . . . . . . . . . . . . . . . . . . . . . . . . . . . . . . . . . . . . . . . . . . . . . . . . . . . . . . . . . . . . . . . . . . 78
Executive Summary

Global greenhouse gas (GHG) emissions continue to        zero emissions and even GreenLate comes close to
rise despite the implementation of various climate       this goal. The Green scenarios thus show that no
protection measures. In 2017, fossil GHG-emissions       carbon capture and storage (CCS) is required for GHG-
were with 37 Gigatons (Gt) about 63 % above 1990         neutrality in Germany. In order to develop along the
levels (EK, 2019b). Furthermore, global materials        lines of the Paris Agreement, national GHG-emissions
extraction has accelerated in the last decades to        should be reduced by at least 70 % by 2030 compared
more than 90 Gt in 2017 (a fifteen-fold increase         with 1990 levels as outlined in GreenSupreme.
compared to 1900, UNEP, 2019b). Already today,
an estimated four out of nine planetary boundaries       The largest reductions in raw materials consumption
have been surpassed (i.e., climate change, altered       (RMC) is associated with the phase-out of fossil
biogeochemical cycles (phosphorus and nitrogen),         energy carriers. Overall, in GreenLate the RMC can be
land-system change, and biosphere integrity,             reduced by 56 % compared to 2010. In GreenSupreme
Rockström et al., 2009; Steffen et al., 2015). Urgent    a reduction of RMC of up to 70 % is possible through a
action is needed to ensure that humanity preserves       combination of measures targeting energy efficiency,
the life-giving functions of our natural environment.    recycling, material substitution, the use of innovative
In order to face these challenges, a fundamental         materials (e.g., textile-reinforced concrete), and
transformation across all societal groups and            sustainable lifestyles. However, the demand
economic sectors is required.                            for certain raw materials that are central for the
                                                         transformation towards a GHG-neutral and resource-
Against this background and given the known              efficient society are likely to increase (e.g., metals).
interdependencies between climate protection and
sustainable resource management, the RESCUE-study        In conclusion, the results of the RESCUE study
(“Resource-efficient Pathways towards Greenhouse-        highlight that ambitious efforts both at national
Gas-Neutrality”) presented in this report analyzes       and international level, as well as enhanced
six scenarios that describe possible transformation      international cooperation similar to the story line of
pathways towards a GHG-neutral and resource-             the GreenSupreme scenario, are necessary in order
efficient Germany in 2050. The scenarios focus           to limit global warming to 1.5 °C above pre-industrial
on different levels of ambition towards achieving        levels, and to achieve a globally equitable use of raw
GHG-neutrality (GreenLate – slow transition,             materials. Given current trends, this may appear to be
GreenSupreme – fast transition), enhanced material       a daunting task. Nevertheless, the study also shows
efficiency (GreenMe), and a wider implementation of      that achieving GHG-neutrality and a sustainable level
sustainable life-styles (GreenLife).                     of raw materials use are still possible. However, for
                                                         making this vision a reality, action must be taken
In all Green-scenarios, the overall GHG mitigation       now and every contribution (both from a production
target for 2030 of the German Climate Action Plan is     and consumption standpoint) must be seriously
reached, in particular due to the significant progress   considered and utilized.
in the energy sector (however, not all individual
sector targets are met). All Green-scenarios have
in common that a transformation towards 100 %
renewable energy (electricity, fuels, and feedstocks)
takes place until 2050. By 2050, GHG-reductions of
95 % in GreenLate and 97 % in GreenSupreme are
achieved which considers the GHG-emissions that
are also accounted for in the climate targets of the
German Federal Government. Through sustainable
agriculture and forestry management (i.e., natural
sinks), GreenLife and GreenSupreme achieve net

                                                                                                                7
1
Introduction
1 Executive Summary

Background                                                between 1880 and 2012 (IPCC, 2014). In 2018, the
Natural resources such as raw materials (biomass,         global mean temperature was found at approximately
metals, non-metallic minerals, fossil fuels), water,      0.79 °C above average temperatures during the 20th
land, and ecosystems provide the backbone of              century and 1 °C above pre-industrial levels (UBA,
modern society. Their use enables the provisioning        2017c). The UNFCCC’s1 Paris Agreement was adopted
of feed and food as well as drinking water, housing       in 2015 with the aim to keep the increase in global
and infrastructure, transportation, communication,        average temperature to well below 2 °C above pre-
and an almost infinite array of products and services.    industrial levels; and to limit the increase to 1.5 °C
And their constantly increasing use has serious           (UNFCCC, 2015). However, current policies presently
consequences. Already today, an estimated four out        in place around the world are insufficient and
of nine planetary boundaries have been surpassed,         projected to result in about 3.3 °C warming above pre-
irreversibly changing the functioning of major Earth      industrial levels (Climate Action Tracker, 2019).
system processes (such as climate change, altered
biogeochemical cycles (phosphorus and nitrogen),          Policy framework and situation in Germany
land-system change, and biosphere integrity,              The material wealth and economic prosperity of
Rockström et al., 2009; Steffen et al., 2015). Over       industrialized countries such as Germany is based to
the last few decades, a combination of changes in         a large extent on the continued use of fossil energy
land and ocean uses, overexploitation and pollution,      carriers and other raw materials which are often
climate change, and invasive alien species have           sourced through global supply chains. Various policy
led to catastrophic declines in biodiversity as more      frameworks and initiatives already exist to reduce
than 1 million animal and plant species are now           resource consumption and slow climate change in
threatened with extinction (IPBES, 2019). Raw             Germany and the European Union (EU).
materials are particularly relevant here because their
extraction and processing alone results in more than      At the EU level, the European Commission (EC)
half of global greenhouse gas (GHG) emissions and         published the 6th EU Environment Action Programme
over 90 % of global biodiversity loss and water stress    in 2012 which aims, amongst others, at decoupling
(UNEP, 2019a). On the other hand, they play a central     environmental impacts from economic growth and
role in renewable energy technologies, sustainable        refers specifically to climate protection as well as
building materials and infrastructure, modern             sustainable resource use (EP & Rat der Europäischen
communication systems, and low-carbon mobility            Union, 2002). The “Europe 2020 strategy” and its
(Mancini et al., 2019).                                   related flagship initiatives outline the EC’s vision of
                                                          promoting a resource efficient EU and supporting
Global materials extraction has accelerated in the last   the shift towards a GHG-neutral economy (EK,
decades from around 6 Gt (billion tonnes) in 1900         2010). Currently, the EC circular economy strategy
to more than 90 Gt in 2017 (UNEP, 2019b). Current         (comprising, e.g., an action plan and monitoring
scenario work by UNEP and the OECD estimates that         framework) serves as the basis for resource efficiency
this could further double to around 160 to 180 Gt         policy at EU-level (EK, 2019a). The energy roadmap
by mid-century (Hatfield-Dodds et al., 2017; OECD,        puts forth possible routes to decarbonize the energy
2019; UNEP, 2019b). The sustainable use of raw            system by 2050 (EK, 2011) and in November 2018
materials is therefore fundamental to achieving the       a strategic long-term vision for a climate-neutral
environmental and socio-economic targets set out in       economy by 2050 was published (EK, 2018). These
the United Nations’ Agenda 2030.                          policies also fundamentally shape climate and
                                                          resource policy in Germany.
Despite an increasing number of measures to
mitigate climate change, global GHG-emissions             With regard to climate protection targets, the
have nevertheless increased from 27 to 49 Gt CO2-         German government has committed to GHG-
equivalents (CO2eq) between 1970 and 2010 (IPCC,          emissions reductions of -80 to -95 % until 2050
2014). Emissions from the burning of fossil fuels         in comparison to 1990 levels (BMWi, 2010). In
and from industrial processes contributed 78 % to
total GHGs during this time period. As a result, the
global average temperature has increased by 0.85 °C       1   United Nations Framework Convention on Climate Change (UNFCCC).

                                                                                                                                9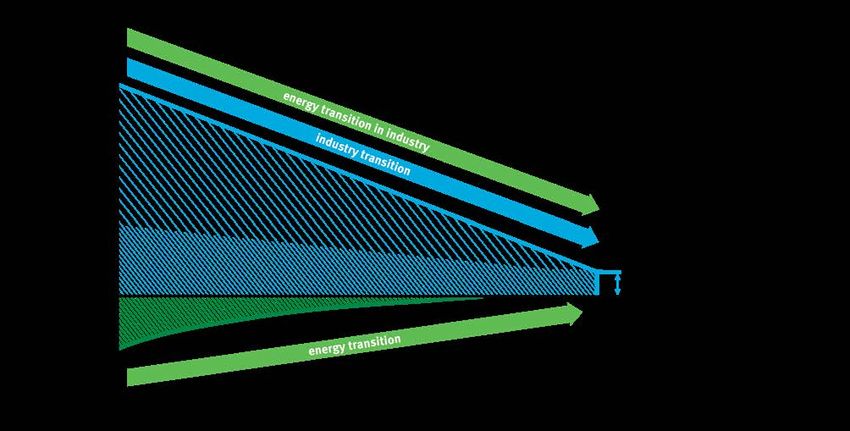
Resource-Efficient Pathways towards Greenhouse-Gas-Neutrality (RESCUE)

Figure 1

Qualitative assessment of the likelihood to reach the GHG-emissions reductions as specified in the German
Climate Action Plan 2050

Note: The “Eckpunkte für das Klimaschutzprogramm 2030” (Bundesregierung, 2019) presented by the Federal Government in                  Source: Umweltbundesamt
September 2019 specifies “greenhouse gas neutrality” by 2050 as a new environmental action target for Germany. Additionally,
measures to meet the 2030 targets are described. However, at the time of finalizing this report, the exact details of the underlying
policy measures are not yet known and could therefore not be considered in the figure.

particular, the Climate Protection Plan 2050 defines                                             1990 level (around 2 %). However, despite the overall
the milestone target of a GHG emission reduction                                                 emissions reductions in most sectors in recent years,
of at least 55 % by 2030 compared to 1990 and the                                                reaching the climate targets of the Climate Action
necessary reduction contributions of the individual                                              Plan 2050 requires substantial additional efforts
sectors to achieve this target (BMU, 2016). The                                                  and seems increasingly challenging for a number of
German government has set “greenhouse gas                                                        sectors and targets initially proposed (Figure 1).
neutrality” as a new environmental action target
for Germany by 2050 with the “Eckpunkte für das                                                  With regard to sustainable resource use,
Klimaschutzprogramm 2030” (Bundesregierung,                                                      Germany already proposed in its 2002 Sustainable
2019) presented in September 2019.                                                               Development Strategy to decouple the use of natural
                                                                                                 resources from economic growth (Bundesregierung,
Looking at current trends, territorial GHG-emissions                                             2002). Building on this, the German Resource
were reduced from 1,251 million tonnes (MT) in 1990                                              Efficiency Programme (ProgRess), adopted in
to 907 MT in 2017 (reduction of 28 %). First estimates                                           2012, specifies targets, guiding principles, and
indicate that in 2018 GHG-emissions equaled 866 MT                                               approaches to the conservation of natural resources
which translates into a further decrease in territorial                                          (BMU, 2012). Among others, its objective are: (1) to
GHG-emissions of 4.5 % compared with the previous                                                decouple economic growth as far as possible from
year. The largest GHG-reductions since 1990 took                                                 resource consumption and reduce the associated
place in the chemicals industry (-80 %) and in waste                                             environmental burdens, and (2) to make the German
and waste water (-73 %) (UBA, 2019a). Only the                                                   economy more future-proof and competitive, thus
transport sector showed an increase compared with                                                promoting stable employment and social cohesion

10
1 Executive Summary
Figure 2
Total raw material productivity, economic growth, and national welfare index* during the period 2000 to 2014
* While GDP provides a measure of the performance of an economy, it does not measure larger social welfare. Source: Umweltbundesamt based on data from UBA, 2018, 2019d
Hence, the national welfare index (NWI) (UBA, 2019d) is shown as a complementary measure. In contrast
to GDP, the NWI decreased between 2000 and 2005 and has since then been close to the value it already
reached in 1992, but started to increase slightly from 2013 on.
(BMU, 2019c). With the first update in 2016 Total raw material productivity in Germany increased
(BMUB, 2016), ProgRess is also increasingly focusing by 26 % between 2000 and 2014, mainly due to the
on the interactions with other environmental policies, significant growth in gross domestic product (GDP)
in particular climate protection. and import values. However, the use of primary
materials increased by 4 % over the same time period
The lead indicator of German resource politics is the and amounted to 2.64 billion tonnes (Gigatons = Gt)
“Total Raw Materials Productivity”2 which compares in 2014. In 2014, around 1.3 Gt of this was used
the value of all goods submitted for final use (in for consumption and investment in Germany, and
EUR, price adjusted) relative to the mass of the raw a further 1.34 Gt of raw material equivalents were
materials used domestically and abroad for their exported. In addition to the approximately 1.1 Gt
production (in tonnes) (Figure 2). The denominator of raw materials extracted in Germany in 2014, an
of the indicator accounts for both abiotic and biotic additional 1.54 Gt of raw material equivalents in
material uses. the form of semi-finished and finished goods and
raw materials were imported. Germany`s target is
to continue the observed annual growth of 1.5 %
per year from 2000 to 2010 further until 2030. The
2 Total raw material productivity = (GDP + imports)/RMI, with GDP: Gross Domestic
Product and RMI: Raw Material Input. In the indicator, imports are taken into increase is with 1.9 % currently beyond this target.
account not only by weight of imported goods but with the associated total primary
raw material inputs (Raw Material Equivalents = RME).
11Resource-Efficient Pathways towards Greenhouse-Gas-Neutrality (RESCUE)
Basic idea and outlook to this project materials management and climate protection. Land
The transformation towards a sustainable and use changes related to new settlements and transport
future-oriented society that acts within the planetary infrastructure in Germany are partly considered.
boundaries is associated to the use of natural However, further aspects such as the availability of
resources. The RESCUE study presented in this raw materials or other environmental impacts are
report explores different transformation pathways for only qualitatively discussed and present the basis for
Germany towards a raw material efficient and GHG- future studies.
neutral society considering all economic sectors.
Methods
RESCUE builds upon the German Environment In RESCUE4, a combination of five models is used
Agency`s study “Germany in 2050 – A greenhouse together with various sector-specific data to carry
gas neutral country” (UBA, 2014) which showed out quantitative assessments of GHG emissions and
that it is technically feasible to reduce national raw materials requirements in six scenarios between
GHG-emissions by 95 % until 2050 compared to 2010 and 2050. Modeling of the transport sector is
1990. The rapid phase-out of fossil fuels via the based on the Transport Emission Model (TREMOD)
widespread use of renewable energy across all sectors which analyzes the GHG emissions and energy uses
of the economy is key for this transformation. By of all means of passenger and freight transportation
switching completely to renewable energies and on a yearly basis (ifeu, 2019b; UBA, 2019c). The
exploiting efficiency potentials, it is possible to energy consumption for space heating and hot
reduce territorial GHG-emissions from energy supply water in buildings under the changing scenarios
and use (electricity, heat, transport)3 to zero. A assumptions is based on the Building Model (GEMOD)
central building block is sector coupling with direct (ifeu, 2019a). Modeling of the agricultural sector
electricity use (e.g. power to heat, electro-mobility) is based on the Agriculture and LULUCF model
or indirect use via power to gas (PtG) and power to (ALMOD, UBA, 2020a). The cross-sectoral build-up
liquid (PtL) for the provisioning of GHG-neutral fuels and optimization of the energy supply is based on
for transport, raw materials for the chemical industry, the SCOPE model, which complies with the climate
and GHG-enutral fuels for process heat in industry. targets and ensures supply security and permanent
However, for certain sectors such as agriculture and coverage of demands in all applications and sectors
LULUCF (Land use, land-use change, and forestry), (Fraunhofer IEE, 2016). We note that only a cost-
and parts of industry, GHG reductions are limited, so based optimization of the energy sector is carried out
that base emissions remain. However, raw materials in SCOPE and other societal and environmental costs
use was not considered in previous studies. are not included in the assessment. The economy-
wide use of raw materials including the upstream
In the RESCUE project, ambitious climate protection raw material requirements and GHG-emissions
and materials management are now being considered (material and carbon footprints) are derived using the
together across all economic sectors. This is done environmental and economic raw materials model
with six scenarios which show possible development (URMOD, ifeu, 2019c). Further information on the
paths for Germany until 2050. These include changes, methodology and detailed results are provided in
e.g., to energy efficiency, material efficiency and (UBA, 2020a, 2020b, 2020c, 2020d, 2020e).
product lifetimes, lifestyle changes, and economic
growth. The aim is to (1) quantify the demand for
raw materials (i.e., fossil fuels, metals, non-metallic
minerals and biomass) associated with a GHG-
neutral Germany until 2050, (2) capture the effects
of individual measures and assumptions on raw
material consumption and GHG-emissions, and (3)
highlight possible synergies and obstacles between
3 The study only considered greenhouse gas emissions in Germany according to the 4 The results presented are based largely on the UBA research project
annual National Inventory Report (NIR). Emissions from imported goods (carbon “Transformationsprozess zum treibhausgasneutralen und ressourcenschonenden
footprint) as well as emissions from exported goods are not considered. Deutschland” (Forschungskennzahl 3715411150).
122 Green-scenarios
Resource-Efficient Pathways towards Greenhouse-Gas-Neutrality (RESCUE)

Against the background of the interdependencies             structures are assumed not to change fundamentally
and complexities of climate protection and natural          until 2050. Innovative information- and
resource conservation, six scenarios were developed         telecommunication technologies and digitalization
and analyzed to map possible transformation                 are an integral part of society and in all economic
pathways and solution spaces to maneuver toward             sectors. The necessary infrastructures are planned
a GHG-neutral and resource-efficient Germany. The           and implemented in a timely manner to enable the
results of the Green-scenarios describe possible            transformation until 2050.
pathways into the future and the associated GHG
emissions (territorial perspective) and raw materials       A common understanding by all societal groups
consumption (biomass, fossil fuels, metals, and             exists that climate protection, decarbonization,
non-metallic minerals) (consumption perspective             energy savings, and resource conservation are
including upstream raw materials requirements).             necessary key characteristics going forward.
                                                            Furthermore, all scenarios represent target scenarios
In all Green-scenarios, Germany continues to be a           that meet the GHG reduction targets of -55 % in 2030
country with a high population density and strong           and -95 % in 2050 compared to 1990 levels (BMU,
industrial power, and is embedded in the European           2016). However, the individual development paths to
Union (EU) and the world. Today´s economic                  achieve these targets differ by scenario.

Figure 3

Comparison of the different parameters of the six GREEN-scenarios in RESCUE

                                                                                                 Source: Umweltbundesamt

14
2 Green-scenarios
Among the key parameters of all Green-scenarios GreenEe1 and Ee2
is the demographic development in Germany. All The two GreenEe scenarios stand for “Germany –
scenarios follow option V1 of the German Statistical resource efficient and greenhouse gas neutral – Energy
Office according to which the population changes efficiency” and focus on the implementation of energy
from currently 83 million people to about 72 million efficiency measures across all sectors. In the scenario,
people in 2050 (Statistisches Bundesamt, 2015). it is assumed that a common understanding of the
A gradual reduction in infrastructure projects and importance of climate protection/decarbonization,
building activities is assumed which avoids new energy savings, and resource conservation exists
additional soil sealing by 2050. among German citizens and this attitude increases
over time, and is reflected in the political framework
In all scenarios, the energy system is gradually conditions. Other countries in the world follow
retrofitted and based entirely on renewable energy Germany´s developments but at a slower pace
by 2050 in which sector coupling5, i.e., the direct or (~10-year time delay) which means that the global
indirect use of renewable electricity for heat (power- development of renewable energy markets is
to-heat (PtH), fuels (power-to-gas/liquids (PtG and possible and carbon leakage6 is avoided. While in
PtL), and chemicals (power-to-chemicals (PtC)), the GreenEe1 scenario, the domestic production
allows the complete substitution of fossil fuels. capacities and therefore exports are continuously
Improvements in energy efficiency in all sectors increasing, in GreenEe2 a more balanced trade
(e.g., transport, industry, and buildings) combined situation is assumed, i.e., imports and exports
with sector coupling and direct electricity use goes converge and domestic production capacities
hand in hand with the expansion of renewable decrease. Nevertheless, higher quality products and
energy. Nuclear power and carbon capture and innovation continue in moderate economic growth in
storage (CCS) technologies are not considered as both scenarios at an average of 0.7 %.
they are prone to yet non-manageable environmental
risks (UBA, 2015a) and, therefore, do not represent Energy supply in 2050 is completely based on
sustainable future strategies for Germany. renewables and, where technically feasible, sector
coupling enables the use of electricity across all
These overarching framework conditions and targets fields of application. Energy efficiency improvements
allow a comparison of the GHG-emissions and raw reduce the overall demand for energy in all sectors
materials consumption associated with implementing (e.g., transport, industry, and building and housing).
the six scenario story lines. The effect of varying If possible, renewable electricity is directly used.
individual scenario parameters (see below) can be By 2050, for example, the industry has switched
examined. The Green-scenarios presented in this mostly to electricity-based process heat. In particular,
study aim specifically at highlighting the potentials the rapid decarbonization of the electricity sector
and interdependencies of differing levels of ambition proceeds quickly so that the integration of sector
towards GHG-neutrality (Green, Late, GreenSupreme), coupling technologies and a restructuring of the
increased material efficiency (GreenMe), and the various sectors can take place simultaneously.
widespread implementation of more sustainable Digitalization supports the optimization of energy
life-styles (GreenLife). Figure 3 provides an overview supply and demand systems in order to reduce back-
of the most important scenario parameters and how up capacities. Similar to today´s situation, energy
they differ by scenario. A short description of each imports to Germany consists mostly of fuels. By 2050,
individual Green-scenario is given below. Additional all fuel imports are fully based on renewables (i.e.,
information are available in the detailed RESCUE PtX facilities built-up abroad). Only applications for
fullreport (UBA, 2019e). which no direct electricity use is possible (e.g., fuels for
aviation, heavy-duty vehicles, and certain industrial
applications) use fuels produced via PtX routes.
5 Sector coupling is understood to mean a stronger interlocking of electricity, heat,
combustible, fuel and raw materials markets. Sector coupling enables direct or
indirect use of regenerative electricity, greenhouse gas-neutral supply to all fields
of application or complete substitution of fossil energy carriers and raw materials.
Sector coupling increases flexibility in the power system and thus supports the 6 When countries transfer the production of goods to countries with more relaxed
integration of fluctuating renewable energy generation. emission limits.
15Resource-Efficient Pathways towards Greenhouse-Gas-Neutrality (RESCUE)
In industry, the restructuring towards energy- are still widely in use due to the late transition.
efficient process technologies based on renewables Until 2050, efficient and power-based technologies
is complemented by a reduction in process-based for sector coupling can only be implemented for
emissions to the currently known technically applications with short renewal cycles, or in areas for
possible level. The transition of the transport sector which high investment incentives exist. For example,
comprises an increasing share of electric vehicles the transition towards electric mobility for private
for personal mobility and public transportation transport is implemented late. This means that by
until 2050. Transport avoidance is facilitated by 2050 a large number of conventional technologies
intelligent logistics in freight transport and the ‘city are still in operation, e.g., in transport, space
of short distances’ in personal transport. In addition heating, and process heat supply. Similarly, measures
to technical measures, healthier eating habits of the targeting traffic reduction and relocation are
population lead to reduced livestock in Germany. implemented in the last years prior to 2050. The trend
The development towards mixed forests is continued towards healthier diets only starts around 2025 and
over time thus preserving the forest as a net results in a higher share of livestock usage compared
carbon sink. Biodiversity protection is increasingly to the other scenarios.
integrated into forest management, supported by
the expansion of protected land areas for natural GreenMe
forest developments. Increasing use of secondary The GreenMe scenario (“Germany – resource efficient
raw materials and material substitution in particular and greenhouse gas neutral – Material efficiency”)
in the metals industry, chemical industry, and focuses on technical options to increase materials
building sector fosters materials efficiency. Following efficiency (i.e., the ratio between a certain benefit or
the demographic trends, per capita living space result and the (raw) materials use required for this).
requirement rise until 2030 and total living space is Globally, it is assumed that other countries follow this
subsequently reduced to the 2010 level. Land-take for trend at the same speed of technological development
transport and settlements is reduced to 20 ha/day by (no delay compared to the other Green-scenarios).
2030 and moves towards net zero in the subsequent Carbon leakage is thus avoided. Germany continues
decades until 2050. to be embedded in international trade in which
imports and exports are balanced (similar to the
GreenLate GreenEe2 scenario).
In the GreenLate scenario (“Germany – resource
efficient and greenhouse gas neutral – Late The restructuring of the energy system and of
transition”), GHG emissions are cut by 95 % as sectors such as transport, industry, and building
well. Germany remains an export-oriented and and housing develops in analogy to the GreenEe2
strong industrial power with a modern and efficient scenario. However, technologies with a smaller
society. However, the transitions process sets material footprint (measured by RMC) are favored.
in at a later point in time compared to GreenEe, For example, for photovoltaic (PV) systems an
thus highlighting the challenges of late actions. increasing number of roof-top thin-film PV modules
Consequently, GHG emissions have to be reduced are installed, which have a smaller material footprint
more radically and within a shorter period of time. and land requirements than conventional ground-
This requires enormous structural changes and based PV systems. Similarly, foundations, elevations,
investments, especially towards the end of the first and wind towers are designed with durability in
half of the century. As a result, improvements in mind, so that their service life can be significantly
energy- and materials-efficiency are lower than in increased. A variety of additional material efficiency
the other scenarios. This trend is also visible at the measures are implemented. These include, e.g.,
international stage (with a ~10-year delay). the light weighting of vehicles, use of alternative
materials such as textile-reinforced concrete for
In 2050, energy supply is based completely on construction, widespread use of wooden buildings, or
renewable sources. However, the energy demand the use of biotic materials as insulating materials in
is higher than in the other Green-scenarios as construction. Assumptions with regard to agriculture
conventional technologies with lower efficiencies and healthy diets follow the two GreenEe scenarios.
162 Green-scenarios
GreenLife Increasing urbanization results in the use of fewer
The GreenLife-scenario (“Germany – resource cars. Instead, a mix of public transport, walking and
efficient and greenhouse gas neutral – lifestyle biking, and ridesharing is used. Electro-mobility and
changes”) analyzes how changes of lifestyle and electrified public transport outside of urban centers
behavior, in addition to technical measures, influence is widely implemented by 2050. As a result, the use of
GHG emissions and raw material consumption. private vehicles in urban areas is negligible by 2050.
Current trends as well as smaller niche developments
for a more environmentally friendly behavior are Increased awareness of environmental and health
scaled up to build this scenario. issues is an important factor for moving towards
more sustainable diets. Food waste is avoided as
The demand for durable and repairable products far as possible and regional and seasonal foods are
results in innovation in the production- and service processed. Animal products are consumed much faster
sectors. The willingness of each individual to switch than in the other Green-scenarios, so that livestock in
to sustainable lifestyles leads to a reduction in the Germany decreases faster and more strongly.
demand for large living space and the retrofitting of
larger homes into sub-units. Shared housing options The technical measures, such as the transformation
are widely accepted and implemented. The share of the energy system or the integration of new efficient
of multi-family homes in the building inventory technologies in industry, mobility and buildings, are
increases. As a result, the demand for per-capita the same as in GreenEe1 and GreenEe2.
living space decreases and land-take is already
reduced to 10 ha/day by 2030 and moves towards GreenSupreme
net zero until 2050. Resource-efficient construction In GreenSupreme (“Germany – resource efficient and
is widely implemented and the share of wooden greenhouse gas neutral – Minimizing future GHG
buildings increases. emissions and raw material consumption”), the most
effective measures from the previous Green-scenarios
With regards to mobility, domestic flights are are combined in order to further reduce GHG
becoming less attractive and by 2050 only ground emissions and raw material consumption up to 2050.
transportation takes place within Germany (for In a nutshell, this includes a combination of measures
both private and business trips). Holiday flights to from GreenMe on material efficiency together with
international destinations are increasingly replaced assumptions from GreenLife on sustainable and
by domestic trips and as a result flight traffic in 2050 healthy lifestyles. In contrast to the other scenarios,
is only slightly above 2010 levels. which assume an average annual GDP growth of
around 0.7 %, in GreenSupreme the annual GDP
growth is assumed to be zero after 2030.
173 Action fields
3
Action fields
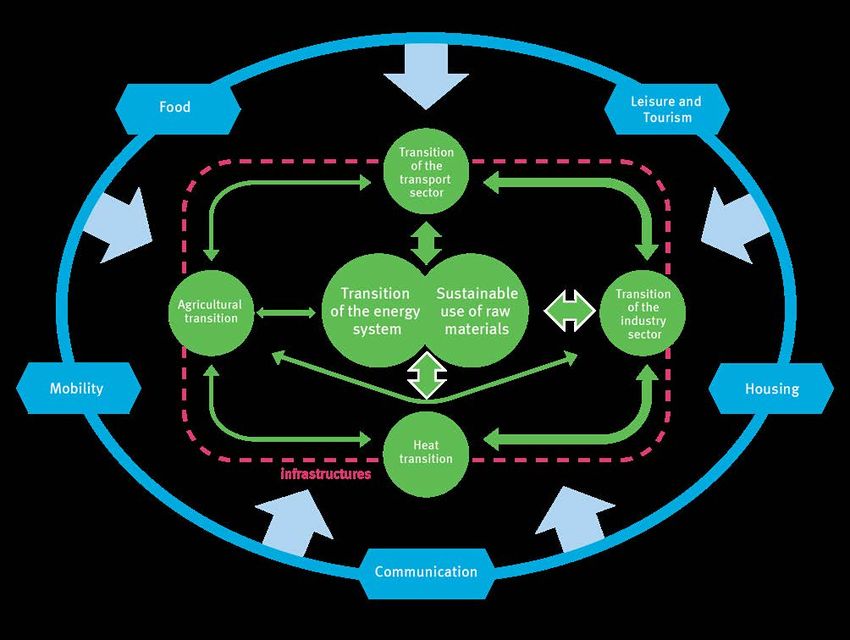
Systemic change across all sectors and societal and underlying materials system (“Rohstoffwende”)
groups is necessary to enable the transition to a (green circles at the center) towards increased
GHG-neutral and resource-efficient society. Various sustainability is directly linked to the transformation
interdependencies exist between the supply of of individual sectors (small green circles) and
energy and raw materials and the demand for the other way around. This highlights that the
these via production, infrastructure needs, and transformation of the economy has to take place with
individual consumption patterns (Figure 4). These both climate and resource protection in mind. The
interdependencies differ in their magnitude as shown speed at which such a transformation of the energy
by the width of the arrows in the figure. The needs and materials system is implemented has to consider
and consumption patterns initiated by activities such possible peaks in raw materials demands and
as leisure and tourism, housing, communication, cumulative GHG-emissions along the transformation
mobility, and food (blue hexagons) trigger a demand path and set incentives to ensure the long-term
for products and services. Providing these demands effectiveness of political measures and the readiness
requires energy and resources (e.g., raw materials, of necessary infrastructures and technologies. The
land area, and water) and results in associated following chapters describe the individual sectors/
environmental (e.g., GHG-emissions) as well as social application areas required for a transformation to a
impacts (e.g., corruption, violent conflicts, etc.). resource-efficient and GHG-neutral society.
Transforming the energy supply (“Energiewende”)
Figure 4
Schematic illustration of the interactions between different transformation pathways for by GHG source
categories
Source: Umweltbundesamt
19Resource-Efficient Pathways towards Greenhouse-Gas-Neutrality (RESCUE)
3.1 Energy system The German Environment Agency already illustrated
Energy generation in Germany is based mainly on in an earlier study (UBA, 2010, 2014, 2019b) that
fossil fuels. In 2018, 84 % of all GHG-emissions in this kind of energy transition (“Energiewende”)
Germany were caused in the energy sector. As a does neither require the use of carbon capture and
result, the restructuring of the energy system plays storage (CCS) technologies or nuclear energy, nor the
a key role in the mitigation of climate change. As a cultivation of biomass for energy generation.
certain amount of GHG-emissions from agriculture
and the industrial sector will remain, based on the When fossil energy carriers are completely
mitigation options known today, it will be necessary substituted by renewable energy, energy-related
to avoid energy-related GHG-emissions completely. GHG-emissions can be reduced to zero. At the same
This can be achieved if: time, fossil energy carriers which currently make up
about 30 % of primary raw materials consumption,
▸▸ energy and natural resources are used more can be reduced thereby lowering materials use
efficiently across all sectors and energy demand is (see Figure 5, on the left). Due to growth effects,
reduced, functional losses, downcycling, and dissipative uses
of materials, primary raw materials use cannot be
▸▸ energy generation is switched to renewable energy completely avoided (Cullen, 2017; Mayer et al., 2019).
carriers, The amount of primary raw materials required is
influenced by factors such as, e.g., the energy and
▸▸ sector coupling technologies are integrated in a materials efficiency during production, the durability
way to increase energy efficiency, and and repairability during the use phase, and the
level of collection and recycling at end-of-life which
▸▸ energy infrastructure is adjusted to the can serve as an input into the economy. However,
requirements of the new energy system. constructing an energy system based on renewables
Figure 5
Qualitative presentation of changes in greenhouse gas emissions and raw material consumption from
energy supply (left) and qualitative presentation of raw material consumption as a function of the
restructuring of the energy system to renewable energies (right)
Source: Umweltbundesamt
203 Action fields
Table 1
Characteristics of the energy sector in the different scenarios
GreenEe1/
GreenLate GreenMe GreenLife GreenSupreme
GreenEe2
Phasing out coal power plants before 2040 until 2030
Total phase out of coal as a fuel until 2050 until 2040
Speed for increasing the share
fast very fast
of renewable energy
Energy efficiency potential
very high intermediate very high very high very high
realized
Energy demand reduced by
adjusted consumer behavior high medium high very high very high
(behavioral change)
Material efficiency of
high medium very high high very high
technologies applied
will temporarily increase the demand for primary raw 3.1.1 Final energy demand
material, especially for metals. The faster the share of The resulting energy demand in the different
renewable energies in the system will grow, the faster scenarios is summarized in Figure 6. It becomes
these raw materials will be consumed, as illustrated evident that current energy demand is reduced by
in Figure 5 on the right side, where a more speedy 50 per cent until 2050 in the GreenSupreme scenario,
development of renewable energy installations while this reduction equals only 25 per cent in the
resulting in a steeper increase of raw material use. GreenLate scenario. Consequences of increasing
direct electricity use by sector coupling techniques
Energy efficiency, i.e., the energy demand across (PtX) are also visible in all Green-scenarios. In
all sectors and material efficiency, i.e., the choice total, integration of power-to-heat (PtH) (across all
of technologies applied determine the amount (top sectors), electromobility and power-to-gas (PtG)
point of the curve) of primary raw materials used. In and hydrogen-powered appliances cause a higher
the end, also in a renewable system a certain amount electricity demand, despite the power saving
of primary raw materials will be consumed, as it is potential being realized at the same time. The way
not possible from a technical perspective to fully in which these power-to-X techniques are integrated
recycle all materials used. The overall consumption into the energy system varies between the Green-
of primary raw materials, however, is influenced by scenarios. As a general rule, initially those sector
the level of recycled materials that serve as an input coupling techniques will be applied that display a
to the economy (see Figure 5, right side). high GHG mitigation potential in order to advance
GHG abatement (UBA, 2016b). GreenSupreme is a
The Green-Scenarios have been constructed to reflect particularly ambitious scenario also in this respect
these influencing factors in an adequate way, as it assumes substitution of all fossil energy
illustrating a variety of potential solutions and the carriers by direct use of electricity produced from
consequences related to different transitions renewable energy by 2050. Already in 2040, coal
pathways in the energy system. Table 1 provides an ceases to be used both as an energy carrier and as a
overview on the main characteristics of the energy raw material (e.g., for steel production). In contrast,
system in each of the scenarios. the development and application of low-carbon
techniques lags behind in all sectors in the GreenLate
scenario, particularly in the industrial sector and
in heavy duty vehicle transport. The transition
process is late but on the right track, so conventional
21Resource-Efficient Pathways towards Greenhouse-Gas-Neutrality (RESCUE)
Figure 6
Trend in final energy consumption according to energy sources in the Green-scenarios
Notice: The energy sources electricity, fuels and gases as well as the non-energy demand are increasingly Source: own figure based on UBA, 2020a, 2020b, 2020c, 2020d, 2020e
based on renewable energies. By 2050, all renewable energy requirements have been met.
energy appliances are still in use by 2050, running GreenLate and by up to 40 per cent in GreenSupreme,
on gaseous or liquid energy carriers on the basis compared to 2015. Except for the GreenLate scenario,
of renewable energy. This way, GreenLate gives an gaseous energy carriers will not be used any longer
impression on the consequences of less electrification by 2050 as the direct use of electricity is both more
in the different sectors. efficient and consequently less expensive compared
to consuming methane produced in power-to-gas
Private households are able to use energy in a more installations (UBA, 2019e). In the industry sector,
efficient manner by energetically reconstructing and the GreenLate scenario also displays the lowest
modernizing buildings, and by installing heat pumps reductions in final energy demand. In 2050, still
or district heating systems. This way, energy demand about 900 TWh final energy7 will be needed which
can be significantly reduced by 2050. In GreenLate, is only 9 per cent below industries’ final energy
energy demand is 33 per cent lower compared to the demand in the year 2015. In GreenSupreme, by
year 2015 and in GreenSupreme and GreenLife it is contrast, a more ambitious approach to increase both
up to 59 per cent below 2015 values (UBA, 2019e). energy and material efficiency, as well as a liberation
Throughout all Green-scenarios, coal is not used from annual GDP growth, result in 33 per cent less
any more as an energy carrier in private households final energy demand, with a remaining demand of
from 2030 onwards. In the manufacturing, trade,
and services sector energy efficiency measures
may reduce final energy demand by 19 per cent in 7 Including the non-energy demand for raw materials of 282 TWh.
223 Action fields
Figure 7
Trends in the share of renewable energies in the energy supply for the various Green-scenarios
Notice: Fuels including international transports Source: own figure based on UBA, 2020a, 2020b, 2020c, 2020d, 2020e
600 TWh8 in 2050. The transport sector, in all Green- scenarios (Figure 7). GreenSupreme achieves a share
scenarios, is increasingly relying on electricity to of renewable electricity of more than 80 per cent in
the extent that electrically-driven technologies are 2030. By 2040, in all scenarios except GreenLate
available. In GreenLate, efficient sector coupling and, the share of renewable electricity in gross electricity
thus, the use of electricity as a fuel in transport and demand is higher than 90 per cent.
for heat generation happens at a later point in time,
resulting in an untapped energy efficiency potential Already by the year 2030, all the scenarios require
up to the year 2050 when compared to the other the import of hydrocarbons to be used as energy
scenarios. Accordingly, GreenLate has the highest carriers in international air transport and in the
final energy demand among all Green-scenarios, chemical industry. However, raw materials as well
namely 410 TWh in 2050. The share of liquid energy as fuels for heating and transport are largely based
carriers is still at 72 per cent. In GreenSupreme, by on fossil materials up to the year 2040. Also in this
comparison, a faster integration of electric mobility regard, the high ambitions in the GreenSupreme
and a change in transport requirements result in scenario become obvious. By 2040 coal will be
a final energy demand of only 190 TWh, of which phased out both as an energy carrier and as a raw
45 per cent are made up by electricity. material. At the same time, renewable fuels produced
by power-to-gas and -liquid will be used for national
With regard to GHG mitigation, all the Green-scenarios demand in transport early on, resulting in a 40 per
quickly substitute electricity from fossil fuels by cent share of renewable energy for fuels. The share of
electricity generated from renewable sources. renewables in raw material consumption amounts to
Already by the year 2030 the share of electricity more than 50 per cent (UBA, 2019e).
from renewables is above 70 per cent in all Green
8 Including the non-energy demand for raw materials of 282 TWh.
23Resource-Efficient Pathways towards Greenhouse-Gas-Neutrality (RESCUE)
As a trend, the share of renewable raw materials load hours of hard-coal fired power plants are on a
grows faster than the share of renewable fuels for similar scale like today. In total, the share of coal
transport and heating. This is because raw materials power generation (hard coal and lignite) in total
used in the chemical industry become products that, gross electricity generation goes back from currently
in a circular economy, will be recycled multiple times 34.4 per cent (BMWi, 2019) to a maximum of 14 per
before they are finally burned and used for energy cent (74 TWh) in the year 2030. In GreenSupreme,
generation. Accordingly, greenhouse gas emissions already by the year 2030 no more electricity is
from raw materials are released into the atmosphere generated from coal. Such a high level of ambition
with some delay, while fuels are burned immediately is required in order to abate GHG-emissions quickly
nearly. Hence, a switch to renewable fuels shows to stay below the 1.5 °C level and to contribute to
immediately in the greenhouse gas inventory. In all international efforts to curb global warming.
Green-scenarios the switch to renewable energy will
only be completed by 2050. In contrast to coal-fired power stations, gas-fired
power plants10 will be needed for a longer time period
3.1.2 Electricity Supply to ensure a secure power supply. The modelling
The substitution of fossil energy carriers by results in the Green-scenarios give a varied pictures,
renewables and the resulting adjustment needs as no exogenous assumptions were made with
in the power generation system are at the core of regard to gas-fired power plants. With a less efficient
climate and resource efficiency policies. In 2017, pathway compared to the other scenarios, and a lower
electricity generation from fossil fuels caused about GHG-mitigation rate by 2040 in the energy sector,
32 per cent of all GHG-emissions in Germany. an expansion of gas-fired combined heat and power
The gradual phase-out of coal-fired power plants (CHP) installation can be expected in the GreenLate
results in lower GHG-emissions and less resource scenario, with a higher demand for gas turbines in
consumption in the short to medium term. A carefully the meantime. In 2050, the installed capacity of gas-
planned and systematic phase-out of coal-fired fired power plants exceeds the one of today. Between
power plants is a prerequisite for a predictable and 2030 and 2050, the scenarios GreenEe1, GreenEe2,
reliable structural change in lignite mining regions GreenMe, and GreenLife show a significant reduction
and has to be accompanied by concrete expansion of gas-fired power plants, while between 2030 and
plans for renewable energy. The shut-down of coal- 2040 an expansion of currently existing gas-fired
fired power plants assumed here is comparable CHP installations still occurs. By 2050, however,
to the recommendations given to the German total capacity is below 5 GW and thereby lower
Federal Government by the Commission for Growth, than the capacity currently installed. In all Green-
Structural Change, and Employment (BMU, 2019a) scenarios, full load hours of gas turbines are limited
shown in Figure 8.9 With a steady and linear to a few hours, and gas fired CHP installations run
continuation of the shutdowns, the deadlines for coal- on a significantly lower amount of full load hours,
fired power generation in the Green-scenarios (except compared to today (UBA, 2019e).
for GreenSupreme) are also within the scope of the
Commission’s recommendations. The GHG-emission The expansion of renewable energy for electricity
reductions required in the scenarios until 2030 cause generation is influenced not only by the phase-out
not only the shutdown of a number of coal-fired of fossil-fuel fired power plants and the envisaged
power plants. On top of that, the model reduces the reduction rate of GHGs, but also by the development
number of full load hours for the remaining coal-fired of electricity demand. The latter is influenced by
power stations, so that for reasons of cost-efficiency efficiency measures implemented as well as by the
a further reduction of capacity might occur. Full integration of sector coupling techniques. Another
important factor includes the dismantling or
repowering of existing renewable energy installations
9 All Green-scenarios assume that by 2030 only lignite power plants which have depending on their lifetimes. Wind power ashore and
been in operation for less than 30 years will still be in use. The capacity of such
plants amounts to almost 5.2 GW in total. In the GreenEe1 and the GreenLate
scenarios, hard coal-fired power plants are shut down after 40 years in operation
until the year 2030 which reduces the generation capacity to about 11 GW by
2030. The remaining Green-scenarios (i.e., GreenEe2, GreenMe, and GreenLife)
assume identical years of operation for lignite and for hard coal-fired power plants.
Consequently, the capacity of hard coal-fired power plants in these scenarios is 9 10 Gas-fired power plants are being increasingly based on renewable gases (via PtG)
GW in 2030. after 2040, see Chapter 5.2.3.1 in (UBA, 2019e).
24You can also read