Timberland Investment Outlook 2015-2019 - Agri Investor
←
→
Page content transcription
If your browser does not render page correctly, please read the page content below

Timberland Investment Outlook 2015-2019

About New Forests
New Forests* is a sustainable real assets investment manager offering leading-edge strategies
in forestry, land management, timber processing, infrastructure, and conservation. Founded in
2005, we offer institutional investors targeted opportunities in the Asia-Pacific region and the
United States and have over AUD 2.5 billion in assets under management, as of 1 July 2015. Our
assets include sustainable timber plantations, rural land, and conservation investments related
to ecosystem restoration and protection. New Forests seeks to deliver investment outcomes with
shared value—where we not only execute investments that generate excellent returns to our
clients but also enrich the landscapes and communities where we operate. New Forests manages
more than 600,000 hectares of land and forests and is headquartered in Sydney with offices in
San Francisco and Singapore.
New Forests has a staff of more than 45 professionals, with a diversity of experience and
backgrounds encompassing timberland investment, forest management, financial services,
governance and risk management, and responsible investment.
The company offers three distinct regional investment strategies relating to Australia-New
Zealand forestry and rural land; sustainable tropical timber plantations in Southeast Asia, and US
environmental markets and conservation forestry investments.
Each investment strategy is resourced by a regional team that includes a complementary
set of skills in due diligence, investment analytics, operations, and social and environmental
management. These teams bring local expertise and presence to investment originations, due
diligence, and operational management. All of our investment products are supported by our
Sydney headquarters, which provides centralised executive management, finance, governance,
risk management and compliance, client relations, research, and sustainability functions. This
approach ensures consistency and efficiency across our investment programs.
If you are interested to learn more about New Forests’ business, please contact us.
For more information:
Telephone: +61 2 9406 4100
Email:       info@newforests.com.au
On the web: www.newforests.com.au

*New Forests refers to New Forests Pty Ltd (ACN 114 145 274) and all of its subsidiaries.
For more information see back inside cover of this report.
Timberland
Investment
Outlook
2015-2019

Executive Summary                          1
Forestry – The Growing Asset Class         4
Timberland Investment Update               5
Timber Market Update                       14
Investing in the Future of Forestry        29
Integrating Environment and Conservation   35
The Landscape of Investment                41
Opportunities
Executive
Summary
New Forests publishes the biannual
Timberland Investment Outlook to
provide fresh perspective on the dynamic
and evolving timberland asset class.
We examine key trends in institutional
investment, forestry management,
and timber markets—important
considerations for investors seeking
to enter the asset class or manage an
existing timberland allocation. In each
Timberland Investment Outlook, New
Forests also presents a five-year outlook
on investment opportunities. We believe
this five-year horizon is meaningful for
investment strategy, yet short enough to
identify current opportunities.

In this our third Timberland Investment
Outlook, we provide our view of a maturing
forestry investment industry seeking to
accommodate continuing institutional
investment interest in the asset class.
While investment in timberland grows
returns will remain underpinned by the
level and nature of global timber demand.
Investment in productive, high-quality
timber plantations will be an essential
part of meeting future needs for
wood for timber, energy, and
biomaterials industries.

                                             1
Timberland Investment Update
Timberland has grown steadily as an asset class since the turn of the millennium – the value of
assets under management (AUM) by timberland investment management organisations (TIMOs)
has doubled in the past ten years. Forestry has developed to be a truly international asset class,
with more than USD 100 billion invested. Continued investor interest is driving competition for
forestry assets in key countries such as the United States, Australia, and New Zealand, where
investors now hold a substantial proportion of forestry assets. New capital allocations have also
led to a growing internationalisation of the asset class, as well as an expanding secondary market
for timberland sales between institutional investors.
Since the 2013 Timberland Investment Outlook, there has been a surge of investor interest in real
assets such as timberland. It has been suggested that two-thirds of large institutional investors
plan to increase allocations to real assets to 20% over the next two decades.1New Forests’
own experience has been a steady to increasing appetite from our clients for more timberland
investment as interest rates sit at record lows and yields in traditional asset classes fall. Portfolio
diversification, good risk-adjusted returns, and inflation hedging remain attractive benefits of
forestry in the portfolio of existing and new timberland investors.

                           Timber Market Update
                           Global timber demand is growing, supported by rising world population,
                           increasing per capita consumption especially in Asia, and traditional and
                           new timber uses that make wood an increasingly important raw material.
                           Since our last Timberland Investment Outlook, the forecast rebound of
                           North American lumber markets in line with anticipated US housing
                           recovery has not eventuated to the level of earlier estimates. Instead, the
                           recovery to pre-financial crisis levels now appears pushed out to around
                           2018. Meanwhile, strong softwood demand from China has continued to
                           shape global softwood markets. New Zealand has become the largest
                           supplier of softwood to China, while exchange rates have supported some
                           marginal suppliers, like Australia, to grow market share.
                           The Asia-Pacific woodchip trade, which is more than 90% hardwood, saw
                           a rapid rise of production from Southeast Asia through 2013, but this
                           trend faltered in 2014. Vietnam appears to have hit its chip production
                           peak in 2013 while traditional suppliers like Australia regained market
                           share in 2014. Expectations for China’s woodchip demand forecast have
                           moderated somewhat, but demand is expected to increase with China
                           and Japan continuing to dominate Asia Pacific woodchip markets.
                           Globally, pulp and paper markets are evolving with newsprint, printing,
                           and writing papers declining, but packaging, tissues, and other
                           biomaterials demand rising. Demand for bioenergy, biofuels, and other
                           bio-products has increased as a range of public policies encourage a
                           shift away from fossil fuels, though issues remain around the use of
                           government subsidies and the net environmental impacts of bioenergy.
                           If developed on a sustainable basis, the bio-economy is poised to be a
                           major source of wood fibre demand and a significant boon to certified
                           timber producers that can meet both regulatory and consumer demand
                           for sustainable feedstock. We anticipate potentially transformational
                           shifts as some products and technologies in the spheres of biofuels and
                           biomaterials such as Cross Laminated Timber for construction achieve
                           commercial scale.

                                                                                                          2
Investing in the Future of Forestry
New Forests believes rising timber demand and limits to natural forest wood supply will drive
investment into high-productivity plantations. Intensive plantation management and productivity
gains will be driven by a combination of technological advances and a concerted focus on improved
growth, yield, and wood quality. However, any significant increase in timber output must be
balanced with demand for the environmental services that forests and other ecosystems provide.
Investors today are starting to see opportunities in conservation management strategies within
the forest sector, including carbon markets, mitigation banking, and other conservation finance
mechanisms. Land is a finite resource, and the demands on ecosystems are growing. In order
to ensure long-term outcomes and de-risk investments, investors must account for increasing
land competition, the value of ecosystem services, and the imperative to produce more goods
without further deforestation and habitat loss. New and innovative approaches to forestry and land
investment could help support a shift to responsible landscape-level management strategies.

The Landscape of Investment Opportunities
The maturity of timberland investment markets has contributed to increased competition for
assets, discount rate compression, and reduced investment returns. North America, Australia,
and New Zealand remain the most significant regions for forestry investment, but much of the
expansion in the asset class is expected to come from emerging and semi-mature forestry
markets, such as Latin America, Asia, Africa, and Europe. However, while we expect that
institutional forestry investment in markets other than the US, Canada, Australia, and New Zealand
will continue to grow, 80-90% of the timberland investment activity will remain in those four
countries over the next five years.
As investment in timberland grows and the market matures, we expect the rise of secondary
markets, where TIMOs, REITs, and direct investors sell assets among themselves. This is already
evident in the US, but we see this extending to other regions like Australia and New Zealand. In a
maturing market, the liquidation of assets in a timberland fund may mean that it will be difficult to
re-invest in a new portfolio of assets at the same or better level of pricing as those being disposed.
This dynamic is now leading some investors to consider ways to convert funds or investment
programs into permanent capital vehicles, offering long-term and stable exposure to quality assets
secured at attractive pricing. We also expect greater specialisation and differentiation by managers
and continuation of the trend in industry consolidation.
Investors must consider a range of factors when investing in timberland. The asset class now
offers a variety of market exposures, management strategies, and a range of risk-adjusted returns.
This third Timberland Investment Outlook provides insight as to how the forest sector
and institutional investment trends may combine to provide attractive investment opportunities.
We also look to encourage the ongoing shift of forestry to a high-quality, well-capitalised sector
with long-term management horizons that generate not only attractive risk-adjusted financial
returns but also result in benefits for our society and our environment.

                                                                                                     3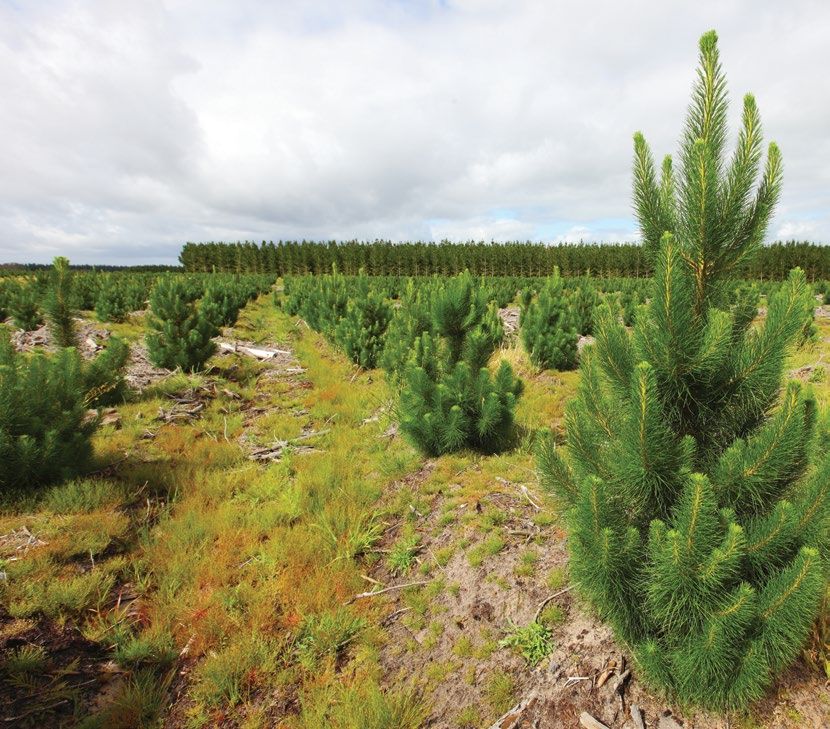
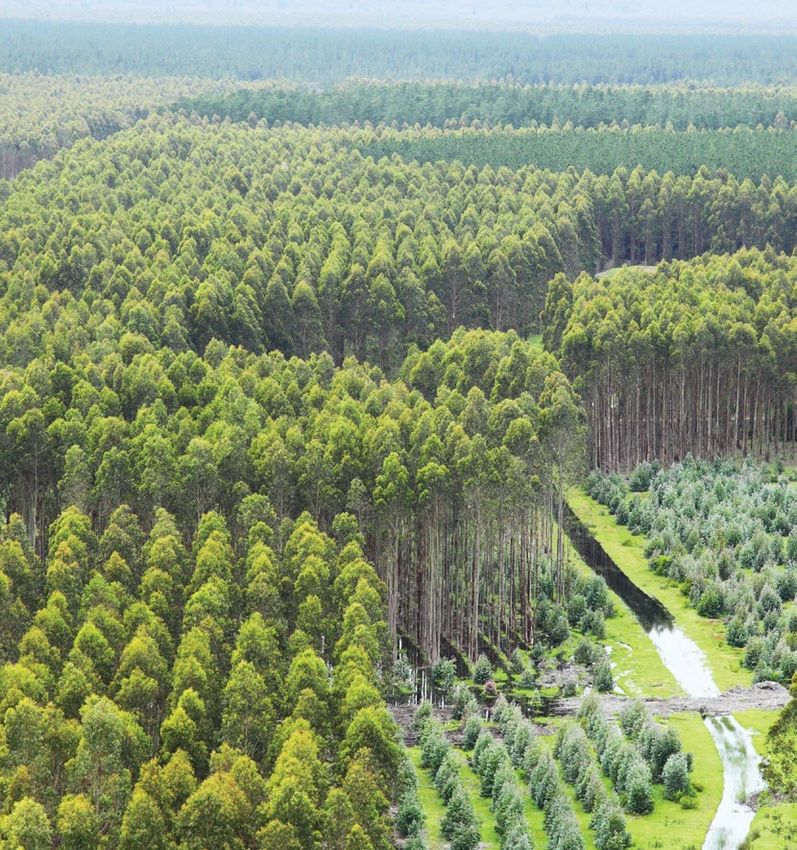
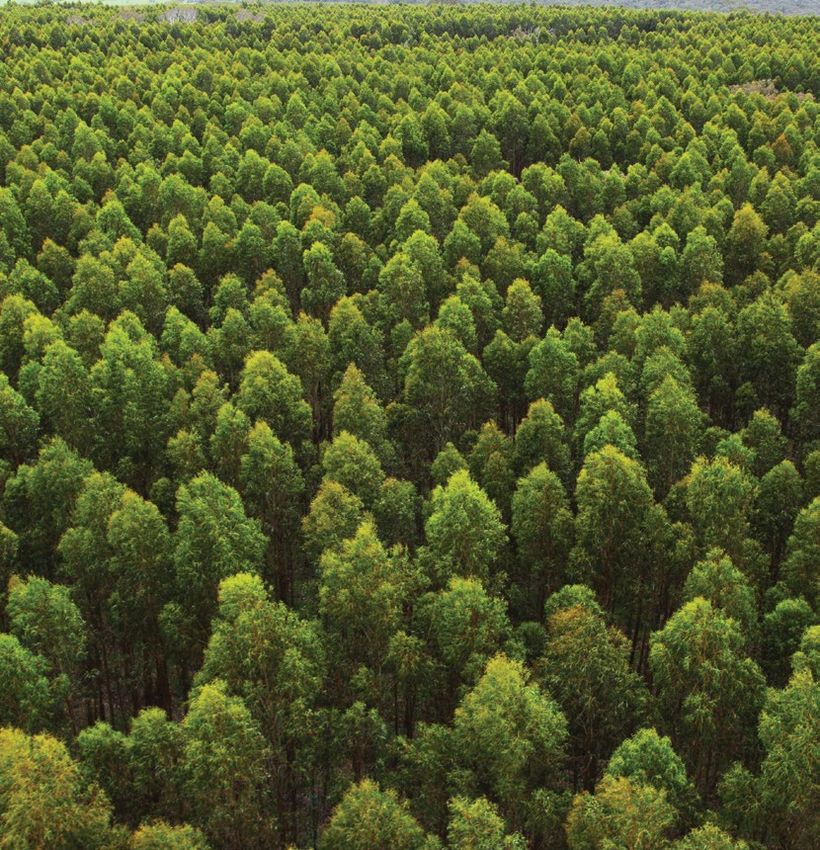
Forestry –
The Growing
Asset Class
Institutional investment in forestry is now a USD 100 billion industry.
Investors acquire timberland to generate returns from a combination of
harvest income and long-term capital appreciation. Timberland has been an
attractive asset class for institutional investors due to favourable portfolio
attributes including low correlation to other asset classes, natural inflation
hedging, and low volatility of returns. Assets can also be managed on an
environmentally and socially sustainable basis, which is of interest to the
growing responsible investment community.
New Forests produces the Timberland Investment Outlook every two years.
The 2015 Timberland Investment Outlook seeks to provide readers with a
fresh perspective on the upcoming opportunities, strategies, and challenges
facing institutional investors in forestry. Most of the major trends identified in
earlier editions of the Timberland Investment Outlook remain. An overarching
trend that has continued over the last two years is the growing portfolio
allocation to real assets by institutional investors, which drives demand for
forestry assets.
New Forests believes that as institutional ownership of forestry assets
increases, access to primary asset sales (e.g. government privatisations,
corporate sales, and consolidation of small private forest holdings) will
decline and there will be more secondary transactions among and between
TIMOs and REITs, more internationalisation of the asset class, and more
direct investment by large institutional investors seeking to minimise
transaction and management costs in maturing markets. This will also
push TIMOs to expand into new geographies and markets, as well as to
seek out value-adding investment strategies and management approaches
to generate better returns. We explore some of these opportunities in this
Outlook, including emerging markets, the bio-economy, new technologies,
and conservation finance. The Timberland Investment Outlook also reviews
global timber production and trade, recent transactions, and market
conditions. We welcome your review and feedback on our 2015 Timberland
Investment Outlook and hope this publication spurs fruitful debate around the
opportunities for the further expansion of the forestry asset class.

Timberland Investment Outlook 2015-2019

Timberland
Investment
Update
While timberland investment has been growing steadily since
the first transactions by institutional investors took place in the
1980s, the sector is now further buoyed by rising institutional
interest in alternatives to traditional financial assets such as
equities and fixed income. Investment in what are known as
real assets—such as forestry, agriculture, infrastructure, and
real estate—is growing. In this section, we review key trends
underpinning rising interest in timberland investment, the
diversification of the asset class in terms of geography and
investment structures, and how investment managers are
responding to the market.

Timberland Investment Outlook 2015-2019
Real Assets on the Rise
Real assets are set to ride the trend of increasing investments in alternative assets, an investment
category that includes a range of non-traditional financial assets, such as hedge funds, private
equity, commodities, and real assets. Investment in alternatives has grown at double the rate
of traditional financial investments since 2005—contributing to a total doubling of assets under
management (AUM) in alternatives and reaching an all-time high at USD 7.2 trillion as of 2013.2
The alternatives market is expected to grow at an average annual pace of 5% over the next five
years, and larger, sophisticated investors may look to investments in illiquid alternatives where
they can seek illiquidity premiums and be exposed to beta-driven strategies.3 It has been reported
that two-thirds of institutional investors who manage at least USD 2 billion plan to increase
allocations to real assets and that individual portfolio allocations to real assets would grow to
20% over the next two decades.4
New Forests’ own experience has been a steady to increasing appetite from our clients for more
timberland investment. We have seen our clients—typically large public and private pension
funds in Europe, Australia, and North America—invest increasingly into forestry, agriculture,
infrastructure, energy, and real estate. New Forests recently asked 30 of our clients about their
real asset allocations, which suggested large institutional investors were now targeting portfolio
allocations of around 10-15% for real assets.

The driving force behind the real assets trend is a confluence of factors
including record-low interest rates in many economies, falling yields
in traditional asset classes, more sophisticated portfolio allocation
policies, and the ever-increasing track record of returns from real
assets like forestry.

Since the global financial crisis of 2008, investors have seen a decline in interest rates as monetary
policy in key regions has sought to support growth amid difficult global financial conditions. This
has diminished investors’ capacity to earn strong, non-volatile returns. While yield has fallen
and the outlook for growth has declined, demand for low-risk and income-producing assets has
increased. The growing number of pensioners in the aging societies of OECD countries has created
more demand for stable sources of income. Many institutional portfolios within the pension or
defined-benefit sector are facing long-term liabilities but are also significantly underfunded, as
expected returns from traditional asset allocations fall short of rising liability requirements. This
asset-liability mismatch has led to financial strain and a boost in demand for longer-term real
asset investments. There is a view that long-term institutional investors can gain an illiquidity
premium by holding real assets. Real assets may offer defensive characteristics in a recessionary
climate due to their long investment horizons and generally predictable cash flows. Real assets
display a low correlation against other traditional asset classes and can offer a natural hedge
against inflation. In the case of timber, value is derived in large part from biological growth, so the
asset is naturally appreciating in value over time.
Also driving interest in real assets are longer-term concerns about climate change, population
growth, resource scarcity, and food security. Growing populations mean more demand for housing,
furniture, food, and fibre, all of which are likely to translate into greater demand for timber and
agricultural products. The growing environmental crisis and climate change will force societies
to deliver technological solutions around energy and resource use. As a response, institutional
investors are seeking to invest in real assets that have long-term exposure to these trends, in some
cases to position their portfolios to not only manage future risk but also to invest in assets that can
provide sustainability solutions.5

                                                                                                      6
Investor Appetite for Timberland
Timberland exemplifies real asset investment characteristics. Analysis shows that the asset
class can provide a hedge against inflation, has low correlation with other assets, and has better
risk-adjusted returns compared to other assets. In a 2014 survey of timberland investors, KPMG
found that 85% of participants anticipated being net buyers in 2014, and 72% anticipated making
significant timberland acquisitions in the next 12 months.6 This sentiment is supported by a recent
survey of New Forests’ clients in which we asked what role timber played in constructing their real
asset portfolios. The primary reason identified for investing in timberland is the attractive risk-
return profile, followed by inflation hedging characteristics of the asset class.
In addition to the portfolio considerations above, our clients noted that the sustainability of the
asset class was also an important driver of interest in forestry investments. Our clients were not
only interested in assets achieving third-party forest certification but also in understanding the net
positive environmental and social impacts of the forestry assets in which they have invested.
The majority of our clients indicated that they would invest more in timberland over the next one to
two years with a few noting they would opportunistically invest. Most of our clients have timberland
allocations at 1-3% of their overall portfolios with a few targeting 3-8%.

             Figure 1: Primary Purpose of Timberland in Portfolio
                                                      Opportunistic
                   Commodity
                   Exposure                                                    Inflation
                                                                               Protection

     Risk-Return Profile
     and Low Correlation

                          Source: New Forests data, January 2015. Chart shows number
                                   of responses with one response per client.

Investible Universe of Timberland Assets
Today, 30 years after the first investments were made in the United States, institutional timberland
investment has reached the USD 100 billion mark. From the 1990s and into the mid-2000s,
institutional timberland investment took root in the US forest sector as vertically-integrated
companies sold down assets to TIMOs, real estate investment trusts (REITs) came to prominence,
and institutional buyers found that timberland offered portfolio diversification alongside returns
with low volatility. In North America today TIMOs manage nearly 11 million hectares of forests and
REITs manage a further 7 million hectares.7
Timberland has grown steadily as an asset class since the turn of the millennium—the value of
assets under management by TIMOs has doubled in the past ten years. Around USD 35 billion
is held by timberland REITs today with another USD 65 billion invested through TIMOs or held in
direct investments by large institutions. This totals around USD 100 billion of current investment

                                                                                                     7
while New Forests estimates the total intermediate forestry markets, such as those
timberland investment universe at around USD of Europe, Latin America, Asia, and Africa. In
190-200 billion (see Figure 2), based on the Europe, growth potential may be found in the
area and value of potential assets suitable for consolidation of private landholdings and by
institutional investor ownership, i.e. investible efforts to address scale and market barriers
assets. Other estimates of the timberland that may hamper large investments. In Latin
investment universe may range much higher, America, there has already been significant
depending on the boundaries. In our view, the institutional investment in Brazil, Chile, and
possible investment universe has increased Uruguay, and expansion may come from
in value moderately over the past two years, investment in more emergent markets such
primarily as a result of higher prices being as Colombia and through joint ventures by
paid per hectare in the US and New Zealand. institutional investors with local corporate and
New Forests suggests that roughly half the financial owners. Asia and Africa offer investors
possible timberland investment universe is in the potential to support a transition out of
the US, with the remaining half across the rest poorly managed natural forest exploitation
of the world. to a sustainable plantation-based industry.
New Forests’ experience in Asia is that most
To get from USD 100 billion already invested opportunities are related to buying assets
to the larger universe suggested above, from other foreign owners; entering into joint
institutional ownership of forests will have to venture partnerships with local corporate
expand through the further privatisation of and government owners; and establishing
government assets, exit by corporate owners greenfield developments where land is
from their forestry holdings, consolidation available and relatively inexpensive. However,
of smaller private forest holdings, and the investment environments in some areas
development of new plantations. of Latin America as well as in the developing
A significant proportion of the high-quality economies of Asia and Africa present additional
timberland estates in the US, Australia, challenges for managing environmental, social,
and New Zealand is already in institutional corporate governance, and other risks. For this
ownership, and these countries represent the reason, emerging forestry markets must meet
most mature forestry investment regions. investor risk-adjusted returns that are as much
as two to three times the returns sought for US
Much of the expansion in the asset class forestry investments.
is expected to come from emerging and
Figure 2 - Timberland Investment Universe by Region (USD Billion)
South Africa $3
United States $100 Southeast Asia $5
Canada $7
Australia $8
New Zealand $14
Other Latin
America $20
Brazil $35
Source: New Forests data, June 2015. NB: Does not include Europe.
8Forestry Funds, Direct Investments, and REITS
Institutional investors have several options for timberland investment types and structures.
These options include subscribing to commingled funds, pursuing direct investments or separate
accounts, and investing in timberland REITs. As noted in our 2013 Timberland Investment Outlook,
New Forests has seen a push by some of the largest institutional investors to pursue direct
investments, which aligns with a trend toward internal management of assets and efforts to reduce
fees. This sentiment is also reflected in the rising interest in co-investment opportunities. Overall,
however, few institutional investors have in-house timberland investment experts, and most
continue to lack the scale and capacity to undertake direct investments in timberland. Therefore,
the majority of investors must rely on structures offered by external managers. Most externally
managed timberland investments are managed by TIMOs, while some large general asset
managers may include forestry investments as part of broader real assets or combined forestry
and agriculture mandates.
Figure 3 - Top 10 TIMOs by AUM
TIMO Value Area Headquarters
(B USD) (M Hectares)
Hancock Timber Resource Group 11.7 2.6 USA
Campbell Global 6.7 1.3 USA
Resource Management Services 4.5 1.1 USA
Forest Investment Associates 4.2 1 USA
Brookfield Timberlands Management 4 1.5 Canada
Global Forest Partners 3.4 0.5 USA
BTG Pactual 3 0.8 Bazil
The Forestland Group 2.4 1.5 USA
New Forests 2.1 0.6 Australia
GMO Renewable Resources 1.8 0.5 USA
Source: RISI 2014 and New Forests June 2015 data.
The other significant buyer of US corporate timberlands has been REITs. Today’s timber REIT
marketplace is largely consolidated into four publicly traded companies, with market capitalisation
of just over USD 28 billion.8 Generally speaking, REITs seek to create value through maximising
operating revenues and by consolidating higher-quality portfolios, which means selling off non-
core or less strategic assets and improving cash yield efficiency in the portfolio. With the slowdown
in US timber markets following the global financial crisis and an extended downturn in US
homebuilding, both asset values and turnover were low in 2009-2010. However, with low interest
rates timberland asset values have recovered. The Forisk Timber REIT Index reported returns of
5.71% for 2014; including dividends the total returns were 9.94%.9 In the near term the expectation
is that timber REIT performance may be boosted by the US housing recovery. However, a rising US
interest rate may create volatility of returns as REITs come under pressure to improve cash yield.
Timberland Investment Outlook 2015-2019TIMOs Are Consolidating and Diversifying Geographically
Over the past decade, TIMOs’ AUM have more than tripled from around USD 15 billion in 2005 to
at least USD 47 billion by 2014.10 Reports on total AUM by TIMOs vary among sources, with
US-based investment consultant TimberLink LLC tracking 22 TIMOs with AUM of USD 48 billion
at 2014 year-end and RISI documenting USD 57 billion in AUM by the 30 largest TIMOs.11 At this
scale, TIMOs appear to currently manage around one-quarter to one-third of the potential pool of
industrial timberland and plantations.
Figure 4 - Growth in TIMO AUM 2005-2014
50
45
40
35
Billion USD
30
25
20
15
10
5
0
2006
2009
2008
2005
2007
2010
2014
2013
2012
2011
Source: TimberLink LLC.
With the vast majority of TIMOs having originated in the United States and invested in US
timberland assets, timber investments in South America have been a natural next step for
many managers seeking to expand. TIMOs now manage more than 1.3 million hectares in Latin
America, while the region remains dominated by privately-held and listed companies that account
for more than 6 million hectares.12 As TIMOs face challenges in expanding significantly in the
Americas, some managers have been growing through buyouts of competitors. In 2012, the Molpus
Woodlands Group and Hancock Timber Resource Group purchased the 1.88 million acre timberland
portfolio of Forest Capital Partners and split the assets between them.13 In some cases, mergers
and acquisitions have led to the combination of separate geographic investment portfolios into
complementary companies with broader range. For example, the 2013 acquisition of Regions
Timberland Group by BTG Pactual saw one of the US South’s largest timber managers purchased
by a Brazilian asset manager with an existing portfolio focused in South America.14
Figure 5 - Global Private Forest Investment Ownership in 2014
Australia & New Zealand
North America
Latin America
Europe
Asia
Africa
0 1 2 3 4 5 6 7 8 9 10 11 12
Million Hectares
TIMO REIT/Other
Source: RISI International Timberland Ownership and Investment Database, 2014.
10Secondly, well established TIMOs that are already diversified within North America are in some
cases acquiring, or seeking to acquire, entry assets in Latin America, Australia, and New Zealand.
Several TIMOs have entered new regional markets through single acquisitions, typically on a
separate account basis, followed by offering commingled funds that are either global or targeting
expanded geographies. In the case of New Forests, we established our business in Australia and
New Zealand and have expanded into a broader Asia-Pacific region with our Tropical Asia Forest
Fund, which was closed in 2013. Also in 2013, large asset manager Brookfield – with significant
holdings in both South and North America – set the stage with a USD 1 billion global fund. This
was followed by American TIMOs that had previously dipped their toes in international waters with
individual investments or smaller global funds making more concerted efforts to take larger global
positions. In 2015, the US-based Campbell Global announced an expansion into new markets with a
global fund that will invest in Latin America and Australasia.15 As another example, RMS announced
in 2015 it will be marketing its second international fund, targeting up to USD 500 million while also
offering a separate US-only fund.16 As Figure 6 shows, the largest TIMOs are now diversified across
several regions or at least seeking to acquire assets in more regions.
Figure 6 - TIMO Diversification: Number of Top 30
TIMOs Operating by Investment Region
Africa 2
Asia 7
Europe 7
Australia and New Zealand 8
Latin America 13
North America 22
Source: RISI 2014 and New Forests June 2015 data. N.B.: Shows the number of TIMOs operating in each region, with most
TIMOs operating in more than one region. Includes data for the 30 largest TIMOs globally.
Timberland Market Trends
In our 2013 Timberland Investment Outlook, New Forests reported on how the nature of timberland
returns is changing. We predicted that declining discount rates, mainstreaming of secondary
revenues, and the search for higher returns outside the US would continue to push timberland
investors to seek new opportunities in a maturing asset class. These conditions remain largely in
place, and the drive for attractive forestry investment opportunities is only stronger in light of the
current economic environment. As Figure 7 shows, the annual area of timberland transactions
Timberland Investment Outlook 2015-2019has not yet recovered from a peak in 2006. Over the past five years, annual total global timberland
transactions have averaged about 1.4 million hectares per year. However, as investors feed the
drive for new acquisitions, the proportion of transactions occurring outside the US has increased
dramatically. From 2010 to 2014, the average proportion of timberland transactions occurring
outside the US averaged 39% per year (by area), compared to only 20% from 2000 to 2010.17
Figure 7 - Timberland Transactions in the
United States and Internationally
4.5
4.0
Million Hectares
3.5
3.0
2.5
2.0
1.5
1.0
0.5
0.0
2004
2006
2009
2008
2003
2005
2007
2010
2014
2013
2012
2011
United States International (outside United States)
Source: New Forests’ analysis of RISI data.
New Forests expects transaction volume to continue to rebound. The recovery in asset prices
will support a decision by investors to exit from investments made between 2000 and 2010. While
timberland markets remain relatively opaque, the US market has by far the greatest availability
of transaction and returns data by which to measure the asset class. US timberland transactions
totalled USD 2.6 billion in 2014.18 In 2014, the National Council of Real Estate Investment
Fiduciaries (NCREIF) also reported total returns for its US private timberlands index of 10.48%.
This marked four years of improved returns.19
Rising Competition and the Outlook for Discount Rates
There is ongoing evidence that discount rates are in a downward trend in all heavily traded
timberland regions, led by discount rate compression in the US. Discount rates vary by region,
in line with differences in sovereign, market, physical, and other risks. KPMG’s 2014 annual
timberland investor survey found that almost 60% of US timberland investors were applying
real discount rates of 5-6% (down from expectations of 6-8% discount rates in 2012).20 However,
the survey suggests the downward trend may not continue, with more than half of respondents
expecting real discount rates to stay stable over the next two to three years.21 Anecdotal evidence
suggests that actual transactions are occurring at real discount rates as low as 4% in the US South,
suggesting investor demand is exceeding asset supply.
In Australia and New Zealand, New Forests has found strong transaction evidence of downward
pressure on discount rates in both softwood and hardwood assets. While Australian hardwood
assets had previously traded at higher discount rates to softwood assets—reflecting distress in
the now defunct managed investment scheme (MIS) industry—discount rates have declined as
all major forestry MIS assets have been sold out of receivership and the market has stabilised.
In some cases, New Zealand pine assets are selling at implied discount rates of around 5-6%,
which is in line with return expectations for similar softwood assets in the US Pacific Northwest.
12Given that the New Zealand and Australia timberland market is now maturing with more active
investment managers competing on deals, there may be continued pressure on investors to
keep discount rates low to secure assets. It could also be argued that discount rates in Australia
and New Zealand may converge with those in the US market given the comparable political and
business risk environment, higher tree growth rates, and exposure to the important Asian markets.
In Latin America the most established plantation growing areas such as Chile, Uruguay, and parts
of Brazil are now transacting at real discount rates of around 7-10%. Discount rates in the region
are considerably lower than a decade ago as the market has gained experience with investment
in plantations. Chile can now be considered a mature forestry market similar to Australia or
New Zealand, with a significant plantation base and some initial transactions occurring between
domestic corporate owners and institutional investors. Elsewhere in Latin America, in countries
with less mature or developed forestry plantation infrastructure and markets, discount rates are
more on par with those found in other emerging markets.
Asia and Africa still represent the most emerging edge of forestry investment. There is little
institutional investment in forests in either region. Both regions have relatively high discount rates,
with real discount rates in Indonesia and Malaysia for example ranging from 9-15%. It is important
to note that the discount rates applied by institutional forestry investors are also different from
the cost of capital associated with forestry investment by other entities. Domestic or regionally-
based corporations may apply a lower discount rate to projects in their home region or have
access to debt finance at a much lower cost than foreign equity investment. As forestry investment
matures in emerging markets, we may begin to see a convergence of the discount rates applied by
institutional investors with the cost of capital available to local forestry companies.
Seeking Value beyond Timber
In the 2013 Timberland Investment Outlook, New Forests noted that growing competition for deals
has intensified the need for managers to further enhance secondary revenues to augment core
timber value. Revenue streams from highest and best use (HBU) sales strategies, recreational use
of timberland, sale of conservation easements, and environmental markets are now commonplace
across timberland portfolios. These upside opportunities are increasingly being realised in large
scale transactions. For example, in late 2014 Plum Creek agreed to sell approximately 165,000
acres of forestland in Montana and Washington to The Nature Conservancy (TNC), enabling TNC
to meet conservation objectives and Plum Creek to sell off less productive timberlands that
had higher value in ecological and recreational use. In Australia and New Zealand timberland
managers must carefully balance HBU in the context of plantation estate rationalisation and
competing land use. Some of New Zealand’s most high-quality plantation timberlands have been
reverted to dairy farming as part of the country’s dairy boom. In Australia as much as 400,000
hectares, or around 40%, of the country’s eucalyptus plantations, are expected to be reverted to
agriculture rather than be re-established to timber plantations after harvest.
In the US where HBU strategies have become mainstream sources of secondary revenues, TIMOs
are now pushing the boundaries to seek more value beyond timber. For example, timberland
owners that can create strategic partnerships with conservation organisations can benefit from
expertise in conservation management and potentially greater access to grant funding and novel
sources of finance to support asset management. In addition, there is also growing in-house
capacity within TIMOs in areas such as payments for ecosystem services, bioenergy markets, and
application of new technologies. New Forests expects to see more specialist investment managers
targeting assets that meet requirements for multiple revenue streams in the coming years. This
is supported by a spate of recent large-scale combined conservation and timber transactions and
the emergence of specialist consultancies as well as the mainstreaming of secondary revenues in
traditional timberland investment strategies.
13Timber Market Update Forestry asset value is largely driven by tree growth rate and the value of timber products, and so investors must understand how changing patterns of global timber consumption intersect with shifting production of timber products from the world’s forests. Global timber demand is increasing, supported by a rising world population, increasing per capita consumption especially in Asia, and traditional and new timber uses that make wood an increasingly important raw material. Nowhere is this more prevalent than in Asia, with China continuing to require increasing volumes of imported timber. China’s growth is slowing – but still positive – and timber markets are responding to this sustained appetite. In this timber market update, we focus on some of the key trends in place since our 2013 outlook was published.
Key timber
                                          market trends
                                          since our last
                                          Timberland
                                          Investment
                                          Outlook
                                          • Softwood demand in China remains strong,
                                          but substantial changes in underlying
                                          currency exchange rates have reduced
                                          the competitiveness of US log exports and
                                          supported increasing market share for
                                          New Zealand, which is now the largest log
                                          exporter to China, as well as other countries
                                          like Australia.
                                          • The US housing market has not recovered
                                          as strongly as expected, and there remains
                                          substantial excess softwood timber supply in
                                          both the US South and Europe.
                                          • China and Japan continue to dominate
                                          hardwood chip demand. China has surpassed
                                          Japan as the leading hardwood chip importer.
                                          Combined China and Japan import volumes of
                                          both softwood and hardwood chips increased
                                          in 2014. Vietnam became the largest hardwood
                                          chip exporter, but appears to have peaked and
                                          future supply may be restricted by policies
                                          seeking to encourage domestic processing.
                                          • Pulp and paper markets continue to evolve
                                          with newsprint, printing, and writing papers
                                          declining, but packaging, tissues, and other
                                          biomaterials rising.

Timberland Investment Outlook 2015-2019
China as a Magnet for Global Softwood Trade
The volume of both softwood logs and lumber imported by China ended at all-time highs in 2014.
This included nearly USD 12 billion of logs, representing 51.4 million cubic metres and an increase
of 26% by value and 14% by volume from 2013. Of this, softwood logs represented 70% of 2014 log
imports by volume.22 Over the past decade, China’s imports of logs have increased at a compound
annual growth rate of 4.5%, while imports of lumber increased by an average of 21% annually.23 The
main driver of softwood log consumption in China has been the growth in the real estate market,
underpinned by population growth, rural to urban migration, and speculation in the property
market.24 Although there was a 9.3% drop from 2013, investment in real estate in 2014 totalled
RMB 9.5 trillion (USD 1.5 trillion) and has had an average growth rate of 24.6% since 2000.25 The
tremendous rate of development means that even with some slowdown in the Chinese economy
and residential construction, timber consumption is still growing at an impressive rate.
Chinese Real Estate Development and Softwood Demand
China’s softwood timber demand is supported by the country’s construction market, with
residential housing growing around the country’s many urban centres. It has been estimated that
70-80% of imported softwood log and lumber is used in the construction market,26 which means
the trade to China is closely tied to levels of construction.
Figure 8 - China Softwood Imports and Real Estate Sales
1.5 60
Softwood Imports
Real Estate Sales
50
1.0
Billion m2
40
Billion m2
30
0.5 20
10
0.0 0
2000
2004
2006
2008
2002
2010
2014
2012
Real Estate Sales Softwood Imports
Source: National Bureau of Statistics of China and AgriHQ. March 2015.
Softwood log and lumber imports tend to be cyclical and move in tandem with real estate
development. Real estate development slowed in 2014 with a rate of growth of 9.9% (real) in 2014,
9.3% lower than in 2013.27 Government policies directed at the real estate development industry are
being gradually loosened to try to prevent a housing market collapse. Early indicators suggest this
has been effective. The IMF expects China’s real estate market to remain soft in 2015 before
slowly recovering.28 This suggests potential softness in softwood imports over the short term,
but the long-term outlook remains strong due to supply-demand fundamentals in the global
softwood market.
Rising Softwood Imports to China
China’s increasing timber consumption has led to growing demand for imports over the past
decade, with the value of imported logs more than doubling from USD 2.2 billion in 2009 to USD
5.4 billion in 2014.29 Over the past five years, log volumes arriving at Chinese ports have almost
doubled and the source of logs has diversified greatly with softwood log imports to China in
2014 supplied by 45 countries. As recently as 2009, logs from New Zealand, Russia, and the US
accounted for 93% of all softwood logs imported to China, but by 2014 these former “big three”
accounted for only 76% of the market.30 This represents a smaller share of a growing market,
16although overall volumes traded continue to be strong. Some of the major dynamics accounting for
these changes include:
• As a result of a reduction in supply from traditional sources like Russia, together with a sharp
increase in domestic softwood use for construction, China’s imports of New Zealand softwood
increased from 1.2 million m3 in 2007 to 11.6 million m3 in 2014.31 New Zealand has now become
the largest softwood log supplier to the Chinese market.
• A slower rate of recovery in the US housing market, resulting in greater capacity to export logs
and lumber to growing Asian markets. US softwood log exports to China are up from just 100,000
m3 to 5.5 million m3 between 2007 and 2014. Canada’s logs exports grew from 110,000 m3 to just
over 3.0 million m3 over the same period.32
• As US dollar strength has reduced the competitiveness of US softwood exports, countries like
Australia and New Zealand with declining currencies are diverting softwood supply to export
markets and are increasing sales in response to Chinese demand.
In 2014, New Zealand was the largest supplier of softwood logs to China, accounting for 32% of
supply, followed by Russia (28%), the US (15%), Canada (8%) and Australia (6%).33
Figure 9 - Growing China Softwood Log Imports
36
32 Other
Australia
28
Canada
Million Cubic Metres
24 US
New Zealand
20
Russia
16
12
8
4
0
2000
2004
2006
2009
2008
2003
2005
2002
2007
2001
2010
2014
2013
2012
2011
Source: RISI, April 2015.
US dollar strength has reduced the competitiveness of US log exports and has supported an
increasing market share for New Zealand and Australia. The US dollar index rose by 9% in value
in 201434 and is likely to remain strong in 2015. Positive US macroeconomic data such as low
inflation, lower energy costs, and an improving job market helped the US dollar rise against other
major currencies in 2014.35 Through 2015 a relaxation of quantitative easing and a subsequent
increase in interest rates is likely to provide further US dollar support.36 A rising US dollar reduces
the competitiveness of US exports, including logs and lumber, on global markets. Since 2012
the spread between prices for Russian and New Zealand logs and North American logs has
been widening. As US prices continue to rise, not only do other supply sources become more
competitive, but there is an incentive for previously marginal sources, such as Australia and
Ukraine, to increase their supply.
17US Housing Market Shows up with demand, the region relies heavily on
Modest Recovery imports.
The US housing market has suffered its most
significant and prolonged downturn in more Woodchip Trade
than 60 years, as shown by low levels of The Pacific Rim woodchip trade comprises
housing starts over the past seven years.37 As 90-95% of the global market and is
housing starts continue to recover, US demand primarily a hardwood chip market supplying
for softwood lumber is expected to pick up; Asian demand hubs. The largest net
however, the pace of recovery is slower than hardwood chip exporting region is the Asia
most had anticipated. Pacific, with approximately 60% market
At the time of our last Timberland Investment share.43 Vietnam has emerged as the top
Outlook in 2013, the “super-cycle” theory global hardwood chip exporter, having
led to forecasts for a sustained period of surpassed Australia, although there is
elevated softwood prices. This expectation now evidence that Vietnam’s exports have
was supported by predictions that US housing peaked, with a fall in exports in 2014.44
would recover strongly in the 2015-17 period This supply peak is due to the country
and reach 1.5 to 1.7 million units. Over the having rapidly logged much of its available
last two years, US housing starts have slowly production forest, the impact of two major
gained momentum but have not accelerated cyclones, and a slowing in new plantation
to the extent needed to validate the super- establishment. A government policy to limit
cycle theory. In 2014, housing starts reached woodchip exports from Vietnam is another
1.1 million,38 up around halfway from the major factor expected to curb Vietnamese
bottom of about 550,000 but still well short of supply. This suggests that high volumes
expectations. The outlook for a full housing exported by Vietnam in 2013 and 2014 may
recovery to long-run levels of around 1.5 million not be sustainable in the future.
units has now been pushed out to 2018-20. At the same time, Australian exports are
While the potential exists for cyclical peaks in back on the rise since 2014, supported by a
log and lumber demand and prices if housing combination of factors, including favourable
starts pick up, the more likely scenario is muted currency movements, new larger woodchip
in the near term.39 vessels, and the maturing of almost 1
Globally, the outlook for softwood prices million hectares of plantations established
suggests room for upward movement from in the late 1990s and early 2000s. With the
2016-2020. Combined with strong Chinese Australian dollar having fallen more than
demand, there is an anticipated tightening 25% against the USD since a peak of AUD
of the market on forecasts that Canadian 1.10 in 2011, Australian woodchip exporters
production will decrease. Although Canadian have benefitted from increased profits in
timber harvest has risen each year between local currency terms.
2009 and 2014,40 production is expected to
peak in 2017 and then permanently decline as
a consequence of the impact of the Mountain
Pine Beetle infestation and increased policy
constraints reducing harvests by around 40%
from 1990 highs by 2020.41
Pulp and Paper Driving Strong
Trade Flows
Over the last decade, global trade in woodchips
has increased steadily, reaching highs of close
to 24 million tonnes in 2014.42 The bulk of this
consumption has come from Asia, with the
two largest woodchip importers being Japan
and China. Asia’s position as a significant net
importer of woodchips is consistent with the
large amount of pulp and paper capacity that
has been built in the region, most recently in
China. As Asia’s forest resources cannot keep
18Woodchip exports from New Forests’ Australian estate, which accounts
for roughly 40% of the country’s hardwood plantations, are forecast
to increase from approximately 350,000 BDMT in 2014 to 1.5-2 million
BDMT by 2017. 45
Figure 10 - Top Global Hardwood Chip Suppliers
8
7
6
Million BDMT
5
4
3
2
1
-
Vietnam Australia Chile Thailand Indonesia South Brazil Malaysia New
Africa Zealand
2012 2013 2014
Source: RISI Monthly Woodchip Trade Review, December 2014.
Pulp Production
Pulp production is an important segment of the global forest products industry, with some 173
million tonnes produced annually on average over the past decade.46 Global pulp market demand is
expected to grow 1.5% in 2015 and 2.0% in 2016.47 The price of wood pulp is forecast to increase at
an annualised (real) rate of 1% between 2014 and 2017, driven by a worldwide increase in demand
for paper-based packaging resulting from rising wealth in Asia.48 The growth of internet-based
e-commerce has been a significant part of this trend, spurring the need for paper-based
packaging such as boxes and packaging papers used both in shipping and product packaging.49
Population growth is also driving demand for packaging of essential goods such as processed
food products, toiletries, and other consumer items.50 However, an increase in the value of the US
dollar relative to the euro and other major pulp-trading currencies so far in 2015 could adversely
affect pulp forecasts.
Timberland Investment Outlook 2015-2019Figure 11 - Top 5 Global Importers and Exporters of Pulp
South Korea
Italy
Germany
United States
China
Indonesia
Chile
United States
Canada
Brazil
-20 -15 -10 -5 0 5 10 15
Million Cubic Metres
Pulp Importers Pulp Exporters
Source: New Forests’ analysis of FAOstat data. Chart shows 2013 values.
As Figure 12 shows, per capita consumption of paper-based products in developing countries like
China and India is far below that of developed nations, indicating significant potential for growth.
China is expected to account for one-third of global paper demand by 2019.51 At present, per capita
Indian paper and paperboard consumption is still very low, at less than 10 kg per person. This rate
of consumption is comparable to that of China in the late 1980s and is only a fraction of China’s
current per capita consumption of more than 75 kg per person.52
Figure 12 - GDP and Paper and Paperboard
Consumption per Capita
GDP per Capita (’000 USD)
70
Australia
60 USA
50
40
Japan
30
20
10 China
India
0
0 50 100 150 200 250
Paper and Paperboard Consumption per Capita (kilograms)
Source: New Forests analysis World Bank data and FAOstat data.
Chart shows 2013 data.
Timberland Investment Outlook 2015-2019Small Log and Pulp Log production and processing in the country
Processing in Asia are constrained by access to credit and
infrastructure. Forest productivity is low, with
Since 2013 there has been a distinct upturn in
a vast network of farm forests servicing small,
small log and pulp log trade throughout the
regionally based mills.53
Asia-Pacific region. New Forests has observed
this with small diameter logs from Australia The Indian pulp and paper industry is dominated
and New Zealand being exported to China and by small-scale producers and is in the process
India, as well as Malaysian logs being shipped of building a more efficient and effective fibre
to India. The first shipments of softwood logs supply through farm forestry programs. This
from New Forests’ Australian pine assets involves amalgamating tens of thousands
commenced in late 2013. While volumes of individual landowners to ensure a flow of
have dropped off slightly as of early 2015, we pulpwood supply. Despite this initiative, India
believe additional processing capacity for small faces an ever-widening gap between domestic
diameter logs in China and India may provide wood resources and demand. Timber supply
an ongoing opportunity to realise value, with from these farm forestry plantations is expected
plantation thinning operations increasingly to increase rapidly, with most companies
producing small logs for export markets. sourcing at least 75%, if not all of their wood
Similarly, in 2013 New Forests’ Malaysian fibre from these plantations.54 However, this
plantation asset began exporting acacia logs to local supply is not yet sufficient to meet market
India. We believe this sale was among the first demand and the industry is dependent on
shipments of Malaysian plantation logs to India pulp log imports.55 India presents a potential
and provides an alternative market to domestic opportunity for the forest products industries
pulpwood markets. elsewhere in Asia as well as Australia. In many
cases, the pulp facilities are designed for intake
of pulp logs, and so India represents a log trade
China rather than woodchip trade opportunity.
China suffers a chronic timber deficit despite
ongoing attempts to implement policies that
will increase both production forests and
conservation areas. At present, the plantation
forestry base of China is characterised by young
forests, which produce relatively low volumes of
timber. The domestic industry is dependent on
manual labour in many cases, which reinforces
the need to produce small logs. These
combined factors of labour and timber supply
have led to a domestic processing sector that
is organised around small log processing. The
country’s extensive eucalypt resource is used
for pulp production but can also be peeled for
panels or used as sawn wood. Growers tend to
focus on the shortest possible rotation, so very
little of the plantation resource in China is
being managed in longer rotations to produce
higher-quality and large-diameter timber. As a
result, there has been a proliferation of small-
scale eucalypt veneer mills processing young
(i.e. less than five or six year old)
small-diameter logs.
India
While the Indian market is expected to
experience a slower rate of growth than China,
this growth will nevertheless be sustained
for many years. India has a large and growing
population but has relatively scarce forest
resources to service this population. Timber
21Bio-economy Update
The Emerging Bio-economy
There is a rising bio-economy that offers new and potentially expanded markets for timber as a
renewable input to many innovative and value-added products. These products now range from
the significant wood pellet industry—which continues to apply technological advances to improve
calorific load and efficiency in transport and use—to applications that were undreamt of even
years ago across the energy sector, pharmaceuticals, construction, packaging, and consumer
goods. New Forests anticipates the bio-economy will continue to grow, driven by the demand for
renewable fibres and a shift away from fossil-fuel based energy and materials. While the emerging
bio-economy is still in its early stages, there are promising technological advancements that are
beginning to influence timber markets, which we discuss in the following subsections. Over the
next five to ten years we anticipate key developments in the bio-economy will remain linked to more
established bioenergy, dissolving pulp, and fluff pulp applications. Opportunities from more recent
developments, such as nano-cellulose and new multi-story timber construction techniques, are
likely to grow steadily off a relatively small base, but over time we expect these new innovations to
gain scale and offer potential for increases in timber demand.
It is worth noting that there has been considerable debate about the sustainability and
environmental impacts of bioenergy and biofuels, which may affect the overall viability and success
of wood as a major feedstock for renewable energy. A primary concern is the origin of source
material, including factors such as whether the harvest is legal, provides for a sustained yield,
and includes material from native forests. A related issue is the risk of creating incentives for
increased harvest or land grabbing, which could increase the rate of deforestation in some areas
or lead to expansion of bio-crop plantations into areas not currently under timber production.
Furthermore, there are concerns about ensuring the climate neutrality of bioenergy and biofuels.
Theoretically, bioenergy combustion is carbon neutral, provided that all the biomass used for
energy is replaced by an equivalent amount of new vegetation that re-absorbs the C02 emitted as
a closed cycle. However, many bioenergy processes and biofuels are inefficient, which can lead
to short-term increases in emissions as well as associated air pollution. For this reason the total
life cycle assessment of the feedstock should be considered as well as factors such as processing
and transportation that may contribute to overall greenhouse gas emissions in the supply chain.
Generally speaking, these concerns can be addressed through incorporating sustainability criteria
into renewable energy policies, as has been done for biofuel feedstock in the European Union.56
When using timber as a biomass input it must be sourced from responsibly managed forests
in order to meet high environmental standards. The bio-economy can expect opposition if it
depends on the use of illegal and/or irresponsibly harvested timber products that further drive
deforestation and the loss of ecosystem services. On the other hand, if developed on a sustainable
basis, the bio-economy is poised to be a major source of renewable materials and a significant
benefit to certified timber producers that can meet both regulatory and consumer demand for
sustainable feedstock.
Timberland Investment Outlook 2015-2019You can also read