Slaying the dragon Vanquish the surplus and rescue the ETS - The Environmental Outlook for the EU Emissions Trading Scheme October 2014 - Ember
←
→
Page content transcription
If your browser does not render page correctly, please read the page content below
Slaying the dragon
  Vanquish the surplus and rescue the ETS

The Environmental Outlook for the EU Emissions Trading Scheme

                                                October 2014
                                                        1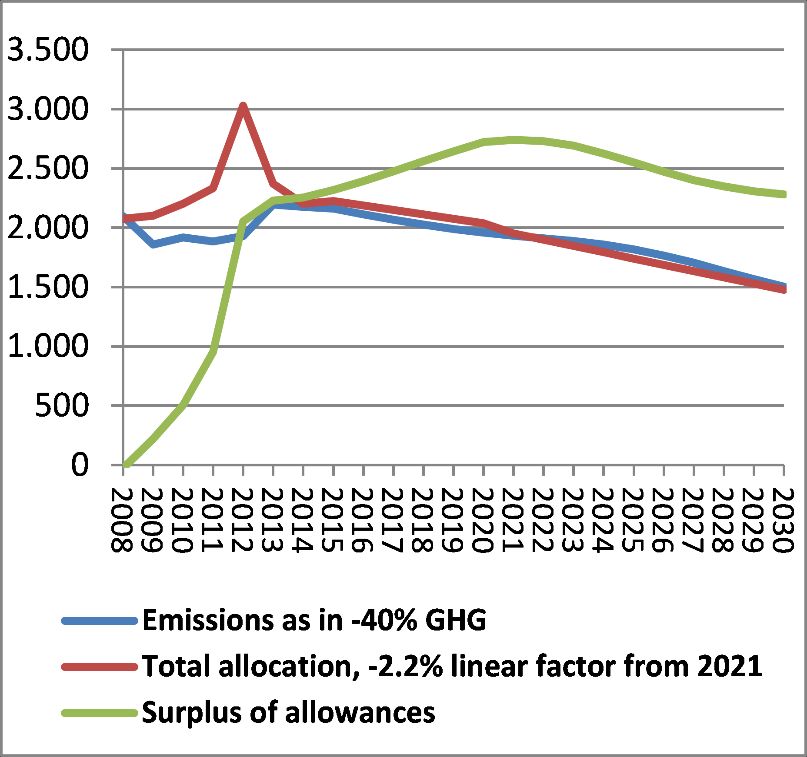
About Sandbag
Sandbag is a UK based not-for-profit research and campaigning organisation focused on effective
European climate policy. We recognise that if emissions trading can be implemented correctly it has
the potential to help affordably deliver the deep cuts in carbon emissions the world requires to
prevent the worst impacts of climate change.

Through rigorous but accessible analysis we make emissions trading more transparent and
understandable to a wider audience. In particular, we hope to shed light on the challenges the EU
Emissions Trading System (ETS) faces in becoming a truly effective global system for cutting
emissions, and to advocate for the solutions that can help it to work better.

The International Centre for Climate Governance ranks Sandbag in the top twenty climate think
tanks in the world.

We are grateful for funding for this research from the European Climate Foundation, the Esmée
Fairbairn Foundation, and for donations from members of the public.

About this Report
Lead Author:
Damien Morris

Chapter Authors and Supporting Research:
Bryony Worthington, Alex Luta, David Jones, Laurence Watson, Patricia Buckley, Phil MacDonald

The findings from this report are based primarily around information publically available from the
European Commission supplemented with our own research.

Cover Illustration by Kerry Hyndman. www.kerryhyndman.co.uk

Printed: October 2014

Version for public review from 15.10.2014 until 29.10.2014. Please send comments to
damien@sandbag.org.uk or (+44) 0207 1486377

Sandbag Climate Campaign is a not-for-profit enterprise and is in registered as a Community Interest
                      Company under UK Company Law. Co. No. 671444

                            EU Transparency Number: 94944179052-82

                                                                                                   2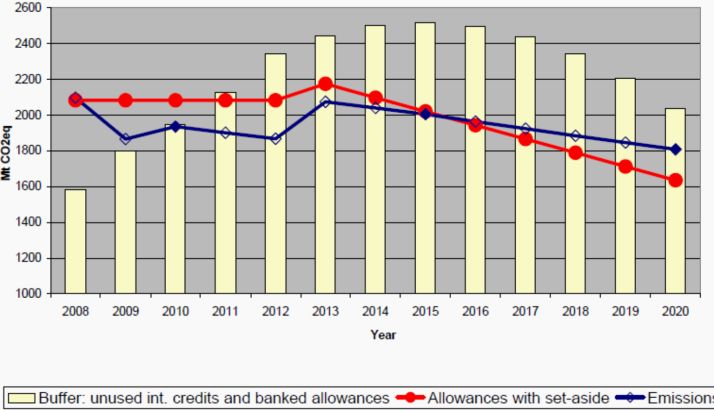
Table of Contents
Director’s Foreword ............................................................................................ 5
Executive Summary ............................................................................................ 6

1: Introduction - The policy context in 2014 ...................................................... 11
                 2013: A new phase begins ................................................................................................ 12

2: Overall balance of supply and demand ......................................................... 14
                 Key findings ....................................................................................................................... 14
                 Oversupply of allowances in 2013 .................................................................................... 14
                 Oversupply of allowances out to 2020 and beyond ......................................................... 15
                 The impact of the over-supply .......................................................................................... 17

3: Country-level analysis ................................................................................... 19
                 Key Findings ...................................................................................................................... 19
                 Auction revenues in 2013 ................................................................................................. 22
                 Individual Member States ................................................................................................. 22

4: Sectoral analysis ........................................................................................... 29
                 Key findings ....................................................................................................................... 29
                 Introduction: ..................................................................................................................... 29
                 Scope Change.................................................................................................................... 30
                 Power Sector ..................................................................................................................... 30
                 Manufacturing sectors ...................................................................................................... 32
                 What have these changes achieved?................................................................................ 35
                 Problem 1: Carbon leakage protections are almost universal.......................................... 36
                 Problem 2: Insufficient responsiveness to changes in output .......................................... 37
                 Problem 3: Surplus allowances banked forward from Phase 2 ........................................ 39
                 The outlook for industrial sectors going forward ............................................................. 41

5. Company analysis - Carbon Fatcats Revisited ................................................ 44
                 Key findings ....................................................................................................................... 44
                 This year’s crop of Carbon Fatcats .................................................................................... 44
                 New rules changing the list of Fatcats .............................................................................. 45
                 Offsetting turns Fatcats obese .......................................................................................... 46

                                                                                                                                                3
How long can the Fatcats last? ......................................................................................... 47
Why the Cats are Fat......................................................................................................... 52
6. The use of offsets .......................................................................................... 55
Key findings ....................................................................................................................... 55
Offset use is in decline ...................................................................................................... 55
Clean Development Mechanism (CDM) ........................................................................... 59
Joint Implementation (JI) .................................................................................................. 61
7. Changes to the EU ETS currently under discussion......................................... 63
Key findings ....................................................................................................................... 63
Introduction ...................................................................................................................... 63
Implementing a market stability reserve from 2021 ........................................................ 64
A stronger trajectory and an MSR together ..................................................................... 67
8. Sandbag’s recommendations for further reform ........................................... 68
Summary ........................................................................................................................... 68
Improving the orderly functioning of the market............................................................. 68
Recommendation 1: Introduce a strong and effective market stability reserve.. 68
Protecting the competitiveness of EU industry ................................................................ 71
Recommendation 2: More targeted protections against carbon leakage........... 71
Key benefits of making free allocation more responsive to production .............. 73
Increasing EU climate ambition ........................................................................................ 74
Recommendation 3: Tighten the ETS cap to make it fit for purpose ................... 74
Concluding comments ...................................................................................................... 76
Appendix 1: Aviation – a sector in limbo ........................................................... 77
Appendix 2: Cancelled Phase 2 allowances ....................................................... 78
4Director’s Foreword
2013 was an interesting year in the history of the European Emissions Trading Scheme. This, our 6th
report into the state of the ETS, looks at some of the major changes that began last year, their
impact and what they might mean for the future of the scheme.
It may come as no surprise that our overriding concern remains the monstrous surplus of allowances
continuing to build up in the scheme, blocking the cost-effective path to reduced emissions. Even
with the welcome recent policy changes, the allocation of allowances under the current cap
continues to be higher than demand, and the surplus is growing day by day. By 2020 structural
changes we are already witnessing in the power sector, coupled with continued reductions in
industrial emissions, could see the surplus double from today’s level to over 4 billion tonnes. Clearly
something needs to be done, or we might as well ditch any pretence that the ETS is capable of
driving positive change in Europe’s journey to decarbonise its economy.
To restore the relevance of this potentially powerful instrument we must permanently vanquish the
surplus menacing the scheme, and our recommendations in Chapter 8 put forward a clear plan of
action to do this. We believe, however, that further policy changes will also be needed to reduce the
potential risk of the ETS exacerbating existing negative trends, such as reduced industrial capacity in
Europe. Unfortunately, the ETS currently rewards offshoring of industrial production, and there are
few supplementary policies that reward investment in abatement in the way renewables are
incentivised in the power sector.
If we look at the changes we see in our 2013 list of Carbon Fatcats, “King Fatcat” ArcelorMittal,
despite remaining at the top of the table this year, looks unlikely to continue to accrue surpluses
from now. However, a new rising Mega-Fatcat in the cement sector appears to be gaining weight
and is likely to soon dethrone the steel giant. New allocation rules mean that many companies are
now facing declining allocations in the future, even if they continue to secure their place on the
‘carbon leakage list’. In order to help address the problem of competitive distortions we
recommend simple changes ensuring that allocation rules work hand in hand with a progressive low-
carbon industrial strategy in Europe.
Overall, we continue to believe the ETS is worth saving, particularly as carbon pricing policy is
expanding into other parts of the world, including a soon to be launched national scheme in China.
Improvements to date have shown that, where there is sufficient political will, fixes can be put in
place. However, there is still much more to do and we must not wait. The opportunity for reform is
here now. We hope that later this month our political leaders will agree on a deal which sees the EU
taking advantage of our falling emissions and brings our climate change ambitions in line with the
new reality. Increasing ambition, whilst at the same time putting in place policies that incentivise
and reward investment in our industrial sectors, will deliver growth – green growth – that puts us in
a leading position internationally.
Baroness Bryony Worthington
Founder and Director, Sandbag
5Executive Summary
EU policymakers are now discussing fundamental reform of the Emissions Trading Scheme, both in
ambition and design. The 2030 Climate & Energy package will change the trajectory of the cap and
the way allowances within the cap are distributed, whilst the Market Stability Reserve attempts to
tackle the vast surplus of emission rights that currently undermine the functioning of the scheme.
This year also offers the first chance to take stock of the Phase 3 reforms that entered into force in
2013. While there have been significant improvements, these have not been enough to tackle the
scheme’s main problems. Moreover, 2014 is the first year of the ‘backloading’ decision and it is
already clear that it will fail to protect the scheme from the effects of a structural oversupply.
Across Europe, emissions in the traded sector continued to fall last year (by ~3-4%) even as GDP
crept back up (by 0.1%), but the low carbon price of just €4.56 on average is unlikely to be the cause.
With the continued build-up of surplus allowances, reaching 2.1 billion at end of 2013, the price is
expected to remain low. Despite it being the first year of a new phase, more spare allowances were
released to the market in 2013 than the average oversupply in Phase 2. We believe official
projections significantly underestimate the scale of the future surplus, which we estimate may reach
as high as 4.5 billion by 20201.
The New Rules
The ETS changed dramatically in 2013. Caps are now set centrally, rather than bottom up by
Member States. The overall level of the cap now falls year on year by 1.74% per annum. Allocation of
allowances has moved to a system based on auctions and industrial benchmarks. Certain classes of
offsets have been banned and the overall limit on offset use will soon be exhausted. Finally, a new
change to the auction profile was agreed in 2013, which sees 900m allowances that would have
been auctioned shifted back or ‘backloaded’ from the beginning to the end of the phase in 2020.
Looking at the data released for emissions and allocations in 2013 to assess how the scheme is now
performing, these are our key findings:
Net balance of supply and demand
The new trajectory of the cap, falling 1.74% each year relative to the Phase 2 cap, will not
create any scarcity in the near term.
The balance of supply and demand in 2013 saw 153Mt added to the surplus, taking the
cumulative total to 2.1bn2.
11
2020 Surplus Projections (October 2014) Sandbag http://www.sandbag.org.uk/site_media/pdfs/reports/Briefing-
2020surplusprojection.pdf
2
Cumulative balance over the period 2008-13 inclusive of surrendered offsets but excluding aviation.
6 The Commission estimates that the surplus will reach 2.6 billion by 2020, but Sandbag
estimates emissions will fall faster, as a result of lower than expected electricity
consumption and industrial production, and also the impact of new policies and
technologies. Consequently the surplus could reach as high as 4.5 billion by 2020, and
potentially continue to rise thereafter3.
Member States
Net balances of supply and demand are widely divergent across the different Member States
highlighting one of the difficulties in agreeing a way forward for this harmonised policy.
There is a high degree of divergence between Member States in terms of the 2013 balance
of supply and demand for allowances.
Large cumulative surpluses can be seen in Spain, Romania and France while Germany is
alone in showing a massive cumulative deficit.
Significant auction revenues are now being generated but countries with economies in
transition are forgoing revenue to give allowances to the power sector for free.
A significant negative balance in Germany did not prevent an increase in emissions in 2013.
Poland showed a significant net negative balance for the first time in 2013 since 2008 and
could see its net surplus overall eroded quickly if emissions remain high.
Spain and Romania have seen big decreases in power sector emissions, contributing to steep
declines in emissions overall and leading to significant net surpluses
France continues to accrue a surplus despite the new allocation rules indicating that France’s
manufacturing sectors could be well placed in terms of the EU-wide benchmarks applied.
Sectors
Emissions in the power sector are falling rapidly as a result of increased energy efficiency
and renewables.
The weak carbon price, however, is failing to disincentivise coal over gas, meaning emissions
reductions in the sector are masking a growth in coal. Europe is therefore missing out on a
quick and easy form of possible decarbonisation and risking high carbon lock in that will be
expensive to reverse.
Phase 3 saw a shift away from free allocation towards auctioning. Free allocations to the
power sector dropped from 92% of emissions in Phase 2 to 24% in 2013. Free allocations to
manufacturers fell from 123% of emissions in Phase 2 to 96% in 2013.
Benchmarks are in place that benefit the most efficient operators but the ETS rules still
reward industry for lowering production as well as increased efficiency.
Ex post adjustments to free allocations are in place for installations reducing their
production by more than half, however, this could be leading to perverse effects,
particularly in the cement sector where huge surpluses are still accruing.
3
2020 Surplus Projections (October 2014) Sandbag http://www.sandbag.org.uk/site_media/pdfs/reports/Briefing-
2020surplusprojection.pdf
7 Free allowances are set to decline progressively for all sectors which are not considered “at
significant risk” of carbon leakage, however, we find that 99.55% of the benchmark baseline
was reserved for leakage-exposed facilities.
If emissions were to carry forward at 2013 levels, and we treat all Phase 2 surpluses as
banked, most industrial sectors remain oversupplied until 2020. If Phase 3 allocation rules
are extended forward, the Cement and Lime sector and the Ceramics sector could still be
oversupplied after 2040.
Carbon Fatcats
10 companies have in 6 years managed to accrue nearly 22% of the whole surplus under the
ETS (over 483 Mt from a total of 2.2 billion tonnes) – despite being responsible for barely
10% of emissions (1.1 billion tonnes from a total of 11.6 billion tonnes).
Changes affecting the rules on free allocation have had a noticeable braking effect on the
expansion of the Fatcats’ surpluses that had been characteristic of phase 2.
Under the present policy, surpluses start being exhausted pre-2020 for electricity generators
and the late 2020s for steel makers.
However, this effect differs sharply from sector to sector. Changes in production volumes
and production methods mean the cement Fatcats’ surplus will continue rising further well
into the late 2020s.
The rules on offset use have ensured that the use of international credits continue to
provide a subsidy to already over-allocated companies.
Offsets
Changes in the Commission’s reporting of offset use, taking effect in 2013, have made it
impossible for civil society to scrutinise installation level use of offsets, reducing
transparency in an area of the policy that has seen controversy in the past.
Data on aggregate values that remains available shows that, after the great rush in 2012 to
surrender offsets that were going to be banned from Phase 3 onward, use contracted by
74% in the 2013 compliance year.
Cumulative offset use rose to nearly 1.2 billion tonnes since 2008, and therefore ETS
companies’ remaining aggregate offset entitlement is now reduced to 292 Mt. However, as
CER prices are expected to be at least eleven times lower than EUAs to 2020, we expect this
volume to be brought to market in full.
Rather than acting as a price containment tool offsetting continues to provide an
opportunity for companies to make money by swapping CERs for EUAs.
The bans on the use of certain offset categories in the ETS have had a diversifying effect on
the origin of offsets. However, 48% of all offsets handed over in 2013 still came from just 4%
of projects originating in only 4 countries (China, India, Russia and Ukraine), with little
benefits for Least Development Countries.
8Changes under discussion
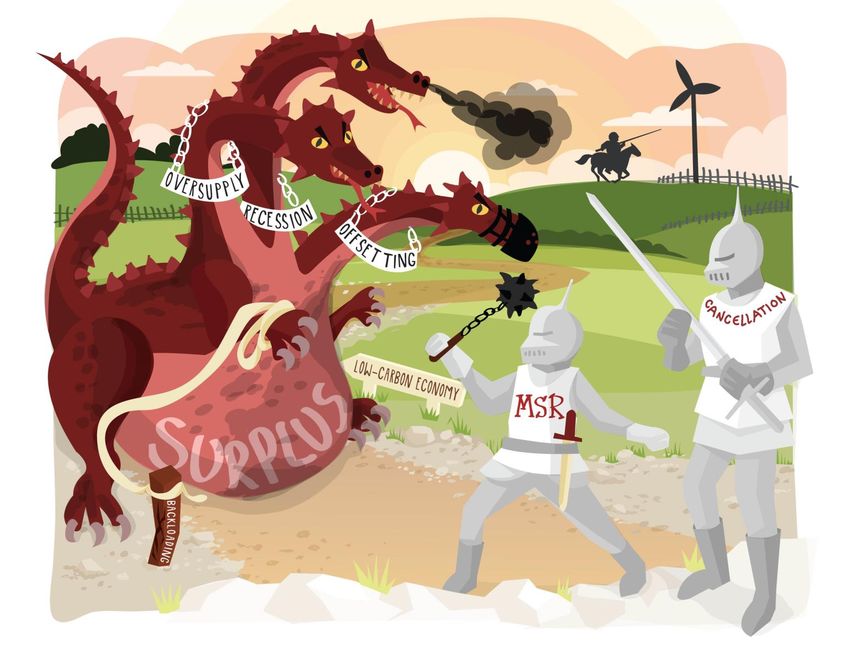
The proposal to increase the trajectory of the EU ETS to a 2.2% Linear Reduction Factor
under a 40% greenhouse gas target in 2030 will bring limited additional scarcity to the
market.
Most market participants do not take the long-term supply of ETS allowances into account
when setting the carbon price. A temporary glut of allowances can therefore make the ETS
cap unnecessarily expensive to meet over the longer term.
A Market Stability Reserve is a more sustainable solution to oversupply than the backloading
decision. It permanently removes much of the volatility from the market by predictably
removing allowances from auction when the surplus is high and returning them to auction if
the surplus ever becomes low.
The Commission’s proposed Market Stability Reserve does not start until 2021, allowing the
market to be flooded with backloaded and other unused allowances before it takes effect.
This will prevent supply from reaching the desired range (400-833 million) until at least
2027.
Taken together the current proposals to change the trajectory of the cap and introduce a
MSR do not restore scarcity to the ETS rapidly enough to avoid stranded assets or to bring
forward the investment needed to maintain a cost-effective trajectory.
Sandbag’s Recommendations
Given the findings above we make the following recommendations for further improvements to the
ETS that need to be introduced as soon as possible.
Improve the orderly functioning of the carbon market
o Introduce a robust Market Stability Reserve by 2017 and avoid flooding the market
with backloaded and unused allowances before it can start to take effect.
o Make the supply adjustments applied by the MSR more aggressive when supply is
very high or very low; instead of removing 12% of the surplus, 33% of the difference
between the surplus and the nearest threshold should be removed (or returned).
Protect the competitiveness of European industry
o Improve the free allocation rules to make them more responsive to changes in
output to ensure the most carbon efficient performers in each sector face a
comparative advantage over their dirtier rivals;
o Do this by introducing a production-based ex-post system for assigning free
allowances from 2021.
o If that is considered too politically or technically difficult, improve the existing
activity-based ex-post adjustments, by increasing the number of partial cessation
thresholds, and by creating similar provisions for facilities which significantly
increase their output.
9o Changes to the ambition of the ETS must be accompanied by new policies to
incentivise and reward investment in decarbonisation technologies in manufacturing
sectors.
Increase EU climate ambition
o Keep the ETS within the cost-effective pathway described in the 2050 Low Carbon
Roadmap by cancelling 1.4 billion allowances from the Phase 3 cap (backloaded and
unused allowances) in line with a -25% domestic greenhouse gas target in 2020.
o Recalculating the ETS trajectory under a 2030 greenhouse gas target of -40% from
this lower starting point, saving a further 1.2 billion allowances.
Concluding remarks
In this report we highlight the effect of recent changes to the ETS rules. There have been big
improvements from an environmental perspective – including harmonised cap setting, the
introduction of carbon-efficiency benchmarks and the banning of certain classes of offsets. From the
perspective of industry, 2013 was the first year for many that the scheme started to show its teeth.
Reduced free allocations overall, and in particular, to least efficient installations, means that the
incentives to abate are growing. Of course these incentives are still very weak because the
overriding, inescapably dominant feature of the ETS is its surplus.
The good news is reform is already on the table and the MSR is a potentially powerful new feature.
However the current proposals will not address all the issues that still dog the scheme.
With a new team in Brussels there is great potential to get the ETS back on track. Vanquishing the
surplus should be the first item on the to-do-list but positively addressing competitiveness fears,
by ensuring ETS rules stimulate green growth in Europe, must also be a part of that process.
101: Introduction - The policy context in 2014
In previous annual reports we have highlighted the changing context beyond Europe’s borders.
The trend towards extended application of carbon pricing policy, despite recent setbacks in
Australia, continues, especially with China now committed to introducing a nationwide emissions
trading policy in 2016. This year’s report, however, squarely focuses on the situation in Europe
today. We have a newly elected parliament, a new Commission and a chance for a fresh start.
Fixing the Emissions Trading Scheme (ETS) should be high on the agenda.
This report goes to print amidst a live debate over major potential reforms to the ETS. The European
Council is currently deciding on the shape and nature of a package of policy measures for energy and
climate stretching to 2030, which will also have an impact on key design features of the ETS after
2020. Meanwhile, the Parliament and the Council of Ministers have already commenced preparing
their responses to a new legislative proposal from the Commission to introduce a new feature
known as a ‘Market Stability Reserve’ (MSR).
The debate about climate and energy policies for 2030 focuses on future levels of ambition, the
distribution of effort between countries, and potentially other features, including the type of
measures required to protect against the risk of exacerbating deindustrialisation in Europe.
The main aim of the proposed legislation to introduce a Market Stability Reserve is to temporarily
address the over-supply that currently exists in the market in order to ensure the cost-effective
delivery of the ETS cap over the longer term. This would be done by introducing automatic triggers
that control the supply of allowances to enter the market via future auctions.
As policymakers prepare to position themselves on the future design of the EU ETS, we publish this
report with a view to helping them evaluate the success of the last design overhaul of the scheme,
carried out in 2009 under the 2020 Energy and Climate Package and first implemented in 2013. The
publication of 2013 compliance data this year means this is the first opportunity for those legislative
changes to be properly evaluated.
112013: A new phase begins
2013 saw the start of a new trading phase in the ETS, which represented a radical evolution in the
design of the policy.
The most obvious change was to the design and aggressiveness of the cap. Before 2013, the level of
the cap had been set bottom up by Member States. From the start of Phase 3, the ETS cap was set in
the primary legislation: a declining trajectory starting from a baseline 5.22% below the Phase 2 cap
in 2013 and declining by a further 1.74% off that baseline each year thereafter. This trajectory was
set with a view to driving emissions in the traded sector 21% below 2005 levels by 2020, in order to
deliver roughly 2/3rds of the effort towards Europe’s greenhouse gas target: a 20% cut in emissions
relative to 1990 levels.
A second important change was a radical evolution in the way free allowances were allocated.
Instead of being awarded on a discretionary basis by Member States as had happened previously,
free allowances were issued to each sector based on their carbon efficiency as benchmarked against
the 10% best performers in their product category. This was intended to confer a comparative
advantage to the best performers in each sector.
Furthermore, Phase 3 introduced a steep reduction in the share of allowances awarded for free
rather than sold at auction. Whereas Phase 2 had prohibited Member States from auctioning more
than 10% of their allowances, Phase 3 imposed a ceiling on the maximum volume of free allowances
that could be awarded each year, amounting to 43% of the annual cap in 2013.4 The power sector
was obliged to purchase all of its allowances at auction, and any manufacturers that were not
deemed to be at “significant risk” of carbon leakage were to be granted a declining share of their
benchmarked free allowances each year, starting at 80% in 2013 and dropping to 30% in 2020. An
additional important new feature introduced last year was the application of a correction factor that
put a limit on the total level of free allowances that could be allocated to industrial sectors,
protecting a certain volume of allowances for auction to the power sector.
A third change was in the introduction of a range of restrictions on the type of carbon offsets from
the Kyoto Protocol that could be used in the scheme. A ban on the use of credits from industrial gas
destruction projects (HFC-23, and adipic acid N2O), and on certain types of Joint Implementation
credits from countries that had not ratified the second commitment period of the Kyoto Protocol,
was supposed to stem the flow of environmentally dubious credits into the scheme. They were also
hoped to diversify the types of credits surrendered and drive more project finance towards the Least
Developed Countries.
In recognition that these changes, agreed in 2008, were inadequate to respond to the impact of the
recession and the spike in offsets at the end of Phase 2, in 2013 a supplementary decision was
reached, to ‘backload’ or postpone the auction of 900 million allowances scheduled for release over
2014-2016 until 2019-2020, the last two years of Phase 3. This was designed to create a temporary
scarcity of allowances, which would sustain incentives in the oversupplied scheme until market
participants had a clearer view of the lower volume of allowances they would face in the next
trading phase (once a decision was reached on the cap in Phase 4).
4Questions and Answers on the Commission's decision on national implementation measures (NIMs) European
Commission (October 2013) http://ec.europa.eu/clima/policies/ets/cap/allocation/docs/faq_nim_cscf_en.pdf
12These changes all represented significant advances in the design and ambition of the scheme, but
in this, our 6th Annual State of the ETS report, we illustrate that they have nevertheless proved
deeply inadequate:
1) The new trajectory of the cap from 2013 does not create any scarcity in the near term, and
Phase 3 will substantially increase the vast surpluses amassed during Phase 2.
2) The new system of assigning free allowances to industry is not properly targeted and
continues to reward drops in production rather than investment in increased carbon
efficiency.
3) The new ETS offsetting restrictions arrived too late to prevent the massive inflow of
unwanted credits, and the origin of credits used remains concentrated in a narrow range
of large projects and more developed countries.
4) The backloading decision is inadequate for addressing the structural over-supply which is
continuing to accrue.
132: Overall balance of supply and demand
Key findings
Emissions continue to fall and decouple from GDP, but the build-up of surplus of ETS
allowances continues to grow and has reached 2.1 billion at end of 2013.5
Under current policies, Commission forecasts expect this surplus to grow to 2.6 billion by
2020 and slowly fall back to 2 billion by 2030.
Already, new data since the Commission Reference Scenario was published indicate that it is
likely to significantly underestimate the scale of the surplus.
Sandbag estimates that emissions will continue to fall faster than the Commission expects,
as a result of lower than expected electricity consumption and industrial production, and
also as a result of new policies and technologies. Consequently the surplus could reach as
high as 4.5 billion by 2020, and potentially continue to rise thereafter.6
Under these circumstances the “quick” fix of the backloading decision will prove, at best, a
weak brake on the surplus, will struggle to maintain meaningful incentives within the
scheme even in the short-term, and will cause the carbon price to crash again when
allowances return to flood a highly oversupplied market.
Effective structural reforms to the EU ETS are urgently needed to ensure the ETS cap is
delivered cost-effectively.
Oversupply of allowances in 2013
The good news for the environment was that emissions in the traded sector in 2013 continued to fall
even as the economy slowly recovered from the recession. While an increase in the scope of
activities covered by the scheme makes it difficult to assess precisely how much emissions fell
between 2012 and 2013, analysts widely agree that ETS emissions fell 3-4% year-on-year7 while GDP
for the EU28 rose slightly by 0.1%.8
The bad news for policy makers is that with the vast surpluses carried over from Phase 2 and a weak
carbon price trading at an average of just €4.52 Euros in 20139, the ETS is unlikely to have been a
significant driver of these emissions reductions. Worse, this fall in emissions has led to a further
increase in the surplus allowances on the market. Emissions in 2013 were 1,904Mt, while the total
volume of allowance issued were 2,057Mt, creating a surplus of 153 million. In fact, more spare
allowances were released to the market in 2013 than the average oversupply in Phase 2.
5 Excluding aviation. See Appendix 1.
6 2020 Surplus Projections (October 2014) Sandbag http://www.sandbag.org.uk/site_media/pdfs/reports/Briefing-
2020surplusprojection.pdf
7 Point Carbon calculated emissions were down 3.1% in April. The European Environment Agency ETS Data Viewer shows
scope adjusted emissions down 4% (https://www.pointcarbon.com/news/reutersnews/1.4683148).
8 Eurostat.
9 Average annual settlement price for December 2013 Futures, obtained from the ICE.
14Table 1: ETS allowances, emissions and offsets surrendered (stationary installations, 2008-2013)
Total Verified Spare Offsets Surplus
allowances emissions EUAs surrendered
issued
2008 2,011 2,120 -109 84 -25
2009 2,049 1,880 170 81 250
2010 2,081 1,939 142 137 279
2011 2,101 1,905 197 254 450
2012 2,260 1,867 393 504 896
2013 2,057 1,904 153 133 286
Total 12,559 11,614 945 1,192 2,137
Source: EU Transaction Log, EEA ETS Data Viewer, Sandbag Calculations
2012 allowances includes 120Mt early Phase 3 auctions, 2013 includes 30 million late Phase 2 auctions
In Table 1, we show total emissions reported, allowances used and offsets surrendered each year
since 2008. We start from 2008, because this is the first year in the ETS from which spare allowances
could be banked forward for future use, and therefore contribute to the surplus.
Note that the surplus in 2013 was further extended by the use of 133 million offsets, bringing the
total to 286 million. Instead of starting to tackle the vast surpluses accrued in the system, 2013 has
added to them. The total surplus in the market at the end of 2013 stands at 2,137 million. This
figure would be even larger if Member States had not forfeited 118 million Phase 2 allowances
which were left unsold by a cut-off date set for 30th April 2013.10
Oversupply of allowances out to 2020 and beyond
These new surpluses in 2013 are not an isolated phenomenon, but a structural problem with the
level of the Phase 3 cap. In the Impact Assessment accompanying its proposal for a Market Stability
Reserve, the Commission estimates that this surplus will reach 2.6 billion by 2020 and will still be
over 2 billion in 2028.
The backloading decision taken in 2013 will temporarily prevent allowances from entering the
market in 2014, 2015 and 2016. However, they are then scheduled to return in years 2019 and 2020,
creating a huge influx of allowances at the end of the phase.
10 See Appendix 2 for details.
15Figure 1: Commission forecasts for emissions and surplus (2008-2028 with backloading decision)
Source: European Commission Staff Working Document (2014) p18 http://eur-lex.europa.eu/legal-
content/EN/TXT/?uri=CELEX:52014SC0018
We believe the Commission’s projected surplus to be extremely conservative and expect the
structural oversupply under the current trajectory of the cap to be far higher and to last much
longer.
The Commission published a Reference Scenario used to inform the Commission’s 2030 White
Paper.11 There are significant issues with the assumptions in the Reference Scenarios, which we
believe lead them to underestimate the surplus. Firstly, it assumes that 2.7% more electricity will be
generated in 2015 compared with 2010, but we note electricity demand has fallen 2.8% below 2010
levels by 2013, , and early indications show that it will fall sharply in 2014. We also note that the
Reference Scenario assumes that aviation emissions will be included at full international scope,
whereas the scope has been restricted to intra-EU flights until at least 2017.
Even if we crudely assume emissions stay constant at 2013 levels, we can expect the surpluses to
reach 2.7 billion by 2020 if we exclude aviation12. But this is a high emissions scenario, given that
existing legislation is expected to drive significant growth in renewable generation, the closure of
coal plants, and increases in energy efficiency for appliances industrial processes.13 In fact, Sandbag
estimates that surpluses might reach as high as 4.5 billion by 2020, and may continue to rise
rapidly unless fundamental reforms to the ETS are implemented.14
11 Update on trends to 2050 (2013) European Commission
http://ec.europa.eu/energy/observatory/trends_2030/doc/trends_to_2050_update_2013.pdf
12 There is still considerable uncertainty about the 2013 aviation data, and the scope of the aviation cap out to 2020. See
Appendix 1 for more information about the aviation sector.
13 e.g. The Renewable Energy Directive, The Industrial Emissions Directive, the Energy Efficiency Directive, the Ecodesign
Directive. This calculation excludes aviation.
14 2020 Surplus Projections (October 2014) Sandbag http://www.sandbag.org.uk/site_media/pdfs/reports/Briefing-
2020surplusprojection.pdf
16Figure 2: The Sandbag “Current Policies” Scenario.
5,000
4,500
4,000
3,500
3,000 International credits
2,500 Allowances
2,000 Emissions
1,500 Total surplus
1,000
500
0
2008 2009 2010 2011 2012 2013 2014 2015 2016 2017 2018 2019 2020
Source: DG Clima, EU Transaction Log, Sandbag calculations.
Stationary sectors only. Historical data used for 2008-2013. Projections from 2014-2020.
Our alternative future scenario is based on a bottom up model built with the following assumptions:
The trajectory of the cap continues forward at 1.74% reduction per annum. All allowances
under the legal cap come to market and the maximum volume of offsets are used by 2020.
Electricity consumption falls by 1% per annum on average over 2013-2020.
Renewable generation increases to meet the 2020 target.
Industrial emissions falling by 0.9% in 2014, 2.0% to 2018, as a result of continuing fall in
demand for basic materials and increasing industrial energy efficiency.
Aviation is excluded from the analysis (we cover stationary sectors only).
We call this the Sandbag “Current Policies” Scenario. We explore and defend these assumptions in
more detail in a dedicated publication.15 For now, we highlight that if these assumptions prove
correct the structural surplus in the ETS is growing at a rate of nearly 1 million tonnes each day
over 2013-2020, with the surplus climbing to 4.5 billion in 2020. Surpluses on this scale would
make the EU ETS more or less irrelevant for the foreseeable future.
The impact of the over-supply
The huge surpluses in the system have significantly weakened the incentive for participants to invest
in abatement. This is particularly problematic in the current trading phase (2013-2020) in the power
sector where, as outlined in our recent report ‘Europe’s Failure to Tackle Coal’16, investors are
deciding whether it is economic to re-invest in existing coal plants to make them compliant with the
Industrial Emissions Directive, and where underutilised gas facilities are at risk of closing
15 Ibid.
16 Published July 2014: http://www.sandbag.org.uk/site_media/pdfs/reports/Europes_failure_to_tackle_coal.pdf
17permanently. The surplus also weakens investment in RD&D for low-carbon solutions in
manufacturing, where step-change in technology will eventually be required.
Unfortunately, the impact of the backloading decision in 2013 is not likely to be the effective
intervention that the Commission expects under its Reference Scenario. This anticipates that the
temporary reduction in auction volumes will leave the market significantly undersupplied in 2014-
2016, allowing the surplus to contract to around 1.5 billion allowances by 2016 before climbing up to
2.6 billion in 2020. We foresee that the backloading decision will provide a much feebler brake on
the surplus and that it will barely drop below 2 billion by 2016, before rising very rapidly. Moreover,
we do not expect Phase 4 to deliver the scarcity expected by the Commission, unless the cap is made
much tighter than the current trajectory in the ETS directive implies.
While lower than expected demand for allowances means the backloading decision is unlikely to
prove as effective as hoped, it has nonetheless bought policymakers time to come up with a more
considered decision on structural reform on the EU ETS. However, policymakers have little time to
lose in reaching a more sustainable solution to the oversupply of allowances in the scheme, as the
return of the backloaded allowances in the last two years of the phase will likely cause another price
crash due to the already high surplus doubling if no action is taken before then.
183: Country-level analysis
Key Findings
There is a high degree of divergence between Member States in terms of the 2013 balance
of supply and demand for allowances.
Large cumulative surpluses can be seen in Spain, Romania and France, while Germany is
alone in showing a massive cumulative deficit.
Significant auction revenues are now being generated, but countries with economies in
transition are forgoing them so they can give allowances to the power sector for free
instead.
A significant negative balance in Germany did not prevent an increase in emissions in 2013.
Poland showed a significant net negative annual balance for the first time in 2013 since 2008
and could see its cumulative surplus eroded quickly if emissions remain high.
Spain and Romania have seen big decreases in power sector emissions, contributing to steep
declines in emissions overall and leading to significant net surpluses.
The overall picture of the ETS balance of supply and demand, now and in the future, tells a story that
helps to explain why today the scheme is currently delivering such low prices. However, looking at
data as it relates to Member States shows that the picture is not uniform across all countries, which
helps illustrate some of the challenges in arriving at a consensus about the future of such an
extensive, harmonised policy.
2013 was the first year in which allocation of allowances under the cap was adjusted to redistribute
auctioned allowances between countries with high and low GDP per capita and to account for early
action. The figures in Table 2 include these adjustments and illustrates how permit balances varied
significantly from country to country. Year-on-year economic growth figures for the last two years
are also provided for comparison together with revenues from auctions.
As previously discussed, 2013 is a very different year in terms of how the ETS is now structured. The
previous phase saw more generous rules being applied, and of course the impact of the recession
was felt more strongly in some countries than in others. The cumulative balance of allowances
compared to demand, per country, over the period 2008 to 2013 is illustrated in Figure 3.
19Table 2: 2013 balance per country (Auctioned plus Freely Allocated minus Emissions).
2013 Balance Balance 2013 2013 GDP GDP Estimated 2013
(Auctioned plus change balance as (millions) change auction
freely allocated 2012 to % of 2013 2012 to revenue17
minus emissions) 2013 emissions 2013 ()
(tCO₂e) (millions)
Spain 33,482,854 ↑ 27% € 1,022,988 -1% € 402
Romania 31,429,775 ↑ 74% € 142,245 8% € 153
France 28,983,381 ↓ 26% € 2,059,852 1% € 255
Italy 21,780,251 ↑ 13% € 1,560,024 0% € 448
Belgium 20,918,211 ↓ 46% € 382,692 2% € 131
Sweden 17,983,720 ↑ 89% € 420,849 3% € 41
Slovakia 10,487,898 ↓ 48% € 72,134 1% € 72
Hungary 8,633,068 ↓ 45% € 97,948 1% € 43
Finland 8,277,438 ↓ 26% € 193,443 1% € 78
Czech Republic 7,128,043 ↓ 11% € 149,491 -2% € 109
Austria 6,974,692 ↑ 23% € 313,067 2% € 65
Portugal 5,782,960 ↓ 23% € 165,690 0% € 84
Denmark 4,793,996 ↓ 22% € 248,975 2% € 64
Lithuania 4,239,583 ↓ 57% € 34,631 5% € 23
Bulgaria 4,172,040 ↓ 13% € 39,940 0% € 69
Latvia 2,783,755 ↑ 105% € 23,372 5% € 13
Luxembourg 792,047 ↑ 43% € 45,478 6% €6
Norway 318,174 ↑ 1% € 385,747 -1% € 34
Ireland 312,075 ↓ 2% € 164,050 0% € 49
Cyprus 14,413 ↓ 0% € 16,504 -7% €1
Liechtenstein 1,142 ↓ 121% €0
Iceland -316,659 -18% € 11,000 4% €0
Slovenia -547,681 ↓ -7% € 35,275 0% € 21
Malta -567,804 ↓ -33% € 7,263 5% €5
Estonia -2,373,182 ↓ -15% € 18,613 7% € 23
Netherlands -2,898,743 ↓ -3% € 602,658 1% € 156
Croatia -3,218,275 -38% € 43,128 -1% €0
Greece -6,076,165 ↓ -10% € 182,054 -6% € 170
Poland -10,231,826 ↓ -5% € 389,695 2% € 298
United Kingdom -51,739,118 ↓ -23% € 1,899,098 -1% € 485
Germany -105,404,067 ↓ -22% € 2,737,600 3% € 931
Not defined 200,000,000 € 904
(NER300)
Grand Total 235,915,996 ↓ 12% € 13,465,505 1% € 5,133
Source: EUTL, auctions EEA. Figures exclude the Aviation sector.
17 At €4.52 average annual front December carbon price for 2013.
20Figure 3: Cumulative balance of allowances (auctioned plus freely allocated minus emissions) per
country 2008 to 2013.
Germany
Norway
United Kingdom
Estonia
Croatia
Iceland
Slovenia
Liechtenstein
Malta
Cyprus
Luxembourg
Denmark
Latvia
Ireland
Lithuania
Finland
Austria 2013
Greece emissions
Bulgaria
Poland
Hungary 2008to2013
Netherlands balance
Sweden
Portugal
Slovakia
Italy
Czech Republic
Belgium
Spain
Romania
France
-200 -100 0 100 200 300 400 500
tCO₂ Millions
Source: Free allocations and emissions EUTL, auctions EEA
As the chart above indicates, there are large differences between Member States in terms of how
they have fared in relation to the balance of supply and demand over time under the ETS. Showing
annual emissions in 2013 alongside highlights the fact that relatively small increases in emissions in
Poland, as witnessed this year, will quickly eat through the cumulative net surplus to date.
Some of the individual Members State positions are shown in more detail in the section below.
21Auction revenues in 2013
Another significant change, of relevance at the country level, is the shift to auctioning that began in
2013.
Table 3 provided estimates of the level of income ETS auctions generated last year per country.
Considered as a proportion of GDP, income is low but nevertheless represents an important
opportunity to fund public spending on programmes that can assist with the transition to a low
carbon economy.
Some countries decided to forgo income to the public purse in favour of continuing to allocate
allowances for free to the power sector, as the rules currently allow for countries with economies in
transition. The use of Article 10c by countries is summarised in below. By 2020 this provision, unless
changed, will end, with all countries having to reduce the share of allowances given away each year
in this way between now and then.
Table 3: Auctioned allowance re-assigned to electricity facilities in 2013 under Article 10c
Country tCO₂ Value if auctioned
Poland 65,992,703 € 298,287,018
Czech Republic 25,285,353 € 114,289,796
Romania 15,748,011 € 71,181,010
Bulgaria 11,009,416 € 49,762,560
Hungary 7,047,255 € 31,853,593
Estonia 5,135,166 € 23,210,950
Cyprus 2,519,077 € 11,386,228
Lithuania 582,373 € 2,632,326
Grand Total 133,319,354 € 602,603,480
Source: European Commission website, ICE. Forfeited revenues auction revenues indicated in the right hand column,
Calculated using average forward Dec value in 2013 which was €4.52
Individual Member States
Below we provide a brief overview of seven different Member States’ emissions and allocations
under the ETS from 2005-13. Countries selected are the top 5 emitters (on basis of 2013 emissions)
together with the countries with the two largest surpluses: France and Romania. Please note the
trend lines depicted here are not corrected for scope change between the phases and are intended
merely to illustrate in a little more detail the different situations that exist between the Member
States.
Germany
Germany is by far the biggest player in the EU carbon market, with emissions in 2013 almost twice
that of the UK, the next biggest. As a country with a high GDP/capita, Germany has seen a significant
reduction in its allocation of allowances in 2013 compared to previous years. Benchmarks and the
cross-sectoral correction factor will have reduced national allocations further. At the same time
emissions have ticked up in the chemicals, combustion, iron and steel and cement sectors, though
some of this will have been due to scope change particularly in the chemicals sector.
22Figure 4: Germany's performance in the ETS (2005-2013)
600
Millions
500
400
tCO₂
300
200
100
0
2005 2006 2007 2008 2009 2010 2011 2012 2013
Auctioned or sold EUAs FreelyAllocated
FreelyAllocated10c VerifiedEmissions
UK
Like Germany the UK has seen a big drop in allocations in 2013. After an increase in emissions in
2012, as coal stations used up limits on their operating hours before then closing, emissions in 2013
fell back. Increases in iron and steel sectors were more than offset by the fall in power. The UK’s
cumulative position in 2013 is nowhere near as short as Germany, thanks to a build-up of surplus
allowances stemming from more sharply decreased economic activity during the recession.
Figure 5: United Kingdom performance in the ETS (2005-2013)
23300
Millions
250
200
tCO₂
150
100
50
0
2005 2006 2007 2008 2009 2010 2011 2012 2013
Auctioned or sold EUAs FreelyAllocated
FreelyAllocated10c VerifiedEmissions
24Poland
In March of this year we published a report18 looking in detail at Poland’s position in relation to EU
climate policy and targets. Poland’s economy wide targets under Kyoto are generous and there is
also evidence that the Polish economy is capable of decoupling carbon emissions from economic
growth, making it possible for targets to be exceeded. However, as pointed out in the report,
Poland’s targets under the ETS are tighter. In 2009-2012 Polish emissions nevertheless were below
the level of the cap and a substantial surplus accrued. In 2013, we see Poland’s emissions exceeding
the level of allowances made available, even after the redistribution of allowances from other
countries took place.
Between 2012 and 13 emissions under the ETS grew by 5%. This was primarily due to scope change
increasing the number of installations covered. The power sector also saw an increase in emissions.
In addition, changes in the rules governing free allocation to industrial sectors meant that overall
Poland’s carbon allowance budget fell. It is clear that, if investment in abatement fails to keep pace
with declining allocations in Poland, any accumulated surplus will quickly be eroded.
Figure 6: Poland's performance in the ETS
250
Millions
200
150
tCO₂
100
50
0
2005 2006 2007 2008 2009 2010 2011 2012 2013
Auctioned or sold EUAs FreelyAllocated
FreelyAllocated10c VerifiedEmissions
18 Sharing the Load (2014) Sandbag http://www.sandbag.org.uk/site_media/pdfs/reports/Sharing_The_Load.pdf
25Italy
Allowance allocations in 2013 remain high compared to previous years due to scope change, and
there was also less of an impact on Italy from the redistribution of allowances to other Member
States. Emissions also fell relatively sharply, creating a substantial surplus both in 2013 and
cumulatively. This was primarily due to a big reduction in emissions in the power sector (-11%), but
emissions also fell in the industrial sectors not affected by scope change.
Figure 7: Italy's performance in the ETS (2005-2013)
250
Millions
200
150
tCO₂
100
50
0
2005 2006 2007 2008 2009 2010 2011 2012 2013
Auctioned or sold EUAs FreelyAllocated
FreelyAllocated10c VerifiedEmissions
26Spain
Similarly in Spain a substantial surplus accrued in 2013, giving Spain the highest cumulative surplus
of allowances over the period. This was primarily due to a huge drop (18%) in emissions from the
power sector and due to what appears to be a substantial collapse of emissions in the ceramics
sector. This offset an increase in iron and steel emissions. Allocations have risen compared to 2012
as a result of scope change and a relatively high allocation of auctioned allowances.
Figure 8: Spain's performance in the ETS
200
Millions
180
160
140
120
tCO₂
100
80
60
40
20
0
2005 2006 2007 2008 2009 2010 2011 2012 2013
Auctioned or sold EUAs FreelyAllocated
FreelyAllocated10c VerifiedEmissions
27France and Romania
Alongside Spain these countries have the greatest absolute surplus in 2013 and cumulatively.
Emissions increased in 2013 in France overall due to scope change and emissions increases in iron
and steel (20%) and combustion (2%). However a large surplus was built up, possibly providing an
early indication that overall French companies are faring well under the new benchmarks and
allocation rules.
Romania saw falls across many sectors, including a big (11%) drop in power sector emissions,
contributing to an 11% drop overall. This continues a trend of sharply reducing emissions that began
in 2008. Allocations have continued at a relatively high level leading to the highest cumulative
surplus, proportionate to size, of the economy of any country.
Figure 9: French and Romanian performance in the ETS compared (2005-2013)
160
Millions
140
120
100
tCO₂
80
60
40
20
0
Auctioned or sold EUAs FreelyAllocated
FreelyAllocated10c VerifiedEmissions
284: Sectoral analysis
Key findings
Emissions in the power sector are falling rapidly as a result of increased energy efficiency
and renewables.
The weak carbon price, however, is failing to disincentivise coal over gas, meaning emissions
reductions in the sector are masking a growth in coal. Europe is therefore missing out on a
quick and easy form of possible decarbonisation and risking high carbon lock in that will be
expensive to reverse.
Phase 3 saw a shift away from free allocation towards auctioning. Free allocations to the
power sector dropped from 92% of emissions in Phase 2 to 24% in 2013. Free allocations to
manufacturers fell from 123% of emissions in Phase 2 to 96% in 2013.
New benchmarks benefit the most efficient operators, but the ETS rules still reward industry
for lowering production rather than increased efficiency.
Ex post adjustments to free allocations are in place for installations reducing their
production by more than half, however, this could be leading to perverse effects,
particularly in the cement sector where huge surpluses are still accruing.
Free allowances are set to decline progressively for all sectors which are not considered “at
significant risk” of carbon leakage, however, we find that 99.55% of the benchmark baseline
was reserved for leakage-exposed facilities.
If emissions were to carry forward at 2013 levels and if we treat all Phase 2 surpluses as
banked, most industrial sectors remain oversupplied until 2020. If Phase 3 allocation rules
are extended forward, the Cement and Lime sector and the Ceramics sector could still be
oversupplied after 2040.
Introduction:
Phase 3 saw a radical departure in the way allowances were allocated to different sectors. From
2013 auctioning became the default method of assigning allowances, while free allocation became
“transitional”.
This change was most marked for the power sector, which went from receiving around 92% of the
allowance needed to cover its emissions across 2008-12, to receiving just 24% for free in 2013. In
fact, most electricity generators were obliged to purchase all of their allowances at auction in 2013,
while a few electricity generators in key Eastern European member states were awarded
“transitional free allowances” which, under current legislation, will diminish to zero by 2020.
29You can also read