Industry Insight New Zealand Ports and Freight Yearbook - Deloitte
←
→
Page content transcription
If your browser does not render page correctly, please read the page content below
Industry Insight
New Zealand Ports and Freight Yearbook
2019
New Zealand ports and freight yearbook 2019 | Contents

Contents

Introduction                                             3

Glossary                                                 4

Global Perspectives                                      6

In Focus                                                 17

Beyond Supply Chains                                     22

Domestic Environment                                     30

New Zealand Freight Task                                 33

Port Performance                                         42

Port Summaries                                           54

Our Infrastructure & Capital Projects Offering           67

                                                              2
New Zealand ports and freight yearbook 2019 | Introduction

Introduction

 The Deloitte New Zealand Ports and               We are pleased to release this
 Freight Yearbook presents a concise              Yearbook as part of Deloitte’s recently
 snapshot of macroeconomic and                    established Infrastructure & Capital
 domestic drivers of New Zealand port             Projects (ICP) integrated market
 and freight activity. Additionally, we           offering.
 include insight pieces on key trends in
 the shipping industry. We welcome                Our domestic and global network of
 your feedback and look forward to                ICP professionals, allow us to bring
 future discussion and engagement.                together deep skills to address all
                                                  aspects of infrastructure development
 The Yearbook has again been                      and operation.
 prepared with contribution from
 Deloitte’s specialist economic advisory          Our ICP services help clients to:
 team, Deloitte Access Economics, who             develop investment confidence;
 have provided global and domestic                effectively plan, manage and control a
 economic insights. We also welcome               project’s cost and schedule; and better
 input from our Consulting service line           manage and optimise existing assets
 on the role of ports in the digital              (often through digital transformations
 supply network and how this role will            that increase a client’s capability to
 shape the implementation of digital              control and operate their
 technologies.                                    infrastructure).

 This years ‘In Focus’ pieces include the
 impact of the new Marpol Annex 6 low
 sulphur fuel regulations, the piloting of
 hydrogen production and refuelling
 facilities, and smart containers.

 The Yearbook also presents recent
 data on the New Zealand freight task
 alongside operational and financial
 performance data for New Zealand’s
 major ports.

                                                                                            3
New Zealand ports and freight yearbook 2019 | Glossary

Glossary

Brexit                      United Kingdom’s Exit from the European Union    NZTA    New Zealand Transport Agency
CCFI                        China Containerised Freight Index                OCR     Official Cash Rate
CNG                         Compressed Natural Gas                           OECD    Organisation for Economic Co-operation and Development
EBIT                        Earnings Before Interest and Tax                 ONE     Ocean Network Express
EIA                         Energy Information Administration                PPP     Public Private Partnership
FEU                         Forty-foot Equivalent Unit                       RBNZ    Reserve Bank of New Zealand
FIGS                        Freight Information Gathering System             RCD     Remote Container Device
FTA                         Free Trade Agreement                             RCM     Remote Container Management
GDP                         Gross Domestic Product                           RORO    Roll-on Roll-off
GFC                         Global Financial Crisis                          T&L     Transport and Logistics
GT                          Gross Tonnes                                     TEU     Twenty-foot Equivalent Unit
HFO                         Heavy Fuel Oil                                   TPP     Trans Pacific Partnership
ICP                         Infrastructure & Capital Projects                TWI     Trade Weighted Index
IMF                         International Monetary Fund                      ULSFO   Ultra Low Sulphur Fuel Oil
IMO                         International Maritime Organisation              USMCA   United States-Mexico-Canada Free Trade Agreement
IoT                         Internet of Things                               WTO     World Trade Organisation
LNG                         Liquefied Natural Gas
LPG                         Liquefied Petroleum Gas
MoT                         Ministry of Transport
NFDS                        National Freight Demands Study
NPAT                        Net Profit after Tax
NZIER                       New Zealand Institute of Economic Research Inc

                                                                                                                                              4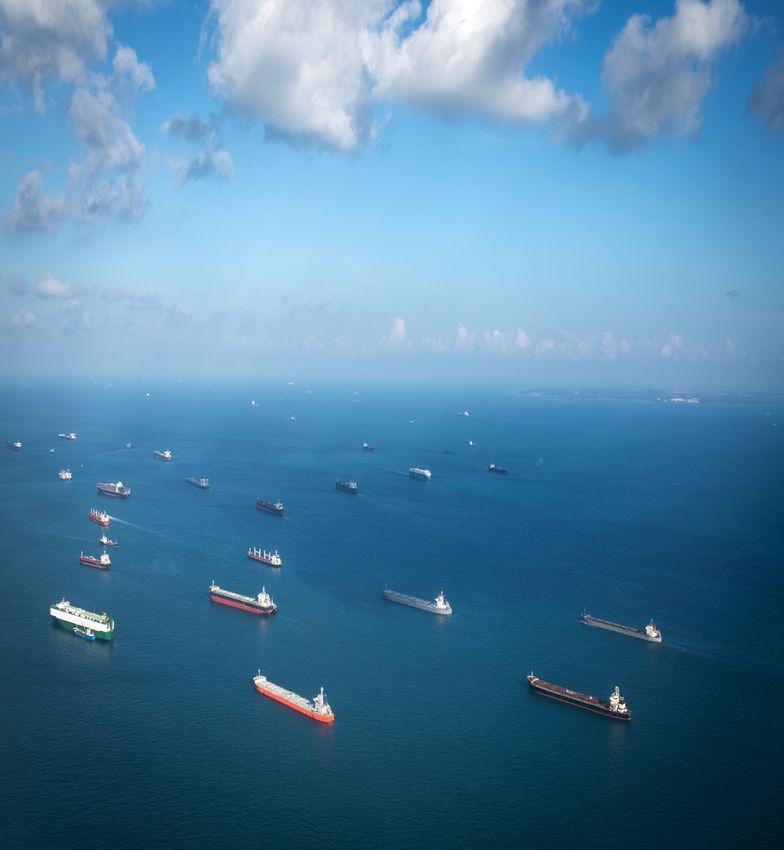
New Zealand ports and freight yearbook 2019 | Glossary

Glossary

 COUNTRIES                                                                 PORTS
BRA                         Brazil                                         AKL     Ports of Auckland
CHN                         China                                          BLU     Southport (Bluff)
DEU                         Germany                                        EST     Eastland Port
IDN                         Indonesia                                      LYT     Lyttelton Port of Christchurch
IND                         India                                          MLB     Port Marlborough
JPN                         Japan                                          NPE     Napier Port
KOR                         South Korea                                    NPL     Port Taranaki
MYS                         Malaysia                                       NSN     Port Nelson
SAU                         Saudi Arabia                                   NTH     Northport
THA                         Thailand                                       POE     Port of Otago
TWN                         Taiwan                                         TIU     PrimePort Timaru
USA                         United States of America                       TRG     Port of Tauranga
VNM                         Vietnam                                        WLG     CentrePort (Wellington)
 TRADE ROUTES
AS-ME                       Asia to Middle East Trade Route
AS-Med                      Asian to Mediterranean Trade Route
AS-NA                       Asia to North America Trade Route
AS-NE                       Asia to Northern Europe Trade Route
AS-SA                       Asia to South America Trade Route
AUS-FE                      Australia to Far East Trade Route
NA-SA                       North America to South America Trade Route
NE-NA                       Northern Europe to North America Trade Route
NE-SA                       Northern Europe to South America Trade Route

                                                                                                                    5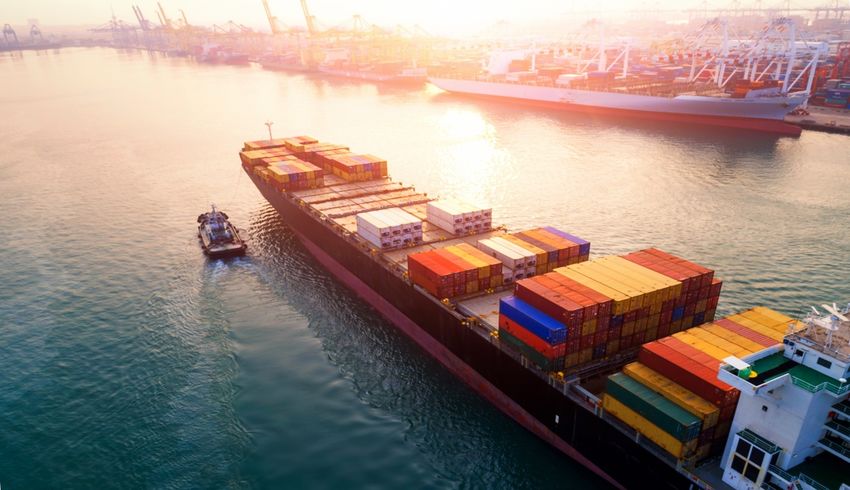
Global Perspectives

                      6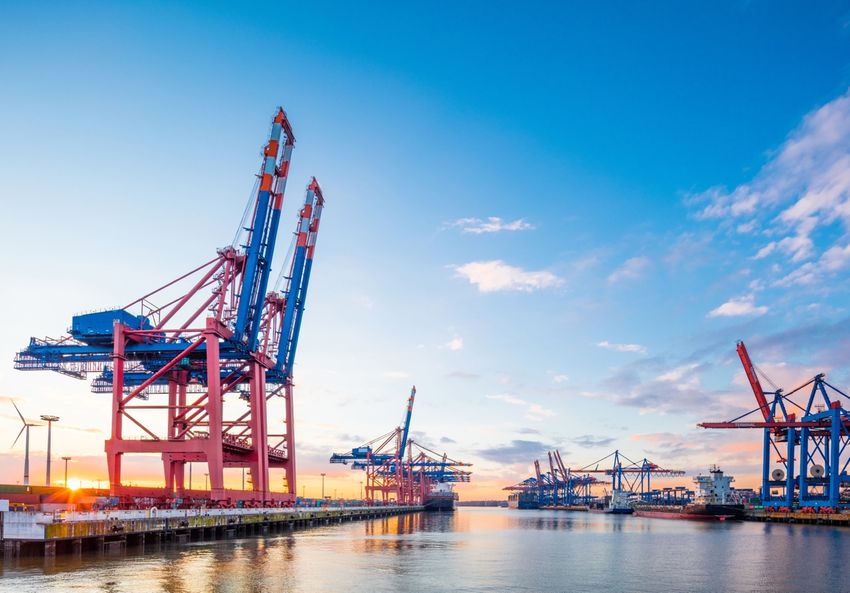
New Zealand ports and freight yearbook 2019 | Global Perspectives

Global perspectives – Deloitte Access Economics

Global economy                                   Steady economic growth and a strong            China’s ongoing trade dispute with the US       The current period can be categorised as
                                                 labour market in the United States (US)        is of particular importance with a current      one of higher risk aversion compared to
The global economy has softened after
                                                 saw the Federal Reserve increase the           halt on tariff increases in place.              previous years. Rising trade tensions and
weaker performance in some economies
                                                 federal funds rate by a total of 100 basis     Representatives from both parties are           deeper-than-expected contractions in
in the second half of 2018. The
                                                 points over the course of 2018 to a            aiming to close a deal by late April.           developing economies such as Turkey and
International Monetary Fund’s (IMF)
                                                 current range of 2.25-2.5%. Guidance           Failure to resolve this dispute would have      Argentina have led investors to lower
World Economic Outlook (January 2019)
                                                 suggests it will remain around this level in   a wide-ranging negative impact on global        their exposure to riskier assets.
estimates global gross domestic product
                                                 2019 with US GDP growth projected to be        economies.
(GDP) growth has remained at 3.7% in                                                                                                            It is clear that the pending outcome of
                                                 lower than in previous years at 2.0%.
2018, in line with 2017 growth.                                                                 Decreases in global growth projections for      trade disputes will have a determining
                                                 China is facing a slowdown in GDP growth       2019 are primarily attributed to the            impact on growth in 2019. The signing of
The global outlook is for a slight slow-
                                                 due in part to financial regulatory            economic slowdown in China combined             the US-Mexico-Canada free trade
down in growth for 2019 and 2020, to
                                                 tightening and escalating trade tensions.      with unresolved trade tensions globally.        agreement (USMCA), and the US-China
3.5% and 3.6% respectively. This is lower
                                                 GDP growth is projected to be 6.2% in          Further concerns surround the stability of      90-day halt on tariff increases at the end
than current levels but still higher than
                                                 2019, following the downward trend of          Italy’s fiscal policy, where sovereign yields   of 2018 represented meaningful steps
the average 3.3% rate achieved in the
                                                 recent years.                                  remain high. Other negative shocks to           towards de-escalating trade tensions.
years following the 2008 Global Financial
                                                                                                global growth forecasts include new auto        However, global uncertainty surrounding
Crisis (GFC).
                                                                                                fuel emission standards in Germany and          the Brexit deal and negotiations between
                                                                                                weakening financial market sentiment.           the US and China remain. If these trade
                                                                                                                                                disputes can be resolved in a co-operative
  Real GDP growth (annual change)                                                               The United Kingdom’s (UK) negotiations
                                                                                                                                                and timely manner growth outcomes may
                                                                                                with the European Union over its pending
     20                                                                                                                                         exceed baseline projections.
                                                                                                exit (Brexit) remain ongoing. This casts
                                                                              Forecast

     15                                                                                         further uncertainty over global markets.        However, the current outlook is tilted to
                                                                                                The final terms of the deal regarding           the downside. Both the UK and Europe,
     10                                                                                         trade, migration and financial access to        and the US and China, face a difficult
                                                                                                the single market are eagerly awaited as        negotiation process with the concern that
      5                                                                                         failure to secure a favourable deal would       trade negotiation breakdowns will lead to
%

                                                                                                harm the UK labour market and economy.          an increase in tariff barriers. It is
      -
                                                                                                                                                expected that all global trading partners
                                                                                                Increased euro-scepticism is also on the
                                                                                                                                                would suffer as a result. In this case,
     (5)                                                                                        rise in other parts of Europe which may
                                                                                                                                                global growth rates may fall short of
                                                                                                affect future European parliamentary
    (10)                                                                                                                                        projections, which are already on a
                         Australia             China                  India                     election outcomes. Combined with an
                                                                                                                                                downward trend.
                         New Zealand           United States          World                     impending Brexit, this threatens to disrupt
                         Euro area                                                              the region’s economic environment.
 Source: IMF world economic outlook
                                                                                                                                                                                         7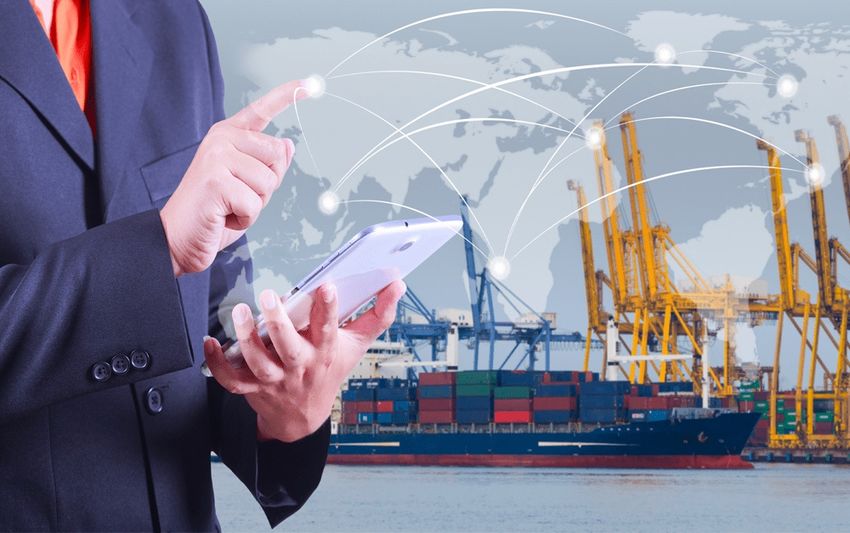
New Zealand ports and freight yearbook 2019 | Global Perspectives

Global perspectives – Deloitte Access Economics

Global trade                                     Broadly speaking, New Zealand’s trade           New Zealand’s ‘Trade for All’ agenda        Of particular note is New Zealand’s
                                                 policy consists of multilateral negotiations,   includes a number of key principles that    support of multi-lateral negotiations and a
Global trade activity continues to grow,
                                                 Bilateral and Regional Trade Agreements         inform the future direction of trade with   focus on the Asia-Pacific region.
yet at a lower rate than seen in previous
                                                 (BRTAs) and unilateral action to reduce         New Zealand.
years. IMF forecasts show that world
                                                 New Zealand’s import tariffs. The first two
trade volumes grew by 4.0% in 2018.
                                                 aspects of trade policy mentioned have an
This growth was at a more moderate pace
                                                 external focus, while the latter aspect has
than earlier 2018 estimates, with 2019
                                                 a domestic focus.                                Free Trade Agreements in force
and 2020 forecasts predicting trade
                                                                                                     ASEAN-Australia New Zealand Free Trade Area (AANZFTA)
expansion will remain at 4.0% in the             New Zealand has been a strong advocate
                                                                                                      New Zealand-China Free Trade Agreement
coming years.                                    of free trade and at the forefront of
                                                                                                      Trans-Pacific Strategic Economic Partnership (P4)
                                                 negotiating bilateral and multilateral free
The flat lining of trade growth is in part                                                            New Zealand and Thailand Closer Economic Partnership
                                                 trade agreements. The relatively small
due to the heightened tension between                                                                 New Zealand and Singapore Closer Economic Partnership
                                                 and geographically dispersed population
major trading partners, and the                                                                       Australia and New Zealand Closer Economic Relations (CER)
                                                 of New Zealand and distance to markets
uncertainty surrounding the outcome of                                                                New Zealand-Korea Free Trade Agreement
                                                 means trade is critical to delivering the
these negotiations. The US and China are
                                                 high quality and diverse nature of goods             Comprehensive and Progressive Agreement for Trans-Pacific Partnership (CPTPP)
yet to reach a deal on their trade dispute,
                                                 that New Zealanders produce and                      New Zealand and Malaysia Free Trade Agreement - signed but not yet in force
and the UK appears far from finalising the
                                                 consume, at affordable prices. It is                 New Zealand and Hong Kong, China Closer Economic Partnership
terms of its impending exit from the
                                                 estimated that over 600,000 jobs are in
European Union.
                                                 direct export sectors with the majority of       Free Trade Agreements - Concluded but not in force
Actual trade growth figures will depend on       these jobs located in the New Zealand               Trans-Pacific Partnership (TPP)
the outcome of the unresolved trade              regions.                                            New Zealand - Gulf Cooperation Council Free Trade Agreement
disputes mentioned above. While current                                                              Anti-Counterfeiting Trade Agreement (ACTA)
                                                 A key objective of the New Zealand
forecasts do not represent a reduction in                                                             PACER Plus
                                                 Ministry of Foreign Affairs and Trade
global growth, risks to heavily weighted to
                                                 (MFAT) is for Free Trade Agreements
the down-side. This is reflected in the                                                           Free Trade Agreements Under Negotiation
                                                 (FTAs) to cover 90% of goods exports by             New Zealand - EU Free Trade Agreement
weakening financial markets sentiment
                                                 2030.                                               India FTA
currently observed globally.
                                                 Currently New Zealand has trade                      RBK FTA
New Zealand’s trade policy is important
                                                 agreements with 16 World Trade                       Trade in Services Agreement (TiSA)
for the Port sector as it has the capacity
                                                 Organisation (WTO) members. This                     New Zealand - China Free Trade Agreement Upgrade
to affect imports and exports moving
                                                 evolution is the continuation of a move              New Zealand - Pacific Alliance Free Trade Agreement
around New Zealand.
                                                 away from trading with European powers               Regional Comprehensive Economic Partnership (RCEP)
                                                 to more regional trade.

                                                                                                                                                                                       8
New Zealand ports and freight yearbook 2019 | Global Perspectives

Global perspectives

Container shipping                               Long-haul mainlane trades are critical to
                                                 the overall health of the shipping
The shipping industry plays a pivotal role
                                                 industry. These mainlane trades face a
within the global economy that has been
                                                 difficult year with trade tensions between
shaped since the 1960’s by the two mega
                                                 the US, China and Europe on top of
trends of globalisation and
                                                 saturation of containerised goods in
containerisation.
                                                 Western markets.
The shipping industry is constantly
                                                 Intra-Asia growth for the first 11 months
evolving, striving for increased efficiency
                                                 of 2018 was the slowest recorded in the
through innovation with new larger ships
                                                 last decade at 3.8%.
specialised for each trade (especially
containers) and adopting emerging                Freight rates on intra-Asia trades were
technologies to boost efficiency and             steady throughout 2017-2018 but it is
improve environmental outcomes.                  worth considering what will happen to
                                                 rates should extra-Asian trades weaken.
The global container shipping outlook is
largely negative. Demand risks remain in         European containerised imports are stuck
the form of trade protectionism and              - with low demand growth of no more
slower than expected economic growth.            than 2% for the foreseeable future
Rising fuel costs and incoming sulphur           particularly if consumer behaviour does
regulations also stand to place more             not change from that observed in the last
pressure on shipping lines.                      four years.
Healthy but slower volume growth is              Higher growth rates are forecast for
forecast through 2019. Freight rates will        African and South American trades, but
remain steady with supply and demand             this will mainly be in volume rather than
balanced by a dip in the number of new           freight rates.
ships scheduled for delivery during the
                                                 Unless the costs of steaming from the
year.
                                                 International Maritime Organisation’s
Capacity deployment is becoming more             (IMO) 2020 sulphur cap are passed on
efficient due to consolidation in the            through the whole supply chain, profit
industry. This is key to a sustainable           margins in the container shipping industry
balance and freight rates that support           will be reduced, a failure to recover the
profitability.                                   costs may even result in bankruptcies.

                                                                                              9
New Zealand ports and freight yearbook 2019 | Global Perspectives

Global perspectives

Container freight trends                         The majority of Twenty-foot Equivalent
                                                                                                    Global freight task
                                                 Units (TEU) shipped on the Asia-North
Since 2000 the proportion of total global                                                                         60,000                                                                                   18.0%
                                                 America trade route are East bound,
freight that is containerised has steadily
                                                 heading from Asia to North America. This                                                                                                                  16.0%
increased and as of 2017 containerised                                                                            50,000
                                                 is consistent with China’s status as the                                                                                                                  14.0%
goods make up 15.7% of total freight
                                                 World’s dominant exporter. The West
(billion tonne-miles).                                                                                            40,000                                                                                   12.0%

                                                                                            Billion tonne-miles
                                                 bound trade between Asia and Northern
The importance of Asia (especially China)        Europe reinforces this notion.                                                                                                                            10.0%
                                                                                                                  30,000
is exemplified by its participation in the                                                                                                                                                                 8.0%
top four container trade routes.                                                                                  20,000                                                                                   6.0%
                                                                                                                                                                                                           4.0%
                                                                                                                  10,000
                                                                                                                                                                                                           2.0%
                                                                                                                       -                                                                                     -
                                                                                                                           2001    2003      2005     2007     2009    2011     2013        2015     2017
                                                                                                                           Container         Other Dry        Oil/Gas/Chemicals            Container Share (RHS)
                                                                                                  Source: The Shipbuilders Association of Japan

                                                                                                     Top trade routes
                                                                                                                  30

                                                                                                                  25

                                                                                            Million TEU           20

                                                                                                                  15

                                                                                                                  10

                                                                                                                   5

                                                                                                                   -       AS-NA     AS-NE      AS-Med       AS-ME     NE-NA       AS-SA        NE-SA      NA-SA
                                                                                                                                   West Bound      East Bound        North Bound     South Bound
                                                                                                  Source: Worldshipping
                                                                                                                                                                                                                   10
New Zealand ports and freight yearbook 2019 | Global Perspectives
Global perspectives
Consolidation The three largest alliances are:
Top 20 container lines
The top seven container shipping lines • 2M Alliance: The two largest lines, 5.0
control nearly 70% of global container Maersk (who acquired Hamburg Sud in 4.5
ship capacity in a market where 2017) and MSC formed the 2M 4.0
economies of scale are considered vital. alliance, later adding Hyundai who will 3.5
Million TEU
The continued quest for scale has seen be departing in April 2020 (38% share 3.0
the largest shipping lines form three of global containership capacity). 2.5
2.0
major alliances.
• Ocean Alliance: CMA CGM (who 1.5
These three alliances collectively control acquired APL/NOL), COSCO (who 1.0
80% of global containership capacity, merged with CSCL), Evergreen and 0.5
90% of Trans-Pacific trade and 96% of OOCL, unravelling several preceding -
KMTC
Hapag-Lloyd
HMM
SITC
QASC
CMA CGM
Wan Hai
Maersk
IRISL
COSCO
X-Press
Zim
MSC
ONE
SM
Yang Ming
Arkas
PIL
Zhonggu
Evergreen
Asia-Europe Trade. pacts (28% share of global capacity).
The benefits of alliances are many and • THE Alliance: Hapag-Lloyd, having
include the ability to capture scale without merged with UASC, formed an alliance
the need to commit significant amounts of with Yang Ming, Ocean Network 2M Ocean Alliance Independent Chartered Orderbook
Source: Alphaliner
capital or adding additional capacity to a Express (ONE) and MOL (15% of
market which is already oversupplied. global capacity).
Alliances can also improve utilisation of
The three largest Japanese lines have
vessels and increase the frequency of
recently entered into a joint venture,
services available to shippers.
commencing operations in April 2018. The
Concerns about shipping alliances include three lines, NYK Group, MOL and K Line,
barriers to entry on East-West trade operate as ONE and remain part of THE
routes and the possibility of alliances Alliance.
being used as vehicles for collusion
In further M&A activity, COSCO completed
between carriers. The immense
a US$6.3 billion takeover of OOCL in July
bargaining power in relation to ports and
2018. COSCO are now the world’s third
terminals that alliances lend to carriers
largest container line with over 430
serves to depress rates for port services
vessels and 2.5 million TEU in capacity.
and allow carriers to exert increased
pressure on ports for additional public
infrastructure.
11New Zealand ports and freight yearbook 2019 | Global Perspectives
Global perspectives
Excess capacity Evergreen will receive ten ships during
the year including six G-class 20,388 TEU
Prior to the GFC shipbuilding activity
vessels.
exceeded demand as shipping lines all
pursued the same growth strategy – Among other carriers Hapag – Lloyd, ZIM
larger, more efficient new-generation and Wan Hai have no ships scheduled for
ships. The order book peaked at an all- delivery in 2019.
time record of 170 million Gross Tonnes
Maersk, CMA CGM, ONE and Yang Ming
(GT) in 2007 (pre-GFC).
each have order books of between 30,000
More than 1.3 million TEU was delivered and 80,000 TEU in 2019.
in 2018 compared with 1.2 million in
The medium term order book remains
2017. This was coupled with a further
strong with some three million TEU to be
reduction in scrapping, resulting in an
delivered by 2021. Despite over capacity,
increase in the total fleet of 5.7% to more
shipping lines continue to invest in new
than 22.3 million TEU up from 21 million
larger ships.
TEU in November 2017.
The order book is notable for the
This supply growth was not matched by
prominence of mid-size and smaller
demand resulting in more than 628,000
carriers who are quickly adding capacity in
TEU sitting idle at the end of the year, an
the hope of leap-frogging the competition.
increase of 212,000 TEU on the same
HMM, for example, has ordered an
time in 2017.
additional 338,000 TEU comprising 12
In January 2019 the idle container ship 23,000 TEU vessels and eight 14,000 TEU
fleet stood at 561,187 TEU a fall from the ships. The larger vessels are targeted for
more than 628,000 in December 2018. delivery from Q2 2020 while the smaller
vessels will enter service from Q2 2021.
Of capacity to be delivered during the
current year, MSC leads the way with Drewery Maritime Research remains
334,550 TEU scheduled, including eight critical of the continued ordering of ultra-
23,000 TEU vessels. large ships, having identified capacity
management and continued consolidation
COSCO is also scheduled to take delivery
as the two key requirements for sustained
of 180,970 TEU in the first half of the year
liner profitability.
including six 19-21,000 TEU vessels.
12New Zealand ports and freight yearbook 2019 | Global Perspectives
Global perspectives
Scrapping While the scrapping of ships remained low
during 2018, an increase in scrapping
As new ships are delivered into a market
may well be on the horizon. The primary
with continued over capacity, scrapping
driver of an up tick in scrapping rates is
will typically increase. For example in
likely to be the IMO’s 0.5% sulphur cap
2016 an all time record of over 670,000
on fuel from 1 January 2020. Older, less
TEU was scrapped.
fuel efficient vessels will need to either
Initial forecasts were for scrapping in use Ultra Low Sulphur Fuel Oil (ULSFO)
2017 to be even higher, however or install scrubbers in order to continue
increased demand coupled with lower using heavy fuel oil (HFO).
scrap prices resulted in lower than
The cost of adding scrubbers to older and
expected volumes; only 427,250 TEU was
smaller vessels may meet or exceed the
ultimately scrapped. This trend continued
actual asset value of the ship while these
in 2018 where scrapping dropped to a
same vessels, being less fuel efficient,
seven year low of 111,200 TEU.
could be overly expensive to operate
In recent years the obsolescence of using ULSFO. If the Sulphur cap renders
Panamax ships, due to the expansion of the use of these vessels uneconomic then
the Panama Canal drove much of the their potential to be scrapped increases
scrapping activity, however the increased greatly.
value of these ships in 2018 halted this
process.
13New Zealand ports and freight yearbook 2019 | Global Perspectives
Global perspectives
Ship size The current order book emphasises the
pursuit of scale with orders for ultra-large
The first container ship was introduced in
container vessels continuing to be added.
1956. The Ideal X carried 58 containers.
MSC is expected to begin taking delivery
Within eight years the Associated
of ultra-large ships with capacities of
Steamship company had introduced ships
22,000 – 23,000 TEU from August 2019
with a capacity of nearly 1,000 TEU. Since
onwards. CMA CGM will also receive nine
then the capacity of container ships has
ships in the 22,500 TEU class from
continued to increase at a rapid rate. The
December 2019. There are also rumours
largest ships currently in service are now
that OOCL, recently acquired by COSCO,
almost 400 metres in length and have a
has ordered six ships at 23,000 TEU each.
capacity of more than 21,000 TEU.
Bunker price plays an important role in
The continuous pursuit of economies of
the economies of scale achieved by larger
scale is the rationale behind the ever
ships. The largest savings are due to the
increasing size of container ships. Larger
reduced cost of fuel per container
vessels provide cost efficiencies in fuel,
shipped. The implementation of Marpol 6
crew and greenhouse gas emissions per
is scheduled for 1 January 2020, the
container. However, there is a question as
consequences of which remain to be seen
to how long this trend of increasing ship
but are sure to impact realised economies
size can continue. For a start the world’s
of scale. It is notable that nine new CMA
shipping lanes may simply not be wide or
CGM ships are to be powered by Liquefied
deep enough to handle vessels
Natural Gas (LNG).
significantly larger than those already
under construction. Additionally, returns
to scale decline with size, with the
attractiveness of increasing vessel size
from 20,000 to 30,000 TEU being
significantly less than from 10,000 to
20,000 TEU.
14New Zealand ports and freight yearbook 2019 | Global Perspectives
Global perspectives
Bunker Price The Low Sulphur Fuel Oil required from Container Rates Financial Performance
January 2020 is forecast to be priced at
One of the most significant determinants Stagnating container rates have proved a High fuel prices and low shipping rates
up to US$650 per tonne.
of container line profitability is fuel prices. drag on shipping line profitability means that financial conditions remain
especially when coupled with rising fuel challenging for the shipping industry with
The price of bunker fuel has risen
costs. these factors reducing profitability.
significantly over the last few years.
The Chinese Containerised Freight Index Ocean Network Express (ONE) reported a
In 2015 the average price of a tonne of
(CCFI) has fallen from more than 1,400 total net loss of US$491 million in its first
bunker in Rotterdam, New York and
to 820 at present. The chart below clearly nine months of operation and is forecast
Shanghai was US$170, by 2017 this had
shows the steep fall in container rates and to lose a total of US$594 million by the
increased to between US$300 and
a more recent levelling off. end of its first year.
US$350 per tonne with prices towards the
end of 2018 exceeding US$420. Oversupply and muted demand growth Hyundai Merchant Marine also reported a
combine to keep rates low with the loss of US$720 million for 2018. This
situation showing no sign of resolving follows a net loss of over US$1 billion in
itself in the near term. 2017.
ONE and HMM are not alone with a
number of other lines experiencing similar
losses.
Bunker Price Containerised Freight Index
600 1,600
1,400
500
1,200
400
US$ per tonne
1,000
300 800
600
200
400
100
200
- -
Dec-15 Apr-16 Aug-16 Dec-16 Apr-17 Aug-17 Dec-17 Apr-18 Aug-18 Dec-18 Sep-11 Sep-12 Sep-13 Sep-14 Sep-15 Sep-16 Sep-17 Sep-18
Bunker Fuel Chinese Containerised Freight Index
Source: Eikon, Deloitte analy sis Source: Eikon, Deloitte analy sis
15New Zealand ports and freight yearbook 2019 | Global Perspectives
Global perspectives
International ports As in previous years, Chinese ports saw The global container port and terminal This is accelerating demand for terminal
increases in throughput with an average industry is nevertheless under pressure automation. At the same time, shipping
The international ports sector appears to
increase of 3.3%. The continued strength from two interrelated factors. First, larger lines or shippers may desire ports to
be in good health. Global throughput
in the US economy saw North American shipping alliances are creating more lower prices. Global consultancy Drewery
growth remains positive.
port throughput grow by 1.15%, and complex and formidable counterparties. has warned that demands for lower
Throughput growth, a key port measure, Europe by 3.9%. terminal handling charges may put future
Second, to cater for even-larger
was particularly marked across the top 20 port investment at risk, and so the ability
The figure below presents the 20 largest containerships, ports are required to
ports, averaging 4.1% for the period from to handle larger ships. The scale, cost and
ports globally by TEU. Notably ten of invest heavily in providing more capacity
2011 to 2014, then easing to 1.2% from risk of port expansion is rising.
these are Chinese ports and a total of 15 and new technology, driving up capital
2014 to 2016. According to Alphaliner, in
are from Asia, three from Europe, one expenditure requirements and operating The consolidation occurring in the
2017 global container throughput grew
from North America and one from the costs. This is true not just for major ports shipping industry is also having an effect
7.7%, before again easing to 0.7% in
Middle East. on the main trade routes which are on ports. As the alliances adjust their
2018.
required to service ultra-large container trade routes to optimise utilisation and
ships (14,000 TEU and over with future efficiencies, ports gain or lose services. In
order books of 23,000 TEU), but also Asia for example the Port of Singapore
ports on secondary routes who are faced will attract 34 weekly calls up from 29 at
Top 20 ports with a cascade of larger vessels from present. However, Port Klang in Malaysia
45 main routes that have been replaced by will have port calls fall from 11 to five and
40
35
ultra-large ships. Hong Kong Port will have only seven and
Million TEU
30 three calls on the Northern European and
25 The capital expenditure required to
Mediterranean services respectively, down
20 service these larger ships is evident in the
15 from ten and five at present.
10
fact that between 2000 and 2016 nearly
5 US$69 billion was committed across 292
- port projects.
Antwerp
Laem Chabang
Tianjin
Xiamen
Shenzhen
Guangzhou
Kaohsiung
Qingdao
Los Angeles
Ningbo-Zhoushan
SIngapore
Port Klang
Shanghai
Hong Kong
Rotterdam
Busan
Jebel Ali
Dalian
Hamburg
Tanjung Pelepas
Larger ships are segmenting container
terminals into those that can handle
larger ships versus those that are unable
to. These ships make fewer visits,
2014 2015 2016 2017 2018 creating higher peak workflows, while
Source: Annual Reports, Deloitte Analysis demanding faster handling, and
accelerating terminal obsolescence.
16In Focus
17New Zealand ports and freight yearbook 2019 | In Focus
In Focus – Low Sulphur Fuel
Low sulphur fuel • The implementation of scrubbers Refiners also have a role to play in this MSC’s current fleet comprises 523 vessels
allows ships to continue to burn situation. At their current utilisation rate, with a capacity of 3.3 million TEU. MSC is
The International Maritime Organisation
cheaper high-sulphur bunker fuel, they would not be able to produce the also installing scrubbers on its 23,000 TEU
(IMO) will enforce a new regulation,
specifically HFO, and comply with the required volumes of gas oil. If they go one new builds scheduled for delivery in 2019
Marpol Annex 6, pertaining to sulphur
new regulations; way and shipping companies the other and 2020.
levels in fuel, taking effect on the 1st of
(i.e. shift to higher production of ULSFO
January 2020. In essence, the regulation • Scrubbers require a large amount of Hapag-Lloyd is converting its Ultra Large
and MSG with shipping companies
requires a decrease from the presently capital expenditure but also have an Container Ship SAJIR to operate on LNG.
installing scrubbers, allowing them to
accepted global sulphur cap on fuel estimated high rate of return (20- When complete this vessel will be the
continue to operate using HFO) it would
content of 3.5% to a substantially lower 50%). However scrubbers may not be largest ship to operate on LNG, although
adversely affect margins. For this reason,
0.5%. This regulation has come about as a viable option for companies who it will be eclipsed by CMA CGM’s 23,000
refiners are hesitant to make the plunge
the product of heightening environmental cannot access sufficient financing; TEU vessels in 2020 and 2021.
of investing heavily in infrastructure or
concerns, specifically those resulting from
• If refiners move their production mix varying their product mix until they know CMA CGM has placed two 16,020 TEU
harmful emissions released by ships.
to being heavily focussed on Ultra Low what shippers are doing. vessels into service retrofitted with
This regulation leaves both shipping Sulphur Fuel (ULSFO) or low-sulphur scrubbers. These are the largest vessels
Holistically, the imposed changes will
companies and refiners in a peculiar marine gas oil (MSG), to meet the to have scrubbers installed.
drive up expenses and consequently lower
position – having multiple options, but no increase in demand, an uplift in price
profitability margins throughout the
silver bullet – resulting from a mismatch of HFO will likely occur, through
industry. According to the OECD, it will
of supply and demand, and uncertainty in decreased supply, negating the
cost approximately $5-$30 billion to the
where the curve will shift for different intended benefits of purchasing a
container shipping industry alone.
products post the implementation. From cheaper fuel and utilising scrubbers;
the perspective of shippers, they can: Cost wise the spread between HFO and
• The underproduction of ULSFO and
ULSFO is estimated to be approximately
• Install exhaust gas cleaning systems MSG in comparison with HFO (70% of
US$250 per tonne. The installation of
(scrubbers) on their ships; the current market), combined with
scrubbers will cost US$6-10 million per
the increased demand from shipping
• Buy compliant fuels at a higher cost; vessel.
companies attempting to comply with
or
standards, could cause the already Shipping lines have already commenced
• Ships can run on the cleaner LNG as a higher prices to increase further; and the transformation of their fleets in order
fuel source. to comply with the emissions regulations.
• Finally, the ability of shipping
All three options come with their own companies to run on cleaner LNG MSC has secured a US$429 million loan
benefits and associated challenges or depends heavily on the availability of which will be used to finance the
risks. Some of which include: LNG and bunkering infrastructure, the installation of scrubbers on 86 of its
later of which is relatively container ships.
underdeveloped.
18New Zealand ports and freight yearbook 2019 | In Focus
In Focus – Hydrogen production and refueling
Auckland’s first hydrogen Hydrogen is seen as a potential solution
production and refuelling to the port’s energy requirements, as it
facility can be produced and stored on site, which
allows for rapid refuelling and provides
In previous Yearbooks “Greenification”
greater range than batteries.
and the “Circular Economy” have been
highlighted as key challenges and The purpose built facility will produce
opportunities for port operations, with the hydrogen from tap water. The process will
continuous push for more environmentally use electrolysis to split water molecules
sustainable solutions encouraging the into hydrogen and oxygen, the latter of
consideration of new approaches. which is released into the air with the
hydrogen stored for later use. Vehicles
With 40% of emissions in Auckland
will then be able to refuel in a manner
currently attributable to the transport
similar to existing Compressed Natural
system, harnessing alternative
Gas (CNG) and Liquefied Petroleum Gas
technologies could play a key role in
(LPG) refuelling procedures. The project
meeting lower emission targets. Amongst
partners will provide technical support as
the proposed solutions is the use of
well as purchasing hydrogen fuel cell
hydrogen as a fuel source, where the only
vehicles for the project.
by-product is water.
Auckland Council is behind the project and
The Ports of Auckland, which plays a
Stephen Town (CEO) states “We’re proud
pivotal role in the national logistics
to collaborate with the Ports of Auckland,
network, has a goal to be a zero emission If this is successful with passenger trains “This could be part of the answer for our
Auckland Transport and KiwiRail on this
port by 2040. To meet this target it there is no reason that this could not be fleet of buses and harbour ferries. The
innovative hydrogen project, which is a
requires a renewable and sustainable developed into hydrogen powered freight idea of a vehicle which only produces
first for New Zealand”.
energy source for its heavy vehicle fleet, trains. water as a by-product is very exciting”.
which are difficult to power with batteries. KiwiRail’s acting CEO Todd Moyle says
Auckland Transport Chief Executive, The project is currently in the planning
“Joining forces with Ports of Auckland in
The Port has now committed to building Shane Ellison says Auckland Transport is phase, and Ports of Auckland is about to
this project will allow us to explore how
Auckland’s first hydrogen production and committed to clean technology and is very start stakeholder engagement before
KiwiRail could use this new technology as
refuelling facility. The company and its interested in the possibilities of hydrogen applying for resource consent in 2019.
we deliver stronger connections for New
project partners Auckland Council, power.
Zealand”.
KiwiRail and Auckland Transport, will
invest in hydrogen fuel cell vehicles Mr Moyle also noted that two hydrogen
including port equipment, buses and cars powered trains with a range of 1,000km
as part of the project. per tank recently have begun operating
commercial services in Germany. 19New Zealand ports and freight yearbook 2019 | In Focus
In Focus – Hydrogen production and refueling
Why Hydrogen? Global Trends and Trials
With infrastructure in place, hydrogen has • Ports globally are involved in trialling
the potential to provide a flexible clean hydrogen usage, including the Port of
energy source, which can be produced by Los Angeles, Port of Long Beach, Port
electrolysis, using on or off-grid of Honolulu, Port of Valencia and Port
electricity. of Rotterdam.
As long as the electricity utilised is from a • Global automotive manufacturers
renewable source, the hydrogen is (such as Toyota, Hyundai, Audi and
emissions free (over 80% of New Honda) have developed hydrogen
Zealand’s electricity is from renewable powered vehicles.
generation).
• Worldwide there are over 200 public
There have been extensive trials overseas hydrogen stations.
and hydrogen vehicles are currently in
• 56 fuel cell buses trialled for six years
use in the UK, USA, Japan, Korea and
in Europe.
Europe. There are also a number of
hydrogen vehicles available commercially. • Norway and San Francisco are trialling
hydrogen ferries.
Trains that are powered by hydrogen
offer the benefits of electrification without • Hyundai is launching 1,000 hydrogen
the need for major infrastructure trucks in Switzerland, Norway and
investment. Netherlands between 2019 and 2023.
Hydrogen is also fast to refuel and • Toyota has developed hydrogen
provides a greater range than batteries. powered trucks which are currently
being trialled at Port of Los Angeles.
Hydrogen, as an energy source, isn’t
restricted to vehicles. Excess electricity • South Korea is planning to replace
can be converted into hydrogen, stored 36,000 CNG buses with hydrogen
and then converted back to electricity. buses by 2030.
• Hydrogen passenger trains are in use
on German rail lines following
successful trials.
20New Zealand ports and freight yearbook 2019 | In Focus
In Focus – Smart containers
Smart Containers Maersk identifies five key customer 2. Location Tracking – The true shelf 4. Supply Chain Visibility – Customers
benefits of RCM: life of perishable goods can be can confirm that their cargo was
Shippers have long desired the ability to
determined while suppliers are also kept at the exact settings requested
actively track and manage cargo. 1. Relationship Care – By consistently
able to keep a location record in throughout the journey. This holds
Unfortunately, technological constraints meeting customer requirements for
cases of theft or tampering. all members of a supply chain
had, until recently, meant that this was the quality and timeliness of
accountable.
not possible. refrigerated cargo, shippers are 3. Safeguard Quality – Around the
able to build and maintain strong clock monitoring of power status, 5. Peace of Mind – A supplier can be
Remote Container Management (RCM)
customer relationships. temperature, humidity and confident that their customer will
allows shippers to monitor the location,
atmosphere. have no surprises when opening a
temperature, humidity and power status
container at its destination.
of refrigerated containers easily and in
real time. This technology facilitates
improved global trade in perishable
goods. Maersk is at the forefront of this
technology. Each reefer container is fitted
with a Remote Container Device (RCD),
two antennas and a mobile signal.
By monitoring the condition of containers
in real time the shipper can be notified
immediately if problems occur, for
example loss of power leading to an
increase in temperature inside the
container. The shipper will then be able to
notify relevant parties able to resolve the
problem, potentially saving millions of
dollars in cargo that might otherwise have
been lost.
21Beyond Supply Chains
The port’s role in the Digital
Supply Network
22New Zealand ports and freight yearbook 2019 | Beyond Supply Chains
The rules of the game have changed
Ports as the Supply Improving the effectiveness of the The result is an “always-on” ecosystem of Digital as a change agent
Network choreographer network is where the value proposition players that is dynamic, high-velocity and
for the port lies. delivering a continuous flow of The Supply Network concept incorporates
Ports are the hub of the Supply Network, and extends digital connectivity into the
information.
operating at the intersect where supply Supply chains have physical world. It combines information
and demand meet for a diverse range of evolved into networks This ecosystem enables a logistics
from many different physical sources to
parties. They play a significant role in environment that is more accurate and
The way goods and information are drive the physical act of manufacturing,
both the management and movement of efficient, ultimately driving greater
exchanged has been redefined. distributing and performance.
material and information flows, and a transparency and better decision making
Traditional, linear supply chains have
cluster of organisations are dependent on for all involved. This shift creates significant opportunities,
transformed into dynamic, intelligent and
ports for network choreography and and challenges, for a port.
movement cadence.
integrated Supply Networks that are This evolution creates new
driven by information and computing operating baselines Digital is now a driving force for the
On the supply side, the port authority power. Typically siloed processes have
Digital Supply Networks create new future, meaning a diverse set of solutions
provides land for rent, assets for terminal been broken down and are enabled by a
operating baselines. With the ability to and tactics can become key differentiators
operators, and services to ship owners set of diverse and powerful technologies.
ascertain information in real time, many to not only support but advance the port’s
and inbound logistics providers. Capacity,
Digital Supply Networks represent the of the latency challenges inherent in role in the network.
efficiency, reliability and support are all
evolution of supply chains; a result of the linear supply chains can be mitigated.
key for these clients. On the demand side But determining which technologies, what
changing technology landscape and
manufacturers, distributors and outbound Inefficiencies in one step can avoid being they will deliver, how to implement them,
increasing connectivity between the
forwarders seek asset security, as well as cascaded into subsequent activities. The
physical and the digital worlds. and the way in which they will support the
information traceability, time savings and network now has visibility into other
port’s overall strategy remains the key to
more. Where goods and information once moved stakeholder’s processes, and can adjust
success.
step-by-step in a supply chain with a their activities based on new found, real-
The role of the port therefore exceeds
discrete progression, advances in time information.
facilitating shipments, as they must
automation, sensors, analytics and AI
simultaneously work in several directions. With more participants, needing more
overcome this delayed action-reaction
Its competitive position is not only information, through increasingly
process.
determined by internal operational interdependent channels, weak links in
effectiveness but by its links into the the network will hold all participants back.
wider Supply Network. At the heart of this network, the port
must take the lead for everyone else
to thrive.
23New Zealand ports and freight yearbook 2019 | Beyond Supply Chains
Transformation of supply chains
Digital capabilities have transformed the traditional end-to-end supply chain into
dynamic and integrated networks. As choreographer, the port must take the lead
Traditional Supply Chain Digital Supply Networks
Synchronised
Planning
Dynamic Connected
Fulfilment Customer
DIGITAL
Develop Plan Source Make Deliver Support CORE
Digital Smart
Development Factory
Intelligent
Source: Deloitte University Press Supply
24New Zealand ports and freight yearbook 2019 | Beyond Supply Chains
Staying true to the port’s core value proposition
Ports are beginning Two paths to productivity Many factors can erode value creation, Remaining business led
the journey such as friction in trading relationships,
As the hub of the Supply Network it is When looking to the future, it is important
lack of trust between network
Digital is high on the agenda for most essential that ports are effective and to ensure that efforts remain business-led
participants, inaccurate information that
organisations, but many have challenges productive. They must deliver value to and system enabled, and not the other
drives the need for just-in-case
preparing and adapting. While adoption other network participants or risk being way around. Strategy, not technology,
investments, or unpredictable outcomes
can enable better, more informed bypassed. ultimately drives success in a digital
caused by operational failures.
decisions to support the Supply Network, world.
New Zealand ports do not have the scale
knowing where to start can often prove Ultimately, the port exists to serve the
of their global trading partners. On the Investments should therefore target
the greatest hurdle of all. complex web of stakeholders,
supply side our ports are physically and where the value proposition lies. In the
shareholders and regulators.
Ports are at the lower end of the digital fiscally restrained, while on the demand New Zealand port context, this is by
maturity curve, playing catch up with side they do not have an endless backlog A successful outcome is therefore one that leveraging insight to improve productivity
other transport and logistics leaders. of ships waiting to berth. minimises friction and supports trust and and reduce uncertainty for all involved.
The industry is taking steps toward effectiveness for all network participants.
If neither capital investment nor capacity
digitalisation, but processes remain
and demand can soak up throughput
manual and systems convoluted. In ports
inefficiencies, local players must be smart
throughout the world there is a
in their approach. Without physical scale
redundancy of transaction information,
offering a path to productivity, New
handovers are error-prone, and
Zealand ports can look to the smart
movements are plagued by inefficiencies.
use of information.
New Zealand ports are enhancing
In Digital Supply Networks, productivity
operations through technologies such as
arises through insight. Organisations
automated straddles and stacking
leverage data to make better decisions
optimisation software. This is great
that optimise performance. This is about
progress and will drive substantial
knowing what, where and when – and
operational improvements, but without a
then acting on that information to
systemic approach to digitalisation the
deliver value.
benefits will remain isolated.
To capture the full value of digital, Dealing with certainty
investment should go beyond isolated Many of the value drivers identified –
pockets to focus to a holistic, long-term capacity, reliability, efficiency and
view of the port. traceability – can be boiled down to a
common theme: the Supply Network
wanting to grow value in an uncertain world.
25New Zealand ports and freight yearbook 2019 | Beyond Supply Chains
Managing decision making via the digital twin
Being smart with Internet of Things (IoT) sensors, which
resources we discussed in Deloitte’s 2018 Ports and
Freight Yearbook, are placed throughout
Ports play in a resource intensive world.
the port’s infrastructure to generate
Resource allocation decisions don’t come
insight into resource performance.
lightly – large investments and long lead
in times are needed to procure The sensors take in all types of data:
infrastructure within a constrained water temperatures, tidal conditions, wind
environment. Owning, managing and direction and speed, loading and
maintaining the resource base adds even unloading operations, what berth space is
more complexity. To ensure a productive available and when. An algorithmic model
operating environment, ports are then parses the information and runs
constantly seeking to increase simulations to provide a granular view of
transparency, decrease cost and improve everything happening in the port.
the reliability and availability of their
resources.
Confidence in the face of
uncertainty
Adding to this challenge, the port cannot
Companies with high-value resources and
always rely on its partners. Trucks might
are processes reliant on a variety of
not turn up, documents may be incorrect,
stakeholders can reap the greatest
or weather might delay a ship’s arrival.
advantage from digital twins.
Decisions cannot be made assuming all
will stay constant. From scenario testing of weather on
operations, to evaluating the impact of
What if there were a way to design and
various stacking layouts, to simulating
test performance under different
thousands of response options for supply
scenarios without the significant capital
chain disruptions, developing a digital
outlay? Digital Supply Networks enable
twin can increase the reliability and
ports to explore this uncertainty.
availability of the port’s assets, and drive
The digital twin faster, more accurate decision making.
Digital twins are virtual replicas that Ultimately, digital twins enable greater
simulate the port’s physical resources confidence in the face of uncertainty.
based on real-world, real-time
information.
26New Zealand ports and freight yearbook 2019 | Beyond Supply Chains
Trust and efficiency through blockchain
The importance of It establishes a digital baseline for
document management documentation, allowing exporters,
forwarders, carriers, customs, ports and
Document management remains an
importers to collaborate in near real-time
ongoing challenge in the industry. Moving
through a single source of truth that is
goods requires a string of paperwork,
secure and traceable.
processing, and lengthy verifications
across buyers, sellers, forwarders, If we think of traditional supply chains as
customs and of course the port itself. a cycle of transactions, blockchain at its
Significant resources are tied-up on most basic is a mechanism to share
manual, error-prone documentation and transactional information between parties.
bureaucracy – estimated at one fifth of It acts as database that records,
the actual container transportation cost. replicates and stores information on a
network that is visible only to trusted
In addition to time and cost inefficiencies,
parties who must validate the transaction
this friction erodes trust in the Supply
before it is recorded. Each transaction, or
Network. Shipping involves many hand-
‘block’, is chronologically added to the
offs with little transparency into who is
prior one, and so on.
doing what, when and where. Trust breaks
down further due a lack of accountability Going beyond transactions
when goods arrive damaged, without the
A key evolution for Supply Networks are
correct paperwork or worse, not at all.
smart contracts. These extend
Ports are the centre point where cargo is
blockchain’s utility from simple record
transferred across different transport
keeping to automatically implementing
modes and logistics routes, meaning trust
terms of multiparty agreements.
is fundamental to their value proposition.
Smart contracts encode the business rules
Blockchain can aid the ever-present need
and contract parameters to trigger the
for efficiency and trust.
sequence of contractual actions.
Worthy of the hype?
The result is a method by which parties
Blockchain attracts hype and scepticism in can agree upon terms and trust that will
equal measure, but its application in be executed automatically, with reduced
shipping is very real. risk of error or manipulation.
27New Zealand ports and freight yearbook 2019 | Beyond Supply Chains
Trust and efficiency through blockchain
Parallels between Tracking focuses on capturing the state of
blockchain and DSNs the asset in real-time, or at Maersk Line, IBM and TradeLens documents, sensor readings and a
predetermined location or conditional whole host of other information.
The evolution of linear supply chains to Many view digitisation as the future of
milestones.
Digital Supply Networks creates the right global trade; technology will break The platform provides end-to-end
environment for decentralised, distributed Traceability focuses on capturing the down barriers and enable the easy and visibility across shipping corridors, real
technologies such as blockchain. history of the asset, often to pinpoint a secure flow of information between all time access to information that will
flaw or fault, but also for auditability and parties in the supply chain. enrich port collaboration and enhance
The breakdown of traditional action-
compliance purposes. terminal planning. Furthermore,
reaction siloes mirrors the value creation To this end, Maersk, in tandem with
TradeLens will enable better informed
this technology offers, as it enables Provenance concerns transfer of custody, IBM, has launched TradeLens – a
risk assessments and information
information to move seamlessly across where reassurance about counterfeiting, blockchain based ecosystem that
sharing.
the network. It places trust in the overall point of origin, or lineage is required. connects trade participants across the
process through transparency and shared supply chain. TradeLens is intended to By using blockchain, TradeLens is able
If blockchain’s traits offer a single source
accountability as goods move from A to B. solve the highly inefficient paper based to address the fragmented nature of
of truth, smart contracts extend the
processes that currently characterise the supply chain. Blockchain is a
The benefits for shipping ability of blockchain to automate approval
global trade. The existing system sees shared ledger where a network of
workflows and customs clearings that are
Blockchain can ease the uncertainty of data trapped in organisational silos, participants maintain a distributed and
prone to lag and error – thus reducing
moving cargo across borders, helping to with varying perspectives on the state permissioned ledger of documents,
cost and time to settlement to drive
instill trust in the port’s activities among of a transaction and a clearance events and approvals. The ledger is
greater confidence across the network.
network participants. process that is easily subject to fully auditable as each change creates
fraudulent activity. a new immutable block. Only parties
Shippers have a range of assets in motion
participating in a relevant consignment
at any given time. Knowing where these In contrast, TradeLens will bring
have permissioned access and are able
assets came from, where they are, and together all parties from traders,
to submit, edit or approve relevant
what refinements to each are made along freight forwarders and ocean carriers
data. Information can only be changed
the way is critical to the effective running to ports and terminals, customs and
if endorsed by all parties to the
of an organisation. As such, the other government authorities in a
consignment.
application of a blockchain layer can help blockchain platform that provides a
in the management of asset tracking, secure permission and identify based 90+ companies involved in sea port
traceability and provenance. framework. logistics have joined the platform,
including 20+ port or terminal
Supply chain information will be able
operators.
to be shared seamlessly in real time.
This includes data on shipping
milestones, cargo details, trade
28New Zealand ports and freight yearbook 2019 | Beyond Supply Chains
Where to from here
Is the future really But there are a host of next big things out Instead, take an iterative, targeted Start small
upon us? there, and just because you can invest approach that addresses how to do the
Consider ways to make the transition a
doesn’t mean that you should. What’s port’s core role, better. Digital isn’t
The rapid rise of digitalisation may seem manageable and realistic one that
needed is for the value proposition to be achieved by throwing money at point
dizzying, but what were once considered acknowledges the existing landscape
made explicit and, wherever possible, solutions, so focus on building key
fringe innovations are now largely proven, constraints. It’s not about big-bang
quantifiable. themes of value that together will
or even standard, capabilities for many. transformation.
enable systemic gains.
Failing to build these tools can mean the The building blocks It often makes sense to start with smaller
Supply Network leaves the port behind. for success Think big stakes, where the vision can be tested
For example, the digital twin is reliably While many leaders understand the When you do decide the time is right, and refined with fewer consequences.
increasing asset uptime and availability, changes being brought about by digital, work with port stakeholders and Selecting complementing projects at the
leading to positive impacts within the first they may not be prepared to fully harness network participants to identify a shared ‘edge’ can provide greater latitude for
year. Typically unplanned downtime the benefit from those changes. The how vision where digital enables the port to building digital capabilities, and can help
decreases and maintenance costs shrink tends to be less clear. drive effectiveness and value for all. to balance the risk and reward debate.
in a matter of months, labour costs are Quickly set ambition and chart a path to
Often, the biggest challenge around Prioritise those areas that address the
reduced and additional benefits observed. success with a deliverables roadmap.
digital is getting the basics right. This core value of the port and the needs of
In another example, blockchain is actively
includes integrating old systems, Linking value to offerings that are, or the Supply Network.
being deployed within supply chains, in
streamlining processes, and keeping could be, used in the market is a key
various ways and at various levels. Its
information secure. It’s important to take next step. Understand where existing
Act fast
benefits have been well documented
stock of where you are. Know what efforts can be enhanced, new ideas can Don’t wait for perfect. Establishing a
across multiple industries, and Maersk's
technologies are being used, by who, to be brought to light, and explore the competitive advantage requires a
TradeLens platform is a case in point.
achieve what specific goals. potential of new technologies and willingness to join the fray, but do so
Organisations can choose from many techniques. quickly or the market will leapfrog you.
Don’t treat the current IT landscape as a
successful, real-world use cases to learn
constraint – while many cross-sector As you imagine the digital path ahead Recognise that initial investments may
and build a convincing case for
organisations may not have cutting-edge and build out your roadmap, consider serve as learning opportunities rather
investment, then develop a model for
core systems they are successfully the impact new ambitions and than be truly transformational. This is a
their own efforts. Examining how others
undergoing the digital journey. Through technologies may have on your current journey. Small successes serve as building
have scaled these types of capabilities
integration layers that act as an and future organisation, people, blocks and proof points, leading to a
into company-wide solutions can help
intermediary, modern technology enables processes and systems – only through greater willingness to take on more as the
inform a target path for investment.
functionality to be built around legacy an end-to-end view of the operating port moves up the maturity curve. As the
systems. In other words, you don’t have model will you ensure that efforts port progresses and can demonstrate
to reinvent the core to start the journey. become systemic and not isolated. success to its stakeholders, new ways of
working that drive greater value will
emerge.
29You can also read