CLEVELAND CLIMATE ACTION PLAN - 2013 BUILDING THRIVING AND HEALTHY NEIGHBORHOODS
←
→
Page content transcription
If your browser does not render page correctly, please read the page content below
CLEVELAND
CLIMATE            ACTION         PLAN
BUILDING THRIVING AND HEALTHY NEIGHBORHOODS

                  2013
CONTENTS

   Acknowledgements                                 4
   Mayor Jackson’s Letter                           5
   Introduction                                     6
         Climate Change in a Nutshell               7
         The Business Case for Action              11
         Climate Action and Economic Development   12
         The Role of Cities                        16
   Building a Thriving & Resilient Cleveland       18
         How the Plan was Created                  19
         Cleveland’s Carbon Footprint              19
         The Plan’s Framework                      22
   1. Energy Efficiency & Green Building           28
   2. Advanced & Renewable Energy                  40
   3. Sustainable Mobility                         48
   4. Waste Reduction & Resource Conservation      56
   5. Sustainable Land Use & Clean Water           62
   6. Community Engagement & Public Health         72
   Next Steps: A Role for Everyone                 82
   Glossary                                        84
   End Notes                                       85

   *See pages 26 - 27 for a summary of all
   climate actions!

                                                        2
“ This implementation plan is a major step in an informed
      and coordinated effort to ensure a healthy, economically
      resilient, and secure community that is the vision of the
      Sustainable Cleveland 2019 initiative.”
      - Mayor Frank G. Jackson

ACKNOWLEDGEMENTS
The Mayor’s Office of Sustainability would like to thank City staff and Green Team members, the Sustainable
Cleveland 2019 Stewardship Council, and the following members of the Climate Action Advisory Committee who
participated in the planning process.

                                                                                                              3
FIGURES & TABLES
Figure 1: Model of the natural greenhouse gas 7
effect
Figure 2: Historic Carbon Dioxide and Temperature 8
Fluctuations
Figure 3: Migrating Temperatures 8
Figure 4: Urban Heat Island Profile 9
Figure 5: Sustainable Cleveland Celebration Years 17
Figure 6: City of Cleveland limits 20
Figure 7: GHG Inventory Categories 20
Figure 8: GHG Emissions by Sector 21
Figure 9: GHG Emissions by Fuel Source 21
Figure 10: Mitigation-Adaptation Connection 23
Figure 11: Reduction Wedge Diagram 24
Table 1: Cleveland’s Climate Action Plan at a 26—27
Glance
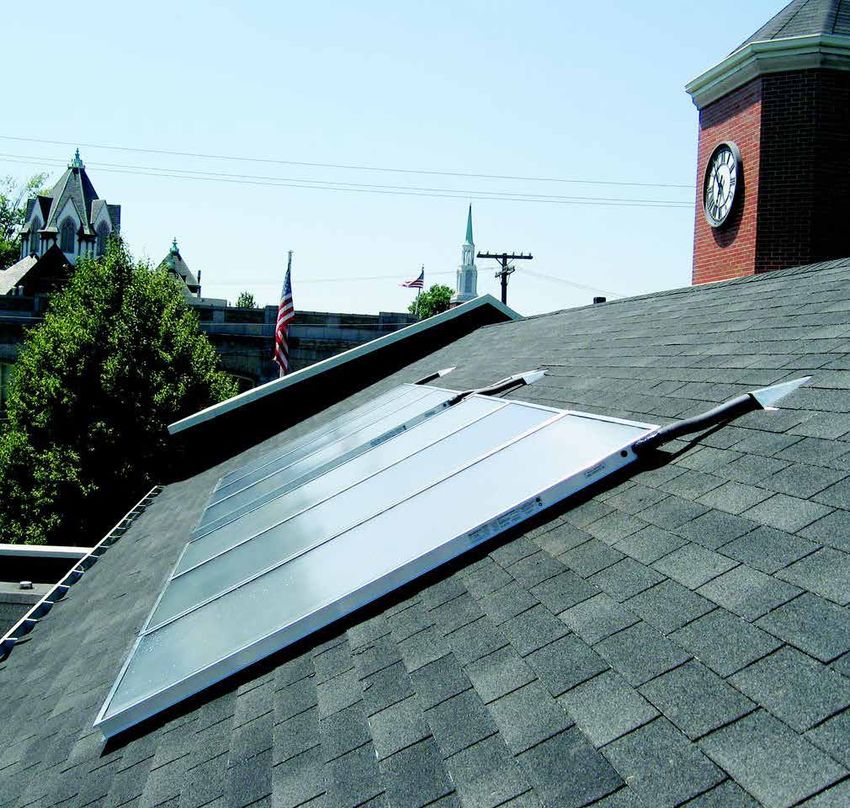
Figure 12: Architecture 2030 Challenge - Existing 31
Buildings
Figure 13: Architecture 2030 Challenge - New 31
Buildings & Major Renovations
Figure 14: Cumulative Capacity of Renewable Energy 41
Facilities in Northeast Ohio
Table 2: Stakeholder Greenhouse Gas Reduction 74
Goals
DRAFT 2 4
MAYOR JACKSON’S LETTER

                                  Dear Friends,
                                  The global increase in greenhouse gas emissions has created social,
                                  economic, budgetary, health, ecological and security impacts for cities
                                  across the country, prompting local governments to plan differently
                                  for the future. In 2006, I signed the U.S. Mayor’s Climate Protection
                                  Agreement, indicating that the City of Cleveland takes climate change
                                  seriously.
                                  Taking action around climate change—reducing greenhouse gas
                                  emissions while at the same time planning for adaptation and
                                  resilience—integrates many of the sustainability initiatives we
                                  are working on in municipal government and as a community.
                                  The Cleveland Climate Action Plan is designed to build off of the
                                  Sustainable Cleveland 2019 Action and Resources Guide and the
                                  annual sustainability summits.
I would like to thank the 50-member advisory committee, the Sustainable Cleveland Stewardship
Council, and dozens of community members and working group members from business, government,
nonprofit, and institutional sectors for co-creating an actionable response to climate change that is
built upon collaborative problem solving.
This plan is about much more than climate change. It provides opportunities for Clevelanders now, and
into the future. There are 33 actions in this plan that strengthen our economy, clean our environment,
and improve the health and wellness of Clevelanders. Whether it’s planting trees, building green,
creating healthier transportation options, or reducing waste and recycling, we can increase the
livability of our neighborhoods and enhance the quality of life for all Clevelanders. By working together,
we will:
• Educate Clevelanders to make smart, sustainable choices at home, at work, and in their community
• Create healthier, more comfortable living and working environments
• Reduce costs for homes, businesses, schools, and government
• Create jobs by strengthening our economy
• Improve air quality, water quality, and public health
We can achieve this plan. It requires a commitment not only from government but also from civic
leaders, individuals, businesses, institutions, and neighborhoods throughout the City of Cleveland.
While this plan centers on the City of Cleveland, it requires a broader community effort. We look
forward to collaborating with communities across Northeast Ohio to enable the regional prosperity we
all seek.
While access to fresh water and a temperate climate make Cleveland better positioned for increased
heat and a changing climate compared to many cities, there is much we can do to improve the city’s
resilience. By focusing on the strategies that reduce greenhouse gas emissions while at the same
time creating conditions for a sustainable economy, a healthy community and a Cleveland resilient and
adaptable to changes in climate, we are building a thriving green city on a blue lake.
Sincerely,
Mayor Frank G. Jackson
                                                                                                         5
INTRODUCTION

Someday, our children, and our children’s children, will look
at us in the eye and they’ll ask us, did we do all that we could
when we had the chance to deal with this problem and leave
them a cleaner, safer, more stable world?
– President Barack Obama’s Climate Speech, June 25, 2013

                                                                   6
CLIMATE CHANGE IN A
NUTSHELL
Taking action around climate change is a key              burning of fossil fuels - such as oil, coal, and natural
component of the Sustainable Cleveland 2019               gas - to produce energy for heating and lighting our
initiative. We can reduce greenhouse gas emissions,       homes, running our vehicles, and keeping businesses
make our neighborhoods more resilient against the         and factories operating. Deforestation, industrial
impacts of climate change, and grow the economy by        processes, and some agricultural practices also emit
integrating sustainability into the City of Cleveland’s   GHGs into the atmosphere.
municipal operations, our residents’ lives, and the
priorities of our corporate and institutional partners.   GHGs act like insulation around Earth, trapping heat
                                                          and energy in the atmosphere and causing the Earth
SCIENCE OF CLIMATE CHANGE                                 to warm. This phenomenon is called the greenhouse
                                                          effect. It is natural and necessary to support life on
Over the past century, human activities have              Earth. The excessive buildup of GHGs, however, is
released large amounts of carbon dioxide and              changing the Earth’s climate, resulting in largely
other greenhouse gases (GHGs) into the Earth’s            negative consequences on human, environmental, and
atmosphere. Most of these GHGs have come from the         economic health.

Figure 1: Model of the natural
greenhouse gas effect
(Source: IPCC i)

   Global warming refers to the recent and ongoing rise in global average temperature near Earth’s surface.
   It is caused mostly by increasing concentrations of GHGs in the atmosphere. Global warming is causing
   climate patterns to change. However, global warming itself represents only one aspect of climate change.
   Climate change refers to any significant change in the measures of climate lasting for an extended period
   of time - including major changes in temperature, precipitation, or wind patterns - among other effects -
   that occur over several decades or longer.

                                                                                                                     7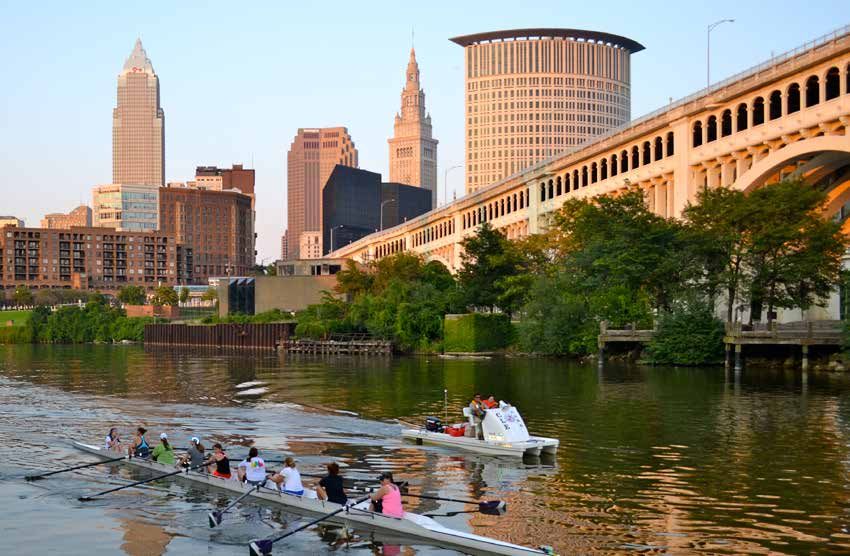
Figure 2 below illustrates how the Earth’s surface                           that time additional record warm years have occurred,
temperature (red line) is linked to carbon dioxide                           including 2012, which was the warmest year on record
levels (blue line), indicating that as CO2 levels                            in Cleveland. Sea levels have also been rising, and the
increase, so does the Earth’s surface temperature.                           observed annual coverage of the Earth’s surface in
The global atmospheric concentration of CO2                                  snow and sea ice have shrunkiii. This warming trend in
increased from a pre-industrial value of about 280                           the Midwest is illustrated in Figure 3 below. Projected
parts per million (ppm) to 379 ppm in 2005ii and                             changes in summer average temperature and rainfall
surpassed 400 ppm in 2013. This trend is evident in                          for Illinois and Michigan (shown in the figure) indicate
the right side of the graph.                                                 that summers in these states will feel progressively
                                                                             more like summers currently experienced by states
According to the Intergovernmental Panel on Climate                          to their southwest under both higher (red) and lower
Change (IPCC), an international body of climate                              (yellow) future emissions scenarios. In other words,
scientists, the period from 1995 to 2006 ranked among                        parts of the Midwest are projected to feel like Texas by
the 12 warmest years on record (since 1850). Since                           the end of this century unless we act.

Figure 2: Historic Carbon Dioxide and Temperature Fluctuations (Source: IPCC)

Figure 3: Migrating Temperatures (Source: Union of Concerned Scientistsiv)

                                                                                                                                        8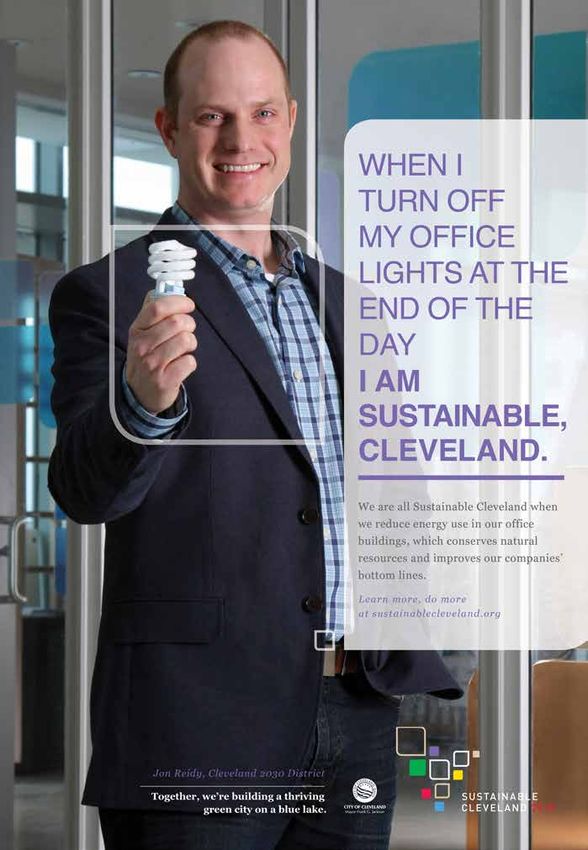
In Cleveland, one key impact of climate change are                           natural land cover with pavement, buildings, and other
worsened heat islands, characterized by urban air                            infrastructure. As an example, see the photo below
and surface temperatures that are higher than nearby                         of a parking lot in downtown Cleveland’s Warehouse
rural areas (see Figure 4 below). Many urban areas                           District. Heat islands can affect communities by
have air temperatures up to 10°F (5.6°C) warmer than                         increasing summertime peak energy demand, air
surrounding areas with open land and vegetation.                             conditioning costs, air pollution, heat-related illness
Heat islands form as dense built-up areas replace                            and mortality.

Figure 4: Urban Heat Island Profilev (Source: Clean Air Partnership)

Pavement and buildings contribute to the urban heat island effect, while trees help reduce it (Warehouse District) (Photo: David Beach)

                                                                                                                                          9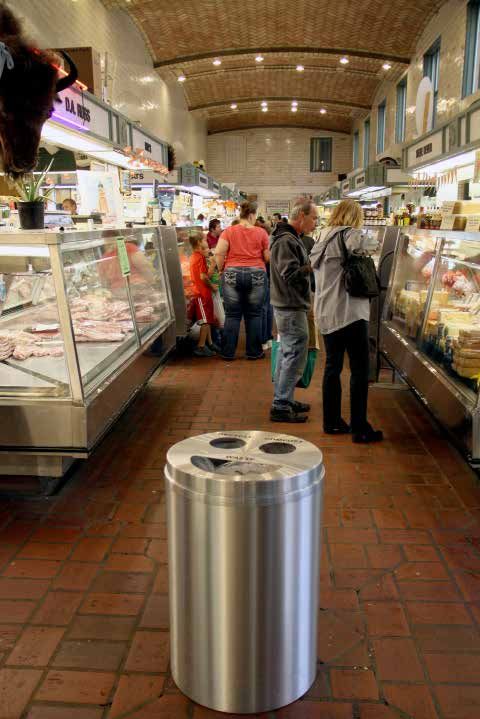
Doan Brook combined sewer overflow event (Photo: David Beach)   Lake Erie shoreline erosion (Photo: David Beach)

WHY CLIMATE ACTION MATTERS IN CLEVELAND                         •   Stress on wetlands

According to the U.S. Environmental Protection                  •   Increased water-based transportation costs;
Agency, annual temperatures in the Midwest,                         Declines in ice cover will continue to lengthen the
including Northeast Ohio, have increased over the                   commercial navigation season.
last several decades. Heat waves are becoming more
frequent and cold periods are becoming rarer. Snow              •   Reduced hydropower generation
and ice are arriving later in the fall and are starting
to melt earlier in the spring. Heavy downpours now              •   Increased heavy precipitation events and combined
occur twice as frequently as they did a century ago.                sewer overflow, increasing flooding risk
These trends are likely to continue under future
                                                                •   Earlier spring snowmelt and peak runoff,
climate change: average summer temperatures are
                                                                    increasing flooding risk
projected to increase by 3°F over the next few decades
and could increase by over 10°F by the end of this              Additional climate impacts to biodiversity and
centuryiv.                                                      ecosystems in Northeast Ohio include:
Unless we act, climate change is likely to have wide-           •   Shift in the distribution and range of species,
ranging impacts on people and the environment                       including trees such as sugar maples and
in Northeast Ohio. Generally, these impacts would                   hemlocks moving northward
exacerbate existing management challenges by
putting additional stress on vulnerable populations,            •   Loss of species not able to adapt to changes, and
infrastructure and ecosystems.                                      facing increased competition from invasive species
Anticipated impacts on public health include:                   •   Decline in beach health and more harmful blooms
                                                                    of algae
•   More heat-related stress, particularly among
    the elderly, the poor, and other vulnerable                 •   Longer growing seasons over the next few
    populations; Fewer extreme cold-related health                  decades will increase yields of some crops, but
    risks                                                           benefits will be offset by occurrence of extreme
                                                                    events such as heat waves, droughts, and floods.
•   Greater risk of vector-borne illnesses (e.g., West
    Nile)                                                       Finally, climate change is likely to upset economic
                                                                activities in the Great Lakes. For instance, in a warmer
•   Reduced summer air quality in urban areas                   climate, evaporation from the lakes is projected to
    due to increases in ground-level ozone and fine             increase, which could cause water levels to drop by
    particulates                                                one to two feet by the end of the century. Although
                                                                such a drop in water levels could benefit public beach
Climate change will also place additional stress on
                                                                access, it could adversely affect coastal ecosystems.
water resources, a key lifeblood in Cleveland and
                                                                Lower water levels would also make some key
Northeast Ohio. Impacts include:
                                                                shipping channels too shallow for fully loaded ships,
•   Warmer water temperature in lakes and rivers                requiring more dredging. On the other hand, warmer
    causing increased evaporation                               temperatures may have a positive impact on shipping,
                                                                as ice-free seasons lengthen. The net impact of these
•   Decreasing Great Lakes water levels, including              changes, however, is likely to impose costs on the
    Lake Erie, the shallowest of the lakes                      Midwest through increased shipping, maintenance,
                                                                and repair costs, as well as lost recreation and
•   Increased competition for water                             tourism.
                                                                                                                           10
THE BUSINESS CASE FOR ACTION
Many institutions, regional organizations, and economies. As one example, between 2005 and 2011,
companies in Northeast Ohio are already embarking Fort Collins, CO, implemented a number of programs
on efforts to reduce their GHG emissions associated and policies identified in its Climate Action Plan.
with energy use, transportation, solid waste and other While population increased 13%, the City reduced its
areas. While reducing GHG emissions is a driving GHG emissions by 11% and simultaneously grew its
force for many of these efforts, there are many other economy by 4% while being recognized nationally for
benefits to individuals, organizations, and Cleveland’s its livability and business-friendly climate.
neighborhoods. In fact, even if climate change was not
a factor, taking the actions laid out in this plan would The goals and actions contained in this plan seek to
still make sense from an economic, environmental, reduce Cleveland’s dependence on non-renewable
and equity perspective. The fact of climate change fossil fuels, prioritize sustainable uses of land and
simply adds urgency to acting now. water, reduce waste, and support neighborhood
progress. If implemented, these actions will not only
Dozens of cities have begun to see firsthand that the reduce Cleveland’s GHG emissions, but also enhance
implementation of climate mitigation strategies, such its economic vitality, resilience, and viability as a
as improving building energy efficiency and public healthy, livable city.
transit, have a positive impact on local and regional
KEY BENEFITS OF TAKING CLIMATE ACTION
• Local job creation and economic development
• Reduced utility and operational costs for homes, businesses, and government
• Improved risk management and resilience to the impacts of climate change
• Healthier, more comfortable homes
• Improved air quality, public health, and quality of life
• Improved water quality in Lake Erie and other habitats
• A more educated and empowered population with the tools to take action at home, at work, and
in their community
11CLIMATE ACTION AND ECONOMIC DEVELOPMENT
Cities across the country are experiencing the economic benefits of taking climate action, especially as a
result of investing in energy efficiency and advanced and renewable energy. Cleveland has the potential
to achieve similar or better results as other cities because of the opportunities to improve building
efficiency and to transition from coal to more sustainable sources of energy.
Cleveland residents and businesses spend approximately $1.7 billion/year, or 1.6% of the region’s Gross
Domestic Product, on utilities and transportation costs. These costs lead to 60% of the community’s
greenhouse gas emissions. Money spent on electric, gas, and water utility bills, or paid at the gas pump,
could spur the economic growth of the region. For example, the actions outlined in this plan for Energy
Efficiency & Green Building alone would save residents and businesses an estimated $170 million/year
by 2030 (or $20 million/year in net savings) – effectively cutting their utility and gas bills while at the
same time investing in the creation of a more sustainable economy.
There are three major job-generating components in this plan: 1) demand related to annual household
and business utility cost savings; 2) demand related to the construction of infrastructure; and 3) demand
related to the plan’s ongoing actions.
The energy savings is significant, but the economic case is even greater when considering the multiplier
effect from households and businesses having more money to spend elsewhere. For households,
additional money translates into greater expenditure on retail goods and services, as well as potentially
greater rates of investment and saving, all of which generate demand for jobs in the existing economy.
To put that into perspective, the GDP multiplier for household spending in Cleveland is 0.65, meaning
that for every additional $1 a household spends, local GDP increases by $0.65. For businesses, annual
cost savings mean lower operational costs and potentially greater profitability, which can support local
workforce expansion, promote hiring, and potentially support increased employee earnings. All of this
means that the ripple effects of household and business cost savings are regionalized; i.e. the benefits
are felt throughout the local economy in terms of more jobs and greater earnings in all sectors.
Beyond the economic benefits of reinvesting energy cost savings,
perhaps the most compelling economic case for the plan comes
from the numbers and types of jobs the strategies in this plan will In Cleveland, where
generate. Cross-referencing the strategies in this plan with the manufacturing and
United Nations Environment Programme’s (UNEP) Green Jobs
Definition and Classification Systemvii, the investment that would professional/technical
result from implementing this plan would go largely to wages in trades account for
high-growth job sectors as well existing businesses throughout
Cleveland’s economy. Many employment sectors comprise the nearly 25% of the
green job industry, such as green building and construction trades, GDP, an investment
manufacturing, including cleantech equipment manufacturers
and their suppliers, energy, transportation, and civil engineers, such as this is really
and other professional/technical trades like environmental a reinvestment
policy experts and planners, among others. In Cleveland, where
manufacturing and professional/technical trades account for nearly in the long-term
25% of the GDP, an investment such as this is really a reinvestment stability of the City’s
in the long-term stability of the City’s existing economic
infrastructure. For example, whereas the average GDP multiplier existing economic
for the all manufacturing industries in Cleveland is approximately infrastructure.
0.83, the multipliers for industries likely to benefit most from the
strategies of this plan range from 0.88 to 0.96, meaning that the
reinvestment in local GDP is nearly one-for-one (GDP multipliers rarely exceed 1.00.). Similarly, the
job multipliers for industries related to implementation of this plan are also above-average. For every
additional $1 million spent in the Cleveland economy (any sector), demand for an average of 7.3 local
jobs is generated, but for each $1 million spent in industries related to plan implementation, demand for
an average of 9.2 local jobs is generated.
12NorTech, a regional nonprofit technology-based economic development organization serving 21 counties
in Northeast Ohio, developed an Advanced Energy Cluster roadmap to identify high growth sectors within
the advanced energy economy in Northeast Ohio. Since June 2010, NorTech’s advanced energy cluster
member companies have grown by 602 jobs. Member growth is an indication of growth in the entire
advanced energy cluster in Northeast Ohio.
Nortech has predicted market opportunity and job growth impact for four clusters of the advanced
energy economy: Waste and Biomass, Smart Grid, Fuel Cell, and Energy Efficiency. Many of the actions
in this plan rely on sectors of those clusters, including thermal depolymerization, anaerobic digestion,
smart meter software and communications, energy management systems, solid state lighting, non-
fiberglass insulation, and building efficiency systems.
Advanced Energy Cluster Market Opportunity Potential Job Impact by 2020
Waste and Biomass $7 Billion 1,820 Jobs
Smart Grid $7 Billion 1,040 Jobs
Fuel Cell $900 Million 1,650 Jobs
Energy Efficiency $17.3 Billion 2,700 Jobs
Additional economic benefit could be achieved through employee growth across the hundreds of
businesses and organizations already involved in Sustainable Cleveland 2019. Implementing this plan
could also attract new sustainable companies to the region, while accelerating the commercialization of
research from Cleveland’s top institutions into new start-ups, especially in the clean energy and clean
water sectors.
Many climate plans throughout the U.S. touch on these economic benefits in qualitative terms. Because
of the quantitative tools used to analyze and design the recommended strategies within this plan, the
economic perspective is a key component of this plan, helping to shape the pathway for reducing per
capita emissions while growing a sustainable economy.
Allen Theater Renovations (Photo: Tony Brown, The Plain Dealer)
13CARBON REDUCTION IN A STEEL TOWN
More than 35 percent of the City of Cleveland’s greenhouse gas emissions come from industrial
processes – primarily the production of steel for customers in the United States and around the globe.
According to the American Iron and Steel Institute, the American steel industry, overall, has steadily
reduced its environmental footprint and improved its energy intensity per ton of steel (a near 30 percent
reduction) in the past several decades through investments in new technologies and innovation on the
shopfloor. Still, steel production is, by its very nature, a carbon intensive process.
The City of Cleveland’s goal is to reduce greenhouse gas emissions 16 percent by 2020, and this plan
recognizes an equally important goal of increasing the efficiencies of industry. Our city’s manufacturers,
including our largest steel producer, have been important participants in our Climate Action planning
process, creating a vision for a sustainable manufacturing town.
ArcelorMittal’s Cleveland facility is the largest industrial manufacturer in Cleveland and is one of
the largest integrated steelmaking facilities in the United States, employing more than 1,800 people
and generating thousands more jobs linked to the steel industry. Located along the Cuyahoga River
in downtown’s Industrial Valley, ArcelorMittal Cleveland is recognized as one of the most productive
integrated steel facilities in the world with one ton of steel produced for slightly more than one
Electric Arc Furnace (Photo: ArcelorMittal)
14worker hour. The plant operates two blast furnaces that feed two
steelmaking facilities, a hot mill, cold mill and hot dip galvanizing The steel industry in
line, serving the automotive, appliance, service center, construction
and converter markets. North America has
been recycling steel
ArcelorMittal is focused on the importance of industrial energy
efficiency in today’s global economy, taking advantage of declining
scrap for more than
natural gas prices and rising demand for renewable energy, fuel 150 years. The steel
efficiency and energy efficiency. ArcelorMittal USA remains the industry needs scrap
first and only steel company to be named an Energy Star® partner
for energy management. The company has received this award for to produce new steel,
six consecutive years, and the Cleveland facility has contributed which ensures that
significantly to this recognition.
all steel products
ArcelorMittal’s Cleveland plant has already made significant contain anywhere
operational improvements that protect and preserve natural from 25 percent up to
resources, reduce emissions and increase energy efficiency,
including: 100 percent recycled
content.
• Since February 2010, ArcelorMittal Cleveland has captured
additional energy from recycled blast furnace gas and produces up
to 30 megawatts of electricity an hour, resulting in less electricity
being taken from the power grid. This is enough to power 30,000 homes, or the equivalent of the electric
power generated by 30 large wind turbines. ArcelorMittal Cleveland projects greater efficiency in the
coming years with up to a 10 percent increase in internal power generation forecasted at the site.
• The facility also reduced natural gas consumption at two of its boilers, reducing CO2 emissions by
approximately 3,600 tons per year – the same amount of CO2 generated by using 370,000 gallons of
gasoline.
• Twenty locomotives in the ArcelorMittal Cleveland Works Railway fleet have been equipped with
special hot start anti-idling technology, saving about 88,000 gallons of diesel fuel a year.
• ArcelorMittal Cleveland and its predecessor companies have invested more than $1 billion related
to improving water treatment systems and assisting with the restoration of the Cuyahoga River for more
than 40 years. The facility operates eight wastewater treatment plants that meet or exceed U.S. EPA’s
Best Available Technology (BAT) standards. The company partners with several organizations working to
protect and restore the health and habitat of the Cuyahoga River and Lake Erie basin and, in 2009, was
recognized by the Cuyahoga River Community Planning Organization for its stewardship of the river.
• On average, ArcelorMittal Cleveland recycles more than 600,000 tons of steel scrap each year.
• In 2012, an office recycling program was launched at the Cleveland administrative offices. Employees
participated in recycling more than 100 tons of paper, glass, plastic and aluminum in the program’s first
year.
As a global company, ArcelorMittal has a global goal to reduce greenhouse gas emissions by eight
percent. As the company strives for greater efficiency in its processes, ArcelorMittal is also innovating
sustainable solutions in its products. As our nation’s energy infrastructure evolves, demand for steel
for wind, solar and other energy applications will likely increase. And through innovative collaborations
with customers, ArcelorMittal is developing new steel products that are cost-effective, lightweight, high
quality and environmentally-friendly.
Here in Cleveland, ArcelorMittal is fast becoming a leading producer of advanced high-strength steels
uniquely designed to help automotive manufacturers meet aggressive new fuel-efficiency standards
while not compromising vehicle safety. The eco-friendly cars of the future will be made with some of the
lightest, strongest coated steels ever made, produced in Cleveland, Ohio.
15THE ROLE OF CITIES • Practice preparedness by adapting infrastructure,
public health programs, and other essential
Cities are at the front lines of climate change, and services to meet the risks of a changing climate.
Cleveland is no exception. Climate change is a global
phenomenon and half of humanity now lives in cities. It is “good government” to be proactive. Cities that
That number is expected to rise to 70 percent by 2050 plan well in the face of change are likely to be more
(Population Reference Bureau). Cities are in a unique livable, resilient, innovative, and more competitive
position to provide good quality of life with relatively places in the long run.
low levels of greenhouse gas (GHG) emissions per
person. An increasingly urbanized world has the
potential to play a central role in reducing global
emissions.
Cities also have a key role to play in adaptation:
protecting people from floods, storms, heat waves, Sustainable Cleveland 2019 is a 10-year initiative
and other impacts of climate change. Hurricane Sandy that engages the region to build economic, social
is a prime example, along with the Chicago heat wave and environmental well-being for all (www.
of 1995 that killed more than 750 people. SustainableCleveland.org). In autumn 2009, the City
of Cleveland hosted the first Sustainable Cleveland
It is particularly important for cities to make decisions 2019 Summit and announced an ambitious plan to
today that will decrease future emissions, while also transform Cleveland into a Green City on a Blue Lake
anticipating and encouraging population and economic in just ten years. Sustainable Cleveland is about
growth. Cities can do this by promoting density, taking actions now to prepare for a successful future.
public transportation ridership, walkability, bikability, The regional economy can be strong and resilient,
waste disposal, efficient energy use, and an economy with investment opportunities in growth sectors, job
creating green products and services. creation, and smart use of natural resources and
human capital. Cleveland has the natural resources,
Therefore, cities have a responsibility to address the people and the ideas to be successful in this
climate change in a proactive manner. Cities must: transformation. Sustainable Cleveland has gained
support and grown in scope, breadth and numbers
• Provide leadership on the urgency for action; since it launched in 2009. There are hundreds of
businesses and organizations now engaged. Working
• Set an example by reducing carbon emissions groups and more than 200 volunteers have worked on
from municipal operations; a wide variety of initiatives.
• Create incentives and policies that encourage Because of this work, the integration of sustainability
residents and businesses to reduce carbon and economic development is becoming a model of
emissions; how to prepare for the future, and cities across the
country are now beginning to adopt this approach.
• Promote the development of beautiful buildings,
New businesses and non-profit organizations have
streets, and neighborhoods that use less energy
emerged, new programs have been developed,
and natural resources; and
SUSTAINABLE CLEVELAND KEY MILESTONES
2005 2006 2008 2009
Office of Mayor Jackson Mayor Jackson 1st Sustainable
Sustainability signs U.S. Mayor’s signs UN Global Cleveland Summit,
Formed Climate Protection Compact Sustainability
Agreement becomes part
of Mayor’s
Office, Chief of
Sustainability
position created
16and new jobs have been created by integrating businesses, and institutions can all participate,
sustainability into the way Cleveland operates. It is either in collaboration or independently. One key
important that the broader community remain focused purpose of the CAP is to integrate each sustainability
on this tremendous opportunity to position Cleveland topic (see Figure 4) into a comprehensive whole,
for the future and that the City of Cleveland fully highlighting how they are connected and dependent
supports efforts to build a sustainable economy. upon each other. By doing so the City not only
developed community consensus regarding actions
Every year leading up to 2019, Cleveland focuses on for each topic, but also found opportunity to celebrate
one of the key areas fundamental to a sustainable successes to date. While some actions are new, most
economy. The Sustainable Cleveland Celebration build upon policies, programs, and projects that
Years are designed to be accessible to all members community leaders have been working on for years.
of the community - households, neighborhoods,
Figure 5: Sustainable Cleveland Celebration Years
2010 2011 2012 2013
Sustainable Celebration Sustainable Cleveland Municipal and
Cleveland 2019 Years Concept Center Opens, Community
Action and Announced, SustainableCleveland. Climate Action
Resources Guide Celebration Year org and Indicator Plans, 5th Annual
Developed, More Logos shared with dashboard launched Sustainability
than 20 Working the community Summit, Photo
Groups established Contest and “I
am Sustainable,
Cleveland”
campaign 17BUILDING A THRIVING
& RESILIENT
CLEVELAND
The purpose of the Climate Action Plan
is to build on successes in a coordinated
manner to achieve even more significant
outcomes. The results will be a reduction
in Cleveland’s carbon footprint of 16% by
2020, 40% by 2030 and 80% by 2050.HOW THE PLAN WAS CREATED For more information on the Sustainable Cleveland
Municipal Action Plan, visit the City of Cleveland’s
In July 2012, the City of Cleveland utilized federal website at www.city.cleveland.oh.us/sustainability.
grant money to contract with a team of experts to
create an action-oriented approach to sustainability COMMUNITY-WIDE CLEVELAND CLIMATE ACTION
and climate action planning. Working with a core PLAN
group of stakeholders and building on the Sustainable
In October 2012, the Office of Sustainability convened
Cleveland 2019 efforts to date, the team decided to
a 50-member Climate Action Advisory Committee
create two separate, but interrelated plans:
(CAAC) with representatives of leading Cleveland
1. A Sustainable Cleveland Municipal Action Plan organizations from the commercial, industrial,
(SC-MAP) for the City’s internal operations; and educational, government, and non-profit sectors to
inform and create the Climate Action Plan. The project
2. A community-wide Cleveland Climate Action Plan team convened meetings and workshops with CAAC
(CAP) for the City proper (this document) committee members and other key stakeholders
to develop and vet the objectives, actions, and goals
Both action plans include near-term objectives and of the Plan and discuss GHG Inventory findings. The
actions that largely build upon current initiatives and project team also:
achievements.
• Conducted surveys of Cleveland residents, CAAC
SUSTAINABLE CLEVELAND MUNICIPAL ACTION members, and other key stakeholders to obtain
PLAN input on the Plan;
Development first began on the SC-MAP, a • Held a Public Outreach Meeting to present
sustainability plan for Cleveland’s municipal information about the Plan and obtain feedback,
operations. Cities across the country, including the followed by a one-month public comment period;
City of Cleveland, have embraced sustainability as a and
tool to enhance the viability of their organizations and
communities, benefit from increased efficiencies and • Obtained GHG Inventory data from local utilities,
reduced operating costs, enhance social services, the City of Cleveland, Cleveland-Cuyahoga County
drive innovation, and preserve valuable environmental Port Authority, Cuyahoga County, the Northeast
resources. The SC-MAP establishes an organizational Ohio Area Coordinating Agency (NOACA), the
philosophy toward sustainability through proven Northeast Ohio Regional Sewer District (NEORSD),
policy, goals, actions, and performance metrics. While the U.S. and Ohio Environmental Protection
it is primarily intended to lay out specific actions Agency offices, and other sources.
for City staff, the SC-MAP also provides context
for the public to understand the City’s approach to
sustainability in its operations, and track the results.
The City is already practicing sustainability in many
CLEVELAND’S CARBON
areas. The purpose of the SC-MAP is to accelerate FOOTPRINT
progress in a more coordinated manner and help the
City achieve even more significant outcomes. Key to One of the first steps in developing the Cleveland CAP
this process was development of a City Green Team in was to create a baseline GHG inventory (or carbon
May 2012, consisting of representatives from across footprint) to understand the sources of emissions.
City government serving to integrate sustainability into This involved the definition of a physical boundary for
City operations. the inventory as well as identifying emissions sources
to include based on data availability and climate
The overall goal is to reduce GHG emissions from impact.
Cleveland’s municipal operations below 2010 levels
10% by 2016, 20% by 2020, and 45% by 2030. The SC- Cleveland’s city limits were selected as the boundary
MAP, also completed in 2013, includes 25 actions and for the Cleveland community GHG inventory. To
targeted goals, broken into the following focus areas: varying degrees, all activities that occur within this
boundary can be influenced by the City via policies,
• Design, Construction and Maintenance incentive programs, and educational campaigns
(Figure 6, Next Page). The inventory, therefore, seeks
• Energy to quantify the GHG emissions of all activities within
• Transportation this boundary area.
• Water There are two general categories of emissions for the
City’s inventory:
• Materials Management and Procurement
19• Sources: Any physical processes inside the The GHG inventory revealed that in 2010 emissions
jurisdictional boundary of the City that release in the City totaled almost 13 million metric tons of
GHG emissions into the atmosphere. carbon dioxide equivalent (MTCO2e). Electricity and
natural gas consumption in buildings contribute
• Activities: The use of energy, materials, and/ over 50% of total emissions followed by industrial
or services by the community that result in the emissions (36%), such as burning fuels on-site for
creation of GHG emissions, directly or indirectly. manufacturing.
Figure 6: City of Cleveland Limits (Source: Teaching Cleveland v)
Figure 7: GHG Inventory Categories vi
20The total annual emissions of almost 13 MTCO2e is equivalent to the
entire population of Cleveland commuting from Cincinnati every day
for the year. Conversely, covering an area the size of Lake Erie and WHAT IS A MTCO2e?
Lake Ontario with trees would absorb this same amount of CO2e. There are six main greenhouse
Figures 8 and 9 present the breakout of total emissions by sector and gases that contribute to climate
source, respectively. In Figure 8, note that Industrial Facilities (25%) change, and each one has a
includes electricity and natural gas consumption related emissions different level of impact. For
for the industrial sector, while Industrial Emissions (36%) includes example, the emission of 1 ton
specific industrial process emissions and large emitters’ stationary of methane (CH4) has a global
combustion sources as reported to the EPA. warming potential (GWP) 21 times
larger than that of the emission of
1 ton of carbon dioxide (CO2). To
avoid confusion between emissions
Figure 8: GHG Emissions by Sector of the different types of gases, all
emissions are converted to the
Transit Marine Vessels Solid Waste Water and common unit of CO2e, or carbon
Airline 0.4% 0.3% 1% Wastewater 1% dioxide equivalent.
Transportation
2% If a cube was built to represent
Residential one metric ton of CO2, it would
Street and Traffic On-road Buildings measure 27 feet across by 27 feet
Lights Trans. 13% deep by 27 feet high. One metric
0.5% 8%
ton equals 2,204 pounds.
Commercial
Buildings
14%
Industrial
Emissions
36%
Industrial Facilities
25%
2010 Total Emissions =
12,791,996 MT CO2e
Some equivalencies for 1 metric
ton of carbon dioxide equivalent
Figure 9: GHG Emissions by Fuel Source (CO2e) include:
• Driving 2,000 miles in a car that
averages 23 miles per gallon
(e.g., 4 round trips between
Cleveland and Cincinnati, 250
miles each way).
• Flying 3,700 miles by
commercial airline (e.g., one
round-trip from Cleveland to
Las Vegas).
21By comparison, the seven-county Northeast Ohio Objectives: The objectives summarize what the
region generated 64 million MTCO2e in 2005 as Cleveland community plans to achieve, and are used
determined in a baseline inventory conducted by as a means to organize the various Actions.
the GreenCityBlueLake Institute. As in the City,
buildings contributed the largest share of emissions Goals: The Goals embody the desired outcomes that
in the region. However gasoline and diesel used for the Cleveland community intends to achieve for each
transportation played a larger role, likely the result Focus Area. Where applicable, Goals include numeric
of differences in land uses that cause more driving targets and time frames for achieving these targets.
in suburban areas. If industrial process emissions In other instances, goals are more qualitative but still
are removed from the Cleveland inventory (because articulate a desired future end state.
this emission source was not included in the regional
inventory), Cleveland contributes around 13% to the Actions: Actions consist of specific strategies that will
region’s total emissions. be implemented to meet the Goals. It is at this level
where potential costs and benefits, both in financial
FUTURE PROJECTIONS and resource efficiency terms, are quantified to help
scale and prioritize possible actions. For any given
After the baseline GHG emissions inventory was Goal there are generally several supporting Actions. It
prepared, a business-as-usual (BAU) forecast was is indicated which sectors (Home, Work, Community)
calculated to estimate what emissions would likely are served by each Action.
be in the future if no action were taken. There are a
number of different factors that can impact future Next Steps: Specific task to complete by 2016 in order
emissions in the City of Cleveland. Population to achieve significant progress on each Action
and economic growth tend to be two of the more
significant drivers of BAU emissions projections.
Other factors such as projected development patterns MITIGATION VS. ADAPTATION
in the city and whether those patterns tend towards Mitigation: Reducing GHG emissions and lessening
infill development or a more sprawling development impacts from additional warming of the atmosphere.
pattern can impact activities such as driving habits,
and therefore impact future GHG emissions. Adaptation: Preparing for the impacts of an already-
changing climate.
Due to the high level of uncertainty associated
with this type of forecasting exercise, a flat line While Cleveland must take steps to reduce GHG
BAU forecast was assumed for now. However, this emissions and lessen impacts from additional
assumption of no growth or decline in emissions can warming of the atmosphere (Mitigation), it can also
be adjusted in the future to account for changing prepare for the impacts of an already-changing
conditions. climate (Adaptation). These adjustments can be
protective (i.e., guarding against negative impacts
THE PLAN’S FRAMEWORK of climate change), or opportunistic (i.e., taking
advantage of any beneficial effects of climate change).
The Cleveland Climate Action Plan (CAP) framework In some cases, adaptation and mitigation strategies
consists of Focus Areas, Objectives, Goals, Actions, are closely related and intertwined (see Figure 10).
and Next Steps. Each of these components is For example, planting trees and green roofs reduce
described below. emissions by taking carbon out of the atmosphere, but
they also help protect people on extreme heat days by
Focus Areas: Focus Areas are used to organize the cooling the air, thereby reducing the urban heat island
CAP actions into themes in a consistent manner. effect.
Specifically, these Focus Areas include:
Many governments and communities across the
Energy Efficiency and Green Building U.S. and around the world have already begun plans
to adapt to a changed climate. They recognize that
Advanced & Renewable Energy this will be a permanent part of planning resilient
communities. Many GHGs remain in the atmosphere
Sustainable Mobility for 100 years or more, so those already emitted into
the atmosphere will continue to warm the Earth for a
Waste Reduction & Resource Conservation
long time even if new emissions were stopped today.
Sustainable Land Use & Clean Water
Cleveland can start adapting now to the changes that
Community Engagement & Public Health are already being experienced in Northeast Ohio. This
includes measures to protect vulnerable populations,
such as the sick and elderly, anticipating needed
changes in infrastructure (e.g., stormwater capture),
22and constructing buildings to be more efficient – • Sectors: Indicates the involvement level(s) for each
particularly during hotter summers when more energy action; At Home, At Work, or In Your Community
will be needed for cooling. Examples of adaptation-
related actions are provided in the Community • Climate Change Impact: Indicates how each
Engagement & Public Health focus area. action addresses climate change; reduces GHG
emissions (mitigation) or preparing for the impacts
GOALS AND ACTIONS of an already changing climate (adaptation)
The Cleveland Climate Action Plan (CAP) contains • 2030 Reduction Potential: The annual GHG
an overarching GHG reduction goal of 80% reduction reduction by the end of the planning horizon, 2030
below baseline emissions by 2050, with interim goals
of 16% reduction by 2020 and 40% reduction by 2030. In addition to goals based on overall reduction,
These goals are comparable to the City’s targets for this Climate Action Plan recognizes the benefit of
municipal operations as outlined in the SC-MAP. tracking our city’s carbon intensity. For the purposes
Goals will be achieved through the implementation of of this plan, carbon intensity is the amount of CO2e
the 33 actions outlined in the plan. These actions are per person and per gross domestic product (GDP).
split into 6 focus areas all with the aim of reducing Because decreasing sprawl and increasing urban
Cleveland’s climate impact and preparing the City for density is key to improving efficiency and sustainability
the changing climate of the future. Goals are designed on a regional and global scale, understanding the
to be bold yet achievable. effect of increased population and economic growth
on total carbon emissions is important. As we
Figure 11 illustrates the contribution of each focus increase efficiency and improve community behaviors,
area to meeting the GHG reduction goal. For example, we expect the carbon intensity of our businesses
actions in the Energy Efficiency & Green Building and population to improve even if our overall carbon
focus area contribute 14% of the 40% reduction in footprint decreases less rapidly due to job and
GHGs by 2030 we are seeking. Table 1 provides a brief population growth.
summary of all the actions included in the Climate
Action Plan, organized by focus area and including: More detail on each action provided in the following
sections.
Figure 10: Mitigation-Adaptation Connection
23SETTING PRIORITIES
The following factors were considered when
identifying the 33 actions contained in this plan:
• Cost-effectiveness
• Quality of life and environmental benefits
• Feasibility (technical, cultural, political,
legal)
• Stakeholder support
• Tie to local priorities and current initiatives
• Potential for spurring innovation
Reducing Cleveland’s GHG emissions by 40%
is equivalent to the energy used by 410,000
homes.
Figure 11: Reduction Wedge Diagram
14
12 Energy Efficiency & Green
Building (14%)
Advanced & Renewable
10
GHG Emissions (MMT CO2e)
Energy (17%)
Sustainable Mobility (2%)
8
Waste Reduction &
Resource Conservation
6
(0.6%)
Land Use & Clean Water
(0.9%)
4
Community Engagement &
Public Health (6%)
2
CAP GHG Reduction Target
(40% below 2010 baseline
by 2030)
-
2010 2012 2014 2016 2018 2020 2022 2024 2026 2028 2030
Year
2425
Table 1: Cleveland’s Climate Action Plan at a Glance
Annual
Climate Reduction
Focus Area Objective Sectors Change Action Potential by
Impact 2030
(MT CO2e/yr)
ENERGY Action 1. Support programs and policies to retrofit 430,000
EFFICIENCY & Retrofit and renovate
residential buildings 8%
GREEN BUILDING existing buildings 1,300,000
Action 2. Support programs and policies to retrofit
commercial and industrial buildings 24%
Annual Emissions Reduction Make green building the 1,500
by 2030 Action 3. Incentivize new construction to exceed existing
standard for all new
= 2,100,000 MT CO2e building codes 0.03%
(39% of total GHG reduction) construction
Action 4. Make utility data easily accessible for residents
n/a
and businesses
Action 5. Expand use of smart grid and advanced meter 120,000
Implement technologies 2%
neighborhood-level
290,000
solutions Action 6. Expand energy and green building challenges
5%
Action 7. Build on existing green school initiatives in the
n/a
City
ADVANCED & 35,000
Accelerate renewable Action 8. Increase distributed energy installations
RENEWABLE energy use by 0.6%
ENERGY Cleveland's residents and 340,000
Action 9. Incorporate renewable energy into municipal
small businesses aggregation 6%
Action 10. Become national leader in reusing vacant land 23,000
Annual Emissions Reduction for renewable energy projects 0.4%
by 2030 Use local projects to help
= 2,100,000 MT CO2e
(38% of total GHG reduction)
meet or exceed the 67,000
Action 11. Develop a pilot offshore wind farm
utility renewable energy 1%
standards
Action 12. Utilities invest in additional projects to meet 1,100,000
renewable energy standards 20%
Action 13. Accelerate conversion of organic waste to 52,000
energy using anaerobic digestion 1%
Implement advanced Action 14. Switch to low-carbon fuel sources for district 120,000
energy technologies heating and cooling systems 2%
Action 15. Support Cleveland businesses to reduce 390,000
industrial process emissions 7%
SUSTAINABLE Action 16. Develop and promote policies and programs 150,000
MOBILITY that encourage more efficient vehicles 3%
8,500
Action 17. Encourage anti-idling citywide
Reduce congestion and 0.2%
vehicle emissions 8,700
Action 18. Expand use of carpooling and car sharing
Annual Emissions Reduction
0.2%
by 2030
= 250,000 MT CO2e 84,000
(5% of total GHG reduction) Action 19. Increase the use of public transit through
incentives and system improvements 2%
2,600
Action 20. Make biking and walking easier and safer
Create Complete and 0.05%
Green Streets Action 21. Develop a streamlined process to implement
n/a
complete and green streets policy
26Annual
Climate Reduction
Focus Area Objective Sectors Change Action Potential by
Impact 2030
(MT CO2e/yr)
WASTE Action 22. Implement programs and policies to 56,000
REDUCTION & encourage waste reduction and diversion by residents
and businesses 1.0%
RESOURCE
CONSERVATION Significantly reduce the
Action 23. Develop a cost-effective approach to
amount of waste sent to n/a
deconstructing and recycling demolished buildings
Annual Emissions Reduction landfills
by 2030
Action 24. Develop and implement a sustainable 21,000
= 77,000 MT CO2e
(1% of total GHG reduction) integrated waste and energy plan for the City of
Cleveland 0.4%
LAND USE & 1,500
Action 25. Green the zoning and land use codes to
CLEAN WATER encourage sustainable development
Encourage vibrant 0.03%
downtown and
neighborhoods Action 26. Prioritize sustainability and rightsizing in City
n/a
Annual Emissions Reduction infrastructure upgrades and improvements
by 2030
= 120,000 MT CO2e
(2% of total GHG reduction) 110,000
Action 27. Develop and implement an urban tree plan to
grow the canopy
2%
Action 28. Scale up the local food system n/a
Restore and regenerate
the natural environment 1,900
Action 29. Implement green infrastructure to capture
stormwater on-site
0.03%
9,300
Action 30. Increase water conservation and efficiency
0.2%
COMMUNITY 800,000
Action 31. Promote leading local businesses striving to
ENGAGEMENT & Organizations, meet energy and carbon reduction goals
15%
PUBLIC HEALTH neighborhoods, and
individuals become Action 32. Recognize capacity of neighborhood and
climate leaders community groups to implement climate mitigation and n/a
Annual Emissions Reduction
by 2030 adaptation initiatives
= 800,000 MT CO2e
(15% of total GHG reduction) Improve public health Action 33. Conduct climate change vulnerability
and resiliency to climate Climateassessment and integrate projected impacts into existing Annual
n/a Reduction
Focus Area Objective
change impacts Sectors Changeplans Action Potential by 2030
Impact (MT CO2e/yr)
Total Estimated Annual Reduction by 2030 (MT CO2e/yr) = 5,500,000
KEY KEY
(XX%)(XX%) Percent
Percent contribution
contribution of each
of each action
action (and
(and total
total of all
of all actions)
actions) toto meetingoverall
meeting overallGHG
GHGreduction
reductiongoal
goal of 50%
40% reduction
reductionbelow
below2010
2010baseline
baselinebyby2030
2030
TBD TBD Analysis/results thatthat
Analysis/results will will
be included in the
be included final
in the CAPCAP
final butbut
is not yetyet
is not available
available
n/a Actions for which GHG reductions and costs are not be quantified as part of the CAP
n/a Actions for which GHG reductions and costs are not be quantified as part of the CAP
Sectors: At Home At Work In The Community Climate Change Impact: Mitigation Adaptation
Sectors: At Home At Work In The Community Climate Change Impact: Mitigation Adaptation
27ENERGY EFFICIENCY &
GREEN BUILDING
FOCUS AREA 1
GOALS:
• By 2030, reduce residential and commercial energy and water use 50%, and
industrial use by 30%
• Reduce Annual Cleveland GHG Emissions 2.1 million MTCO2e by 2030
• By 2030, $170 million saved annually by Cleveland households and businesses due to
reduced energy useKEY FACTS:
THE IMPORTANCE OF ENERGY
Energy use in buildings EFFICIENCY & GREEN BUILDING
makes up more than 50% Ohioans spend roughly $4,700 per person and 11.5% of our gross
state product on energy, according to the Energy Information
of Cleveland’s total GHG Administration. These costs strain the budgets of residents,
emissions. businesses, and government. In addition, Ohio ranks sixth nationally
for the total amount of energy we use, and third nationally for the
amount of pollution we emit when generating electricity.
Energy efficiency and conservation are often the most cost-effective
approaches for reducing emissions and energy costs in buildings.
Energy consumed by residential, commercial, and industrial
buildings located in the City of Cleveland contributed to more than
50% of the City’s greenhouse gas (GHG) emissions in 2010. Existing
residential buildings represent 13% of Cleveland’s total emissions
while commercial and industrial buildings make up another 39% of
Cleveland’s total emissions.
Significantly reducing energy use in existing buildings through
efficiency projects and conservation is a critical mitigation strategy.
Efficient housing has lower utility and maintenance costs, reducing
energy poverty for low-income residents. Encouraging building design
that considers future climate impacts, such as innovative cooling and
stormwater management, is an important adaptation strategy.
The energy use intensity of Energy demand curtailment offers additional cost savings
opportunities for building owners. Demand Response is a consumer’s
Cleveland’s housing stock ability to reduce electricity consumption at their location when
is 54% higher than National wholesale prices are high or the reliability of the electric grid is
threatened. Common examples of demand response include:
averages (58% higher than raising the thermostat temperature so the air conditioner runs less
average Midwest stock), frequently, occasionally slowing down manufacturing production, or
shutting off lights - basically any action to reduce load in response to
while commercial buildings short-term high prices or a signal from the utility grid operator.
in Cleveland use 36% more
PJM Interconnection is a regional transmission organization that
energy than U.S. averages coordinates the movement of wholesale electricity in all or parts of 13
(22% higher than Midwest states and the District of Columbia, including Ohio. PJM’s wholesale
electricity markets provide opportunities for end-use customers
averages). This is partially due to realize value for reducing their demand for electricity. In PJM’s
to an older building stock in Energy Market, end-use customers participate in demand response
by reducing their electricity use either during an emergency event or
Cleveland. when marginal prices are high on the PJM system.
29FOCUS AREA 1
ENERGY EFFICIENCY & GREEN BUILDING
OBJECTIVE: RETROFIT
AND RENOVATE EXISTING KEY BENEFITS OF ENERGY
BUILDINGS EFFICIENCY & GREEN
Since building energy use makes up more than 50%
BUILDING
of the total GHG emissions for the City, making the • Cost savings
existing building stock as efficient as possible is a top
priority for the CAP. • Less risk from energy price
volatility
ACTION 1: SUPPORT PROGRAMS AND POLICIES TO
RETROFIT RESIDENTIAL BUILDINGS • Increased property values & rental
rates
• Reduction in energy poverty
2030 Emissions Reduction Potential: 430,000 MTCO2e
= 32,000 Cleveland homes. • Healthier, more comfortable
homes
There are great opportunities to significantly
improve the energy efficiency of existing homes • Local job creation and economic
through improved insulation and air sealing, more development
efficient heating and cooling equipment, and efficient
appliances and electronics. Efficient buildings reduce • Leadership and recognition
strain on power distribution systems, are more
resilient to increasing utility costs, and are less • Education and awareness
affected by extreme weather events.
CLEVELAND ALREADY HAS SEVERAL
ACTION 2: SUPPORT PROGRAMS AND POLICIES
EXISTING PROGRAMS TO BUILD ON, TO RETROFIT COMMERCIAL AND INDUSTRIAL
INCLUDING: BUILDINGS
• Home Weatherization Assistance
Program
2030 Emissions Reduction Potential: 1,300,000
• Warm & Healthy Homes MTCO2e = 97,000 Cleveland homes.
• House Warming and Good Cents
(Dominion) The energy efficiency of existing commercial and
industrial buildings can be improved through
• Cleveland Energy$aver Program insulation, building envelope, and lighting upgrades,
more efficient heating and cooling equipment,
• Efficiency Smart Program offered efficient motors and drives, and efficient processes
by Cleveland Public Power and equipment. Efficient buildings cost less to
operate, adding directly to bottom-line profits and the
• FirstEnergy programs (e.g., strength of local businesses.
appliance turn-in, lighting and
HVAC incentives, traffic signal)
30You can also read