10 Climate Science 2019 - Future Earth
←
→
Page content transcription
If your browser does not render page correctly, please read the page content below
10
New Insights in
Climate Science
2019
GLOBAL                CARBON
                                       project

                                        Future Earth Health Knowledge-Action Network

Title: 10 New Insights in Climate Science 2019
Produced by: Future Earth and the Earth League
Layout and graphics: Jerker Lokrantz/Azote

Printed on recycled, FSC-certified paper.

Please cite this report as: Pihl, E., Martin, M.A., Blome, T., Hebden, S., Jarzebski, M.P., Lambino, R.A., Köhler, C., Canadell, J.G., Ebi,
K.L., Edenhofer, O., Gaffney, O., Rockström, J., Roy, J., Srivastava, L., Payne, D.R., Adler, C., Watts, S., Jacobsson, L., Sonntag, S., 10
New Insights in Climate Science 2019, Future Earth & The Earth League, Stockholm, 2019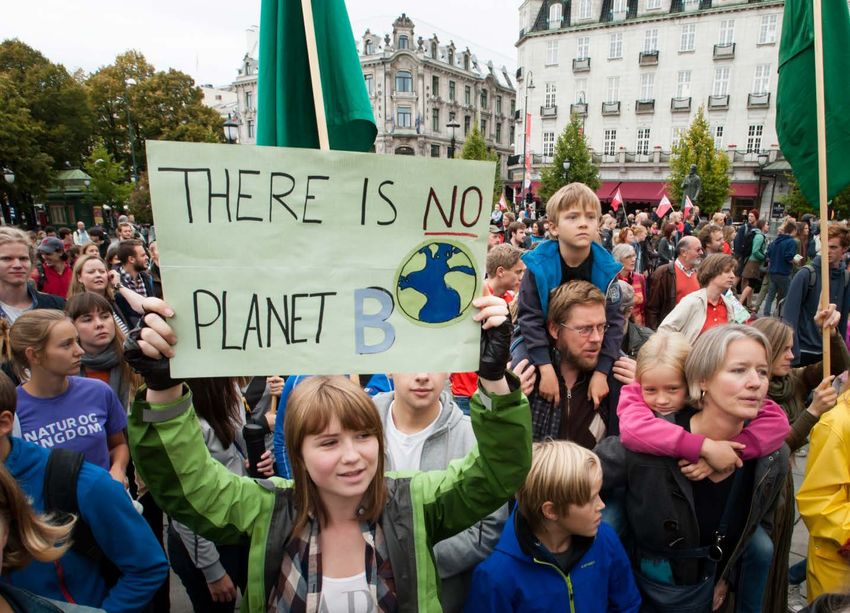
Content
Introduction                                                                            4
1. The world is not on track                                                             5
2. Climate change is faster and stronger than expected                                   8
3. Climate change leaves no mountain summit behind                                      11
4. Forests are under threat, with global consequences                                   14
5. Weather extremes – a “new normal” in 2019                                            17
6. Biodiversity – threatened guardian of earth’s resilience                             20
7. Climate change threatens food security and the health of hundreds of millions        22
8. Most vulnerable and poor hardest hit by climate change                               24
9. Equity and equality pivotal to successful climate change mitigation and adaptation   26
10. Time may have come for social tipping points on climate action                      28
References                                                                              31
Credits                                                                                 37

                                                  3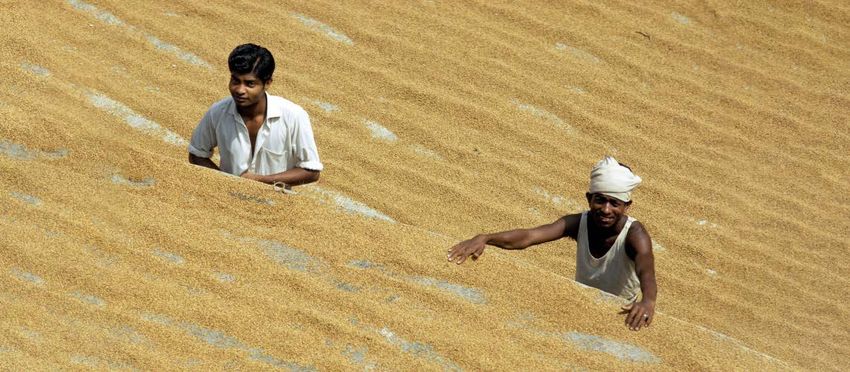
Introduction
The world continues to emit greenhouse gases while
our planet’s climate is changing faster than ever.

This document will let science speak. Many                   As these spread and replicate, social systems could
different scientific assessments and new research            pass a threshold – so-called social tipping points –
findings have revealed the uncomfortable result              after which changes rapidly accelerate. Although
that many risks with global warming may have been            the science around social tipping points is still
underestimated and that our planetary machinery              nascent, but rapidly evolving, this report will also
is, if anything, changing more rapidly than projected.       highlight the phenomena around climate-induced
In 2019, the Intergovernmental Panel on Climate              social movements that are growing in frequency and
Change alone published two landmark reports: on              scale. There is rich evidence of social movements,
“Climate Change and Land” and “The Ocean and                 with clearly defined objectives, bringing about
Cryosphere in a Changing Climate”. The world’s               transformational changes throughout history. Such
leading climate science organizations have joined            movements have invariably placed the spotlight on
forces to provide a scientific synthesis, “United in         issues of fairness and equity, which researchers now
Science”, summarizing among other findings the               increasingly highlight as pivotal in making successful
gap between decarbonization commitments and a                climate policies.
carbonizing reality. Thousands of recent scientific
publications are available, shedding light on (de)           This document intends to take up the latest and
carbonization, accelerated changes in the physical           most essential scientific findings published in an
state of the climate system, the importance and              extraordinary year – the climate science year in
the precarious situation of the biosphere, and the           review.
aggravating impacts these will have on human
societies.

Simultaneously, over the last few years there have
been a growing number of climate-related initiatives
that are being implemented across all economic
sectors over various timescales and regional scales.

                                                         4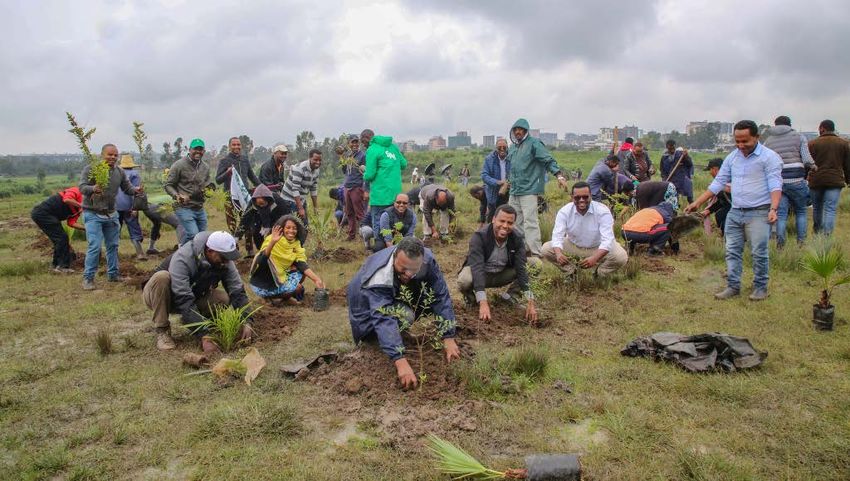
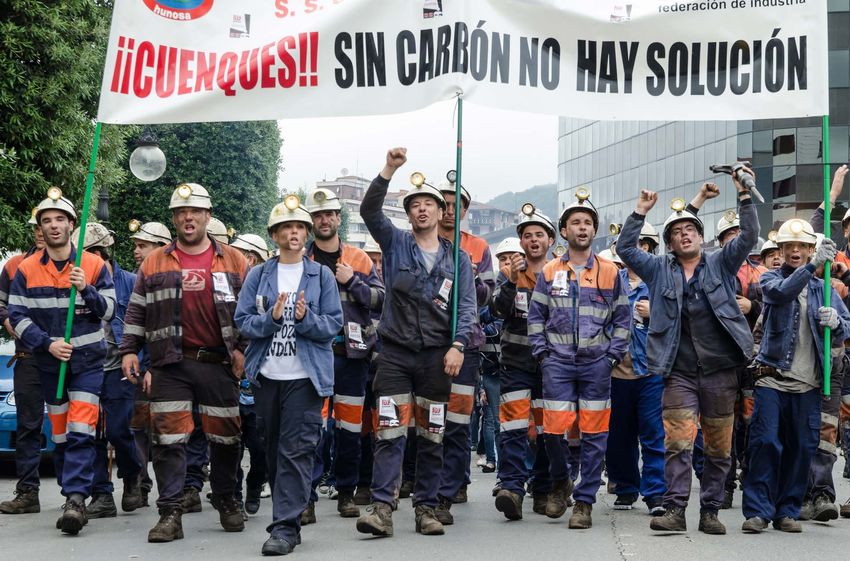
1         The world is not on track
Despite increasing drivers of reduced emissions, such as growth
in green energy, institutions divesting from fossil fuels, and some
countries phasing out coal power, the fossil industry is still growing
and global leaders aren’t yet committing to the necessary emissions
cuts. We are not on track to reach the Paris Agreement.

    Key new insights

    ▪▪   Greenhouse gas emissions continue to increase and the gap between current trends and agreed
         climate targets has widened
    ▪▪   Existing and proposed energy infrastructure commits us to 850 billion tonnes of carbon dioxide
         emissions if operated during its full life cycle, twice the budget available for stabilizing the climate
         at 1.5°C above pre-industrial level
    ▪▪   The use of coal has slowed down and is declining in many countries. There is increasing financial
         divestment from fossil fuels, but the overall size of the fossil-fuel industry continues to increase
         with robust growth in the oil and natural gas sectors.
    ▪▪   In order to achieve ambitious climate targets Carbon Dioxide Removal (CDR) in some form is likely
         needed but comes with great risk and costs and shouldn’t be viewed as a substitute for mitigation

The current levels of fossil fuel use and infrastructure       5 years – 70% faster than anticipated by the UN-
paint a worrying picture for successfully achieving            industry agency ICAO5. The International Maritime
the agreed climate targets. Oil and natural gas use is         Organization also predicts large increases in shipping
increasing rapidly (1.4% and 2% per annum)1. Total             emissions, on average by 29% to 2030 and 95% to
global CO2 emissions from the combustion of fossil             2050 across all future socio-economic scenarios6.
fuels and land-use change have increased about 1%              Despite growing awareness of climate change,
per annum over recent years2. The UN “Environment              consumer preferences for heavier vehicles (SUVs)
Emissions Gap Report 2018” finds the gap between               has led to their doubling of the market share in a
countries’ unconditional nationally determined                 decade. SUVs are heavier than other private vehicles
contributions (NDCs) in 2030 to have widened to 15             and often with diesel engines, consuming more
Gt (billion tonnes) per year of CO2 compared to the            fuel despite progress in energy efficiency and being
2°C target and 32 Gt per year compared to the 1.5°C            responsible for higher air pollution than equivalent
target3. In comparison, total anthropogenic CO2                gasoline engines. SUVs were the second most
emissions are currently 41 Gt².                                important cause for increased global emissions in the
                                                               energy sector (after power) between 2010 and 20187.
Coal power may be bucking the trend. Global use
of coal reached a peak in 2013, decreased slowly               Existing infrastructure such as power plants,
afterwards and had some modest growth again                    industries, and roads cause carbon emissions
over the past two years1. The EU has roughly halved            throughout their lifetimes. Building new fossil-based
its coal use since 19904 and the United States and             infrastructure today locks the world into further
Canada report a 40% decline since 2005¹. However,              “committed emissions” for many decades to come.
decreases in coal use in North America and the EU              If existing infrastructure is operated throughout its
are to a large degree outweighed by investments in             full life cycle as done historically, it will emit 660 Gt
developing and transitioning economies. In addition,           (range 230–1500 Gt), equivalent to 18 years of current
certain sectors are showing strong emission growth.            fossil CO2 emissions⁹. Proposed power plants would
Global aviation emissions have increased by 35% in             add another 190 (40–430) Gt CO2. Together, existing

                                                           5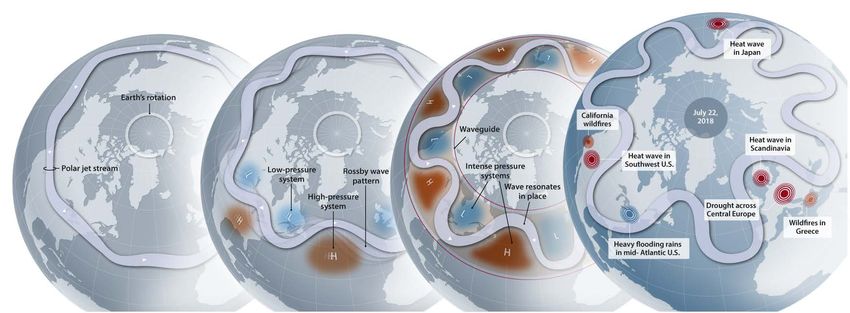
and proposed energy infrastructure represent
committed emissions of 850 Gt CO2, about twice
as much as the carbon budget for the 1.5°C target
(420–580 Gt from January 2018)9,10. Worldwide, there
are currently 1,200 coal plants in various stages of
planning and construction8. Avoiding high future
emissions requires lowered utilization rates as well
as early retirements or retrofits of power plants and
industries. Renewable energy now produces 26% of
global electricity and with continued rapid expansion,
planned or existing fossil production could be
substituted11. The installed capacity of solar and wind
power has grown 58-fold between 2010–201812.

Avoiding investments today that become a lock-in to                      Capacity of coal power plants that are operating, proposed
fossil infrastructure would save both emissions and                      or cancelled8.
stranded assets. A shift in investments from fossil                      the year before and capacity additions were higher
fuels to renewable energy could be underway. More                        than net additions of fossil power12.
than 100 globally significant financial institutions
have developed formal restriction policies for                           However, investments continue to flow to coal power,
investment in coal mining and/or coal-fired power                        oil, and gas extraction. Since the Paris Agreement
plants since 201311. Investments in renewable power                      was adopted (2016–2018), 33 global banks have
and fuels in 2018 totalled USD 305 billion, the                          invested USD 1.9 trillion in fossil fuel companies14.
corporate sourcing of renewables have doubled since                      OPEC is assuming that oil demand will continue

Committed emissions from fossil fuel infrastructure compared to pathways to 1.5°C (IPCC SR1.5 P1) and 2°C (RCP2.6). The committed
emissions exclude some of the current CO2 sources, such as land-use change and the calcination process in cement manufacturing.
Therefore, the 1.5°C and 2°C scenarios start at higher levels. Based on Tong et al, Nature, 20199 and Grubler et al, Nature Energy, 201824

                                                                     6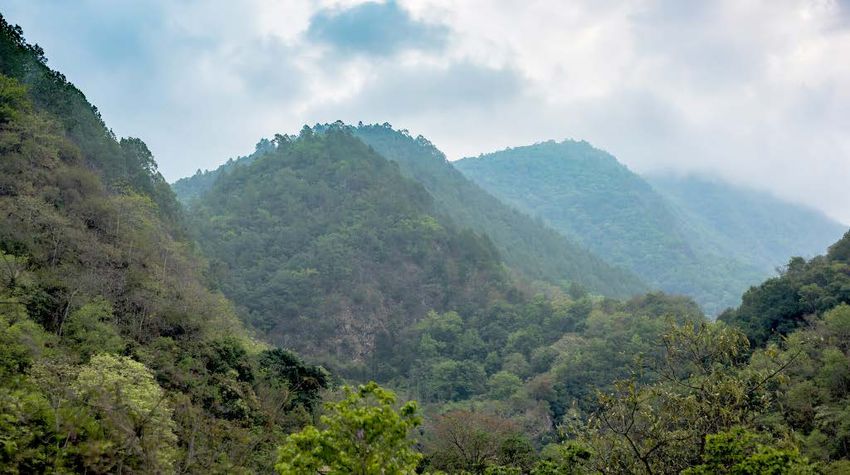
to increase and that satisfying this demand would               including the feasibility and pollutant implications of
require upstream investments (in extraction,                    manufacturing the absorbing chemicals at large-scale
refineries, etc.) of USD 11 trillion up to 204015. Four         as well as the need for sequestration and transport
of the top five investors in fossil fuels are US based14.       infrastructure, and risks associated with relying on
When it comes to coal power, four of the top five               technology that’s still in early development20. Direct
investors are Chinese banks14.                                  Air Capture could also be associated with utilization
                                                                of the captured CO2 to replace products that would
In the absence of strong emissions reduction, removal           otherwise be based on fossil carbon. Ahead of Direct
of CO2 from the atmosphere and safely locking it                Air Capture, the first priority for carbon capture and
away has become a requirement to avoid exceeding                storage/utilization should be major CO2 point sources,
1.5°C global warming. According to the IPCC Special             such as cement factories, pulp and paper mills, and
Report on Climate Change and Land, the greatest                 waste incinerators21.
potential for Carbon Dioxide Removal (CDR) is in
nature-based methods (afforestation, reforestation,             BECCS, DACCS, and similar options require
and soil carbon sequestration in croplands and                  safe underground storage. The solution being
grasslands) and bioenergy with carbon capture and               implemented at the largest industrial scale today, sub-
storage (BECCS)16. However, such solutions will                 seabed storage, faces technological, economic, social,
require substantial investment, they could take up              and political barriers22. Extensive CDR deployment
significant areas of land, and are likely to negatively         in the future is unlikely without substantial work to
affect biodiversity and freshwater availability17,18.           minimize the barriers23. While some level of CDR is
Model-based decarbonization pathways suggest that,              likely to be needed to achieve the most ambitious
globally, conversion of up to 7 million sq km – 12 times        climate targets, it comes with great challenges. There
the area of France – to forest area by 2100 is needed to        are some scenarios showing that reliance on CDR,
limit warming to 1.5°C or 2°C16.                                beyond nature-based methods, could still be avoided if
                                                                there was strong and immediate mitigation24,25.
Beyond nature-based methods, CDR still requires
significant upscaling and innovation. Among emerging
new technologies, Direct Air Capture with Carbon
Storage (DACCS) has gained increasing attention. With
this technology, CO2 is absorbed directly from the
air and then stored in geological reservoirs. The first
commercial direct CO2 air capture system came online
in 201819. The benefits of DACCS include not needing
significant amounts of land. A major drawback is
the high energy consumption, drawing down 30 Gt/
yr (73% of current CO2 emissions) is estimated to
require more heat than half of today’s primary energy
consumption and more than half of the electricity that
the world produces today20. There are also other risks,

                                                            7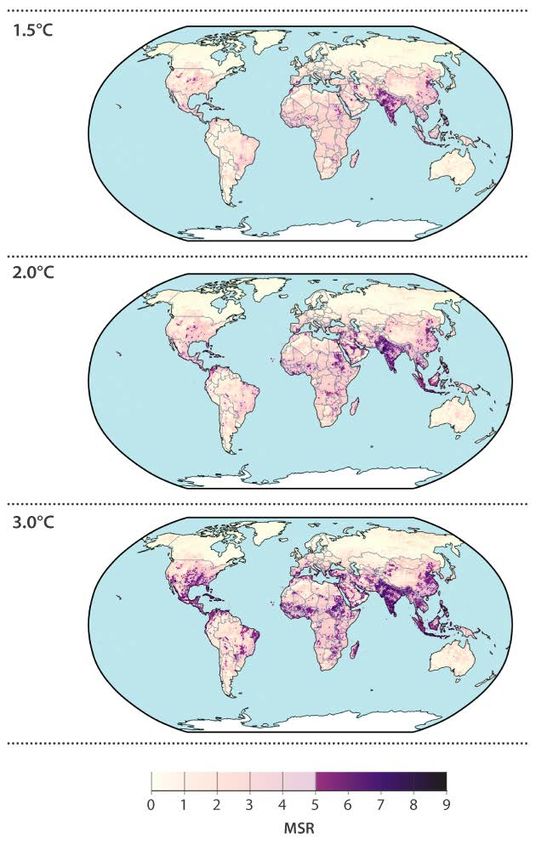
2          Climate change is faster and stronger than expected

    Key new insights

    ▪▪   Observations show signs of continuing warming
    ▪▪   Sea-level rise is accelerating
    ▪▪   Relatively stable components of the earth system show signs of accelerated degradation, such as
         Greenland and Antarctic ice sheets
    ▪▪   Further impacts especially on ice sheets and, consequently, on sea-level rise, have probably been
         underestimated in the IPCC “Fifth Assessment Report”

Observations of key climatic variables show a                         The ocean has taken up roughly 90% of the
persistent warming trend for the Global Mean                          additional heat in the climate system4,5; since the
Surface Temperature (GMST), with signs of                             IPCC “Fifth Assessment Report” (AR5), confidence
accelerating change, e.g., for sea-level rise1,2.                     in these findings on ocean heat uptake has grown6.
An analysis of GMST, conducted by the World                           This has consequences for the physical, chemical,
Meteorological Organization (WMO) and in                              and biological properties of the oceans, e.g.,
comparison to pre-industrial (1850–1900) levels,                      thermal expansion and thus sea-level rise, higher
reveals that the last few years are the warmest                       temperatures of near-surface waters, enhanced
five-year period on record, and with 2015, 2016,                      stratification, weakened circulation, and changes in
2017, and 2018 being the four warmest individual                      oxygen content6,7. Marine heatwaves, for instance,
years1,2. Future warming could be faster and a global                 have doubled in frequency as satellite observations
temperature rise of 1.5°C above pre-industrial levels                 reveal, affecting sensitive ecosystems such as coral
could be reached sooner than the central projection                   reefs, as well as seagrass meadows and kelp forests.
in the IPCC special report on “Global Warming of                      Marine heatwaves have also become longer lasting,
1.5°C” (in the year 2030 instead of 2040)3.                           more intense, and extensive8,9.

                                                                      Scientific agreement has significantly grown that
                                                                      anthropogenic climate change is the dominant
                                                                      reason for the observed rates of sea-level rise since
                                                                      197010,11,12,13,14. Consequences of the rising sea level are
                                                                      an increase in extreme wave heights, as observed
                                                                      in satellite observations from 1985–20188,15, and
                                                                      extreme sea-level events; both will significantly
                                                                      increase in future according to modelling studies6,10,16.

                                                                      New analysis of model projections with high-
                                                                      emission scenarios for the end of the 21st century
                                                                      show substantially increased rates of sea-level rise
                                                                      when compared with those reported in the AR56,17.
                                                                      Analogous to that, recent literature investigated
                                                                      the temporal behaviour of sea-level rise, confirming
                                                                      that it will continue to rise for centuries, even when
The mean global sea level has risen at an increasing rate, from       greenhouse gas emissions are curbed down6,17. If the
1.4 mm per year during the period 1901–1990, to 2.1 mm per year
during the period 1970–2015, and to 3.6 mm per year during
                                                                      Paris Agreement targets are achieved and strong
the period 2005–201510. The most recent decade (2009–2018)            mitigation measures are implemented, sea-level rise
experienced a sea-level rise of 4.6±0.15 mm per year2.                is projected to reach approximately 30–60 cm by

                                                                  8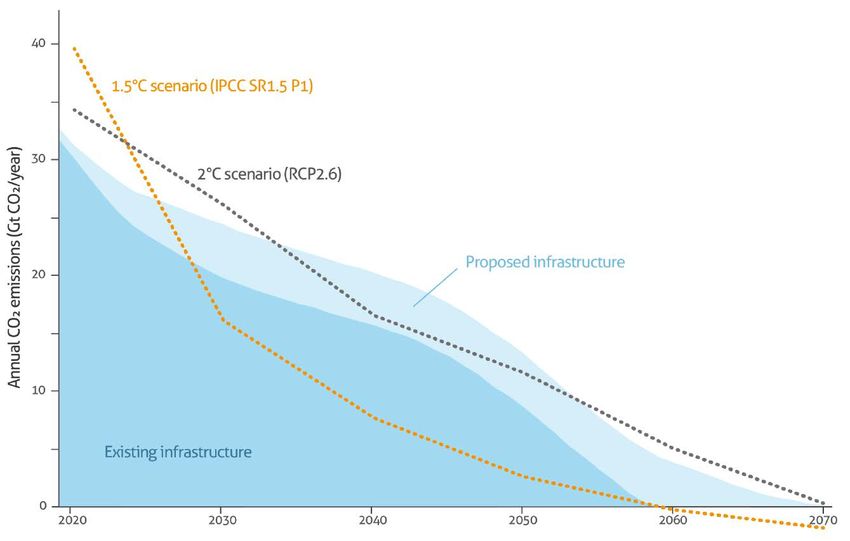
2100, while under a high-emission scenario sea-level          rise6,17,25. The melting and thinning rates of the
rise could amount to 60–110 cm, when looking at the           Antarctic ice sheet observed to date are at the upper
“likely” range according to the IPCC nomenclature10.          end of the projected range published in AR5. Since
However, considering the less likely, upper bounds            then, process understanding and representation
of future sea-level rise projections, these numbers           in models as well as observational records have
almost double by 210017.                                      substantially improved. However, the related
                                                              dynamics are still a major source of uncertainty in
Projections show that what are considered extreme             projections of the future response of the Antarctic
sea-level events that rarely occur under today’s              ice sheets to climate change, and, hence, of sea-level
climate, e.g., statistically every 100 years, will be         rise6,25. Consensus among experts has grown that
much more common by the end of the 21st century               these regions are more sensitive to global warming
along the global coastlines under all Representative          and less stable than previously thought, and that AR5
Concentration Pathway (RCP) scenarios10,18. Many              estimates were too low. This refers especially to the
coasts on low latitudes and many megacities on all            high end of likely sea-level rise projections, which
continents will experience such events annually               were estimated substantially lower in the former
alraedy around the year 205010,16,19. Low-lying               reports6,10,17. It is recommended to take into account
countries will face similar risks, which is even more         the increased numbers for projected future sea-level
critical for many of these states due to the geographic       rise for high-emission scenarios in decision-making
lack of options to retreat. Fast and ambitious                as an orientation for upper bounds6,10,17.
mitigation is vital especially for those areas, since
low-emission scenarios will clearly dampen the rates          New research on Greenland’s ice sheet and its
of sea-level rise and the increase in extreme sea-level       response to global warming used satellite and model
events10,20.                                                  data for the years 2003–2016. Observations highlight
                                                              the importance of oceanic forcing on mass loss,
The main causes for the current rising sea level, as          through melting the outlet glaciers at their margins,
mentioned, relate to thermal expansion and mass               analogous to what is observed in Antarctica. Further, in
loss through melting of glaciers and ice sheets,              addition to warmer seas degrading the Greenland ice
the latter process having gained dominance over               sheet, atmospheric forcing can significantly enhance
thermal expansion10,17. The increased rate of sea-            glacier melt. If atmospheric warming continues
level rise is attributable to enhanced melting rates          unabated, Greenland will continue to develop as a
from inland ice, namely from the Greenland and                major contributor to global sea-level rise26.
West-Antarctic ice sheets10. Recent work based on
satellite data shows that mass loss from Antarctica           As the large ice sheets influence sea-level rise, near-
accelerated over the past 25 years21,22. Relevant             surface lowland permafrost can influence climate
processes include melting of the ice-sheet margins            at a global scale, since additional outgassing of
from below through warm ocean currents23. These               greenhouse gases further enhances temperature rise.
are driven by atmospheric circulation patterns, the           Lowland permafrost holds approximately double the
frequency and prevalence of which influences the              amount of carbon than the atmosphere, a potential
melting conditions at the ice margins23,24. While the         source for both CO2 and CH4 (methane, the second
process is generally understood, it has been shown            most potent greenhouse gas after water vapour)
that anthropogenic climate change is a plausible              when frozen organic material thaws and decomposes.
major contributor to altered wind conditions during           The largest permafrost areas are situated in Arctic
the past decades. A trend has emerged, starting in            and sub-Arctic regions, where warming rates are
the 1920s, towards circulation patterns that lead             more than double the global average due to Arctic
to an acceleration of ice loss from the Antarctic             amplification27, which is projected to persist in
continent24. Model simulations project this trend to          future25. It is uncertain whether the related positive
continue, including consequences for the melting of           feedback is happening and permafrost areas are
the ice margins24.                                            already a source of CO2 and/or CH425. However, it is
                                                              projected that near-surface permafrost in the Arctic
There is an ongoing debate whether hypothesized               will mostly disappear under a high-emission scenario,
destabilization processes of the Antarctic outlet             which would lead to the release of tens to hundreds
glaciers will occur in the near future. These could           of billions of tonnes of CO2, leading to amplified
lead to severe, abrupt ice loss from ice-sheet margins        warming – the permafrost-carbon feedback25.
and would thereby critically accelerate sea-level
                                                              Projections of effects from warming and degrading
                                                          9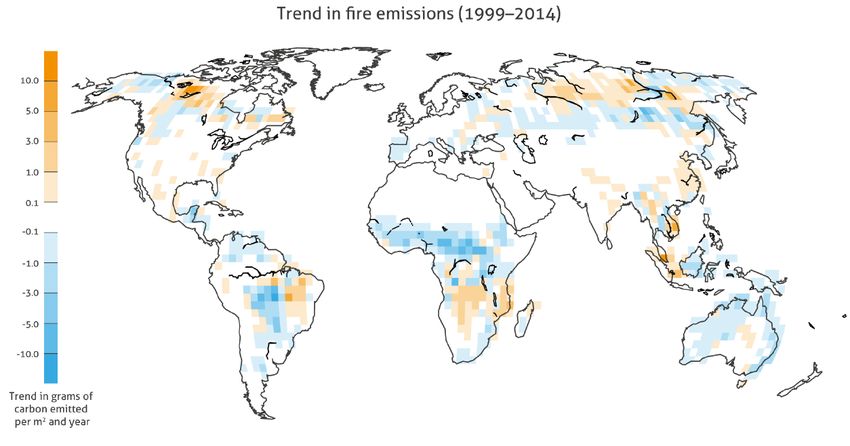
permafrost are based on models that include                  warming cannot be explained with natural forcings
the gradual degradation of permafrost due to                 and variability alone, but only if the human factor is
the background warming of near-surface air                   taken into account34. An investigation of the climate
temperatures. However, pulse events play an                  history of the past 3 million years shows that glacial-
important role as they disturb the local heat                interglacial cycles of the earth were steered by the
balance, thereby fostering near-surface permafrost           planet’s orbital parameters in combination with
to rapidly warm and/or thaw. Such factors include            the atmospheric CO2 content. While this is nothing
wildfires, erosion on river banks and coasts, and            new in principle, the results once again show that
fast formation of lakes as a response to melting ice         earth’s climate is very sensitive to atmospheric CO2
bodies and soil subsidence28. To date, many global           concentration35.
climate models lack these processes as well as
schemes that dynamically simulate the permafrost-            Searching for prehistoric climates that could serve
carbon feedback. Both permafrost degradation and             as analogues for future climate, an analysis has been
possible resulting carbon emissions are probably             done of temperature and concomitant CO2 contents
underestimated6.                                             of the past 50 million years36. Following the study,
                                                             the Pliocene and Eocene climates are most plausible
New research on Arctic greening shows that                   analogues for the coming 250 years. For both high-
additional plant growth is not sufficient to                 and low-emission pathways, climatic conditions
significantly mitigate or offset outgassing of               similar to those of the mid-Pliocene will become
greenhouse gases from these areas. Although                  most likely for many regions on earth by the middle
growing season lengthens and temperatures rise,              of this century. While these would stabilize thereafter
growing conditions remain difficult for plants due to        under a mitigation scenario, large areas of the earth
temperature and water stress. This is projected to           would develop an Eocene-like climate by the 21st
persist in future29,30.                                      and 22nd centuries, if a “business-as-usual” scenario
                                                             is applied. Global mean temperatures were 2–4°C
Regarding greenhouse gas concentrations, not only            warmer than pre-industrial levels during the mid-
are concentrations of CO2 on the rise, atmospheric           Pliocene, and more than 10°C warmer in the early
concentrations of CH4 have resumed their growth              Eocene. The upper bound for global sea-level rise for
since 2007 and doubled in growth since 201431.               a climate similar to the mid-Pliocene is 25 m, which
Methane concentrations are now at a record high of           would occur over very long timescales10.
257% of pre-industrial levels1. Sharp cuts in methane
concentrations are needed to achieve the Paris               The pace of contemporary rise in greenhouse gas
goals. The reason for the acceleration since 2014            concentrations is unprecedented in the climate
is strongly debated, but observations of stronger            history over the past 66 million years37. Current
emissions across the southern tropics suggest                rates of greenhouse gas emissions from human
wetlands drove part of the growth in response to the         activities are substantially larger than during the
warm El Niño phases of the Southern Oscillation;             strong warming that marks the early Eocene. In
isotope measurements of the gas support this view32.         consequence, the rise of global mean temperatures
The sensitivity of methane emissions from wetlands           and the changes in affected earth system
during high-temperature periods suggests a future            components such as sea-level rise and the shift of
potential climate feedback associated with rising            climatic zones poses an unprecedented challenge to
temperatures, which would be impossible to prevent           the speed of evolution of the biosphere, as well as to
whilst temperatures continue to rise. Other likely           human adaptation capacity.
co-drivers from the emissions increase since 2007
include increased emissions from agriculture in the
tropics and fossil-fuel use at mid-latitudes in the
northern hemisphere33. These emissions could be
reduced by changing livestock diets and through
better systems for detecting and stopping methane
leaks in oil and gas infrastructure.

Palaeo (prehistoric) studies show how contemporary

                                                        10
3 Climate change leaves no mountain summit behind
Key new insights
▪▪ Diminishing glaciers, snow, ice, and permafrost are observed in mountains. Mountain glaciers are
on average estimated to have lost roughly half a tonne of mass per square meter – about 0.5 m in
thickness – per year in 2006–2015.
▪▪ Changes to glaciers, snow, and ice in mountains influence water availability in the mountain
catchments and the lowlands, possibly affecting billions of people
▪▪ Climate change irreversibly affects mountain ecosystems and their biodiversity, reducing the area
of biodiversity hotspots, causing species to go extinct, and compromising the capacity of mountains
to provide key ecosystem services
▪▪ Adaptation to climate change is possible but its effectiveness is severely constrained under high-
emission scenarios.
Mountains are at the forefront of climate change Consequences of climate-related changes in snow
impact. Considerable changes to the cryosphere and glaciers on the amount and seasonality of water
(glaciers, permafrost, snow, and ice) are recorded runoff are already observed in snow-dominated and
worldwide with cascading effects on water glacier-fed river basins, and are also predicted to
availability in both the mountain catchment and continue into the future1,4. The average winter snow
the lowlands. Globally, glacier mass in mountain melt runoff is projected to increase, and spring water
regions, excluding the Arctic and Antarctic, runoff peaks to occur earlier1. The average annual
declined by 123±24 Gt (billion tonnes) per year runoff from glaciers in most mountain regions are
from 2006–2015. This is about 500 kg per m2 of expected to reach a peak followed by a decline by
glacier, or like shaving off 0.5 m from the glaciers the end of the 21st century1. These projected trends
each year1. There has been a particularly large are particularly concerning, given that ~1.4 billion
average mass loss observed in the southern Andes, people (23% of the world’s lowland population) are
Caucasus and Central Europe (over 850 kg per m2 projected to depend on runoff contributions from
and per year). The smallest losses, but with high mountains by mid-21st century under a middle-of-
local variability, are seen in High Mountain Asia the-road scenario5. Many of the world’s biggest or
(150±110 kg per m2 and per year)1. Permafrost, fastest growing cities, such as Dar es Salaam with an
which in high mountain regions covers an area expected 13 million citizens in 2035, are particularly
ranging from 3.6 to 5.2 million km2 (roughly at risk as they depend on nearby mountains for
equivalent to the size of the EU) is being affected their drinking water. Risks are magnified by likely
by an increase in temperature throughout the alterations in precipitation patterns or increased
European Alps, Scandinavia, Canada, and Asia1. frequencies and magnitudes of droughts7.
The number of days of snow cover has declined in
nearly all regions, and decreases are particularly Changes in climate also affect mountain ecosystems
striking at lower elevations1. Further large-scale and their biodiversity at an accelerating pace.
deglaciation can be expected under both high- and Findings from long-term ecological monitoring8,9,10
moderate-emission scenarios1,2,3. and large-scale assessments6,11 are consistent:
climate change has resulted in unprecedented
Observed and projected glacier, snow, and permafrost redistributions and losses of habitats and species
decline will continue to impact the frequency, along altitudinal gradients and increases the
magnitude, and location of most related natural vulnerability of mountain ecosystems to additional
hazards in mountains, including landslides and stressors such as invasive species12. Assessments
rockfalls, with exposure of people and infrastructure and predictions unanimously speak to rapid and
leading to increases in disaster risks1,6. irreversible changes in mountain biodiversity and
11Bondo landslides in Switzerland, 2017. Melting glaciers and thawing 12 permafrost create new hazards and increase the risk of disaster losses. Image credit: Marco Giacometti/Mountain Research Initiative
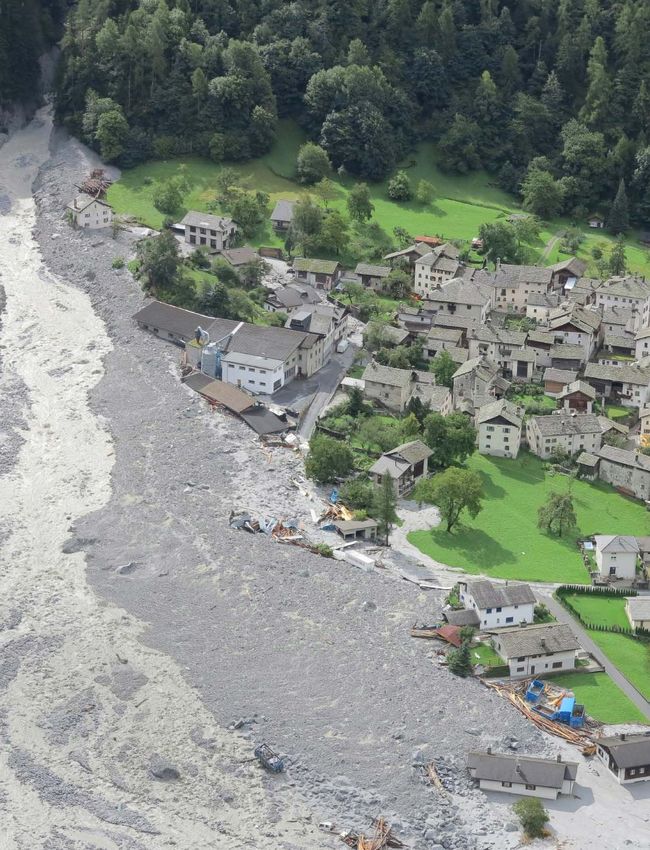
Projected regional glacier mass evolution between 2015 and 2100 relative to each region’s glacier mass in 2015 (100%) based on three
Representative Concentration Pathways emission scenarios. Adapted from IPCC SR Oceans and Cryosphere, 2019.

ecosystems – with estimated losses in the area of                       tourism, and energy1. A key opportunity to lessen
individual biodiversity hotspots across the Hindu                       impacts and support biodiversity is to encourage
Kush Himalaya of >70%6 – and to the imminent                            diversity in livelihood options for mountain
extinction of numerous species, including many                          communities under conditions of global change20,
endemic ones13,14.                                                      recognizing that indigenous and local knowledge in
                                                                        mountain regions play a key role in conservation and
Beyond biodiversity, climate change – alone or in                       management21. Multi-purpose and integrated water
combination with other drivers such as land-use                         management approaches across multiple scales can
change15 – affects mountain ecosystems in their                         be effective at addressing impacts and leveraging
functions and in the services they deliver, such as                     opportunities from climate-related changes to the
food, forest products, tourism, and not least the                       cryosphere and water resources in mountains4.
provision of clean water to half of humanity16,17.                      However, global mitigation and adaptation measures
Rising temperatures can disrupt traditional crop                        in mountain regions are a prerequisite to sustainable
productions, such as coffee in the Jimma area of                        mountain development, and depend on urgent
Ethiopia under a business-as-usual scenario18. To                       and ambitious actions to provide the supporting
increase resilience under climate change, conserving                    conditions for their effective implementation4.
the large variety and genetic diversity of traditional
crops and cultivars used in subsistence farming
systems in mountains, notably in the Hindu Kush
Himalaya6, is particularly important.

Together with gradual and abrupt changes in
governance and socio-economic activities, climate
change is a key driver of change in mountain social-
ecological systems19. Observed and projected climate
change translate to numerous impacts to human
societies living in and dependent on mountains,
with negative impacts on livelihood options and
supporting sectors such as agriculture, pastoralism,

                                                                   13
4 Forests are under threat, with global consequences
Key new insights
▪▪ The world’s forests are a major CO2 sink, absorbing about 30% of anthropogenic CO2 emissions
▪▪ Anthropogenic forest fires driven by land-use alternation have been reducing major CO2 sinks
▪▪ Climate change globally amplifies wild forest fires
▪▪ CO2 emissions increase forest photosynthesis capacity to a certain degree, but temperature
increases cause tree mortality and reduce overall carbon storage capacity
▪▪ Fighting deforestation and encouraging reforestation, along with sustainable forest management
and other natural climate solutions are important and cost-effective options for reduced net
emissions
Forests are foundational pillars of land ecosystems, around 1°C5. Thus, threats to forests have local as well
human sustenance, and cultures. Loss of forests is as global consequences for human livelihoods and
not only detrimental for the livelihood of people, well-being, and the entire biosphere.
but also for over half of all globally known terrestrial
plant and animal species inhabiting these regions1, Loss of forest and associated carbon release
alongside serious consequences for both the local persists into the 21st century
and global climate. Forests contain approximately
80% of the terrestrial biomass2 and act as a major Deforestation along with other anthropogenic
CO2 sink, taking up 11.6 Gt CO2 per year3, which is land-use changes accounts for 13% of the global
equal to one third of global CO2 emissions from anthropogenic CO2 emissions4, becoming one of the
fossil fuels4. Removal of ~50% forests in a tropical major causes of climate change3,4. Of the forest loss
region can increase the local average temperature by in the period 2005–2013, 62% could be attributed
Map of observed fire emissions 1999-2014 showing where fire is increasing (orange) or decreasing (blue). Adapted from Arora and Melton,
Nature Communication, 2018. (CC BY 2.0)
14to expanding commercial cropland, pastures and term average10. The most devastating and largest
tree plantations6. A significant fraction of emissions fires in the Amazon region were observed in the early
related to deforestation in 2010–2014 was driven by 2000s, driven by massive clearing for agriculture
international trade (29–39%)6. While the southern and cattle grazing11. In South East Asia, higher fire
hemisphere is facing the most severe deforestation, frequencies can be found for Myanmar, Thailand,
the northern hemisphere is increasing its tree cover7. Cambodia, Indonesia, and Laos11. In Indonesia, haze
This phenomenon could be partially attributed to caused by fires ignited for clearing forest for palm
displacing commercial land use from the north to the oil plantations poses a substantial human health
south6. threat12.
Anthropogenic forest fires driven by land-use In recent years, there has also been observed regional
alternations are a threat to forests in Africa, Latin increase in wild forest fires such as in Western US
America, and Asia. In Africa, prolonged fires occur and Alaska, Canada, Russia, and Australia as a result
widely in the sub-Saharan region8. Most of this comes of prolonged droughts8,13. The combined effect of
from large-scale changes to land-use in western natural and anthropogenic fires to the Amazon
Ethiopia and western tropical Africa9. In 2019, there and wild fires of boreal forests means we could be
was an observed increase in the number of fires in losing a major carbon sink14. Significant increases
the Amazon region compared to 2018, alarming the in the number, magnitude and duration of fires
international community, but the number of fires and occur in cycles. For instance, the El Niño events that
associated emissions were in fact close to the long- regularly change southern hemisphere circulation
Spotlight: Ethiopia and Bhutan
Ethiopia, a tree-planting champion,
managed to plant 350 million trees
in a single day29.
Photo: ILRI/Apollo Habtamu (CC BY-NC-SA 2.0)
Bhutan preserves 60% of its land
under forest cover and more than
51% of the country is protected,
the largest percentage of any Asian
country30.
Photo: Antonio Morales García (CC BY-SA 2.0)
15magnify wild and anthropogenic fires. The impact season and decreasing rainfall during dry season20.
of the 2015–2016 El Niño on the terrestrial carbon Increasing incidences of prolonged droughts have
cycle was a lowered net uptake of CO2, mainly by increased the occurrence of Amazon wildfires.
drying natural forests15. The net CO2 emissions This process is driven by a decrease in oceanic
from tropical Africa are estimated at 5.4 and 6 Gt moisture inflow that triggers vegetation-atmosphere
per year for the years 2015 and 2016, respectively9. feedbacks, in turn decreasing cloud formation and
This corresponds to about one-tenth of total global rainfall21. Climate change and particularly maximum
greenhouse gas emissions. But on a global scale, temperatures and air moisture are estimated to
long-term observations for the 1960–2009 period intensify wildfires22, and globally fires are persisting
suggest general reduction in CO2 emissions from fires for longer due to droughts8,13.
due to fire suppression, and landscape fragmentation
reduced land carbon uptake by 0.48 Gt CO2 per year, Climate change can also reduce photosynthesis,
corresponding to ~19% of the global land carbon intensify evaporation, and increase tree mortality
uptake16. in response to widespread drought23. Prolonged
drought and heat above 29.5°C have been shown
Climate change impacts forests and their to strongly increase tree mortality24,25. Many pine
carbon sink capacity tree populations in Central Europe and Northern
America are declining due to drought and associated
In the face of climate change, forests show an vulnerability to bark beetles26,27.
altered capacity to serve as carbon sinks compared
to pre-industrial climate conditions. For example, Potential of restoration and protection of
trees grow faster when “fertilized” by higher CO2
concentrations thus increasing photosystems and
natural forests as a climate solution
CO2 absorption from the atmosphere. However, the At the current level of CO2 atmospheric
lifetime of trees may be shortened, meaning that concentrations, the fertilization effect is still giving
the long-term sequestration effect is also affected17. positive carbon uptake, so stimulating forest growth
Interdependence between higher stem productivity, can be considered a climate change mitigation
faster tree turnover and shorter carbon residence measure16. Reforestation, stopping deforestation,
time also limits carbon storage18. “Fertilizing” by and sustainable forest management, together
CO2 has another limitation: there is a shortage of with other natural climate solutions are viable and
phosphorus in natural ecosystems that will inhibit cost-effective options that could close the gap in
tree growth despite more CO2 being available in the emissions reductions required by 2030 under the
atmosphere19. Paris Agreement28.
A significant intensification of the hydrological cycle
of the Amazon has been seen with strongly increased
precipitation and river runoff during the wet
165 Weather extremes – a “new normal” in 2019
Key new insights
▪▪ Some extreme weather continues to become more likely and more severe
▪▪ Increasing number of extreme events are region-specific
▪▪ Europe has seen a particularly strong increase in heat extremes
▪▪ The duration of extreme weather events is anticipated to increase in a 2°C world
▪▪ Synchronous extremes are risky in a globally connected world
▪▪ Societies often don’t have time to fully recover from extreme events before another one hits
▪▪ Ambitious mitigation can curb risks but with 1.5°C warming, regionally dangerous levels will be
reached
Record-breaking extreme weather and climate total annual rainfall there could fall by 15–30% in the
events have continued to dominate the headlines 21st century and intensify storms3. On the other side
in 2019, drawing public attention to the role played of the globe, in Mongolia, extremes are influenced
by anthropogenic climate change. The public by the El Niño-Southern Oscillation in the Pacific
outcry has been accompanied by an increasingly as well, but here extreme precipitation has slightly
comprehensive and robust scientific literature decreased between 1960–2017, while warm extremes
attributing the increase in frequency and intensity of significantly increased, especially during the night4.
events – such as unprecedented wildfires in Siberia Typical characteristics of any region, however,
and the Amazon region and record monthly global are not necessarily set in stone. For example, the
temperatures – to climate change. The impact “drought in the north – floods in the south” pattern
of such events goes beyond mere record setting in China, which is a natural feature that has been
and environmental damage. The material and observed to increase due to climate change in the
human costs are especially high when vulnerable past, has shifted in recent years (more droughts in
communities are affected. the south, more extreme precipitation in the north),
accompanied by severe economic losses5.
Attribution science, estimating how much more
severe an extreme event has been due to climate The duration of extreme events is strongly correlated
change, has come a long way in the past decade1. to their impact. For example, hurricane stalling
Throughout 2019, scientists have sought to (when storms grind to a slow crawl or halt), as
understand extreme events related to heat, drought, increasingly observed along the North American
floods and cascades of events. Here we explore some coast, is associated with stronger rainfalls. The
in more detail. cause for this particular increase, however, may lie
in natural variability6. Impactful extremes can also
Around the globe be overlooked when focusing at daily mean values:
hourly rainfall extremes – typically thunderstorms
Globally, most land regions are experiencing – can have strong impacts, like urban flooding or
increases in persistent rainfall extremes, which last landslides. The strength of hourly rainfall extremes
several days2. In every region, however, the situation has been observed to increase in Australia, lies above
is special. For example, while a strong influence the range of natural variability, and is around twice
of El Niño conditions on torrential rainfall on the as high as expected from scaling considerations
southern edge of the Atacama Desert has been involving temperature rise and higher moisture
observed in the past, model simulations suggest content in the air7. This is also the case for daily
17rainfall extremes in the French Mediterranean: the Multi-model analyses suggest that in a 2°C world,
mean intensity is estimated to have increased by the duration of extremes will severely increase – for
22% over the 1961–2015 period, which is about one to instance, the persistence of events that are both
three times higher than what one would assume from warm and dry in eastern North America could
thermal scaling considerations8. increase by 20%13. Weather extremes in the far north
could accelerate permafrost thaw14,15 and wildfires16,
Persistent heatwaves causing further releases of greenhouse gases and
thereby contributing to “positive” feedback loops of
Although this year’s record-breaking heatwaves in global warming17.
Europe still await full scientific analysis, it seems
clear that they came with deleterious implications
for human health. Heatwaves with a similar
Compound, cascading, and connected
frequency would have likely been around 4°C cooler events
a century ago. Europe has seen a strong increase Increasingly, societies will have to adapt to
in heat extremes, to a larger extent than predicted compound and cascading events18,19. Compound
by climate models. Possible reasons include soil events (from a combination of different climate
moisture feedbacks and jet-stream dynamics, not yet drivers and hazards) can amplify the risk of severe
sufficiently well represented in climate models9. impacts significantly20. In California, a combination
of extreme heat and dryness amplifies wildfire risk
The jet stream – a fast-moving band of air 11 km up affecting air pollution and food production: climate
in the atmosphere – is increasingly showing signs of change has doubled the probability of years that are
unusual behaviour, probably due to Arctic warming. both warm and dry in the same location (relative to
This is affecting weather in the northern hemisphere, the 1961–1990 baseline)21. Cascading events do not
for example, leading to hot air from Africa reaching leave enough time for societies to recover before the
France and Germany and resulting in temperatures next event happens.
as high as almost 46°C in France in June 2019. The
connection between the northern ocean, sea ice, There is increasing scientific evidence that extreme
and temperatures in the Arctic10,11 has been at the events – just like known, large-scale phenomena
centre of a number of northern hemisphere extreme such as the El Niño-Southern Oscillation – can
weather events in summer 201812, like heatwaves and be connected across continents12. New methods
rainfall extremes. The associated wave pattern in the based on network analysis and advanced statistical
atmosphere has been occurring more often in recent methods may help in predicting these events in the
decades, but the attribution to global warming is still future22,23.
a field of active research.
During summer, the polar jet stream weakens and can take on a more wave-like appearance. When the waves get stuck in place they create
significant high and low pressure centers which can cause extreme weather events. There is some evidence that climate change can impact
the shape of the jet stream and the frequency of extreme summer weather events, such as in Europe 2018 and 2019. Image courtesy: 5W
Infographics/Jen Christiansen/Scientific American 03, 2019
18Looking to the future
Climate change is forcing us to reconsider the notion Spotlight: Oceans
of an extreme event. What was once considered Extreme heat is not just a phenomenon
unlikely or rare (both in terms of the intensity and experienced on land. Knowledge of ocean
frequency) is becoming part of a “new normal”. This heatwaves is expanding. Climate change is
fundamental shift in our climate system has reached increasing the severity of ocean heatwaves,
levels now being felt by societies across the globe. with temperature anomalies of almost
Whether in the form of the hottest summer, longest 7°C recorded in some places24. Since 1982,
drought, or largest wildfire on record, repetitive the number of days experiencing marine
record breaking is becoming a feature of popular heatwaves has doubled. If global average
discourse around climate change. The impacts temperature reaches 1.5°C, the number
of these extremes are furthermore being felt by of days is expected to increase by a factor
societies in myriad forms, including increased food of 16. This jumps to a factor of 23 for a 2°C
prices due to crop failures, health impacts of the rise25. Today, 87% of marine heatwaves are
outbreak of water-borne diseases or heatwaves, or attributable to human-induced warming,
direct property damage from storms. Even when with this ratio increasing to nearly 100%
pursuing policies that are considered to be consistent under any global warming scenario exceeding
with the 1.5°C aim, there will be increased risks 2°C26. Ocean heatwaves are killing coral
of some regional extremes reaching dangerous reefs and reducing fish harvests. More
levels for ecosystems and societies over the coming research is required to better understand
decades26. the coexistence of risk factors, such as heat,
ocean acidification, and deoxygenation, in
order to devise better adaptive strategies.
196 Biodiversity – threatened guardian of earth’s
resilience
Key insights
▪▪ Terrestrial biodiversity is suffering from climate shifts, with 14% local species loss on average
predicted already at 1–2°C warming – to more than one-third in a business-as-usual scenario
▪▪ Coral reefs – marine biodiversity hotspots – are at high risk of extinction, due to ocean acidification,
warming, heatwaves, and other anthropogenic pressures. At 2°C warming, at least 99% of coral
reefs will disappear together with their ecosystem services, which sustain over 0.5 billion people at
present
▪▪ Rising water temperatures increase the risk of decreasing fish populations due to changes in
marine food webs. In freshwater ecosystems, fish die-offs may double by 2050 and increase
fourfold towards the end of the century due to extreme summer temperatures
▪▪ Natural climate solutions are an essential contribution to mitigation, but nowhere near enough to
ensure climate stability
Climate change threatens biodiversity globally, on Terrestrial biodiversity
land as in the ocean. At the same time, biodiversity
The response of terrestrial biodiversity to climate
is a key feature of stable ecosystems, providing –
change will heavily depend on how soon we can
among many other services to humanity – carbon
halt global warming. Even at 1–2°C global warming,
stocks and sinks (absorbing about a quarter of human
terrestrial ecosystems could lose 14% of their current
emissions) and thereby guarding the earth system’s
local species on average, with those species losing
resilience against the disruption from anthropogenic
35% of their suitable habitat4. For a temperature
carbon emissions1,2,3. Therefore, it is urgent to put a
increase beyond 3°C, entire taxonomic groups will
halt to ecosystem degradation.
not be able to respond and adapt. Current business as
usual, leading us to a 4°C+ world, would result in one-
third of local species disappearing, with their suitable
climate area reduced by more than half4.
Both land-use change and shifts in climate conditions
weaken the resilience of natural ecosystems
individually, but also because these pressures
interact5. For example, the combination of land-use
change and climate change can explain more than
half of the observed biodiversity shifts on Mount
Kilimanjaro, while seen individually they account for
only about one-third6.
The establishment of protected areas, a common
strategy to preserve biodiversity, requires
adjustments in a changing climate, because natural
ecosystems, especially in temperate and northern
high-latitude biomes, are expected to experience
pressures that potentially force them to migrate into
Average loss of local species in ecosystems on land at different anthropogenically changed areas7. Transboundary
levels of global warming. Based on systematic review by Nunez et agreements therefore need to complement national
al, Climatic Change, 20194. solutions, based on coordinated monitoring of
20species within an ecosystem perspective8. At the Natural climate solutions
same time, protected lands (and waters) face an
The threats to biodiversity and healthy populations
uncertain future. For example, industrial-scale
are all the more alarming as these are key elements
resource extraction and development9 in the
for the earth system’s resilience – they enhance
United States and many Amazonian countries
the stability of ecosystems in the face of disruptive
has downgraded protection levels or downsized
or gradual changes. Ecosystems regulate the local
designated areas.
climate and some play host to huge carbon stocks
and sinks.
Marine and freshwater ecosystems
Coral reefs – marine biodiversity hotspots – are Natural climate solutions based on carbon storage
particularly vulnerable to ocean warming and or stockage in forests, wetlands, and grasslands
acidification. Even if global warming is limited to have for some time been important in the debate
1.5°C, reef ecosystems are projected to decline by on climate mitigation15. Whilst the quantification
a further 70–90%2. At 2°C warming, coral reefs will of their potential remains contentious16, there is
almost completely disappear, shrinking to around general agreement that they are an essential part of a
1% of their original extent2. Marine heatwaves comprehensive mitigation portfolio, highlighting the
trigger mass bleaching and mortality if cumulative central role of the ecosphere within the earth system.
heat exposure exceeds the critical thresholds for However, even with the highest estimates of their
different groups of species10,11. Ocean acidification potential as carbon sinks, decarbonization of the
is another major factor leading to coral mortality1. economy remains an unavoidable imperative17.
The degradation of coral reefs threatens ecosystem
services that sustain the livelihoods of more than
500 million people1.
Marine heatwaves and ocean warming are also
ultimate causes of regime shifts in kelp forest
ecosystems12. Rising water temperatures will affect
marine food webs through species-specific effects on
life cycle events. Contrasting shifts in the predator
and prey populations lead to a temporal mismatch
in food demand and supply, potentially causing
fish population to decline by mid-century in higher
latitudes. This effect is likely to be less pronounced in
the temperate zone13.
Rising temperatures also render freshwater
ecosystems more vulnerable to catastrophic
ecological events. Fish die-offs under summer heat
extremes may double by 2050 in temperate lakes
of the northern hemisphere and increase more
than fourfold by late century, with the effect being
particularly pronounced on lower latitudes14.
217 Climate change threatens food security and the
health of hundreds of millions
Key new insights
▪▪ Undernutrition will be the greatest health risk of climate change with declining agricultural
productivity, particularly in drylands in Africa and high mountain regions of Asia and South
America
▪▪ Increasing concentrations of CO2 will reduce the nutritional quality of most cereal crops, with
hundreds of millions of people in South East Asian and sub-Saharan African countries worst
affected
▪▪ The combined effects of climate change and the rise in CO2 concentrations are projected to result
in a 20% reduction in the global availability of protein by 2050
▪▪ Global fish stocks are set to further decline with climate change, with an additional 10% of the
global population facing micronutrient deficiencies as a result
Climate change reduces agricultural yields and an increased risk of obesity and diabetes; these
impacts can affect health and welfare throughout
Climate change is already affecting food production
life. Over the coming decades, these impacts could
by reducing agricultural yields, especially in the
worsen, as higher concentrations of CO2 directly
tropics. Already more than 820 million people have
affect plants. The global availability of protein is
insufficient food2. Poorer food availability affects
projected to fall by 4.1%, iron by 2.8%, and zinc by
human health by increasing the incidence of stunting
2.5% at CO2 concentrations expected by 20504,5.
– reduced growth and development. These are risks
Multiple rice varieties show large declines in most B
that are most acute for low- and middle-income
vitamins at CO2 concentrations expected later this
countries dependent on rain-fed agriculture1.
century, but not for vitamin E6. As rice underpins
the diets of so many of the world’s poorest people in
Climate change reduces food’s nutritional low-income countries, this could affect the nutrient
quality status of 600 million people6.
The food security impacts of climate change go
Research indicates that by 2050, the global availability
beyond risks to food’s availability. Increasing
of protein could fall by 19.5%, iron by 14.4%, and zinc
concentrations of CO2 in the atmosphere, which
by 14.6%. This accounts for the effect of increasing
drives climate change, will also reduce the nutritional
concentrations of CO2 on nutrient content, as well
quality of major cereal crops, exacerbating food
as reductions in productivity due to climate change,
security challenges over the coming decades.
alongside projected improvements in technology,
market responses, and shifts in diets, crop production,
Research indicates that undernutrition will be the
food prices, and income8. Other research indicates the
greatest health risk of increasing CO2 concentrations
impact of increasing concentrations of CO2 on human
and climate change1. Micronutrient deficiencies
nutrition would primarily affect people in South East
already cause a large burden of disease globally, with
Asia and sub-Saharan African countries9. The public
1.5 billion people deficient in iron, zinc, and other
health intervention of providing vitamin supplements
micronutrients2; 45% of mortality in children under
could partly avert the disease burden. The health risks
five is attributable to undernutrition3.
are amplified when considering the impact of reduced
forage quality on livestock, which are already protein-
Micronutrient deficiencies adversely affect a wide
stressed, with reduced weight-gain. Adaptation
range of health outcomes, particularly affecting
responses could include enriching grassland forage
maternal and child health and with possible adverse
with nitrogen fertilizer or promoting nitrogen-fixing
impacts on cognitive development, metabolism,
species10.
22You can also read