Progress on Freshwater Ecosystems - GLOBAL INDICATOR 6.6.1 UPDATES AND ACCELER ATION NEEDS 2021 - UN-Water
←
→
Page content transcription
If your browser does not render page correctly, please read the page content below
Progress on
       Freshwater
      Ecosystems
   G LO B A L I N D I C ATO R
   6.6.1 U P DAT E S A N D
AC C E L E R AT I O N N E E D S

                        2 0 21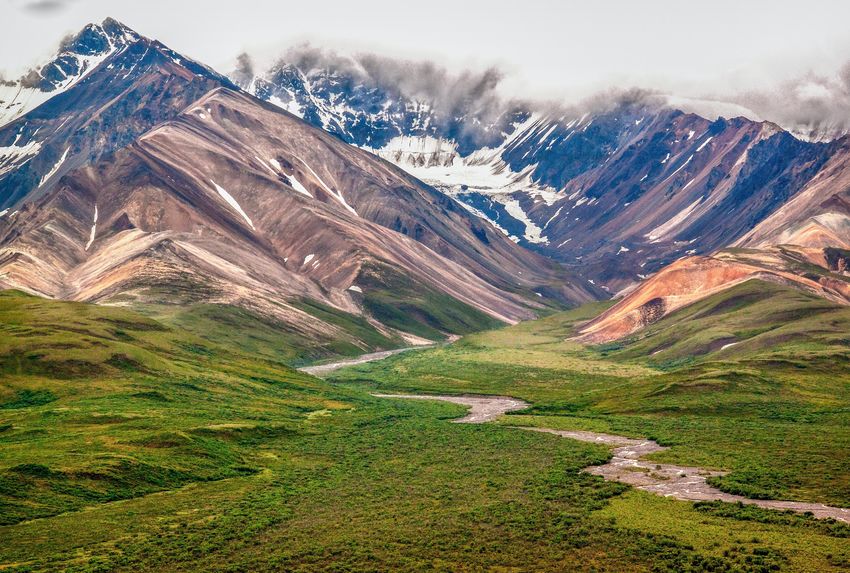
Progress on
Freshwater Ecosystems
Global indicator 6.6.1 updates and
        acceleration needs

              2021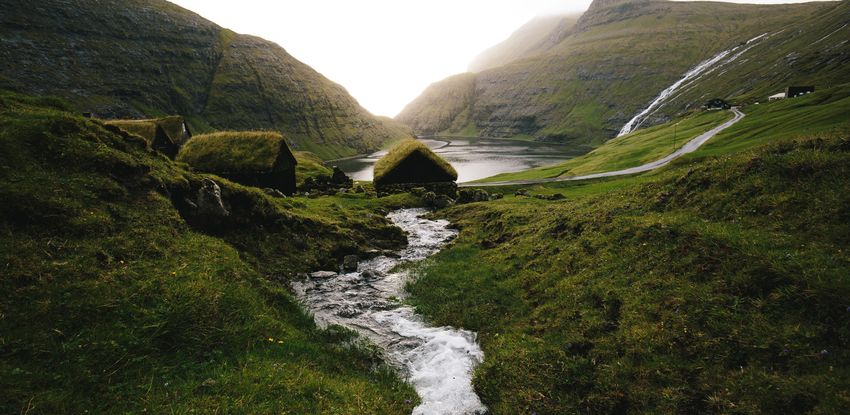
Lead authors

Stuart Crane (United Nations Environment Programme – UNEP); Christian Tottrup, Michael Munck (DHI GRAS)

Contributing authors

Torsten Bondo, Silvia Huber, Cécile M.M. Kittel, Daniel Druce, Mads Christensen, Razvan Bertea,
Jonas B. Sølvsteen (DHI GRAS)

Reviewers

Joakim Harlin (UNEP); Paul Glennie, Gareth James Lloyd, Maija Bertule, Lisbet Rhiannon Hansen (UNEP-DHI Centre on Water and
Environment); Chris Dickens (International Water Management Institute – IWMI); Bo Elberling (University of Copenhagen); Justin Hanson,
Alejandro E. Lasarte (DHI); Ake Rosenqvist (Japan Aerospace Exploration Agency – JAXA)/solo Earth Observation – soloEO); Lammert
Hilarides (Wetlands International); Stefan Simis (Plymouth Marine Laboratory); Kerstin Stelzer (Brockmann Consult); UN-Water Members and
Partners; Strategic Advisory Group for the Integrated Monitoring Initiative for SDG 6

© 2021 United Nations Environment Programme

ISBN No:      978-92-807-3879-7

Job No:       DEP/2377/NA

This publication may be reproduced in whole or in part and in any form for educational or non-profit purposes without special permission
from the copyright holder, provided acknowledgement of the source is made. The United Nations Environment Programme would appreciate
receiving a copy of any publication that uses this publication as a source. No use of this publication may be made for resale or any other
commercial purpose whatsoever without prior permission in writing from the United Nations Environment Programme. Applications for such
permission, with a statement of the purpose and extent of the reproduction, should be addressed to the Director, Communication Division,
United Nations Environment Programme, P.O. Box 30552, Nairobi 00100, Kenya.

Contributions to the UN-Water Inter-Agency Trust Fund from the German Federal Ministry for Economic Cooperation and Development (BMZ),
the Ministry of Foreign Affairs of the Netherlands (BZ), the Swedish International Development Cooperation Agency (Sida) and the Swiss
Agency for Development and Cooperation (SDC) are gratefully acknowledged.

Disclaimers

The designations and presentation of material in this publication do not imply the expression of any opinion whatsoever on the part of the
United Nations Environment Programme concerning the legal status of any country, territory or city or its authorities, or concerning the
delimitation of its frontiers or boundaries. For general guidance on matters relating to the use of maps in publications, please see
http://www.un.org/Depts/Cartographic/english/htmain.htm.

Mention of a commercial company or product in this document does not imply endorsement by the United Nations Environment Programme
or the authors. The use of information from this document for publicity or advertising is not permitted. Trademark names and symbols are
used in an editorial fashion with no intention on infringement of trademark or copyright laws.

The views expressed in this publication are those of the authors and do not necessarily reflect the views of the United Nations Environment
Programme. The authors regret any errors or omissions that may have been unwittingly made. © Maps, photos and illustrations as specified.

Suggested citation

United Nations Environment Programme (2021). Progress on freshwater ecosystems: tracking SDG 6 series – global indicator 6.6.1 updates
and acceleration needs.
Presenting the UN-Water
Integrated Monitoring
Initiative for SDG 6

Through the UN-Water Integrated Monitoring Initiative for SDG 6 (IMI-SDG6), the United Nations seeks to
support countries in monitoring water- and sanitation-related issues within the framework of the 2030
Agenda for Sustainable Development, and in compiling country data to report on global progress towards
SDG 6.

IMI-SDG6 brings together the United Nations organizations that are formally mandated to compile
country data on the SDG 6 global indicators, and builds on ongoing efforts such as the World Health
Organization (WHO)/United Nations Children’s Fund (UNICEF) Joint Monitoring Programme for Water
Supply, Sanitation and Hygiene (JMP), the Global Environment Monitoring System for Freshwater (GEMS/
Water), the Food and Agriculture Organization of the United Nations (FAO) Global Information System on
Water and Agriculture (AQUASTAT) and the UN-Water Global Analysis and Assessment of Sanitation and
Drinking-Water (GLAAS).

This joint effort enables synergies to be created across United Nations organizations and methodologies
and requests for data to be harmonized, leading to more efficient outreach and a reduced reporting
burden. At the national level, IMI-SDG6 also promotes intersectoral collaboration and consolidation of
existing capacities and data across organizations.

The overarching goal of IMI-SDG6 is to accelerate the achievement of SDG 6 by increasing the availability
of high-quality data for evidence-based policymaking, regulations, planning and investments at all levels.
More specifically, IMI-SDG6 aims to support countries to collect, analyse and report SDG 6 data, and to
support policymakers and decision makers at all levels to use these data.

> Learn more about SDG 6 monitoring and reporting and the support available: www.sdg6monitoring.org

> Read the latest SDG 6 progress reports, for the whole goal and by indicator:
   https://www.unwater.org/publication_categories/sdg6-progress-reports/

> Explore the latest SDG 6 data at the global, regional and national levels: www.sdg6data.org
Contents

Foreword........................................................................................................... I

UNEP foreword ................................................................................................ III

Executive summary......................................................................................... VII

1. Freshwater ecosystems in the context of the 2030 Agenda for Sustainable
   Development.................................................................................................. 1

2.	Approach to globally monitoring freshwater ecosystems......................... 2

   2.1. Types of freshwater ecosystems and the properties used to monitor changes......................... 2

   2.2. Use of Earth observations to monitor and report data on indicator 6.6.1.................................... 3

   2.3. Freshwater Ecosystems Explorer – an innovative platform to access indicator 6.6.1 data....... 3

   2.4. Satellite data sources and data providers for monitoring indicator 6.6.1.................................... 5

   2.5. National approval process of indicator 6.6.1 data......................................................................... 6

3.	Global and regional freshwater ecosystem trends derived from indicator
  6.6.1 data....................................................................................................... 8

   3.1 Surface-water trends........................................................................................................................ 10

   3.2 Permanent water trends ................................................................................................................. 11

		Drought-hit Australia ......................................................................................................................... 16

		The Texas High Plains: a story of two parts..................................................................................... 18

   3.3 Seasonal water trends..................................................................................................................... 20

		Siberia’s thawing permafrost............................................................................................................. 24

Flood-hit United Kingdom.................................................................................................................. 26

   3.4 Reservoir water trends..................................................................................................................... 28

		Global boom in reservoirs: what are the consequences?................................................................ 32

   3.5 Water quality trends ........................................................................................................................ 36

		Pollution and climate change threaten the cradle of Andean civilization...................................... 40

		Lake Turkana: a UNESCO World Heritage Site in danger................................................................. 42

   3.6 Mangrove trends ............................................................................................................................. 43

		Mangroves: a bio-shield against tropical storms............................................................................. 46

   3.7 Vegetated wetland trends................................................................................................................ 47

		African wetlands: part of our global commons................................................................................ 50

4.	Accelerating actions towards target 6.6.................................................. 54

   4.1. Advancing integrated water resources management to achieve good ecosystem
   management........................................................................................................................................... 54

   4.2. Advancing the protection of freshwater ecosystems.................................................................. 56

   4.3. Increasing the uptake of freshwater data into water-dependent sectoral processes............... 57

5. Next steps .................................................................................................. 58

		Indicator 6.6.1 monitoring and reporting timeline........................................................................... 58

		Development of indicator 6.6.1 data sets........................................................................................ 58

Annexes.......................................................................................................... 60

   Annex I. Further information on the freshwater ecosystem data portal and accessing country
   statistics................................................................................................................................................. 60

   Annex II. Methodological approaches used to analyse water data.................................................... 61

   Annex III. Globally mapping river basin vulnerability............................................................................ 63

   Annex IV. Ecosystem management tools............................................................................................. 64

Bibliography................................................................................................... 66

Learn more about progress towards SDG 6.................................................... 74
Foreword

    The COVID-19 crisis has caused enormous disruption to sustainable development. However, even before
    the pandemic, the world was seriously off track to meet Sustainable Development Goal 6 (SDG 6) – to
    ensure water and sanitation for all by 2030.

    No matter how significant the challenges we face, achieving SDG 6 is critical to the overarching aim of
    the 2030 Agenda, which is to eradicate extreme poverty and create a better and more sustainable world.
    Making sure that there is water and sanitation for all people, for all purposes, by 2030 will help protect
    global society against many and varied looming threats.

    Our immediate, shared task is to establish safe water and sanitation services in all homes, schools,
    workplaces and health care facilities. We must increase investment in water use efficiency, wastewater
    treatment and reuse, while protecting water-related ecosystems. And we must integrate our approaches,
    with improved governance and coordination across sectors and geographical borders.

    In short, we need to do much more, and do it much more quickly. In the SDG 6 Summary Progress Update
    2021 that preceded this series of reports, UN-Water showed that the current rate of progress needs to
    double - and in some cases quadruple - to reach many of the targets under SDG 6.

    At the March 2021 high-level meeting on the “Implementation of the Water-related Goals and Targets
    of the 2030 Agenda”, UN Member States noted that to achieve SDG 6 by 2030 will require mobilizing
    an additional US$ 1.7 trillion, three times more than the current level of investment in water-related
    infrastructure. To make this happen, Member States are calling for new partnerships between
    governments and a diverse group of stakeholders, including the private sector and philanthropic
    organizations, as well as the wide dissemination of innovative technology and methods.

    We know where we need to go, and data will help light the way. As we ramp up our efforts and target them
    at areas of greatest need, information and evidence will be of critical importance.

    Published by the UN-Water Integrated Monitoring Initiative for SDG 6 (IMI-SDG6), this series of indicator
    reports is based on the latest available country data, compiled and verified by the custodian United
    Nations agencies, and sometimes complemented by data from other sources.

I   PROGRESS ON FRESHWATER ECOSYSTEMS - 2021
The data were collected in 2020, a year in which the pandemic forced country focal points and UN
agencies to collaborate in new ways. Together we learned valuable lessons on how to build monitoring
capacity and how to involve more people, in more countries, in these activities.
The output
a year in which of IMI-SDG6
the pandemic makes
forced anfocal
country important
pointscontribution to improving
and UN agencies data and
to collaborate information,
in new ways. one of the
five
Together we accelerators
learned valuableinlessons
the SDG
on 6how
Global Acceleration
to build monitoringFramework
capacity andlaunched last year.
how to involve more people,
in more countries, in these activities.
With these reports, our intention is to provide decision-makers with reliable and up-to-date evidence on
The output of IMI-SDG6 makes an important contribution to improving data and information, one of the five
where acceleration is most needed, so as to ensure the greatest possible gains. This evidence is also
accelerators in the SDG 6 Global Acceleration Framework launched last year.
vital to ensure accountability and build public, political and private sector support for investment.
With these reports, our intention is to provide decision-makers with reliable and up-to-date evidence on
a year in which the pandemic
Thank you forced
for readingcountry
this focal points and UN agencies
this to collaborate in new ways.
where acceleration is most needed, so document
as to ensureandthefor joining
greatest critical
possible gains.effort. Everyone
This evidence is has
alsoavital
role to play. When
Together we learned valuable lessons on how to build monitoring capacity and how to involve more people,
governments,
to ensure civil society,
accountability business,
and build academia
public, political and and development
private aid for
sector support agencies pull together dramatic
investment.
in more countries, in these activities.
gains are possible in water and sanitation. To deliver them, it will be essential to scale up this cooperation
Thank you for reading this document and for joining this critical effort. Everyone has a role to play. When
acrossmakes
The output of IMI-SDG6 countries and regions.
an important contribution to improving data and information, one of the five
governments, civil society, business, academia and development aid agencies pull together dramatic gains
accelerators in the SDG 6 Global Acceleration Framework launched last year.
are possible in water and sanitation. To deliver them, will be essential to scale up this cooperation across
The COVID-19 pandemic reminds us of our shared vulnerability and common destiny. Let us “build back
countries and regions.
With these reports, our intention
better” is to water
by ensuring provide decision-makers
and with
sanitation for all byreliable
2030. and up-to-date evidence on
where acceleration is most needed, so as to ensure the greatest possible gains. This evidence is also vital
The COVID-19 pandemic reminds us of our shared vulnerability and common destiny. Let us “build back
to ensure accountability and build public, political and private sector support for investment.
better” by ensuring water and sanitation for all by 2030.
Thank you for reading this document and for joining this critical effort. Everyone has a role to play. When
governments, civil society, business, academia and development aid agencies pull together dramatic gains
are possible in water and sanitation. To deliver them, will Gilbert F. Houngbo
be essential to scale up this cooperation across
countries and regions.
UN-Water Chair and President
The COVID-19 pandemic reminds us of our shared vulnerability and commonFund
of the International destiny.
for Let us “build back
better” by ensuring water and sanitation for all by 2030.
Agricultural Development
PROGRESS ON FRESHWATER ECOSYSTEMS 2
PROGRESS ON FRESHWATER ECOSYSTEMS 2
PROGRESS ON FRESHWATER ECOSYSTEMS - 2021 IIUNEP foreword
In 2017, with the ambitions of the 2030 Agenda for Sustainable Development firmly under way, the United
Nations Environment Programme (UNEP) reached out to Member States to request – for the first time
– national data on freshwater ecosystems (Sustainable Development Goal (SDG) indicator 6.6.1). The aim
was to obtain global data on the extent of freshwater ecosystems, and a baseline from which countries
could monitor progress on their protection and restoration (target 6.6). However, it was very clear that
monitoring dynamic ecosystem changes was in practice an enormous and complex undertaking, and an
entirely new task to many countries.
As part of efforts to reduce the global data gap on freshwater ecosystems, UNEP deployed the use of
global Earth observations to generate accurate and statistically robust information. Countries were able
to approve the national and river basin-level data collected, which are freely available on the Freshwater
Ecosystems Explorer thanks to the support of many public and private partners. Tapping into the digital
revolution has enabled long-term, global environmental trends to be observed with accuracy and
confidence.
With only nine years left before 2030, it is crucial to accelerate efforts to protect and restore freshwater
ecosystems. Eighty-five per cent of wetlands have disappeared in the last 300 years and one fifth of the
world’s river basins (including lakes, reservoirs and rivers on which humankind depends to develop
sustainably) are experiencing dramatic, above-normal changes in available surface water.
This is a cause for concern for all countries and signals the need to rapidly increase and enforce the
protection of critical freshwater ecosystems.
III PROGRESS ON FRESHWATER ECOSYSTEMS - 2021While humans may be responsible for driving ecosystem changes, they are also able to find solutions
using available data to make informed decisions. At no other point in human history have people had to
face such climate, pollution and biodiversity crises. Keeping ecosystems healthy will help address these
crises and allow the world to “make peace with nature”. Now is the time for action.
Inger Andersen
Executive Director of the United
Nations Environment Programme
PROGRESS ON FRESHWATER ECOSYSTEMS - 2021 IVTarget 6.6: Ecosystems
By 2030, protect and restore water- SDG target 6.6 seeks to halt the degradation and
related ecosystems, including destruction of freshwater ecosystems and to
assist the recovery of those that are already
mountains, forests, wetlands,
degraded. The target includes ecosystems such
rivers, aquifers and lakes1
as inland and coastal wetlands, rivers, lakes,
reservoirs and groundwater. Actions taken to
Freshwater ecosystems have enormous protect and restore freshwater ecosystems
biological, environmental, social, educational readily contribute to the achievement of other
and economic value and provide a range of SDG targets including on climate (target 13.1 on
goods and services upon which people, and all strengthening resilience and adaptive capacity
life, depend. Ecosystems purify fresh water, to climate-related hazards and natural disasters
regulate flows, supply water and food to billions in all countries), land (target 15.3 to combat
of people, drive water, carbon and nutrient desertification, restore degraded land and soil,
cycles, harbour exceptional freshwater including land affected by desertification,
biodiversity (Reid and others, 2018) and enable drought and floods, and strive to achieve a land
the productive use of water for drinking, degradation-neutral world) and oceans (target
agriculture, energy generation, navigation, 14.1 to prevent and significantly reduce marine
employment and tourism (UN-Water, 2019). In pollution of all kinds, particularly from land-
the context of the Sustainable Development Goal based activities, including marine debris and
(SDG) framework, freshwater ecosystems are nutrient pollution). Progress towards target 6.6 is
foundational natural resources of the biosphere. monitored through indicator 6.6.1.
Numerous development actions depend on them
and either succeed or fail depending on the
functional capacity or integrity of the ecosystem.
Any adverse changes in the quantity and quality
of fresh water ultimately reduce capacities to
develop sustainably.
1 While the official wording of target 6.6 states 2020, it is assumed the date will be updated to 2030.
V PROGRESS ON FRESHWATER ECOSYSTEMS - 2021Indicator 6.6.1: Change in can be used to determine the extent of any
the extent of water-related changes over time. This includes, for example,
changes to the surface area of lakes, reservoirs
ecosystems over time
and wetlands, changes in the water quality of
lakes, reservoirs and rivers, and changes in the
To inform decisions and actions that protect and quantity of river flow and water held underground
restore freshwater ecosystems requires in aquifers.
monitoring their particular properties (area,
quantity and quality) to generate information that
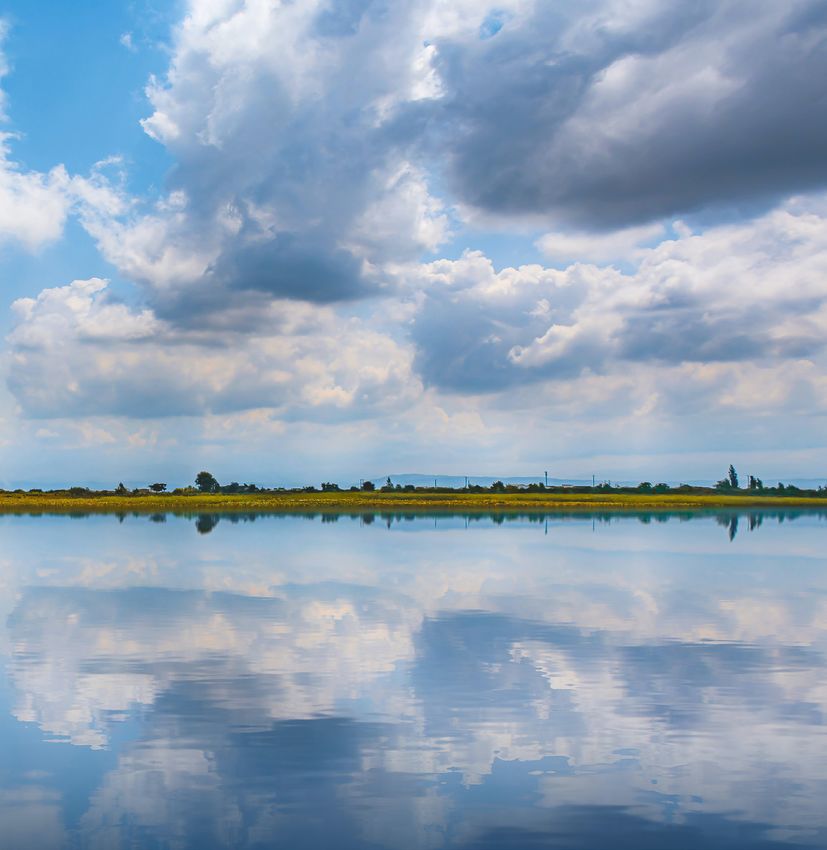
Denali National Park and Preserve, Arkansas, USA by Sterling Lanier on Unsplash
PROGRESS ON FRESHWATER ECOSYSTEMS - 2021 VIExecutive summary
Human activities are causing globally observable Rapid changes are being observed in surface-
changes to freshwater ecosystems and water area. The extent of surface water available
hydrological regimes. Demand for water from the in one fifth of the world’s rivers basins2 has
world’s increasing population has redefined changed significantly in the last five years. These
natural landscapes into agricultural and urban impacted river basins are experiencing both
land. Global precipitation and temperature rapid increases (light blue on map) in their
changes are exacerbating the problem, surface-water area due to flooding, a growth in
impacting the quantity and quality of fresh water. reservoirs and newly inundated land, and rapid
declines (yellow on map) due to the drying up of
lakes, reservoirs, wetlands, floodplains and
seasonal water bodies.
Figure 0.1. Global surface-water changes
Source: DHI GRAS / UNEP
2 4,111 out of a total of 19,426 basins. The indicator compares changes during the last five years with changes during the last 20 years.
VII PROGRESS ON FRESHWATER ECOSYSTEMS - 2021Coastal and inland wetlands are experiencing The area covered by coastal mangroves has also
ongoing loss, with more than 80 per cent of declined globally, by 4.2 per cent since 1996.
wetlands estimated to have been lost since the Wetlands are needed to mitigate climate change,
pre-industrial era. At present, only 10–12 million reduce the impacts of floods and droughts, and
km are estimated to remain.
2
protect freshwater biodiversity loss.
Figure 0.2. Extent of wetlands and mangroves
100% 150 Thousands
Inland wetland
80%
Mangroves
145
60%
40%
140
20%
0% 135
1700 1800 1900 1996 2000 2007 2010 2016 2020
It is crucial that the quality of lake water be Recommendations to
improved. From a sample of 2,300 large lakes, accelerate action to protect
almost a quarter recorded high to extreme
freshwater ecosystems
turbidity readings in 2019. Approximately
21 million people, including 5 million children,
live within a 5 km radius of the high-turbidity Implement and enforce national and river basin-
lakes, and likely rely on their water for various level policies, laws and practices to effectively
purposes. High turbidity can indicate water protect the integrity of freshwater ecosystems
pollution, as the large volume of suspended and undertake large-scale restoration of
particles act as hosts for pollutants such as degraded freshwater ecosystems. Governments
metals and bacteria. Lakes with high turbidity are urged to act to develop and implement action
can therefore adversely impact human and plans, road maps, investment portfolios,
ecosystem health and must be improved to legislative frameworks and governing
prevent this. mechanisms that are able to identify, protect
and/or restore countries’ priority freshwater
ecosystems.
PROGRESS ON FRESHWATER ECOSYSTEMS - 2021 VIIIProtection and restoration interventions should Cross-sectoral planning should be in line with
account for interdependent hydrological the framework of integrated water resources
processes occurring within the entire river basin management (IWRM; indicator 6.5.1), with its
or watershed area. The provision of fresh water implementation supporting the achievement of
of sufficient quantity and quality to sustainably SDG 6.
meet the socioeconomic and environmental
demands of a dependent population should be Improve coordination across institutions
the minimum benchmark of success. working on freshwater security in order to
achieve SDG 6. Recognizing the central role of
Increase the uptake of freshwater data into healthy ecosystems in achieving water security,
water-dependent sectoral processes. Promote, each of the above recommendations requires
share and disseminate available data across effective coordination among the institutions
sectors and institutions and to companies that working on various aspects of social, economic
depend on fresh water. and environmental water-related objectives,
covered by each of the SDG 6 targets.
The SDG 6 and indicator 6.6.1 national focal Implementation of indicator 6.5.1 on IWRM
points are well positioned to promote planning supports cross-sectoral coordination and
across sectors and to process data and trends planning.
(particularly at the basin level) using data on the
Freshwater Ecosystems Explorer.
Denali National Park and Preserve, Arkansas, USA by Sterling Lanier on Unsplash
IX PROGRESS ON FRESHWATER ECOSYSTEMS - 20211. Freshwater ecosystems in the
context of the 2030 Agenda for
Sustainable Development
While freshwater ecosystems are recognized to stress that environmental changes are
within a number of international development increasingly linked to issues of social inequality,
frameworks (including the Convention on including gender inequality, and can exacerbate
Biological Diversity, the United Nations unequal access to natural resources, uneven
Framework Convention on Climate Change distribution of the impacts of environmental
(UNFCCC), the Ramsar Convention on Wetlands degradation, and uneven distribution of
and the Sendai Framework for Disaster Risk responsibilities with respect to addressing
Reduction), this report presents information on environmental challenges (United Nations
global and regional freshwater ecosystem trends Environment Programme [UNEP], 2019).
in the context of the 2030 Agenda for
Sustainable Development using country- Given the huge volume of dynamic freshwater
approved indicator 6.6.1 data. These data, data available per country, this report does not
captured through the global Sustainable detail each national situation. Instead, national
Development Goals (SDGs) reporting process, freshwater data can be viewed online on the
assess changes to surface water, wetlands and Freshwater Ecosystems Explorer. The full time
the water quality of large lakes. Global data series of reported national indicator 6.6.1 data is
remain sparse on streamflow and groundwater, also available online on the United Nations
and are therefore not presented in this report. Statistics Division SDG indicators database and
The information in this document and online is 3
downloadable from the United Nations
intended to inform stakeholders, governments Environment Programme’s (UNEP)
and regional and global organizations about the environmental database. Online story maps and
state and trends of freshwater ecosystems. analyses on freshwater ecosystems can be
Specifically, the report intends to highlight long- accessed on the dedicated case studies
term freshwater trends, connect these with other website.4
related global trends, such as climate and
population trends, and provide evidence on
changes in ecosystems locally, nationally and
regionally. Although this report addresses
physical environmental changes, it is important
3 See https://www.sdg661.app.
4 See https://stories.sdg661.app/#/story.
PROGRESS ON FRESHWATER ECOSYSTEMS - 2021 12. Approach to globally monitoring
freshwater ecosystems
2.1. Types of freshwater Understanding changes in available reservoir
ecosystems and the properties water relative to changes in the surface area of
natural freshwater ecosystems is useful for
used to monitor changes
freshwater ecosystem protection. Although
mentioned in target 6.6, forests are not included
SDG indicator 6.6.1 includes the following in indicator 6.6.1 monitoring, with data instead
different types of freshwater ecosystems: lakes, captured under SDG 15. At present, the indicator
rivers, wetlands, mangroves, groundwater and does not capture data on the biological health or
reservoirs, all of which purely contain fresh connectivity of freshwater ecosystems, even
water, except for mangroves, which contain though the importance of such data is widely
brackish water. Despite not being natural recognized.
freshwater ecosystems, reservoirs are included
as they hold significant amounts of water.
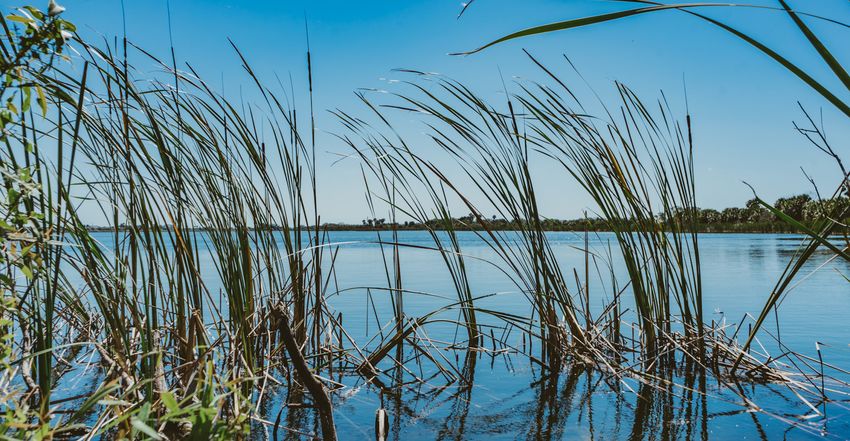
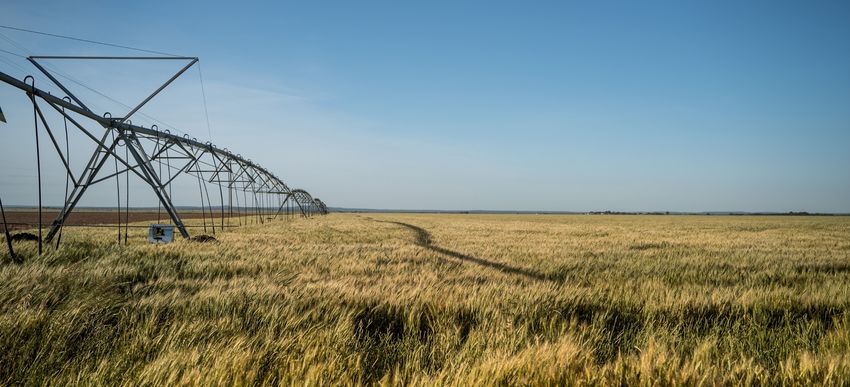
Figure 1. Landscape containing various types of freshwater ecosystems
Source: DHI GRAS.
2 PROGRESS ON FRESHWATER ECOSYSTEMS - 2021To obtain the fullest understanding of the extent Satellite imagery captured between 2006 and
to which ecosystems are changing over time 2010 was also used and compared with data
requires information on the ecosystem from the three most recent years to assess the
properties used to measure changes. For water quality of large lakes and reservoirs.
indicator 6.6.1 these properties include spatial
area (surface area of lakes or wetlands), water The satellite data used to monitor indicator 6.6.1
quantity (change in water volumes within a lake has been disaggregated into ecosystem types,
or aquifer) and water quality (water cloudiness or thereby enabling ecosystem-level decisions to
nutrient load within a lake). Frequent data be taken. Indicator 6.6.1 data are available for
collection is required to accumulate trend lakes and large rivers (permanent and seasonal),
information per ecosystem type. This enables reservoirs, inland wetlands (peatlands, bogs,
any increases or decreases per ecosystem marshes, paddies and fens) and coastal
property and ecosystem type to be tracked wetlands (mangroves). Information on the quality
against a historical benchmark. Through this of freshwater lakes is available for large lakes
monitoring approach, decision makers can with respect to turbidity and trophic state.
observe ecosystem-specific changes, determine Satellite data on river and groundwater volume
the significance of the change (and also possibly changes, however, are not available. Water-
any causality) and make informed decisions on quantity data for these two ecosystem types
interventions to control or mitigate particular should therefore continue to be provided from
freshwater ecosystems. modelling or ground-based measurements.
2.2. Use of Earth observations 2.3. Freshwater Ecosystems
to monitor and report data Explorer – an innovative platform
on indicator 6.6.1 to access indicator 6.6.1 data
The task of monitoring numerous different types In March 2020, UNEP launched the Freshwater
of freshwater ecosystems and consistently Ecosystems Explorer – a free and easy-to-use
capturing dynamic data is enormous. To support data platform.5 It provides accurate, up-to-date,
countries in monitoring indicator 6.6.1, spatial high-resolution, geospatial data used to monitor
and temporal freshwater data are taken from indicator 6.6.1 and depicts the extent to which
satellite-based Earth observations. Satellites freshwater ecosystems change over time in
map the entire surface of the Earth every few every country worldwide. The platform was
days in high resolution (30x30 metres). The last developed to help decision makers readily
20 years’ worth of satellite data have been used access and understand ecosystem changes
to generate statistically robust and accurate within their country.
information on the spatial area changes of
surface waters (lakes, rivers, mangroves,
reservoirs), thereby determining these
ecosystems’ long-term trends.
5 The development of UNEP’s Freshwater Ecosystems Explorer was made possible thanks to the contribution of several partners,
including the European Commission’s Joint Research Centre (JRC), Google and the Global Mangrove Watch consortium. The Freshwater
Ecosystems Explorer is available at https://www.sdg661.app/.
PROGRESS ON FRESHWATER ECOSYSTEMS - 2021 3Figure 2. Freshwater Ecosystems Explorer displaying indicator 6.6.1 data
Source: UNEP Freshwater Ecosystem Explorer (www.sdg661.app)
The data presented on the platform are intended Data are updated annually,
to drive action to protect and restore freshwater thus providing up-to-date
ecosystems and enable countries to track observations per ecosystem
progress towards the achievement of SDG target
that depict long-term trends and
6.6. Data are available for permanent and
annual and monthly records.
seasonal surface waters, reservoirs, wetlands,
mangroves and lake water quality. National data
on these ecosystems – where they exist – are The Freshwater Ecosystems Explorer supports
also accessible on the platform. countries with monitoring and reporting on SDG
indicator 6.6.1 data. All interested practitioners
Data can be visualized using geospatial maps and managers are encouraged to access the
with additional informational graphics and are platform and use the data.
downloadable at the national, subnational and
river basin scales, including transboundary
basins. The data available vary per ecosystem
type, with surface-water data available since
1984, mangroves since 1996, lake water quality
since 2006 and inland wetlands since 2017.
4 PROGRESS ON FRESHWATER ECOSYSTEMS - 20212.4. Satellite data sources National Aeronautics and Space Administration
and data providers for (NASA) Landsat satellites (United States of
America) have been orbiting Earth since the early
monitoring indicator 6.6.1
1970s and provide high-quality global coverage
of surface water extent from 2000. Both the
The data used to support monitoring and European sentinel and Japanese Synthetic
reporting on freshwater ecosystems come Aperture Radar (SAR) satellites are more recent
from several different data providers (Table 1), and, thanks to advances in technology, allow
who use various satellite-derived imagery. image and data capture for mangroves, wetlands
The satellite data differ in their temporal and water quality monitoring.
coverage, and not all indicator 6.6.1 data
therefore use the same reference period.
Table 1. Satellite data sources currently used for status reporting on
indicator 6.6.1
Ecosystem type Satellite data source Website
Permanent, NASA Landsat (1984–present) United States Geological Survey (USGS)
seasonal, reservoir Earth Explorer (https://earthexplorer.
usgs.gov/)
Inland vegetated European Sentinel-1 (2014–present) Copernicus.eu (https://www.
wetlands European Sentinel-2 (2016–present) copernicus.eu/en/access-data)
Water quality European Sentinel-3 (2017–present) Copernicus.eu (https://www.
European Envisat Medium Resolution copernicus.eu/en/access-data)
Imaging Spectrometer (MERIS)
(2002–2012)
Mangroves Japanese L-Band SAR satellites: Jaxa.jp (https://www.eorc.jaxa.jp/ALOS/
JERS-1 SAR (1992–1998) en/dataset/dataset_index.htm)
Advanced Land Observing Satellite
(ALOS) Phased Array type L-band
Synthetic Aperture Radar (PALSAR)
(2006–2011)
ALOS-2 PALSAR-2 (2014–present)
Source: UNEP Freshwater Ecosystem Explorer (www.sdg661.app)
PROGRESS ON FRESHWATER ECOSYSTEMS - 2021 5The European Commission’s Joint Research The indicator help desk team comprises staff
Centre (JRC) uses the historical Landsat archive within UNEP’s Freshwater Unit (Ecosystems
of more than 3 million satellite images to analyse Division), technical specialists from data-
and quantify global surface waters, which are providing organizations (including the JRC and
disaggregated into permanent, seasonal and its partners Plymouth Marine Laboratory and
reservoir data sets (Pekel and others, 2016). The Brockmann Consult), the Global Mangrove Watch
JRC also provides information on the water consortium and DHI GRAS. A no-objection
quality of the world’s largest or most approach was adopted for the national data
strategically important inland water bodies, validation.
including reservoirs. It assesses three recent
years (2017–2019) and compares them with five More than 60 countries raised questions on
historic years (2006–2010). The Global specific ecosystem data, with most technical
Mangrove Watch consortium provides global clarifications resolved. However, some technical
geospatial information on the extent of queries could not be resolved, such as the lack
mangrove changes since 1996 (Bunting and of alignment of lake water turbidity data with
others, 2018). Recently, DHI GRAS globally Finland’s national data (due to the shallow nature
mapped vegetated wetlands in high resolution of the country’s numerous lakes, which
using a combination of optical, radar and thermal influenced the accuracy of turbidity
imagery (Tottrup and others, 2020). measurements captured by satellite imagery)
and the inaccurate national data set for surface-
water extent in the Netherlands (where saline
2.5. National approval process seawater, which is used in the canal and inland
of indicator 6.6.1 data waterway system, were captured as part of
national freshwater surface-area data).
In March 2020, UNEP directly engaged with each In these cases, the specific ecosystem data were
of its Member States to obtain national approval reported with explanatory notes and were not
of indicator 6.6.1 data. National statistics per included in the national data series.
ecosystem type were sent to confirmed focal
persons for SDG 6 and indicator 6.6.1, as well In February 2021, nationally approved data for
as national statistics offices. At present, 190 countries were submitted to the United
160 countries have confirmed national focal Nations Statistics Division. Data were not
persons for indicators. In the 33 countries available for three small island developing
where there were no such focal persons, States.
communications were directed either to the
national focal persons for SDG 6 or the SDG
national statistics office.
A UNEP help desk for indicator 6.6.1, which has a
dedicated United Nations email address, was set
up to manage the national data approval process
and respond to technical questions and queries
from countries about indicator data.
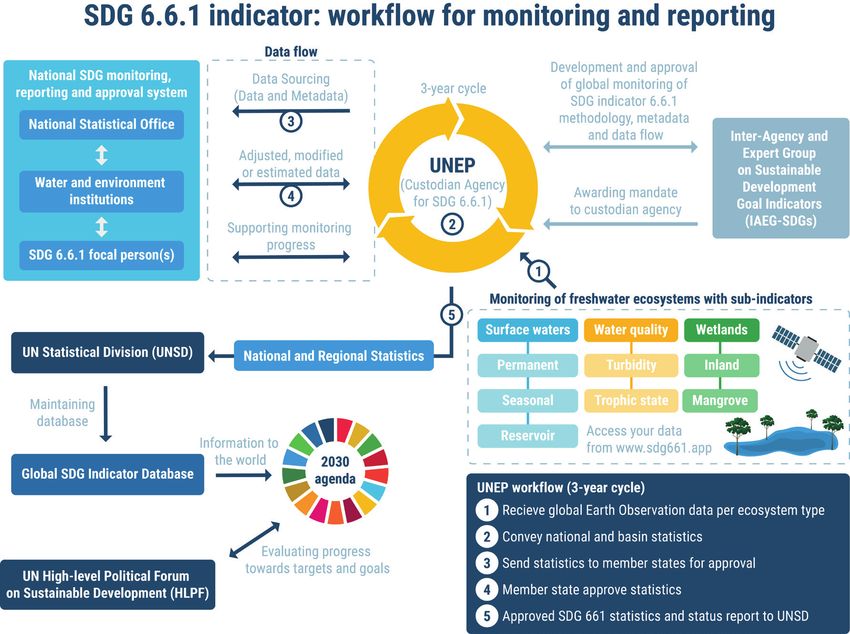
6 PROGRESS ON FRESHWATER ECOSYSTEMS - 2021Figure 3. Workflow for monitoring and reporting SDG indicator 6.6.1
Source: DHI GRAS / UNEP
Saksun, Faroe Islands by Marc Zimmer on Unsplash
PROGRESS ON FRESHWATER ECOSYSTEMS - 2021 73. Global and regional freshwater
ecosystem trends derived from
indicator 6.6.1 data
Understanding the state of the world’s The analysis presented in the following
freshwater ecosystems is an essential first step subsections uses evidence from global and
in their protection and restoration. This section regional single-pressure statistical correlations
of the report and its associated online story to confirm co-variability with respect to time and
maps present the extent of freshwater changes,
6
locations. The statistics are then supported
linking these to known pressures and drivers. using published scientific literature, with
causality established. All results have been
Recognizing how multiple pressures interact to validated with domain experts. The analysis uses
cause changes in freshwater ecosystems is river basins to assess freshwater ecosystem
complex. For example, growing populations drive trends, mapping the basin-level analysis at the
ecosystem changes through increased demand global and regional levels. River basins are
to generate locally stored fresh water, which naturally connected hydrological systems where
alters hydrological systems, or by deforesting local freshwater changes (related to abstraction,
and urbanizing areas, which increases run-off, drought, flooding, degradation and pollution)
flooding rates and nutrient and sediment loss, may affect larger connected freshwater
thereby degrading water bodies. Draining inland ecosystems within the catchment, including
wetlands and removing costal mangroves lowers across national borders. Although river basins
these ecosystems’ capacity to moderate the experience a degree of natural variation in water
effects of extreme weather events and also quantity and quality, they are increasingly
reduces freshwater habitats and biodiversity. exposed to climate change, population growth
Climate change-induced rainfall variations are and land-cover change from deforestation,
altering the geographical distribution of urbanization and dam and reservoir
permanent surface water. At the same time, construction.
increased temperatures may result in drought
and less surface water, while also contributing to
increased glacial melting and permafrost
thawing, thus leading to increased surface water.
6 See https://stories.sdg661.app/#/story/2/0/0.
8 PROGRESS ON FRESHWATER ECOSYSTEMS - 2021The impacts of changes in freshwater It is hoped that the findings of the analysis will
ecosystems are presented in a series of accelerate action towards improved
downloadable case studies and online story management and protection of freshwater
maps. These case studies and story maps ecosystems.
observe changes in different freshwater
ecosystems (as reported under indicator 6.6.1) Each case study includes data on
and link them to impacts on the ground. The the degree of integrated water
story maps also highlight the wide array of resources management (IWRM)
freshwater ecosystem pressures, the complex implementation in the country, as
interaction between natural and anthropogenic reported by the countries under indicator 6.5.1.7
stressors, and how different pressures act over The importance of implementing IWRM for
large areas and across long timescales. These ecosystem protection is discussed in chapter 4
complex and hierarchically-linked interactions of this report on accelerating actions towards
must be considered when designing approaches target 6.6.
and taking action to protect and restore affected
freshwater ecosystems, and ultimately make The ecosystem trends analysis maps freshwater
them more resilient to future changes. changes, aggregated at the regional level, using
the SDG regional delineation shown in Figure 4.
Figure 4. Map of SDG regions
Source: DHI GRAS / UNEP
7 For more information on indicator 6.5.1 on IWRM implementation, see http://iwrmdataportal.unepdhi.org/.
PROGRESS ON FRESHWATER ECOSYSTEMS - 2021 93.1 Surface-water trends Individually, these types of surface water provide
very different environmental, social and
Changes in the extent of surface water are economic benefits, but together – and when
measured at five-year intervals relative to a adequately protected and well managed – they
20-year baseline period (2000–2019) and based secure vital services for people and help
on the annual aggregation of monthly water maintain the health and integrity of ecosystems.
occurrence maps. Permanent, seasonal and It is therefore crucial to examine these water
reservoir data have been merged into a single bodies together to gain an overall understanding
surface-water trends map (though they are also of the situation, while also respecting their
presented separately) to depict river basins with individual importance, exposure to different
the highest changes in surface-water area in the pressures and threats, and specific management
last five years (2015–2019). needs. In the following sections, this report
presents the mapping and analysis of changes in
Analysis of surface-water extent over the last permanent water, seasonal water and reservoirs.
20 years reveals that one fifth of the world’s river
basins experienced either a high increase or
decrease in surface water in the past five years Online story maps can be
(Figure 5). River basins with increased surface- accessed on the dedicated
water area tended to correspond to locations case studies website.
with a growth in reservoirs, newly inundated land
(i.e. land intentionally flooded for agriculture)
and areas with increased flooding, with National data of combined surface-water
decreased surface-water areas linked to changes (i.e. permanent + seasonal + reservoir
locations that experienced drought, increased changes) per country are available for download
demand and excessive water usage. The from the indicator 6.6.1 report website.8 The
surface-water changes presented in Figure 5 are table provides country information on changes in
also indicative of climate change, the impacts of surface-water area observed in 2015 and 2020,
which have contributed to the drying out of lakes which are compared against a 20-year reference
in arid regions and expansion of lakes due to period. Countries can use this tabulated data to
glacial melt and permafrost thawing. observe the extent to which surface waters are
increasing or decreasing.
The map shown in Figure 5 presents the overall
changes to all open inland surface waters,
including natural waters (rivers and lakes) and
artificial reservoirs, both permanent and
seasonal.
8 See https://stories.sdg661.app/#/pdfs/report-annexes.
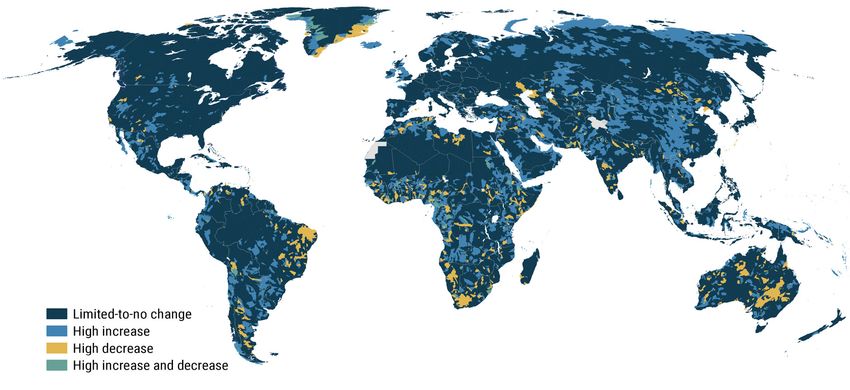
10 PROGRESS ON FRESHWATER ECOSYSTEMS - 2021Figure 5. Basins with an observed high increase and/or decrease in surface-
water area during 2015–2019 compared with 2000–2019
Note: The map summarizes changes to all open inland surface waters, both natural and artificial (for more
information about the data analysis methodology, please refer to annex II of this report).
Source: DHI GRAS / UNEP
3.2 Permanent water trends Changes in permanent water can be an indicator
of climate change, but they also stem from land-
In the context of indicator 6.6.1, permanent water use changes and hydrological manipulations that
is defined as water that is observable year-round. may impact river flows and the extent and
Historically, people have chosen to live close to storage of lake water. A better understanding of
permanent water such as lakes and rivers the dynamics and influencing factors of
because they support domestic and agricultural permanent water will help improve the
water needs, as well as trade and transport. management and regulation of water resources.
However, since the industrial era, people have In many locations, both surface water and
been able to decrease their reliance on living groundwater are used to meet water demand,
nearby permanent water bodies through the use which underscores the importance of a systems-
of canals, pipelines, groundwater pumping and based approach to water resources
desalination, and due to the development of management.
more effective land and air transportation (Fang
and Jawitz, 2019). However, human settlement Figure 6 shows the changes in permanent water
patterns are still influenced by access to globally. Since water has a natural variability, the
permanent water resources, which enable identification of high-change basins is based on
irrigation, hydropower, navigation and domestic annual fluctuations over a 20-year baseline
usage (Kummu and others, 2011). period.
PROGRESS ON FRESHWATER ECOSYSTEMS - 2021 11The global map and summary statistics for the variability observed in the Australia and Western
SDG regions suggest there is no dominant global Asia and Northern Africa SDG regions (Figure 8),
trend for permanent water (Figure 6 and which indicates that drier regions have a higher
Figure 7). Instead, significant changes are sensitivity to climate variability.
occurring at the subregional level, with high
increases and decreases in permanent water National data of permanent surface-water
depicted in Figure 6. Decreasing permanent changes per country are available for download
water trends are most observable in Australia from the indicator 6.6.1 report website. The table
and sub-Saharan Africa, with increasing trends provides country information on changes in
primarily found in Central, Eastern and Southern permanent surface-water area observed in 2015
Asia and Northern Africa. Europe and North and 2020, which are compared against a 20-year
America (excluding Greenland and the United reference period. Countries can use this
States of America) have the fewest basins with tabulated data to observe the extent to which
significant changes. permanent water bodies are increasing or
decreasing.
The most interesting pattern of the permanent
surface-water changes over the full 20-year
reference period (2000–2019) is the higher
Figure 6. Basins with a high increase or decrease in permanent water during
2015–2019 compared with 2000–2019
Note: For more information about the data analysis methodology, please refer to annex II of this report.
Source: DHI GRAS / UNEP
12 PROGRESS ON FRESHWATER ECOSYSTEMS - 2021Figure 7. Share of basins per SDG region with a high increase or decrease in
permanent surface water during 2005–2019 relative to the total number of
basins and compared with the 2000–2019 baseline
Basins with high permanent surface water changes 2015-2019
Australia and New Zealand
Central and Southern Asia
Eastern and South-Eastern Asia
Europe and Northern America
Latin America and the Caribbean
Northern Africa and Western Asia
Oceania
Sub-Saharan Africa
IWRM (%) Remaining basins (%) Increase (%) Decrease (%)
Notes: Red lines indicate the average degree of IWRM implementation in the respective SDG regions (refer to indica-
tor 6.5.1). For more information about the data analysis methodology, please refer to annex II of this report.
Source: DHI GRAS / UNEP
PROGRESS ON FRESHWATER ECOSYSTEMS - 2021 13Figure 8. Change in the relative share of basins per SDG region with high
changes in permanent surface water for each five-year period since 2000
and compared with the 2000–2019 baseline
Basins with high permanent surface water increase or decrease
.
Australia and New Zealand Europe and Northern America
Central and Southern Asia Oceania
Eastern and South-Eastern Asia Sub-Saharan Africa
Europe and Northern America Northern Africa and Western Asia
2000–2004 2005–2009 2010–2014 2015–2019
Source: DHI GRAS / UNEP
Although fluctuating rates of permanent surface The case studies illustrate the value of the SDG
water tend to exceed those that have indicator 6.6.1 app as a first-line assessment tool
unidirectional trends (Pickens and others, 2020), for evaluating the status and integrity of the
case studies from Australia, Brazil and India9 world’s freshwater resources. Countries are
indicate that observed decreases in permanent encouraged to use the SDG indicator 6.6.1 app
water are part of a concerning trend driven by and based on the observed changes, consider
climate change and further impacted by local whether action is needed to protect and/or
anthropogenic factors. In the case of the Texas restore freshwater ecosystems.
High Plains in the United States of America, the
opposite has occurred, with increases in
permanent surface water observed in a complex
geography, where surface-water changes are the
result of complex interactions between climate
change, recent conservation practices and
excessive groundwater usage.
9 See Australia; Brazil; India.
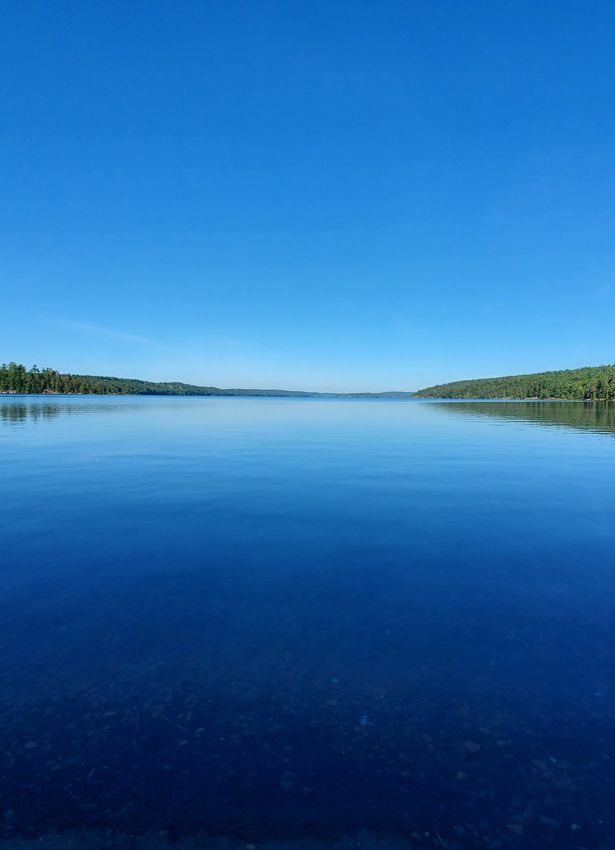
14 PROGRESS ON FRESHWATER ECOSYSTEMS - 2021Big Basswood Lake, Huron Shores, Canada by James Thomas on Unsplash
PROGRESS ON FRESHWATER ECOSYSTEMS - 2021 15CASE STUDY:
PERMANENT WATER
Drought-hit Australia Wales, the Australian Capital Territory, Victoria
and South Australia. The MDB’s landscape, water
The online story map can be accessed on the resources, plants and animals form some of
dedicated case studies website.10 Australia’s most unique habitats and
ecosystems, hosting 120 waterbird species and
Some of the worst droughts in Australia have more than 50 native fish species across
occurred this century. From 2003 to 2012 and 16 internationally significant wetlands spanning
2017 to 2019, severe drought impacted 12 ecoregions within the basin. About 40 per
freshwater ecosystems across much of eastern cent of Australia’s agricultural produce comes
and inland Australia. Many of Australia’s regions from the MDB, which also has significant
are still experiencing significant periods of economic, cultural and environmental value to
drought, with the recent drying trend (i.e. higher the country. More than 2.2 million people live
temperatures and reduced cool-season rainfall) within the MDB, including 40 First Nations to
expected to continue according to current whom water plays a key role in their well-being
projections. The decrease in rainfall and increase and identity, along with other aspects of
in temperatures will increase potential Aboriginal culture (Australian Government,
evapotranspiration, decrease soil moisture and Murray–Darling Basin Authority, n.d.).
significantly reduce run-off and streamflow
(Australian Government, Murray–Darling Basin Rainfall deficiencies in the MDB hit a record level
Authority, 2019), hydrological changes that will from 2017 to 2019. In July 2019, a climatologist
affect freshwater ecosystems. The importance from the Australian Bureau of Meteorology
of protecting these ecosystems in the face of stated that the drought in the MDB was officially
climate change is particularly evident in the worst on record, exceeding the Federation,
Australia’s Murray–Darling Basin (MDB). World War II and Millennium droughts (Grain
Central, 2019).
The MDB is the country’s largest and most
complex river system, covering 1 million km2 Land-use changes and water extraction
(14 per cent of Australia’s land area) of practices that did not fully consider the MDB’s
interconnected rivers and lakes in south-eastern long-term health have also affected the basin.
Australia as it traverses Queensland, New South Since the European settlement in the MDB during
10 See https://mango-river-0ac1c3d03.azurestaticapps.net/#/story/0/0/0.
16 PROGRESS ON FRESHWATER ECOSYSTEMS - 2021You can also read