Building a cleaner, stronger BC - 2019 Climate Change Accountability Report - Province of ...
←
→
Page content transcription
If your browser does not render page correctly, please read the page content below

Building a cleaner,
stronger BC
2019 Climate Change Accountability Report
ii               Building a cleaner, stronger BC 2019 Climate Change Accountability Report

     TABLE OF CONTENTS
     Message from the Minister                                                                       iv

     Executive Summary                                                                                1

     1     On the path to a cleaner B.C.                                                              4

     2     Reaching our targets                                                                       8

     3     Measuring our progress                                                                    11
           3.1   Transparency and accountability                                                     11
           3.2   Emissions performance—most recent data                                              13
           3.3   Sector-specific indicators—what else we’re measuring                                15
                 3.3.1 Transportation                                                                15
                 3.3.2 Industry                                                                      17
                 3.3.3 Buildings and communities                                                     18
           3.4   Carbon tax revenue and overall climate-related spending                             20

     4     What we’ve accomplished                                                                   21
           4.1   Getting around                                                                      21
                 4.1.1 More electric vehicles (EVs) on the way                                       21
                 4.1.2 Speeding up the switch to cleaner fuels                                       26
                 4.1.3 Less time in gridlock                                                         27
           4.2   Improving where we live and work                                                    30
                 4.2.1 Better buildings—making future buildings more energy efficient                31
                 4.2.2 Supporting better buildings now                                               35
                 4.2.3 Supporting communities                                                        37
                 4.2.4 Public sector leadership                                                      39
           4.3   Reducing waste and turning it into a resource                                       42
           4.4   Cleaner industry                                                                    44
                 4.4.1 Low-carbon industrial strategy                                                44
                 4.4.2 CleanBC Program for Industry                                                  46
                 4.4.3 Making industrial transportation cleaner                                      47
                 4.4.4 Making B.C. industries the cleanest in the world                              48
                 4.4.5 Technological innovation, including carbon capture, utilization and storage   50
                 4.4.6 Forest carbon management                                                      52
                 4.4.7 Hydrogen economy                                                              52
iii               Building a cleaner, stronger BC 2019 Climate Change Accountability Report

      5     Helping people get the skills they need                                           54

      6     Preparing for a changing climate                                                  56
            6.1    Strategic climate risk assessment                                          57
            6.2    Climate preparedness and adaptation strategy                               58

      7     Working together                                                                  61
           7.1     Partnering with Indigenous peoples                                         61
                   7.1.1 Engaging with Indigenous peoples                                     61
                   7.1.2 Supporting Indigenous climate leadership                             62
           7.2     Partnering with business and industry                                      64
                   7.2.1 Small business                                                       64
                   7.2.2 Industry                                                             64
           7.3     Partnering with local governments                                          65
           7.4     Engaging with youth                                                        65
           7.5     Engaging with British Columbians                                           66

      Appendix A                                                                              67
           1.      List of indicators that are currently quantified                           67
            2.     CleanBC initiatives by sector                                              68

      Appendix B                                                                              70
            Final report from Climate Solutions and Clean Growth Advisory Council             70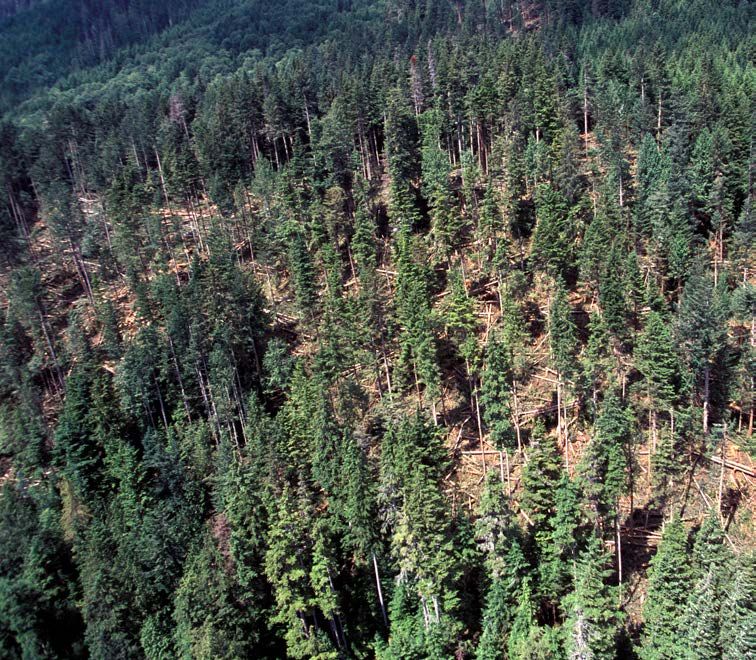
iv                           Building a cleaner, stronger BC 2019 Climate Change Accountability Report

MESSAGE FROM THE MINISTER
                              It’s been just over a year since the launch of CleanBC—our government’s plan to build a cleaner,
                              better future where everyone benefits.
                              From the very beginning, CleanBC has been a collaborative effort. Working together as citizens,
                              communities, business, Indigenous peoples, industry, and all levels of government we are rising to
                              the challenge of the climate crisis by reducing pollution and creating new opportunities.
                              CleanBC will make cleaner options more convenient, available, and affordable. That’s why we’re
                              helping with the upfront costs that come with home energy retrofits and electric vehicles, so
                              people can benefit from lower heating and gas bills over the long run.
                            Twenty years from now, every new light-duty car sold will be a zero-emission vehicle. Already, we’ve
                            seen record numbers of electric vehicles on the road, thanks to CleanBC rebates, more consumer
options, and expanded charging stations across the province. With CleanBC efficiency rebates, we are helping to make homes
and workplaces more efficient and more comfortable. And we are working with industry to help make businesses in B.C. the
cleanest in the world.
Along the way, we have made it a priority to listen to people across the province as we are developing new policies and programs.
Public engagement on our plastics action plan was one of the most popular undertaken by government. We heard from
thousands of people during our CleanBC telephone townhalls, on proposed plans for boosting active transportation, making
sure we have the skills we need for a low-carbon economy, and how we can best respond to changing weather and other
climate impacts.
The Province’s work to fight climate change has benefited from the advice of members of the Climate Solutions and Clean Growth
Advisory Council, who have now completed their two-year term. Their dedication and hard work helped make a stronger, better
CleanBC plan. In 2020, a new advisory committee will be established by law to help provide independent advice to government
and will continue to strengthen our actions moving forward.
While we have launched a broad suite of new programs and actions to achieve our targeted results, we have also heard from
many people – particularly from young people – that we need to hold ourselves accountable. We need to make sure our plan is
working, and that means being honest and transparent about our progress.
And that’s exactly what we’re doing. In this first progress report, we have included summaries of our initiatives launched to date,
and have identified areas of work still ahead. Building on over a decade of climate action in B.C., we provide technical detail on
how we measure emissions reductions and how we intend to improve our ability to track and report our progress in the future.
And we’ve made it law for all future governments to report annually on their progress to the legislature, so they are accountable
for the results.
Governments around the world are grappling with the important question of how we can work together to take on the biggest
challenge of our time. In British Columbia we are demonstrating that we can build a strong, sustainable economy and protect our
clean air, land, and water. We can create opportunities for people to support themselves, their families, and their communities.
Our work to fight climate change is a shared priority with the B.C. Green Caucus, and we’ve worked in collaboration in the
development of CleanBC and the passing of the Climate Change Accountability Act.
There is much more work ahead, but together with people across the province we’ve made a strong start. We will continue
working to create opportunities for every community and to protect the places we love for future generations.

Honourable George Heyman
Minister of Environment and Climate Change Strategy
v      Building a cleaner, stronger BC 2019 Climate Change Accountability Report

    CleanBC has made British Columbia the leader in Canada on clean energy. We’re putting
    record numbers of electric vehicles on the road, using energy more efficiently in our homes
    and buildings, and powering our industries with B.C.’s supply of clean, reliable and affordable
    hydro-electricity. What’s more, by investing in clean technology and new innovations, our plan is
    working to boost the economy and create new opportunities in communities across the province.
    Honourable Bruce Ralston
    Minister of Energy, Mines and Petroleum Resources

    With CleanBC we’re building a more sustainable transportation system. We’re expanding public
    transit and making it easier to get around without a car – and reducing pollution and gridlock
    while we do it. Transit fleets are becoming green so we can connect the places where we live,
    work, learn, and explore, in a healthy way.
    Honourable Claire Trevena
    Minister of Transportation and Infrastructure

    Whether it’s generating clean energy, building infrastructure more efficiently, or designing new
    technologies, making B.C. cleaner will create good jobs in communities across the province. We’re
    making sure that everyone in B.C. has the skills and training they need to thrive as we reduce
    pollution and build a brighter future for generations to come.
    Honourable Melanie Mark
    Minister of Advanced Education, Skills and Training

    We’re building a blueprint for a low-carbon economy that creates opportunities across the
    Province. We are leaders in clean technology, developing new products and services in a global
    marketplace clamoring for solutions. With CleanBC we can continue to create good jobs, invest in
    our talented workforce, and keep this a great place to live and work.
    Honourable Michelle Mungall
    Minister of Jobs, Economic Development and Competitiveness

    Through hard work and collaboration, the B.C. Green caucus and B.C. government have moved
    the dial on evidence-based climate and economic policies. To truly seize the opportunity CleanBC
    presents us as an economic framework, however, we need to fully embrace innovation across our
    economy, and ensure that communities throughout our province can prosper in a changing future.
    MLA Adam Olsen
    Saanich North and the Islands, Interim BC Green Party Leader

    I was pleased to collaborate with Government on legislation that mandates annual reporting on
    climate action, adding credibility to the commitments in CleanBC. I welcome this first climate
    change accountability report which shows that we’ve accomplished a great deal together and
    that we have much more to do. I remain committed to the task.
    MLA Dr. Andrew Weaver
    Oak Bay-Gordon Head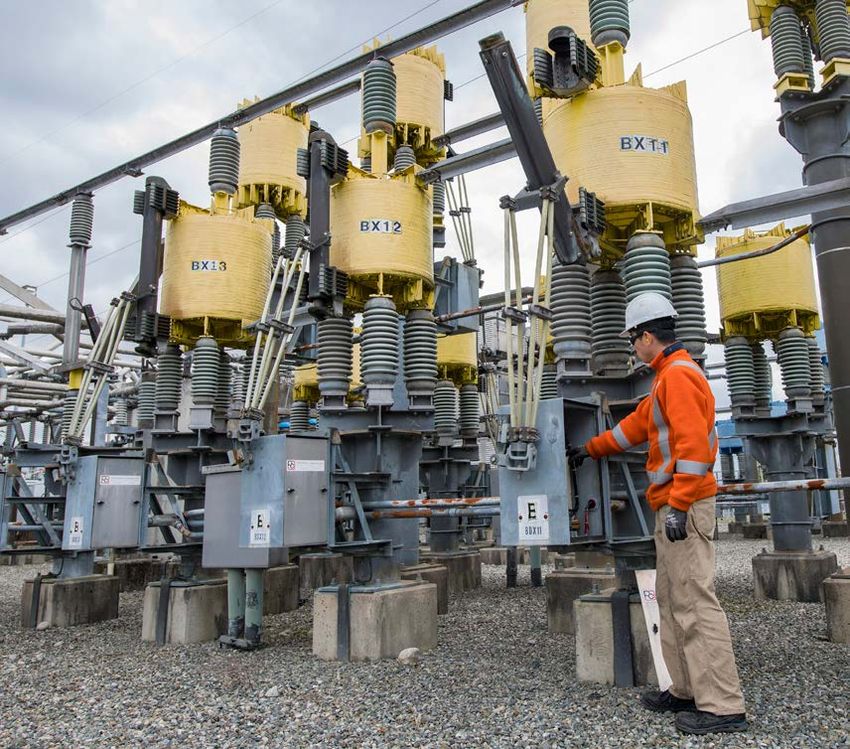
vi Building a cleaner, stronger BC 2019 Climate Change Accountability Report
1                 Building a cleaner, stronger BC 2019 Climate Change Accountability Report

    EXECUTIVE SUMMARY
    Our CleanBC plan set out a pathway to reduce emissions and make life better for
    people. In our first year, we’ve made significant progress and are continuing to
    develop new initiatives that build a brighter, stronger future for this province.
    CleanBC is an integral part of our economic plan. We are building a stronger, more sustainable
    economy that creates jobs and opportunities for all British Columbians. By focusing on some of the
    sectors that most affect our daily lives, our strategy shifts key sectors away from fossil fuels and towards
    cleaner energy.
    Our work is well underway with a suite of incentives, programs, and legislation launched in the last year.
    And we have just begun.

    Early signs of success
    We’ve seen a number of strong signals that the plan is working.
       ¡ In 2019, we saw a higher than expected adoption of electric vehicles, at almost nine per cent of
         new car sales, with an ever-expanding charging network. This moves us much more quickly than
         anticipated to achieving the legislated 2025 goal of 10 per cent light-duty vehicles sales. We will
         continue to closely monitor this trend in future years.
       ¡ We’re renovating thousands of homes and businesses to be more energy efficient and supporting
         communities to develop clean energy and infrastructure. While we had lower uptake on building
         efficiency improvements in the first half of the year, we revised the approach to focus on outreach
         and making our offers simpler and easier to understand. We’ve seen early signs this is working. Our
         steps towards energy efficiency put us number one in Canada.
       ¡ With action from B.C. Transit, TransLink, and B.C. Ferries, we’re transforming our fleets of buses and
         ferries. We’ve seen 14 new electric buses purchased or deployed in 2019, while B.C. Ferries has added
         two battery-hybrid vessels to its fleet and will be adding four more by 2022.
       ¡ Current data shows B.C. industries are among the cleanest in the world, and will continue to reduce
         carbon pollution with new benchmarks, regulations, and projects to lower their emissions.
       ¡ Province-wide over the last decade, we’ve slowed emissions growth while expanding our economy.

    Tracking our progress in the years ahead
    Working with people, industry and businesses, Indigenous communities and businesses, and local
    and provincial governments, the full scope of actions envisioned in CleanBC will accomplish our 2030
    emissions reduction goals. The initiatives announced in the last year set us 79 per cent of the way to our
    target, and we are developing further initiatives to close the gap.
    With our most recent economy-wide data on emissions from 2017, it’s still too early to see the broad
    impact of our policies. Our current modelling forecast suggests that emissions could increase over the
    next couple of years and then begin a downward trend as CleanBC policies take effect. With our latest
    analysis we’ve also received more accurate information about provincial emissions and the model
    suggests we are slightly closer to meeting our 2030 emissions reduction targets as a result.
2                Building a cleaner, stronger BC 2019 Climate Change Accountability Report

    To ensure we meet our commitments, we need to continually monitor the impacts of our activities and
    adjust our approach as needed. That’s why we’re establishing interim and sectoral emissions reduction
    targets with ground-breaking legislation passed last fall.

    Listening and learning from people across the province
    We’ve reached out to tens of thousands of British Columbians as we’ve embarked on the important first
    steps of CleanBC. We’ve met with representatives from Indigenous communities to better understand
    the impacts of climate change and begin to identify how we can work together to respond. And we’ve
    worked with our partners at local and national levels of government as programs have rolled out—and
    will continue to do so as we develop next steps.
    We held telephone townhalls across the province to speak with people directly and consulted with
    British Columbians as we rolled out key initiatives, including:
       ¡ To help get people out of their cars, we invited public feedback as we launched an active
         transportation strategy to support safer, more accessible commuting options.
       ¡ We received record amounts of feedback on the proposed Plastics Action Plan we released
         last summer.
       ¡ We’ve begun a dialogue on how communities can be best prepared for extreme weather and
         other climate impacts.
       ¡ We spoke to businesses, workers, community members, Indigenous communities, and educators
         about making sure people have the skills they need to thrive in a cleaner economy.
    Together we’re growing the use of clean and renewable energy in how we get around, heat our
    homes, and fuel industry by providing low-carbon products, services, and energy solutions at home
    and to the world. We’re demonstrating that cleaner is better, and our innovative people, businesses,
    communities, and industries are leading the way.
3 Building a cleaner, stronger BC 2019 Climate Change Accountability Report
HIGHLIGHTS OF THE CLEANBC PLAN
¡ Reducing pollution from transportation with cleaner fuels, cleaner vehicles, and more
support for measures to get people out of their cars
¡ Improving the buildings where we live and work by raising our standards for new
construction and encouraging energy-saving improvements in existing homes and
workplaces
¡ Reducing emissions from organic waste and diverting it from landfills
¡ Reducing emissions from industry with targeted incentives
¡ Working with employers, Indigenous communities, labour groups and others to make sure
people throughout B.C. can get the skills they need for the jobs of the future
What we’ve seen
EVs almost Transit ridership up More carbon tax
nine per cent in rebates going to
of sales in low income families
in
Less organic waste
in landfills over the
last years
Industry Jobs have
investing more doubled in the
than million environmental The carbon
in emission and clean tech GHG emissions intensity of our
reduction sectors over the per capita are economy has gone
projects last years down over the down over the
last years last years
4                                              Building a cleaner, stronger BC 2019 Climate Change Accountability Report

                 1                            ON THE PATH TO A CLEANER B.C.
    The actions set out in CleanBC will reduce emissions across the economy over the
    next ten years and beyond. In the year since its launch, we have made significant
    headway with a number of key programs and initiatives and there is still more
    to do.
    The CleanBC actions laid out in December 2018 are set to reduce nearly 17 million tonnes (MT) of
    greenhouse gas emissions (GHG) by 2030, getting us 79 per cent of the way to our 2030 target. This puts
    us on a path to reduce emissions by 80 per cent by 2050, in line with Canada’s commitment under the
    Paris Agreement.
    We are achieving this through a slate of programs targeting the key sectors of industry, buildings,
    transportation, and waste. We are currently identifying additional initiatives to fully close the gap to our
    2030 target.

                                                                    Pathway to meeting our climate goals
                                       70
    Million tonnes of carbon dioxide

                                                   Past Emissions                                 Reference Case
                                       65
                                                                                                                                        Buildings and
                                       60                                                                                               communities reductions
                                       55                                                                                               Transportation reductions
                                       50
                                                                                                                                        Industry reductions
                                       45
                                                                                         Gap to 2030 Target:                            Additional policies
                                       40                                                                                               to reach our target
                                                                                                5.5 Mt
                                       35
                                       30
                                            2008   2010    2012     2014   2016   2018     2020     2022    2024   2026   2028   2030

    Meeting our goals
    Meeting our targets requires a clear-eyed approach to the challenges and opportunities facing the
    province. Planning for future reductions must address the continued strong population and economic
    growth in B.C. and ensure affordability and accessibility to key services for people across the province.
    The latest emissions data we have is for 2017, which means we have a two-year lag when it comes to
    measuring our progress. We are committed to remaining honest and accountable about how we’re
    meeting our goals, which is why we’ve enacted legislation requiring annual reporting on progress and
    results on CleanBC commitments.
    Our commitment is to continue adapting to make sure we achieve the goals we’ve laid out. Some
    programs may perform better than expected, and others will need fine tuning. We will be evaluating
    CleanBC’s progress to our 2030 goals with interim and sectoral targets that set the path to success, and
    we will monitor improvements in emissions intensity and overall energy efficiency as important signals
    of success.
5 Building a cleaner, stronger BC 2019 Climate Change Accountability Report
Making cleaner options more affordable
The move to clean energy must be fair and affordable. Many of the initiatives outlined here focus on
expanding accessibility to cleaner, more efficient options like point of sale rebates for electric vehicles
and for home and business efficiency upgrades. We have also developed a low-cost financing option for
residential efficiency upgrades that will be rolled out in 2020.
We’re making cleaner options more affordable and accessible for all British Columbians:
¡ Helping with the upfront cost of buying a new electric vehicle through point-of-
sale rebates.
¡ To help families and businesses save money on their heating and renovation costs, we’re
providing a range of rebates to help with efficiency upgrades.
¡ We’re improving transit and road infrastructure to make active, cleaner transportation
easier and safer.
¡ We’re working with industry to reduce pollution and meet world-leading climate targets.
¡ And we’re investing in improvements to industrial operations that reduce emissions and
increase efficiency
From fossil fuels to clean electricity
With electrification, we can make huge improvements in reducing emissions and making our province
less polluting and more efficient. We are building on the legacy of our abundant supply of clean,
renewable hydro-electricity, by switching more and more activity—like driving, heating our homes, and
producing industrial goods—from fossil fuels to electricity.
Changing how we use energy
30%
20%
10%
change
0%
-10%
-20%
-30%
2015 2020 2025 2030
Clean energy use Fossil fuel energy use6 Building a cleaner, stronger BC 2019 Climate Change Accountability Report
Reducing emissions in a global context
The global context for addressing climate change is constantly evolving. B.C. is a small jurisdiction but is
making world-leading contributions, with CleanBC putting the province best in class in North America in
many key areas.
As our actions expand, we will continue to ensure competitive conditions for business and industry
across the province, including by encouraging cleaner operations through world-leading benchmarks,
and support for emissions reduction projects. When it comes to clean technology, our innovative people
and businesses consistently lead the way, providing goods and services to a global marketplace that is
searching for cleaner solutions.
While other jurisdictions rely on more polluting sources of power, B.C. is already a step ahead. But with
our clean energy advantage, remaining reductions beyond those already laid out in CleanBC will need to
be more targeted and more transformative, overcoming existing technology barriers.
B.C.’s Climate Action Compared to Other Jurisdictions
British Alberta California Ontario Québec
Columbia
Carbon pricing Carbon tax or cap and trade
system system ✔ ✔ ✔ ✔ ✔
Clean electrical grid Greater than from
renewable sources ✔ ✔
Requires increased sales of
ZEV standard zero-emission vehicles ✔ ✔ ✔
Low carbon fuel Requires a decrease in the
standard carbon intensity of fuels ✔ ✔
Requires all public sector
Public sector
leadership organizations to reduce,
report and offset emissions
✔
New opportunities with innovation and clean technology
With CleanBC we’re building a strong, sustainable economy. British Columbia has outpaced the Canadian
average for growth for a fifth consecutive year, with the fourth-largest provincial economy in the country.
Our economy is diverse, supported by a talented labour force that is in heavy demand.
Further reducing carbon pollution can build on these strengths, in particular in areas like high-tech and
clean-tech that have already distinguished B.C. as a world leader.
We’ve seen continued growth in these sectors. British Columbia’s clean technology sector has doubled
in revenue growth since 2015, outpacing the national average and generating $3.7 billion in revenue in
2017. Our clean technology sector will be instrumental to unlocking B.C.’s full potential as it transitions to
the low-carbon economy envisioned in the CleanBC plan. As we use more and more clean energy, we
will be building on the clean energy sector that contributed three per cent to B.C.’s GDP in 2017.7 Building a cleaner, stronger BC 2019 Climate Change Accountability Report
High-Tech Revenue Growth in B.C.
80%
70% Ontario & Québec
Prairies
60%
British Columbia
50% Canada
40%
30%
20%
10%
0%
2007 2008 2009 2010 2011 2012 2013 2014 2015 2016 2017
Economic opportunities in the province are attracting people from all over the world. In 2017, B.C.’s
environmental and clean-tech sector employed approximately 14,550 people, up from 7,160 in 2015,
while the clean energy sector employed 32,000 people. British Columbia’s talented workforce will be
well-positioned to take advantage of the good-paying jobs created in all sectors of the low-carbon
economy, including resource industries, research and development, the service economy, and in
emerging and growing sectors.
Working together
CleanBC calls on all of us, citizens, business and industry, labour, Indigenous communities, and local,
federal and provincial governments to be part of making this province stronger, now and into the future.
We will continue to work together, strengthening and building relationships with key partners, to protect
what we care about and move towards a cleaner future.8 Building a cleaner, stronger BC 2019 Climate Change Accountability Report
2 REACHING OUR TARGETS
British Columbia has set ambitious GHG reduction targets. Relative to emission
levels in 2007, we’re working towards reductions of 40 per cent by 2030, 60 per
cent by 2040, and 80 per cent by 2050.
The Climate Change Accountability Act was updated in 2019 to require the Province to annually:
¡ publish the most recent provincial GHG inventory
¡ estimate B.C.’s GHG emissions for that year
¡ estimate emissions for the following two years.
For this report, we’re quantifying emissions from 2017 and estimating emissions from 2018 to 2021. We’re
also providing a status update on progress towards our legislated targets. These new targets reflect the
fact that early progress to meet our commitments was slow, making the 2020 target out of reach.
Updating our emission forecasts
CleanBC laid out a pathway to reduce our emissions by 18.9 Mt of CO2e, which is 75 per cent of our 2030
target, leaving a gap of 6.1 Mt to be reduced by further actions. These projections were informed by
modelling1 analysis conducted in the fall of 2018.
Since then, we’ve updated our modelling as part of a regular series of improvements to ensure that core
assumptions remain aligned with real world developments. These include updating key data inputs
(such as forecasted fuel prices and economic growth levels) as well as some policy details (namely
aligning funding assumptions with those in Budget 2019). Updates to the model include:
¡ Improving representation of economic activity with the latest data from Statistics Canada
¡ Incorporating GHG emissions data from the 2017 Provincial Inventory
¡ Aligning with BC Hydro electricity consumption and cost of generation forecasts
¡ Incorporating B.C.’s updated official natural gas production forecast from the Ministry of Energy,
Mines and Petroleum Resources
¡ Improving the accuracy of natural gas emissions intensity values based on the most recent data
¡ Including a more detailed representation of the transport sector, due to changes in emissions data
provided by the federal government2.
The latest modelling results suggest that we are slightly closer to meeting our 2030 emissions reduction
target. We will continue to refine our model to include better data as it becomes available, which could
result in further changes.
1 The Province assesses progress towards meeting its 2030 GHG reduction target by modelling CleanBC policies to
estimate their impact on future emissions. B.C. uses the gTech model developed and administered by Navius Research
for this analysis. Information on the model’s structure and capabilities as well as the core assumptions and policy design
included in the CleanBC modelling analysis is documented in the methodology book available here.
2 Additional information on these updates is available in the methodology book.9 Building a cleaner, stronger BC 2019 Climate Change Accountability Report
DETAILS ON UPDATED MODELLING
The updated modelling results in a slightly smaller gap of 5.5 Mt, which means we are 79 per cent of the
way to meeting our 2030 target. The change is largely due to updates in the 2017 provincial GHG emissions
inventory. The inventory undergoes methodology and data improvements on an annual basis. Specifically,
2007 emissions (on which our targets are based) were revised upwards (from 63.6 Mt to 64.8 Mt).
On a sector-by-sector basis, the updated modelling shows results similar to the previous year. The main
difference occurs in the reference case in the industrial sector. Emissions in the natural gas sector are now
projected to be lower, meaning that fewer reductions from CleanBC policies are required to achieve a similar
2030 emissions level.
For more information on B.C.’s modelling results, see the methodology book.
Comparison of 2018 vs 2019 GHG modelling
2030 emissions totals under CleanBC and reference case3
2018 Modelling 2019 Modelling
70
64.5 63.2 60.7
Million tonnes of carbon dioxide
60
50 25.3
30.1 44.3 28.3 44.3
40
14.0 20.4 20.6
30
11.0 10.9
20 8.6 8.6
10 25.2 22.0 21.5
15.4 15.2
0
2017 2030 2030 CleanBC 2030 2030 CleanBC
Actual Emissions Reference case Reference case
Transportation Buildings & Communities Industry
Consistent with our commitments under the Climate Change Accountability Act, we used the updated
model to estimate GHG emissions over the next few years. Recognizing the inherent uncertainty in
predicting the future, our analysis estimates a range of potential values based on different model inputs
to understand how they could affect future emissions. These model inputs included oil and gas prices,
economic growth and technological costs, among others.
3 The reference case shows estimated 2030 emissions with no CleanBC action.10 Building a cleaner, stronger BC 2019 Climate Change Accountability Report
Gross GHG Emissions Forecast from 2018 to 2021
70.0
Million tonnes of carbon dioxide
64.5
65.0
61.9 63.7 62.5 to 65.5
62.0 to 65.0 61.5 to 64.5
60.0
59.0 to 62.0
55.0
50.0
2015 2016 2017 2018 2019 2020 2021
The forecast suggests that GHG emissions could increase over the next couple of years and then
begin a downward trend as CleanBC policies take effect. For 2018, we estimate that gross GHG
emissions are likely to range between 62.5 and 65.5 Mt, decreasing to between 59.0 and 62.0 Mt
by 2021.11 Building a cleaner, stronger BC 2019 Climate Change Accountability Report
3 MEASURING OUR PROGRESS
As part of CleanBC, the Province has renewed its commitment to honest,
accountable reporting on our progress on climate action. Because of the time
involved in data collection, it’s too soon to quantify the GHG impacts of CleanBC
policies and programs. But we have developed a robust framework for measuring
our progress and openly accounting to the people of British Columbia.
Many of the initiatives in CleanBC are new. Some may perform better than expected and others will
need fine tuning. We will evaluate progress towards our 2030 goals with interim and sectoral targets that
set the path to success. And we will report on a wide range of indicators, including emissions intensity
and energy efficiency, both of which are critical to decarbonizing our economy.
3.1 Transparency and accountability
To help keep CleanBC on track, the Province has developed a new accountability framework under the
Climate Change Accountability Act.
The framework requires:
¡ detailed annual reporting to the legislature on actions taken to reduce emissions and manage risks
from climate change
¡ an interim emissions target on the path to our 2030 goal
¡ emissions targets for different sectors.
Amendments to the Act also explicitly require that the Province establish an independent advisory
committee to keep government accountable. The new committee will carry on the oversight role of the
Climate Solutions and Clean Growth Advisory Council, which completed its mandate at the end of 2019.
The new advisory committee will have a similar role and make-up, representing a wide range of
interests and expertise, including representatives from Indigenous communities, local governments,
environmental organizations, academia, unions, rural and remote communities, and the business
community. The new committee must also be made up of at least 50 per cent women members.12 Building a cleaner, stronger BC 2019 Climate Change Accountability Report
FINAL REPORT OF THE 2017–2019 CLIMATE SOLUTIONS AND CLEAN GROWTH
ADVISORY COUNCIL
The Climate Solutions and Clean Growth Advisory Council was established in 2017 with a two-year
mandate to provide strategic advice to government on climate action and clean economic growth. It
included members from First Nations, environmental organizations, industry, youth, academia, labour and
local government.
In October 2019, the council delivered its final report to the Province, providing a list of recommendations on
CleanBC implementation. Generally, the council recommended that the Province:
¡ maintain the momentum on implementing Phase 1 policies, while working aggressively to plan for and
start implementation of Phase 2
¡ develop a clean energy strategy that clearly identifies how all of the commitments and policy actions
will be achieved
¡ prioritize coordination across government ministries, the federal government and other stakeholders, to
ensure CleanBC is implemented in a comprehensive manner
¡ continue to deepen its engagement with Indigenous and local governments to ensure CleanBC is
implemented as effectively as possible, and that Indigenous and local governments are fully involved
¡ develop an action plan based on its 2019 Climate Risk Assessment to address climate adaptation
¡ actively engage with various sectors of the economy, including the innovation and technology sector,
to understand impacts of CleanBC and seek feedback on additional solutions to achieve the remaining
reduction in emissions, and consider the advice in developing policy alternatives
¡ identify specific actions to support industrial competitiveness through the transition to a low-carbon
economy
¡ develop a comprehensive engagement strategy with youth and young adults to ensure their
perspectives and voices form part of all climate action plans and policies
¡ look for opportunities that bring together mitigation and preparedness in ways that are synergistic
¡ be a proactive voice, with the government of Canada, to ensure that any Internationally Transferred
Mitigation Outcomes (ITMOs) have a high degree of credibility and transparency. Irrespective of
future decisions regarding the use of ITMOs, the B.C. government should also continue to identify and
implement opportunities to close the gap to its 2030 targets
The Province is taking action across these areas, as evidenced throughout this first-year report. We look
forward to engaging with, and hearing recommendations from, the new advisory committee in 2020. The
final report can be viewed in its entirety in Appendix B.13 Building a cleaner, stronger BC 2019 Climate Change Accountability Report
3.2 Emissions performance—most recent data
2017 emissions total: 63.5 Mt of CO2e
Net Emissions change from 2007: -2.0 per cent
Provincial overview
B.C.’s annual GHG emissions are based on a national inventory from Environment and Climate Change
Canada (ECCC). Because it takes time for ECCC to collect and verify data from across a wide range of
sources, there’s a two-year lag in reporting out results. So our most recent data on B.C. emissions tell the
story of 2017 which saw an increase in gross emissions of 1.2% from 2016.
That year, our gross GHG emissions were 64.5 Mt of carbon dioxide equivalent (CO2e). When including
1.0 Mt CO2e in offsets from forest management projects, our net4 GHG emissions were 63.5 Mt CO2e.5
Because we do not allocate the offsets across different emissions sectors, just to the provincial total, we
will refer to gross GHG emissions for the remainder of this section.
Economic transition
Understanding overall emissions is important but we also need to consider emissions in the context of a
growing population and economy. As CleanBC policies are implemented and continue to transform our
province, we need to continue to de-couple emissions from growth.
Indicators in this area measure how well B.C. is doing as we make the transition to a cleaner economy
with fewer GHG emissions.
Between 2007 and 2017, the economy grew by 23 per cent while gross GHG emissions fell by 0.5 per
cent. That means that the GHG intensity of our economy decreased by 19 per cent since 2007.
GHG emissions per person have also fallen. Between 2007 and 2017, they decreased 13 per cent from 15
tonnes of CO2e to 13 tonnes.
4 Net emissions are gross GHG emissions (as reported in the BC Provincial Inventory) less the offsets from forest
management projects.
5 While land-use, land-use change and forestry emissions are reported on in a separate section of the Provincial Inventory,
these emissions are not included in B.C.’s GHG reduction targets or in the emission totals discussed in this section
because: (1) Environment and Climate Change Canada does not include these emissions in national totals; (2) emissions
from these categories are both large and volatile due to natural causes largely outside of human control (such as wildfire
and pests).14
Tonnes of COe per person Million dollars of GDP ( CDN)
13.0
12.0
14.0
15.0
16.0
17.0
18.0
199
0
100,000
120,000
140,000
160,000
180,000
200,000
220,000
240,000
280,000
.
199
1
.
1990
260,000
199
2 1991
,
199
3 1992
199
4 1993
199
5 1994
199
6 1995
199
7 1996
199 1997
8
199 1998
9
200 1999
0
200
200
1 0
200
200
2 1
200 2002
3 2003
200
4 200
200 4
5 200
200 5
6 200
200 6
7
.
2007
.
200
,
8 200
8
200
9 200
9
Carbon Intensity of the Economy
201
0 2010
201
Carbon Emissions and Population Growth
1 2011
201 2012
2
201 2013
3
201 2014
4
2015 2015
Building a cleaner, stronger BC 2019 Climate Change Accountability Report
201 2016
.
6
.
,
2017
201
7
350
250
450
300
500
200
400
3.5
5.5
4.5
3.0
5.0
4.0
Popoluation of British Columbia (millions) Tonnes of COe per million dollars of GDP15 Building a cleaner, stronger BC 2019 Climate Change Accountability Report
3.3 Sector-specific indicators—what else we’re
measuring
Along with GHG emissions, we’re tracking the progress of CleanBC with indicators for each key sector,
and for the economy overall6.
As we move forward with various initiatives, we will develop additional indicators to better reflect
the impacts of our work. These will focus on areas such as affordability, rural development, the clean
economy and clean jobs, reconciliation and gender equality.
Overall, results to date suggest positive trends toward reducing GHG emissions, underlining the
importance of CleanBC in meeting our 2030 targets.
3.3.1 Transportation
2017 emissions total: 25.2 Mt of CO2e (39 per cent of total)
Emissions change from 2007: +5 per cent
Transportation indicators measure changes in B.C.’s transportation sector including personal vehicles,
transit, and fuel.
Although emissions have increased since 2007, several indicators suggest the transportation sector is
now trending in the right direction. For example, sales of new light-duty electric vehicles grew from
fewer than 100 vehicles in 2011 to over 17,000 in 2019. In 2019, nearly nine per cent of all light-duty
vehicles sold in B.C. were electric vehicles. That means we’re close to hitting our goal of 10 per cent
by 2025 and on the right path to meeting our target of 30 per cent by 2030 and 100 per cent by 2040.
The increase in electric vehicles is consistent with an increase in the number of electric vehicle rebates
provided by the Province.
Another positive trend is the growing proportion of renewable content in transportation fuels. Low
carbon fuels are created by blending in fuels from renewable sources. In 2018, the renewable content
was 7.4 per cent in gasoline and 5.7 per cent in diesel, which is higher than the requirements in the
Renewable and Low Carbon Fuel Requirements Regulation.7
Since 2007, annual public transit ridership in B.C. has grown by 27 per cent which equates to each British
Columbian taking an average of 65 transit trips per year in 2018. TransLink has a goal of operating its
fleet with 100 per cent renewable energy by 2050 and B.C. Transit has committed to a fully electric fleet
by 2040.
6 Appendix A shows what we’re measuring year over year, along with the results we’ve seen since we started collecting the
data.
7 This data is valid at the time of calculation on December 9, 2019 and is based on the data provided by the fuel suppliers
in their annual compliance reports.16 Building a cleaner, stronger BC 2019 Climate Change Accountability Report
British Columbia Light-Duty Emission Vehicle Registration
Totals and Sales Percentage in B.C. (2011–2019)
ZEVs Registered ZEV Sales
40,000 10%
. 9%
35,000
8%
Vehicle Registration Totals
30,000
Percentage of ZEV Sales
7%
25,000 6%
20,000 5%
.
15,000 4%
3%
10,000 .
. . 2%
5,000 1%
. . .
0 0%
2011 2012 2013 2014 2015 2016 2017 2018 2019
Annual Public Transit Ridership
70
Average number of transit trips taken
65
per British Columbian
60
55
50
45
40
2007 2008 2009 2010 2011 2012 2013 2014 2015 2016 2017 201817 Building a cleaner, stronger BC 2019 Climate Change Accountability Report
3.3.2 Industry
2017 emissions total: 25.3 Mt of CO2e (39 per cent of total)
Emissions change from 2007: -1 per cent
Industry indicators measure the performance of B.C.’s industrial operations, tracking changes in the
sector over time and monitoring the implementation of CleanBC policies.
B.C.’s Greenhouse Gas Emission Reporting Regulation requires industrial facilities emitting over 10,000
tonnes of CO2e per year to report their emissions. Since 2012, total emissions from these industrial
operations have decreased by seven per cent to just over 18 Mt of CO2e in 2018, while the economy
grew by over 18 per cent during this period.8
Methane is a powerful GHG with a global warming potential 25 times that of carbon dioxide on a 100-
year timescale. Since 2014, reported fugitive and vented methane emissions in the upstream oil and gas
sector have decreased 17 per cent while overall natural gas production has been increasing, meaning
the industry has reduced the emissions intensity of B.C. natural gas.
GHG Emissions From Large Industrial Facilities In B.C.
21.0
.
20.5
Million tonnes of carbon dioxide
20.0 .
. .
19.5 .
19.0
.
18.5
.
18.0
17.5
17.0
2012 2013 2014 2015 2016 2017 2018
8 Note that the 18.4 Mt of CO2e represents emissions reported in 2018 by industrial facilities in B.C. emitting over 10,000
tonnes of CO2e per year that are required to report by The Greenhouse Gas Emission Reporting Regulation. The
estimated total industrial emissions of 25.3 Mt of CO2e is based on the Provincial Inventory and includes emitters above
and below 10,000 tonnes of CO2e per year and agricultural emissions, among other emission sources. Additional
information on the Provincial Inventory can be accessed at https://www2.gov.bc.ca/gov/content/environment/
climate-change/data/provincial-inventory and additional information on emissions from operations that report under
the Greenhouse Gas Industrial Reporting and Control Act can be accessed from https://www2.gov.bc.ca/gov/content/
environment/climate-change/data/industrial-facility-ghg18 Building a cleaner, stronger BC 2019 Climate Change Accountability Report
3.3.3 Buildings and communities
2017 emissions total: 14.0 Mt of CO2e (22 per cent of total)
Emissions change from 2007: -8 per cent
Building and communities indicators track emissions reductions progress in residential and commercial
buildings, as well as waste and the provincial public sector.
British Columbians have made significant progress reducing total energy use in residential and
commercial buildings. Since 2007, residential energy use has decreased by 14 per cent, even as the
amount of floor space increased by 18 per cent. Similarly, in commercial buildings, energy use has
decreased by 15 per cent while floor space increased by 10 per cent. Both results show that our buildings
have become more efficient through retrofits and cleaner new construction.
Heat pumps continue to gain in popularity. The percentage of households using them has increased
from three per cent in 2007 to nine per cent in 2018 and heat pump sales in recent years have been
increasing by double-digits. The number of heat pumps is likely to grow as we see results from
programs such as CleanBC Better Homes and Buildings, which provide incentives for people to adopt
cleaner technologies.
Our carbon neutral public sector has showcased B.C.’s leadership on climate change, reducing emissions
by eight per cent since 2010. To reach net-zero, the Province makes investments in B.C.-based carbon
offsets. A single offset represents one tonne of carbon dioxide equivalent removed from the atmosphere,
or one less tonne released.
Waste is another important climate issue. When disposed in the garbage and buried in a landfill, organic
wastes generate methane, a potent greenhouse gas. Since 2007, the amount of waste disposed in
landfills or incinerated in B.C. has decreased by 28 per cent, from 703 kg per person per year in 2007
to 506 kg per person per year in 2017. This has been driven by the increase in organics diversion, food
waste prevention, and extended producer responsibility programs in B.C. Currently, nearly 65 per cent
of the population lives in a region that has organic waste disposal restrictions in place to encourage the
prevention and diversion of organic waste and food scraps from landfills. Waste reduction efforts will
become increasingly important as B.C.’s population continues to grow and landfills approach capacity.
CleanBC policies to prevent and reduce organic waste and turn it into a valuable resource such as energy
and compost should further reduce emissions due to lower waste volumes being disposed of in landfills.19 Building a cleaner, stronger BC 2019 Climate Change Accountability Report
Heat Pump Systems and Sales
25%
of households with heat pumps as primary or secondary heating
increase in sales of heat pumps
20%
15%
10%
5%
0%
2007 2008 2009 2010 2011 2012 2013 2014 2015 2016 2017 2018
Municipal Solid Waste Disposal
750
700
Municipal Solid Waste Disposed
650
Per Capita Kilograms of
600
550
500
450
400
350
300
2007 2008 2009 2010 2011 2012 2013 2014 2015 2016 201720 Building a cleaner, stronger BC 2019 Climate Change Accountability Report
3.4 Carbon tax revenue and overall climate-related
spending
B.C.’s carbon tax rate currently sits at $40 per tonne and will increase annually by $5 per tonne of CO2e
emissions until we reach $50 per tonne in 2021. The following tables outline the incremental carbon
tax revenues resulting from the rate increases, which began in 2018. It also outlines the incremental
expenditures for carbon tax rebates and measures to reduce climate pollution.
Funding under CleanBC was outlined in Budget 2019, including allocations for cleaner transportation,
energy efficient buildings, Indigenous and remote communities, the CleanBC Program for Industry, and
other programming under development. Other operating spending outside of CleanBC includes the
First Nations Clean Energy Business Fund and the Forest Carbon Initiative. Capital spending includes the
expansion of Vancouver’s Broadway Subway and other major projects.
Table 1: Carbon Tax Revenue Forecast
ACTUAL Q2 FORECAST
$ MILLIONS 2018/19 2019/20
Carbon Tax Revenue 1,465 1,690
Annual growth 210 225
Growth due to base 1 12
Growth due to rate 209 213
Growth due to rate—cumulative 209 422
Table 2: Spending Related to Clean Initiatives
INCREMENTAL FROM 2017/18
$ MILLIONS ACTUAL 2018/19 BUDGET
2019/20
Climate action tax credit 40 72
CleanBC—operating and capital 39 226
Other operating spending 17 21
Transit projects and other capital 15 132
Total clean spending 111 45121 Building a cleaner, stronger BC 2019 Climate Change Accountability Report
4 WHAT WE’VE ACCOMPLISHED
In the year since CleanBC was released, we’ve made progress across a range of
areas, from transportation to industry to homes and buildings. The following
section summarizes what we’ve achieved and offers some examples of how
British Columbians are meeting the challenges of climate change.
4.1 Getting around
CleanBC laid out a path to reducing GHG emissions from transportation by bringing down the price
of electric vehicles and speeding up the switch to cleaner fuels. In CleanBC’s first year, we’re making
progress on both fronts, led by unprecedented sales of light-duty electric vehicles in 2019, with
more work to come on the medium-duty and heavy-duty front.
CleanBC is all about making life better for British Columbians. When it comes to how we get around,
that means continuing the shift away from old technologies to new, cleaner options, so we can all enjoy
cleaner air and healthier communities.
Since the release of CleanBC, we’ve been working with a range of partners to deliver electric vehicles,
cleaner fuels and active transportation solutions that make it easier to get where you’re going, with less
emissions and less time in gridlock.
4.1.1 More electric vehicles (EVs) on the way
In 2019, almost one in 10 vehicles purchased in B.C. were electric. That’s not surprising, considering
the benefits. Electric vehicles (EVs) are cleaner and cost less to operate—about 75 per cent less than
conventional vehicles. So making the switch makes sense.
CleanBC is helping with:
¡ rebates to make EVs more affordable
¡ legislation to make EVs more widely available, and
¡ support to grow the EV industry in British Columbia22 Building a cleaner, stronger BC 2019 Climate Change Accountability Report ELECTRIFYING RESULTS FROM ZERO-EMISSION FLEETS Electric vehicle fleets are turning out to be a real crowd-pleaser. Passengers enjoy the quiet ride, companies like the reduced maintenance costs, and drivers are proud to be behind the wheel. And there are now more affordable choices, due in part to CleanBC commercial vehicle rebates. With three electric buses and four electric harbour ferry boats, Vancouver’s Westcoast Sightseeing is leading the way for tourism. Rob Safrata, owner of Westcoast Sightseeing, sees electric buses becoming increasingly popular. “We’ve had our seasonal drivers return year after year because they like the experience of driving an electric bus and they are proud of it. We’ve also heard from our customers that they love a quiet bus as they take in the beautiful scenery of B.C.’s west coast,” said Safrata. “But what we all have in common is that we’re all working to reduce our emissions and that’s why we’ll keep doing what we’re doing.” Fleet operators in companies like WestCoast Sightseeing are not only helping to reduce carbon pollution in B.C. but are learning it can also help to improve their bottom line.
23                   Building a cleaner, stronger BC 2019 Climate Change Accountability Report

     Bringing down the price of EVs
     Historically, costs have been a major barrier to widespread adoption of EVs. As we get more and more
     EVs on the road, the price differential continues to shrink, and point-of-sale rebates are levelling the
     playing field.
     B.C. currently offers $3,000 in rebates on cleaner cars through the Go Electric program. In 2019, the
     federal government introduced its own rebate, allowing British Columbians to save up to $8,000 on a
     new EV with a price tag of up to $55,000.
     Together, the provincial and federal incentives produced an unprecedented surge in B.C. EV sales,
     prompting the Province to adjust its program to allow more people to participate.
     British Columbians responded. Sales of electric and plug-in hybrid vehicles in B.C. more than doubled in
     2019, compared to the same period a year before—making up almost nine per cent of new light-duty
     sales. They now account for almost two per cent of all light-duty vehicles on our roads, up from 1.5 per
     cent in 2017. With new electric pick-up trucks coming to the market in 2020, we expect further uptake as
     more people are able to find an EV that meets their needs. By 2030, the Province expects EVs to make up
     30 per cent of new vehicle sales.
     CleanBC is a key part of keeping this momentum going. Since its release we’ve seen:
         ¡ More than 17,000 new EVs on the road
         ¡ More than 40 new direct current (DC) fast charging sites, and
         ¡ New rebates for EV charging stations in homes and workplaces

          B.C. IS GOING ELECTRIC
         Go Electric is B.C.’s program to encourage and accelerate the adoption of electric vehicles by:
            ¡ Bringing down the price of EVs
            ¡ Making it easier to charge or fuel an EV
            ¡ Supporting research, jobs training and economic development in B.C.’s EV sector
         Budget 2019 committed over $90 million for the program. For details, go to https://goelectricbc.
         gov.bc.ca/

     Expanding our public charging network
     British Columbia’s public charging network is one of the most extensive in the country, and it’s expanded
     significantly since the launch of CleanBC. We now have 148 DC fast charging sites9—up from 105 a year
     ago. Fast charging is essential for long-distance driving and commercial fleets. Charging times vary, but
     many vehicles can get an 80 per cent charge in about an hour.
     The build-out of the public charging network will continue as we work towards our 2030 targets, making
     the switch to EVs more practical than ever.

     9    Number of charging sites is as of September 2019, with data provided by PlugShare
24 Building a cleaner, stronger BC 2019 Climate Change Accountability Report
Expanding home and workplace
charging MAKING IT EASIER TO CHARGE
OR FUEL
In 2019, the Province announced over $4 million
in new rebates for EV charging stations in homes Mount Robson Provincial Park is the first
and workplaces. The rebates are delivered in in B.C.’s northeast to offer EV charging
partnership with BC Hydro and FortisBC, helping stations. Robson River Campground
to get more B.C. buildings ready for EVs. recently added 22 electric sites. They
Homeowners installing a Level 2 charging station include an RV charging station and an
in a single-family home can get a rebate of $350. EV charging connection with 50-amp
service. The Province has also installed 18
Condominiums, apartments and workplaces
EV charging stations at provincial highway
can receive rebates of $2,000, along with up to
rest stops across B.C.
five hours of free support from an EV charging
station advisor.
For details go to: https://goelectricbc.gov.bc.ca/
Expanding the hydrogen network
B.C. is a world-leader in hydrogen fuel cell technology for transportation, with major automakers and
the fuel cell industry investing heavily in our research and development sectors. We currently have two
public hydrogen fuelling stations in the Vancouver area; we’re working with our partners to open four
more by the end of 2020. This work is part of a broader strategy to build on B.C.’s hydrogen advantage.
Switching to electric by 2040
As promised in CleanBC, the Province has passed a new law to make sure British Columbians have access
to the numbers and types of zero-emission vehicles they want. The Zero-Emission Vehicles Act was passed
in May 2019, requiring all new light-duty vehicles sold in B.C. to be zero-emission vehicles by 2040. Along
with making more EVs available at more affordable prices, the legislation will help ensure our GHG
reduction targets are met.
Automakers will be required to meet an escalating annual percentage of new light-duty EV
sales, reaching:
¡ 10 per cent in 2025
¡ 30 per cent in 2030, and
¡ 100 per cent by 2040
Regulations to implement the Act are now being developed. Consultation with stakeholders began in
October 2019.
Bringing in the standard over time will allow automakers to offer a greater diversity of models and
vehicle types to meet drivers’ needs—building on the progress made since 2011 when the Province
introduced its first clean-energy vehicle program. At that time, only a small number of electric vehicles
were available, hydrogen fuel cell vehicles weren’t available to the public, and there weren’t many places
to charge an electric car.25 Building a cleaner, stronger BC 2019 Climate Change Accountability Report
Today, B.C. drivers can choose from nearly 50 electric vehicles, with EV charging stations available
throughout the province and right across the country. We also have a growing number of hydrogen fuel
cell vehicles and fuelling stations.
The new legislation will accelerate these trends, helping to ensure that cleaner vehicles are as widely
available and competitively priced as possible. It will also support the growth of B.C.’s broader EV sector,
which employs about 3,850 people and contributes approximately $700 million a year in direct economic
activity to the province10.
Supporting innovation and business development
With EV sales taking off, B.C. companies are building on their strengths to support the growth of this
emerging industry. The Go Electric Advanced Research and Commercialization (ARC) Program is helping,
by supporting B.C. companies and encouraging new international investment. Funding is available for:
¡ Pre-commercial research and development of a B.C.-based EV product, service or technology
¡ Commercialization of a B.C.-based EV product, service or technology, including investments in
manufacturing facilities or processes, and
¡ Use or demonstration of a B.C.-based EV product, service, or technology
In 2019, three B.C. companies received approximately $500,000 through the ARC program to further
develop the EV sector, create good jobs and support low-carbon innovation:
¡ Eagle Graphite of Nelson received $290,000 to produce silicon/graphite battery anodes—bringing
new jobs to the Kootenays and potentially establishing B.C. as a global leader in anode production
¡ Burnaby’s AVL Fuel Cell Canada received $147,000 to develop an advanced fuel cell model for
research and series development applications in the automotive sector
¡ Richmond-based IRDI Systems received $55,000 to develop a hydrogen fuelling nozzle, using
made-in-B.C. clean tech to make fuel-cell vehicles more user-friendly. The nozzle will enable clean
commercial fuel-cell vehicles to fuel more quickly, making them more appealing and accessible to
fleets around the world
The ARC program will be putting out another call for projects in 2020. For details go to www.arcbc.ca.
10 Data from 2016 Clean Energy Vehicle Economic Opportunities Assessment.You can also read