Wind Power Opportunities in St. Thomas, USVI: A Site-Specific Evaluation and Analysis - NREL
←
→
Page content transcription
If your browser does not render page correctly, please read the page content below
Wind Power Opportunities in
St. Thomas, USVI: A Site-Specific
Evaluation and Analysis
E. Lantz, A. Warren, J.O. Roberts, and
V. Gevorgian

NREL is a national laboratory of the U.S. Department of Energy, Office of Energy
Efficiency & Renewable Energy, operated by the Alliance for Sustainable Energy, LLC.

Technical Report
NREL/TP-7A20-55415
September 2012

Contract No. DE-AC36-08GO28308
Wind Power Opportunities in
                                       St. Thomas, USVI: A Site-Specific
                                       Evaluation and Analysis
                                       E. Lantz, A. Warren, J.O. Roberts, and
                                       V. Gevorgian
                                       Prepared under Task No. IDVI.1020

                                       NREL is a national laboratory of the U.S. Department of Energy, Office of Energy
                                       Efficiency & Renewable Energy, operated by the Alliance for Sustainable Energy, LLC.

National Renewable Energy Laboratory   Technical Report
15013 Denver West Parkway              NREL/TP-7A20-55415
Golden, Colorado 80401                 September 2012
303-275-3000 • www.nrel.gov
                                       Contract No. DE-AC36-08GO28308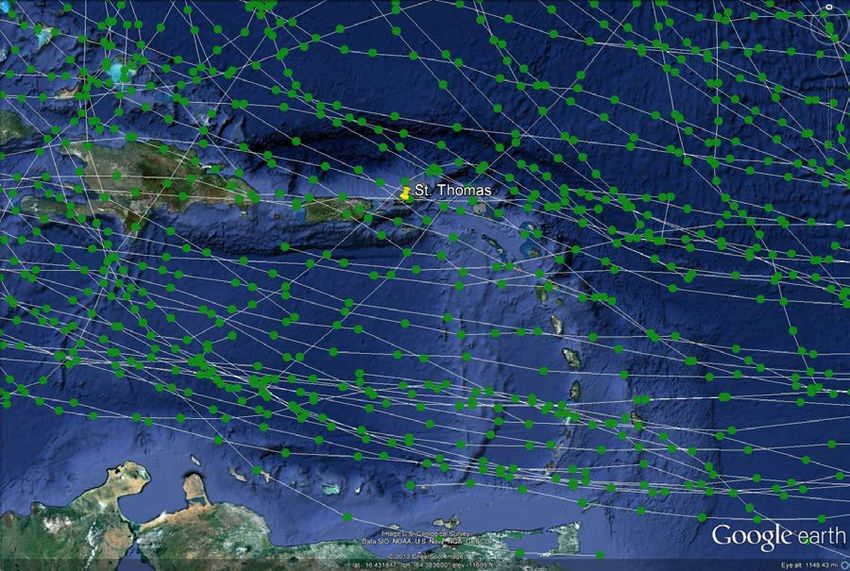
NOTICE

This report was prepared as an account of work sponsored by an agency of the United States government.
Neither the United States government nor any agency thereof, nor any of their employees, makes any warranty,
express or implied, or assumes any legal liability or responsibility for the accuracy, completeness, or usefulness of
any information, apparatus, product, or process disclosed, or represents that its use would not infringe privately
owned rights. Reference herein to any specific commercial product, process, or service by trade name,
trademark, manufacturer, or otherwise does not necessarily constitute or imply its endorsement, recommendation,
or favoring by the United States government or any agency thereof. The views and opinions of authors expressed
herein do not necessarily state or reflect those of the United States government or any agency thereof.

                         Available electronically at http://www.osti.gov/bridge

                         Available for a processing fee to U.S. Department of Energy
                         and its contractors, in paper, from:

                                 U.S. Department of Energy
                                 Office of Scientific and Technical Information
                                 P.O. Box 62
                                 Oak Ridge, TN 37831-0062
                                 phone: 865.576.8401
                                 fax: 865.576.5728
                                 email: mailto:reports@adonis.osti.gov

                         Available for sale to the public, in paper, from:

                                 U.S. Department of Commerce
                                 National Technical Information Service
                                 5285 Port Royal Road
                                 Springfield, VA 22161
                                 phone: 800.553.6847
                                 fax: 703.605.6900
                                 email: orders@ntis.fedworld.gov
                                 online ordering: http://www.ntis.gov/help/ordermethods.aspx

      Cover Photos: (left to right) PIX 16416, PIX 17423, PIX 16560, PIX 17613, PIX 17436, PIX 17721

      Printed on paper containing at least 50% wastepaper, including 10% post consumer waste.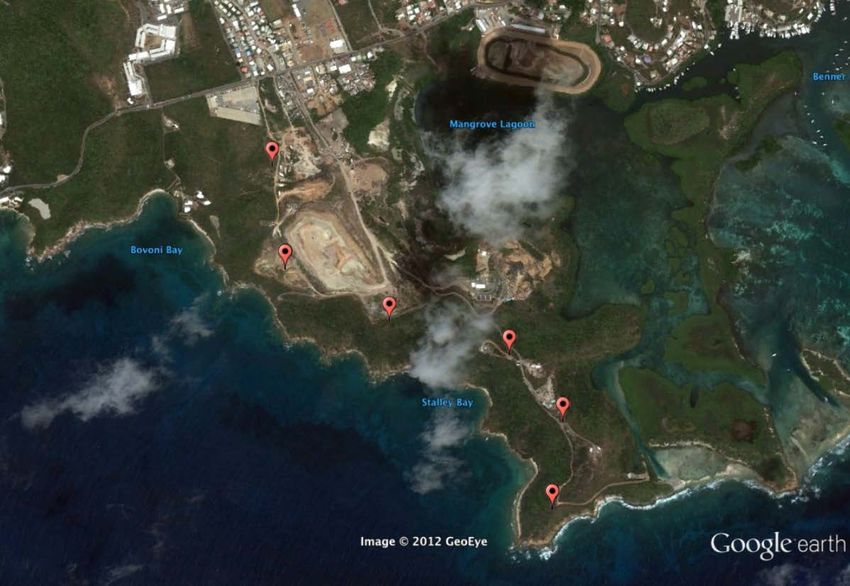
Acknowledgments
The authors would like to acknowledge the U.S. Department of Energy and specifically
Steve Lindenberg for funding of the Energy Development in Island Nations U.S. Virgin
Islands (EDIN-USVI) project and this report. We would also like to thank the Virgin
Islands Energy Office (VIEO), including Director Karl Knight, for input and assistance
during the development of this work and for reviewing a previous version of the
manuscript. In addition we would like to thank Ian Baring-Gould (NREL), Charles
Newcomb (NREL), Bob Springer (NREL), and Efrain O’Neill-Carrillo (University of
Puerto Rico-Mayaguez) for their review of previous versions of this report. Of course,
any remaining errors or omissions are the sole responsibility of the authors.

                                            iii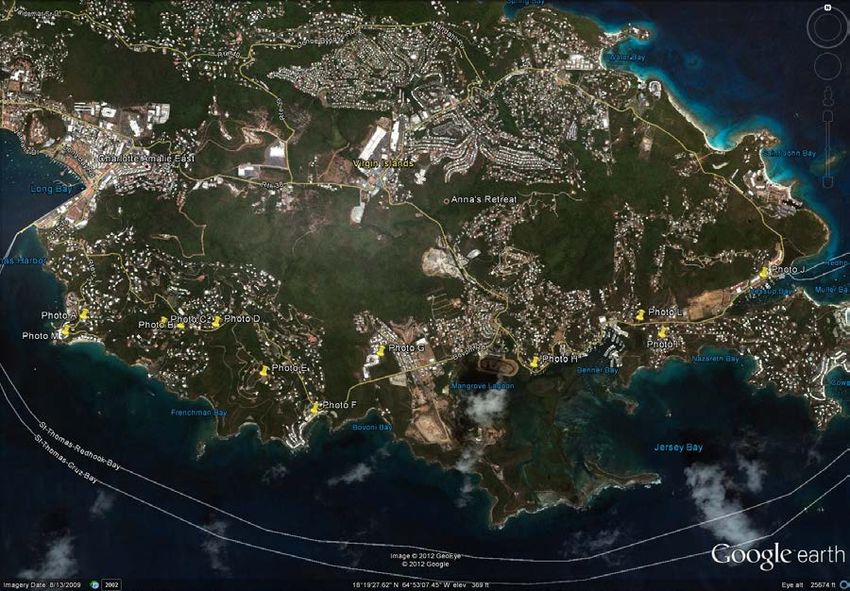
List of Acronyms
ARRA               American Recovery and Reinvestment Act of 2010
ATA                Aruba Tourism Authority
AWEA               American Wind Energy Association
BNEF               Bloomberg New Energy Finance
BVI                British Virgin Islands
CapEx              Capital Expenditures
CREST              Cost of Renewable Energy Spreadsheet Tool
DOE                U.S. Department of Energy
DOI                U.S. Department of Interior
DPNR               Department of Planning and Natural Resources
EDIN               Energy Development in Island Nations
EPA                Environmental Protection Agency
FAA                Federal Aviation Administration
FWS                Fish and Wildlife Service
GWEC               Global Wind Energy Council
HCEI               Hawaii Clean Energy Initiative
HECO               Hawaiian Electric Company
HFO                heavy fuel oil
HNEI               Hawaii Natural Energy Institute
IEC                International Electro-technical Commission
IPP                independent power producer
JPS                Jamaica Public Service Company
KEA                Kodiak Electric Association
KWH                kilowatt-hour
LBNL               Lawrence Berkeley National Laboratory
LCOE               levelized cost of energy
MW                 megawatt
MWH                megawatt-hour
NEPA               National Environmental Policy Act
NGO                nongovernmental organization
NMFS               National Marine Fisheries Service
NREL               National Renewable Energy Laboratory
NWCC               National Wind Coordinating Committee
O&M                operations and maintenance
OEM                original equipment manufacturer
PPA                power purchase agreement
PREPA              Puerto Rico Electric Power Authority
PTC                Production Tax Credit
PV                 photovoltaic
SCC                short circuit current
SODAR              sonic detection and ranging
SSMI               special sensor microwave/imager
UFLS               under-frequency load shedding
USVI               U.S. Virgin Islands

                        iv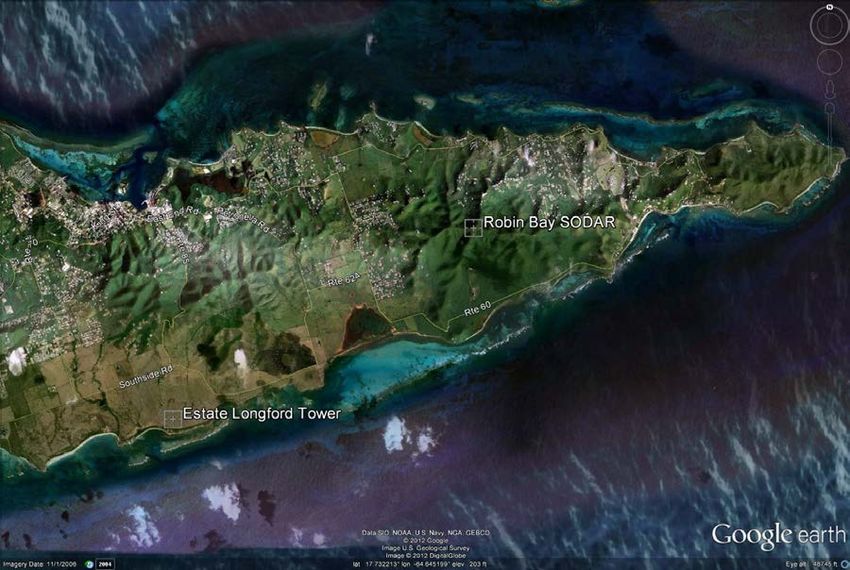
VIEO    Virgin Islands Energy Office
VIPA    Virgin Islands Port Authority
VIWMA   Virgin Islands Waste Management Authority
VMM     Virtual Meteorological Mast
WAPA    [Virgin Islands] Water and Power Authority

              v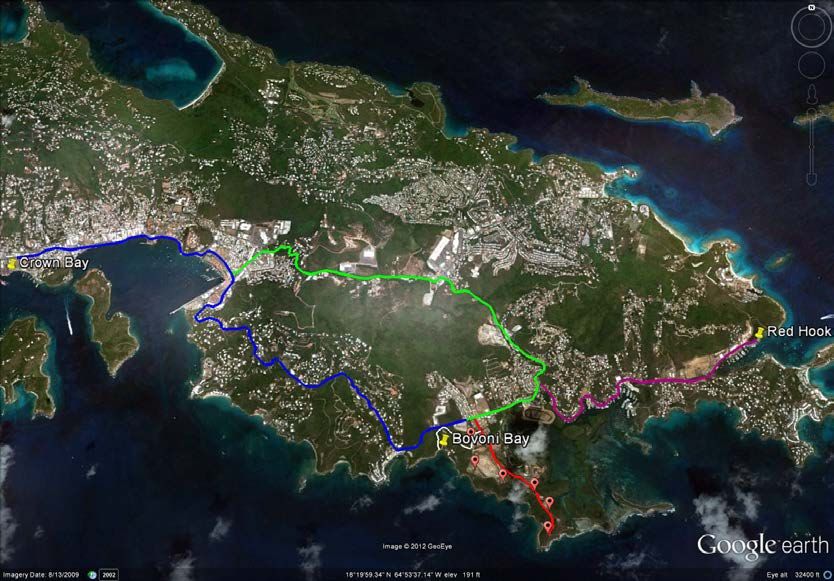
Executive Summary
The U.S. Virgin Islands (USVI) is heavily dependent on imported oil. Through work with
the Energy Development in Island Nations U.S. Virgin Islands (EDIN-USVI) team—a
consortium of the territorial government and the Virgin Islands Water and Power
Authority (WAPA), the U.S. Department of Energy (DOE), and the U.S. Department of
the Interior (DOI)—the USVI has developed a strategy for achieving its goal of reducing
fossil energy consumption 60% by 2025. In the electricity sector, deployment of new
renewable energy capacity is expected to be critical for the USVI to meet its targeted
fossil fuel reductions.

Among renewable energy technologies, utility-scale wind power represents one of the
lowest-cost sources of new electric generation. Moreover, wind power is increasingly
recognized as a valuable generation asset in island communities throughout the
Caribbean and in other parts of the world.

Despite relatively low costs and an increasing level of successful island wind
installations, developing a successful wind power project requires an array of
interdependent variables to be in place. This report utilizes a development framework
originated by NREL and known by the acronym SROPTTC™ to assist the territory in
identifying and understanding concrete opportunities for wind power development in the
territory. The report covers each of the seven components of the SROPTTC framework:
Site, Resource, Off-take, Permitting, Technology, Team, and Capital as they apply to
wind power in the USVI and specifically to a site in Bovoni, St. Thomas.

Site
A preliminary screening based on wind resource maps, local stakeholder input, and
existing land use suggested wind power projects could be viable on the islands of St.
Croix and St. Thomas. Among an array of possible sites, the favorable wind resource and
relatively high land-use compatibility of the Bovoni peninsula on the southeast coast of
St. Thomas indicated that it could be a viable first candidate for utility-scale wind power.
Sites on St. Thomas were also generally preferred due to its higher overall (and peak)
demand for electricity. Greater demand suggests that adding a variable generation
resource such as wind might be more manageable as a result of the larger system and the
inherently greater number of existing resources to draw on to balance variable generation.
Having developed a consensus among the EDIN-USVI team that the Bovoni site could
serve as a first site for wind development in the USVI, this report applied the SROPTTC
process directly to the Bovoni site. Sites on St. Croix may ultimately offer comparable
potential, but to narrow the scope of this analysis, these sites are not considered in detail.

Resource
By combining virtual meteorological mast data acquired from AWS Truepower, standard
industry losses, and four hypothetical turbine types that might be applicable for a site
with hurricane risk, net wind energy production at Bovoni is estimated to range from
7,000 megawatt-hours (MWh)/year to 29,000 MWh/year. The wide range of potential
energy generation represented by these estimates is a function of the total installed plant
size, which is in turn limited by the number turbines that can be placed on Bovoni point,

                                               vi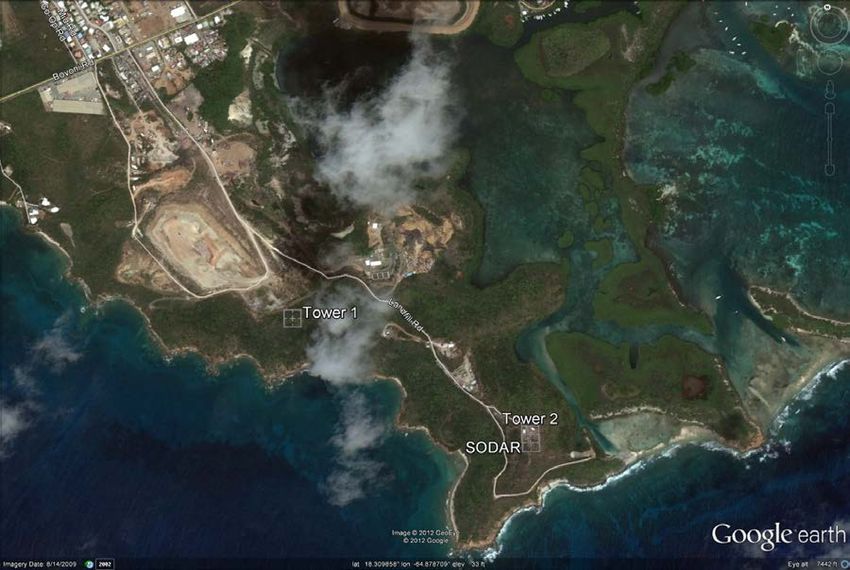
and varying levels of productivity associated with specific turbine designs. Typical
utility-scale turbines designed for sites with lower wind speeds generally offer the most
energy production, but alternative designs tailored to the risks of the Caribbean (e.g.,
difficult construction logistics and hurricanes) may be easier to finance and insure.

The levelized cost of wind energy (LCOE) at the St. Thomas site is estimated to be
between $0.07/kilowatt-hour (kWh) and $0.30/kWh. However, data from recently
installed projects in Aruba and Jamaica suggest that this range may be narrower—e.g.,
between $0.10/kWh and$0.20/kWh.

In spite of the broad range of potential costs, wind power appears to offer lower energy
costs than many competing alternatives in the USVI. Assuming current federal incentives
apply and the logistics, integration, and hurricane risks can be resolved for multi-
megawatt turbines at a capital cost that is in line with those observed for recent wind
installations in Jamaica and Aruba, costs will likely be comparable to or below the
current avoided cost of the local utility.

Off-take
The Virgin Islands Water and Power Authority (WAPA) is the sole utility operating in
the USVI. WAPA may, in principle, choose to own and operate utility-scale wind
generation in the USVI or provide the off-take for a third-party power producer.
Assuming WAPA follows a similar model as it has adopted for the generation of utility-
scale solar PV generation, the development of a utility-scale wind power project on
Bovoni point would be contingent upon an off-take agreement or power purchase
agreement (PPA) between the third-party independent power producer and WAPA.

At present, WAPA is mandated by USVI Act 7075 to acquire 30% of its peak generation
capacity from renewable resources by 2025 (VI Senate 2009). As WAPA is a regulated
public utility, a PPA with the utility would provide security for a project. However, even
with a PPA in place, curtailment risk remains due to the small system size of the St.
Thomas/St. John grid and the need to maintain grid voltage and frequency.

Permitting
For a typical wind power project, a number of federal permits must be obtained. At the
territorial level, additional regulatory measures must be adhered to. Potential fatal flaws
could include the presence of threatened or endangered species or significant cultural or
historical features, or a hazard determination by the FAA. Assuming no fatal flaws are
present, project success may be contingent on the local permitting process. To engage
local policymakers and the public in the process of wind power development, this report
includes basic visual impacts analysis. Figure ES-1 represents zones of visual impacts
assessment for a typical utility-scale turbine with an 80-m tower. This image is generated
from potential nacelle heights, as well as data on the terrain in and around St. Thomas.
Such an analysis, which is based on line of site for typical eye levels, can be used to
determine where the turbines are likely to be visible on the islands and, to a degree, how
significant a visual impact they are likely to have. (Red represents the highest visual
impact with 5 or more hubs visible, while green represents lesser impact; no visibility is
indicated by the absence overlay shading.) Notably these calculations do not take

                                             vii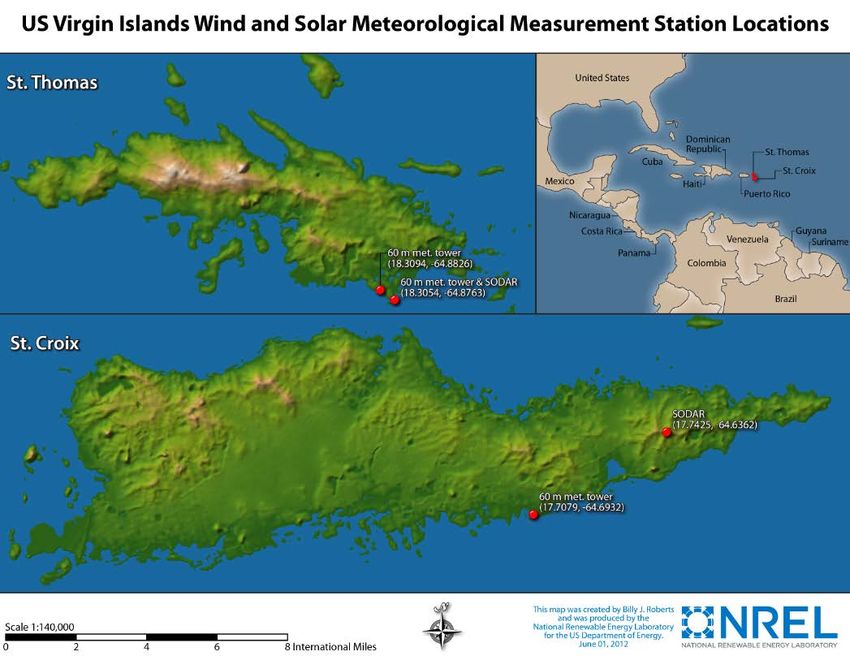
vegetation height or presence of buildings or other structures into account and as such,
the extent of visual impacts on St. Thomas is expected to be less than is shown in Figure
ES-1. Smaller turbines would have a less extensive visual impact in terms of the total
area from which they can be seen but might also result in a perceived increase in
landscape clutter for those areas that are in full view of the turbines, regardless of total
height.

    Figure ES-1. Likely areas on Bovoni peninsula where turbine hubs would be visible
                           assuming an 80-m (295-ft) hub height

        Note: Number of turbine hubs visible is denoted by the respective colors below:

         0              1              2              3              4               5

To supplement the zones of visual impacts analysis, photo visualizations were also
developed from a number of vantage points around St. Thomas. Figure ES-2 is one
example of the photo visualizations generated for this report.

                                               viii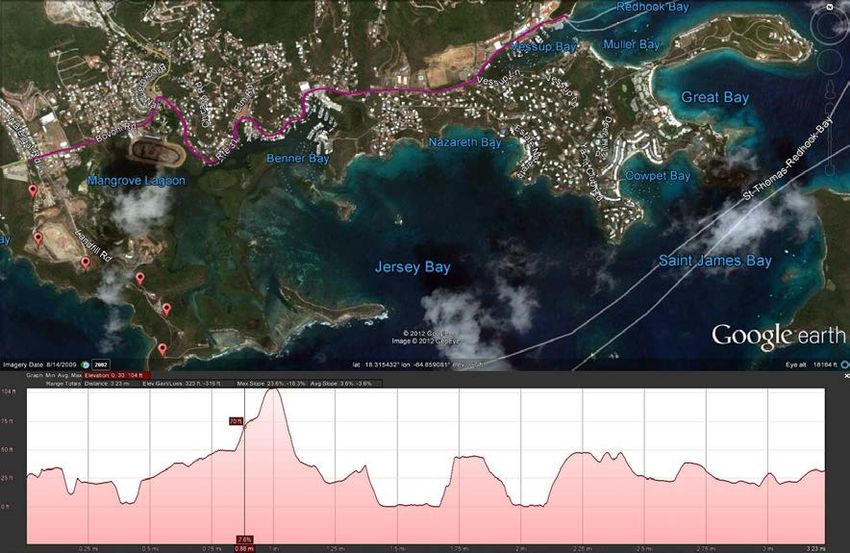
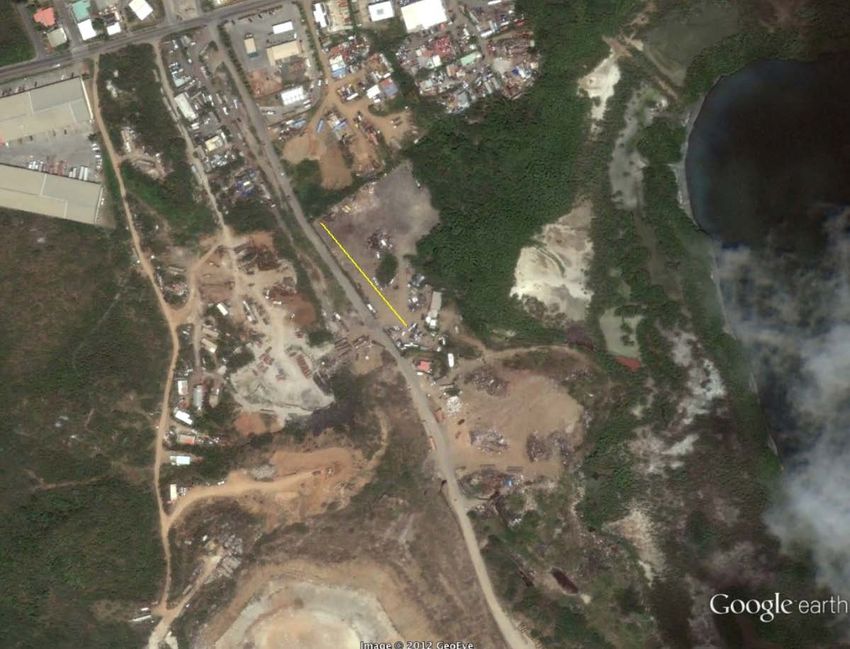
Figure ES-2. Photo visualization of a multi-megawatt turbine with an approximately 420-ft
tip height
Sound is potentially another key concern for residents living in close proximity to the
Bovoni peninsula. Turbines in the continental United States are often placed at a distance
of approximately 1,500 ft from nonparticipating neighboring dwellings to comply with
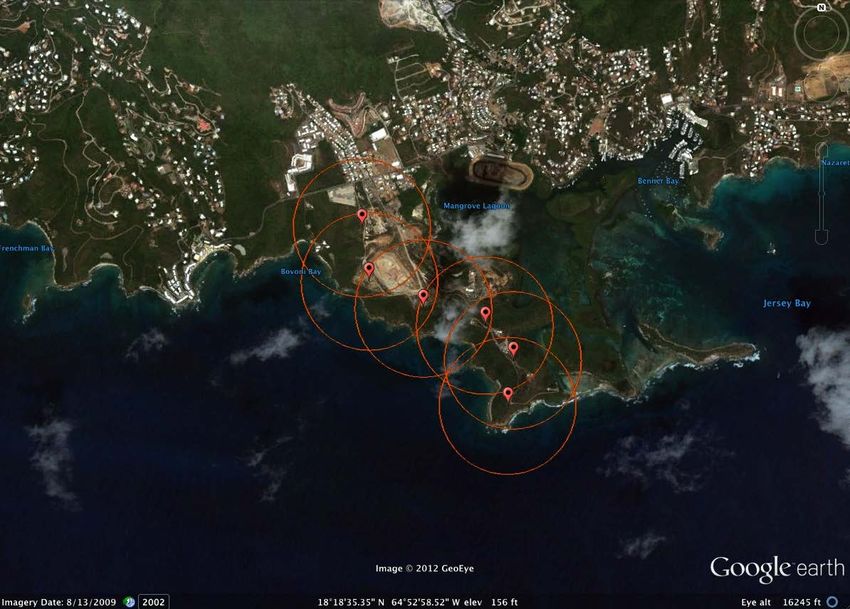
local sound ordinances. Figure ES-3 takes hypothetical locations of multi-megawatt
turbines with 100-m rotors and places a 1,500-ft buffer around each turbine to illustrate
setback distances comparable to those often employed in the continental United States.
With the possible exception of one or two turbines (assuming multi-megawatt turbines)
on the northern end of the peninsula, initial desktop review suggests that the expected
distances are well beyond those typically required to mitigate for potential sound issues.
ixFigure ES-3. Possible areas affected by wind turbine sound based on the potential sites
chosen for multi-megawatt turbines utilizing 100-m rotors and typical setbacks in the
continental United States.
Shadow flicker is also sometimes raised by project neighbors as an issue of concern;
however, it tends to be adequately addressed by requisite sound setbacks. Accordingly,
shadow flicker is not expected to be a major issue at the Bovoni site but detailed analysis
after a more formal turbine layout is established would offer a more definitive
determination. The significant distance from the individual turbines to local residences
observed above is also expected to reduce the impact of obstruction lighting on the local
population, but again detailed analysis pending a formal turbine layout could provide a
more definitive assessment.
Technology
Choosing the appropriate turbine technology for a site is always critical. In an island
environment, there are additional factors to be considered that limit the number and type
of turbine models that are applicable. In the context of the Caribbean, this includes
conditions resulting from hurricanes and tropical storms. On St. Thomas specifically,
additional critical variables include a more challenging logistics environment,
challenging topography, and limited land availability. With these factors in mind, a
limited number of utility-scale turbines employing anti-cyclonic technology and smaller
technologies designed for simplified assembly, installation, and routine raising and
lowering could be considered potential candidates. The increased probability of
hurricanes occurring in the USVI can be reasonably anticipated to have an incremental
xcost impact resulting from the need for more robust equipment and the increased risks
borne by insurers and financiers.
One must also consider the impacts of the technology on the grid system and its
operations. Some integration aspects are specific to a given turbine’s technology and
design characteristics. Modern variable-speed machines with full power conversion are
capable of providing a great deal more grid support and grid services relative to constant-
speed turbines with induction generators or even variable-speed machines with partial
power conversion. Even with the most advanced turbine power electronics, however,
high levels of variable renewable generation may also require significant changes in a
utility’s operational practices.
Team
Given the absence of significant experience developing and operating wind power plants
in the USVI, it is likely that the most efficient means of completing a project will involve
some level of external expertise from a company already engaged in wind power
development in the United States or elsewhere. However, local leadership is also
fundamentally important to project success, particularly in small isolated localities or in
areas where there is no existing wind development.
Many things can be done today to start assembling the team or group of individuals that
is likely to be needed to push forward a wind power project in the USVI. Collaboration
with DPNR and WAPA, engagement of local landowners and residents proximate to the
Bovoni site, and more detailed assessment of the feasibility of specific access points to
the Bovoni peninsula are all elements that could facilitate the process of developing and
constructing utility-scale wind on St. Thomas. Collecting and coordinating the key local
stakeholders is a process that cannot begin too soon.
Capital
Utility-scale wind projects in the continental United States are estimated to cost from
$1,500/kW to $2,400/kW. Island locales often expect significantly higher installed costs.
Applying costs in line with past experience in the Caribbean, the installed cost of a 5- to
13-MW project (the size range deemed feasible on the Bovoni peninsula with current
technology) is anticipated to be on the order of $12 million to $36 million. Incorporating
ownership models that are able to monetize the available tax credits and potential
renewable energy credits further complicates the capital component of the project
development process. WAPA may choose to pursue a utility-owned project or rely on an
independent power producer (IPP). The former would result in an additional new
generation asset for WAPA’s balance sheet and may allow for low-cost public financing
to be utilized. However, utility ownership would also entail greater operational risk for
WAPA and would likely preclude access to potential tax credit or other incentives
available to private companies.
xiSummary and Conclusions
The USVI has established an aggressive goal in its efforts to reduce fossil fuel
consumption. Achieving this goal will require new investments across various sectors,
including new sources of power generation. Assuming installations in the USVI can be
generally comparable to the recent utility-scale wind projects installed in Jamaica and
Aruba in terms of technology and installed cost, the LCOE of wind in Bovoni, St.
Thomas is estimated to range from roughly $0.10/kWh to $0.20/kWh.
The Bovoni peninsula appears to be a strong candidate for utility-scale wind generation
in the territory. It represents a reasonable compromise in terms of wind resource, distance
from residences, and developable terrain. Hurricane risk and variable terrain on the
peninsula and on potential equipment transport routes add technical and logistical
challenges but do not appear to represent insurmountable barriers. In addition, integration
of wind power into the St. Thomas power system will present certain operational
challenges, but based on experience in other islanded power systems, integration is
expected to be manageable.
Although technically feasible, developing a project will not be simple. Having the right
mix of local leadership and expertise will be critical to realizing a cost-effective wind
power project on Bovoni point. Nevertheless, completing such an initial project could
provide invaluable experience, learning, and technological familiarity for WAPA, local
residents, business owners, and tourists. These experiences could provide meaningful
insight into future wind and renewable power investments needed in the USVI to achieve
the 60%-by-2025 goal.
xiiTable of Contents
Acknowledgments ........................................................................................................................... iii
List of Acronyms .............................................................................................................................. iv
Executive Summary ......................................................................................................................... vi
Site ............................................................................................................................................... vi
Resource ...................................................................................................................................... vi
Off-take....................................................................................................................................... vii
Permitting ................................................................................................................................... vii
Technology ................................................................................................................................... x
Team ............................................................................................................................................ xi
Capital .......................................................................................................................................... xi
Summary and Conclusions ......................................................................................................... xii
Table of Contents .......................................................................................................................... xiii
List of Figures ................................................................................................................................. xiv
List of Tables .................................................................................................................................. xiv
1 Introduction ............................................................................................................................. 1
1.1 Why Wind? ...................................................................................................................... 2
1.2 Other Islanded Systems with Wind ................................................................................. 3
1.2.1 Hawaii ...................................................................................................................... 3
1.2.2 Kodiak Island ............................................................................................................ 5
1.2.3 Aruba ....................................................................................................................... 6
1.2.4 Jamaica .................................................................................................................... 7
1.3 The SROPTTC Model ........................................................................................................ 8
2 (S)ROPTTC—Siting Wind Power in the USVI .......................................................................... 11
2.1 Background on Bovoni................................................................................................... 14
3 S(R)OPTTC—Wind Resource in the USVI ............................................................................... 16
3.1 Wind Resource Characteristics ...................................................................................... 18
3.2 Estimated Power Production and Cost of Energy from a Potential Wind Facility on
Bovoni Point .............................................................................................................................. 23
4 SR(O)PTTC—Off-Take Opportunities and Considerations ..................................................... 28
5 SRO(P)TTC—Permitting Utility-Scale Wind in the USVI......................................................... 30
5.1 Overview of the Permitting Environment ..................................................................... 30
A Closer Look at Wildlife Impacts from Wind Power ................................................................ 31
5.2 Aesthetic and Public Acceptance Considerations ......................................................... 32
6 SROP(T)TC—Technology Options in the USVI ....................................................................... 38
6.1 Hurricane Considerations .............................................................................................. 39
6.2 Turbine Options for Hurricane-Prone Locales ............................................................... 41
6.3 Logistical Challenges and Considerations ...................................................................... 45
6.3.1 Site Access and Transport Considerations ............................................................ 46
6.3.2 Construction Logistics and Sequence .................................................................... 50
6.4 Grid Integration ............................................................................................................. 52
6.4.1 USVI-PR Interconnection Overview ....................................................................... 53
6.4.2 Renewable Energy Grid Integration ...................................................................... 55
6.4.3 Wind Turbine Grid Services Capabilities ............................................................... 56
7 SROPT(T)C— Assembling the Requisite Team ...................................................................... 58
8 SROPTT(C)—Capital, Financing, and Ownership Models ...................................................... 60
9 Summary and Conclusions .................................................................................................... 62
xiiiReferences ..................................................................................................................................... 64
Appendix A: Anemometry ............................................................................................................. 69
Appendix B: Cost of Energy Modeling Inputs and Supplementary Estimates ............................... 73
Appendix C: Supplementary Photo Visualizations ........................................................................ 75
List of Figures
Figure ES-1. Likely areas on Bovoni peninsula where turbine hubs would be visible assuming an
80-m (295-ft) hub height .................................................................................................. viii
Figure ES-2. Photo visualization of a multi-megawatt turbine with an approximately 420-ft tip
height.................................................................................................................................. ix
Figure ES-3. Possible areas affected by wind turbine sound based on the potential sites chosen
for multi-megawatt turbines utilizing 100-m rotors and typical setbacks in the
continental United States. ................................................................................................... x
Figure 1. Oahu’s Kahuku wind power plant .................................................................................... 4
Figure 2. Meteorological modeling of the wind resource in the USVI .......................................... 13
Figure 3. St. Thomas feeder map .................................................................................................. 15
Figure 4. Planned locations for meteorological towers and SODAR on Bovoni point and St.Croix
.......................................................................................................................................... 17
Figure 5. Predominant wind direction at Bovoni point, St. Thomas ............................................. 19
Figure 6. Frequency of wind speeds at Bovoni point on St. Thomas over the long term ............. 19
Figure 7. VMM monthly wind speed profile.................................................................................. 20
Figure 8. Empirical and satellite (SSMI) monthly wind speed profile ........................................... 21
Figure 9. Long-term modeled diurnal wind speed profile............................................................. 22
Figure 10. Empirical diurnal wind patterns in the USVI ................................................................ 22
Figure 11. Potential turbine locations on Bovoni point, assuming a turbine with an approximately
100-m rotor ...................................................................................................................... 24
Figure 12. Estimated cost of energy from a hypothetical wind project at Bovoni point, including
current U.S. federal incentives (e.g., Production Tax Credit and accelerated
depreciation). Note: Detailed input assumptions are summarized in Appendix B. ......... 26
Figure 13. Likely areas where turbine hubs would be visible assuming a 80-m (295-ft) hub height
.......................................................................................................................................... 34
Figure 14. Points from which photo visualizations were conducted ............................................ 35
Figure 15. Photo visualization of a multi-megawatt turbine with an approximately 420-ft tip
height (taken from point E in Figure 14) .......................................................................... 35
Figure 16. Possible areas affected by turbine sound based on the potential sites chosen for
multi-megawatt turbines utilizing 100-m rotors and typical setbacks in the continental
United States. ................................................................................................................... 36
Figure 17. Evolution in wind turbine technology over time .......................................................... 38
Figure 18. Trends in the levelized cost of wind energy over time ................................................ 39
Figure 19. Tropical storm and hurricane paths, 2000–2012 ......................................................... 40
Figure 20. Vergnet MP C turbine ................................................................................................... 43
Figure 21. Vergnet HP turbine ....................................................................................................... 44
Figure 22. Areas of variable slope designations on St. Thomas .................................................... 45
Figure 23. Possible equipment drop points and overland transport routes, including likely
problem turns ................................................................................................................... 47
Figure 24. Bathymetry in and around Bovoni point ...................................................................... 48
xivFigure 25. Modular causeway system used by the U.S. Army ...................................................... 48
Figure 26. Possible overland equipment transport route from Red Hook Bay ............................. 49
Figure 27. Possible crane assembly area ....................................................................................... 51
Figure 28. Existing site road profile ............................................................................................... 52
Figure 29. Conceptual illustration of the proposed interconnection to PREPA studied by Siemens
(2011) ............................................................................................................................... 54
Figure A1. Proposed wind resource data collection points on St. Thomas ................................... 70
Figure A2. Proposed wind resource data collection points on St. Croix ....................................... 70
Figure B1. Estimated cost of energy from a wind power facility on Bovoni point St. Thomas
across a range of installed costs with current federal incentives .................................... 74
Figure B2. Estimated cost of energy from a wind power facility on Bovoni point St. Thomas
across a range of installed costs without current federal incentives............................... 74
Figure C1. Zones of visual impacts for the Vergnet MP C 275 (60-m hub height) ........................ 75
Figure C2. Zones of visual impacts for the Vergnet HP 1.0-MW (70-m hub height) ..................... 76
Figure C3. Zones of visual impacts for the Vestas V100 (80-m hub height).................................. 76
Figure C4. Photo visualization vantage points .............................................................................. 77
Figure C5. Vestas V100 visualization from point A ........................................................................ 77
Figure C6. Vestas V100 visualization from point B. Note the yellow line denotes expected blade
tip height from this vantage point. .................................................................................. 78
Figure C7. Vestas V100 visualization from point C ........................................................................ 78
Figure C8. Vestas V100 visualization from point D........................................................................ 78
Figure C9. Vestas V100 visualization from point E ........................................................................ 79
Figure C10. Vestas V100 visualization from point F ...................................................................... 79
Figure C11. Vestas V100 visualization from point G ..................................................................... 80
Figure C12. Vestas V100 visualization from point H ..................................................................... 80
Figure C13. Vestas V100 visualization from point I ....................................................................... 81
Figure C14. Vestas V100 visualization from point J ....................................................................... 81
Figure C15. Vestas V100 visualization from point L ...................................................................... 82
Figure C16. Vestas V100 visualization from point M..................................................................... 82
Figure C17. Vergnet HP visualization from point E ....................................................................... 83
Figure C18. Vergnet HP visualization from point F........................................................................ 83
Figure C19. Vergnet HP visualization from point H ....................................................................... 84
Figure C20. Vergnet HP visualization from point I ........................................................................ 84
List of Tables
Table 1. Estimated Plant Size and Productivity for Wind Power Project Concepts on Bovoni
Point ................................................................................................................................. 25
Table 2. Estimated Bovoni Point Extreme Wind Speeds and Period of Return ............................ 40
Table 3. Renewable Energy Penetration Scenarios Considered in the Siemens Interconnection
Feasibility Study ................................................................................................................ 55
Table A1. Equipment Installation Sites, St. Thomas and St. Croix ................................................. 69
Table A2. 60-m Tower Instrumentation Descriptions ................................................................... 71
Table B1. Bovoni Point Cost of Energy Modeling Inputs ............................................................... 73
xvIntroduction
Island communities face significant energy challenges. Few conventional indigenous
energy resources (coal, natural gas, oil), relatively small power systems, and remote
locations often drive heavy dependence on imported petroleum for electricity generation
and transport (Weisser 2004). However, this dependence is not without justification. In
many respects, oil is an ideal fuel for small, remote, “islanded” power systems. It is
relatively accessible as a global commodity, and oil-based power generation technologies
offer relatively responsive generation, a key attribute in the smaller and more variable
power systems that are common to islands and in land-based power systems that are
isolated from the conventional power grid. Nevertheless, recent history has demonstrated
that oil-based energy systems on islands may be unsustainable. Oil price volatility, which
also directly affects electricity and transport fuel prices, creates a challenging economic
environment on islands around the world. Rapid increases in oil prices often result in
recessions and extreme debt burdens (Munasinghe & Mayer 1993).
As the impacts of price volatility have taken an increasing toll on island communities,
more and more islands have begun to take steps to reduce their dependence on imported
oil (see Section 1.2). The U.S. Virgin Islands (USVI), like many island nations and
territories, is heavily dependent on imported oil. As of May 2012, residential retail
electricity customers pay about $0.44/kWh for electricity. However, the USVI has also
emerged as a leader among islands seeking greater energy independence. The USVI has
committed to reducing its dependence on imported oil 60% by 2025 (DOE 2010).
Through its work with the Energy Development in Island Nations U.S. Virgin Islands
(EDIN-USVI) team—a consortium of the territorial government and public utility the
Virgin Islands Water and Power Authority (WAPA), the U.S. Department of Energy
(DOE), and the U.S. Department of the Interior (DOI)—the USVI has developed a
strategy for achieving the 60%-by-2025 goal, which is outlined in detail in the U.S.
Virgin Islands Energy Road Map: Analysis (Lantz, Olis, & Warren 2011). Per the road
map analysis, in the electricity sector, investments that boost the operational efficiency of
the existing power generation and transmission infrastructure, increases in end-user
efficiency, and deployment of new renewable energy capacity are all expected to be
critical for the USVI to meet its target.
Given the current cost of power in the USVI and the availability of good wind resources,
wind power will be a cost-effective power source in the territory. Among renewable
energy technologies, utility-scale wind power represents one of the lowest-cost sources of
new electric generation. When excluding incentives and subsidies, estimates for the
levelized cost of wind energy often range from roughly $0.05/kWh to $0.25/kWh
(Edenhofer et al. 2011; Lantz, Olis, & Warren 2011; BNEF 2012a). Considering the wind
resource in the USVI and the costs of other recent utility-scale projects in the Caribbean,
costs in the USVI are expected to be on the order of $0.20/kWh, although costs could in
fact be lower, depending on the availability of federal incentives, or higher should
logistics preclude the use of megawatt (MW)-scale wind turbines (for additional detail on
wind power costs in the USVI see Section 3.0 and Appendix B). Given its position as a
lower-cost renewable resource, wind power figures prominently into the future energy
plans for the USVI. An estimated 12–33 MW of wind power are theoretically installed
1across three possible scenarios outlined in the road map analysis, which examined
various paths for achieving the USVI 60%-by-2025 goal. 1 At present, however, there are
no utility-scale wind power facilities in the USVI.
This report represents a follow on to the initial U.S. Virgin Islands Energy Road Map and
is intended to assist the territory in identifying and understanding actual development
opportunities for wind power. After providing some initial background on wind power
generally and in other islanded systems, it identifies potential opportunities, assesses the
current status of utility-scale wind power development in the USVI, and highlights what
remains to be completed before a wind power plant can be built on St. Thomas.
The report also articulates a process that can be employed by the USVI and other island
communities to identify, screen, and analyze potential wind power sites. Such a process
can help island communities prepare for wind power development. The process outlines
the pieces that must be addressed to move a publicly owned project forward or
demonstrate a significant commitment to external developers who may be hesitant to
invest in island localities due to relatively high development costs and small project sizes,
both of which increase developer risk.
1.1 Why Wind?
Wind power became a commercial-scale industry more than 30 years ago. Over that time,
wind power has moved from the fringes of the electric power sector to a mainstream
resource responsible for 35% of new U.S. power capacity from 2007 through 2011—
second only to new natural gas power capacity (AWEA 2012). In the best resource areas
or localities with exceptionally high electricity costs, wind power can be cost effective
even in the absence of direct financial incentives or subsidies. Recent technological
improvements (Wiser et al. 2012) and falling turbine prices (Bolinger and Wiser 2011,
BNEF 2012b) are expected to maintain wind’s economically competitive position for the
foreseeable future (BNEF 2012a). Initial investment costs for wind power are relatively
high compared to natural gas or diesel generation (DOE 2008); however, with zero fuel
costs and relatively fixed modest annual operations expenditures, wind-generated
electricity is often a favorable generation resource over the long term. In addition, there
are no significant technical barriers to increased deployment of wind power (Edenhofer et
al. 2011).
As a result of its favorable economics, wind power has been the primary source of non-
hydro renewable electricity around the world (REN21 2011). Through 2011, global wind
power capacity was estimated at approximately 240 gigawatts (GW); annual investment
in 2011 was roughly $68 billion (GWEC 2012). Technical potential for wind power is
specific to local geography and meteorology, but many regions of the world, including
the Caribbean―which has an estimated 124 MW of installed wind power capacity—have
observed significant wind power growth (GWEC 2012). As an indicator of wind’s
widespread applicability, since 2010 more wind power has been installed in developing
1
The analysis outlined in the U.S. Virgin Islands Energy Road Map represented a joint effort completed by
DOE, DOI, and stakeholders in the USVI.
2countries and emerging economies than in the traditional markets of Europe and North
America (GWEC 2012).
In contrast to its onshore or land-based counterpart, offshore wind power remains in its
infancy. The vast majority of offshore wind installations to date are in northern Europe,
where at year-end 2011 there was a total of roughly 3,800 MW installed (EWEA 2012).
The only non-European countries with offshore wind power in operation at year-end
2011 were China and Japan, with a combined capacity of roughly 285 MW (GWEC
2012). Many countries, including the United Kingdom and China, have ambitious plans
for offshore wind power (GWEC 2012). There is also substantial development activity
for offshore wind in the continental United States, where through 2010 there were about
2,300 MW in relatively advanced stages of development (Wiser and Bolinger 2011).
Nevertheless, offshore wind power is relatively immature, and it remains substantially
higher in cost than its land-based counterpart. Estimated costs for typical projects in the
United States are in excess of $0.20/kWh excluding federal incentives, as compared to
typical costs of $0.07/kWh for onshore wind excluding federal incentives (Tegen et al.
2012).
There is potential for offshore wind research funding and installations in the USVI.
Research and demonstration projects by nature do not demand the returns of commercial
projects, and the USVI, with its relatively constant trade winds, underwater topology, and
access to industrial ports, may offer some unique attributes as a location for testing,
research, and development of emerging offshore wind technology. However, because of
the relatively high cost anticipated for offshore wind and the incremental additional cost
likely to be incurred from placing a small project with limited economies of scale in a
remote location such as the USVI, this report has not considered offshore wind as a
viable near-term commercial technology for the USVI.
1.2 Other Islanded Systems with Wind
Wind power’s position as a relatively low-cost, mature source of utility-scale renewable
power suggests it is likely to be a useful resource in the USVI. However, when wind is
introduced into the electric power system, an incremental amount of variability is also
added as a result of the variable nature of the wind resource. Across an array of studies
focused on relatively large power systems, capacity penetrations of 20%–40% have been
shown to be manageable with incremental integration costs on the order of $0.005/kWh–
$0.01/kWh (Wiser and Bolinger 2011). Integration costs are likely to be higher on a
small, islanded grid; nevertheless, successful wind power installations on remote or
isolated grids are indicative of the viability of the technology for such applications. Four
islanded power systems that rely on wind energy are highlighted here in order to illustrate
the potential for wind power in locales comparable to the USVI.
1.2.1 Hawaii
A substantial share of Hawaii’s total energy consumption–greater than 90%–is met with
imported oil. In 2008 it was estimated that the state imported about 43 million barrels of
fuel at a cost of approximately $8.4 billion (HNEI 2011). About one-third of oil imports
are procured for electric power generation; the majority of the balance serves the
transportation sector, including air and marine transport (HECO 2012).
3Despite its continued dependence on imported oil, Hawaii has taken a number of steps to
incrementally reduce oil consumption in the power sector. Today about 9% of the
electricity consumed by customers of the Hawaiian Electric Company (HECO) and its
subsidiaries (which excludes the island of Kauai) comes from renewables, with a little
more than 2.5% represented by wind (HECO 2012). Wind power has been a part of the
Hawaiian energy portfolio since the 1980s, and today there are several utility-scale wind
power plants operating on the islands of Maui, Oahu (e.g., Figure 1), and Hawaii (i.e., the
Big Island), with plans to continue wind development.
Figure 1. Oahu’s Kahuku wind power plant
Photo by Adam Warren, NREL
At year-end 2011, total installed wind power capacity in the Hawaiian Islands was
estimated at 92 MW (AWEA 2012). The 20-turbine, 30-MW Kaheawa wind farm has
been operating on Maui since 2006 (First Wind 2012); 2010 total wind generation in the
Maui Electric Company (a subsidiary of HECO) portfolio is about 10% (HECO 2012).
New wind power under development on Maui is expected to add an additional 51 MW of
installed capacity (First Wind 2012). The 12-turbine, 30-MW Kahuku wind farm has
been generating power on Oahu since 2011 (First Wind 2012). This particular project is
paired with 15 MW of battery energy storage, which is used to reduce the ramp rates
resulting from the variable wind resource and to provide power quality enhancements and
voltage support (First Wind 2012). Moreover, this plant’s position at the end of a long
radial line increases the benefits received from battery storage. In February 2012, ground
was broken on Oahu’s North Shore as construction commenced for Hawaii’s largest wind
farm. The Kawailoa wind farm will be 69 MW and is projected to meet 5%–10% of
4Oahu’s electricity demand (First Wind 2012). In 2006, the 10.5-MW Hawi wind farm
started operation on the island of Hawaii. The 20.5-MW Pakini Nui wind project, also on
the island of Hawaii, was dedicated in 2007. Wind power constitutes nearly 12% of total
electricity consumption on the island of Hawaii (HECO 2012).
To further reduce the state’s susceptibility to oil price spikes and potential supply
shortages, the Hawaii Clean Energy Initiative (HCEI) was established in 2008 as a
consortium of DOE, the state of Hawaii, and Hawaiian Electric Utilities (Hawaiian
Electric Company, Hawaiian Electric Light Company, Maui Electric Company, and
Kauai Island Electric Cooperative) (HNEI 2011). This initiative was developed to assist
in the implementation of the state’s goal to acquire 40% of its electricity from renewable
energy sources by 2030 (HNEI 2011). One element of the HCEI strategy is to develop an
additional 400 MW of wind power on the islands of Lanai and Molokai. Sometimes
referred to as the “Big Wind Project,” this new renewable electricity generation would be
interconnected to the island of Oahu and the load centers located there via undersea
transmission cable (HNEI 2011). To scope the feasibility of this plan, DOE
commissioned the Hawaii Natural Energy Institute (HNEI 2011) and others (e.g.,
Woodford 2011) to study technical integration issues associated with the proposal. The
results of this series of studies (e.g., HNEI 2011, Woodford 2011) indicated that
integrating 400 MW of wind power and 100 MW of solar photovoltaics (PV) into the
Oahu power system, which has a peak capacity of about 1 GW, is technically feasible and
would provide about 25% of Oahu’s total electricity consumption. An initial assessment
of the overall project economics of this 400-MW facility and associated undersea cabling
also suggests that the business case for this project is compelling enough to drive
continued investment in the project (Springer 2012).
Hawaii’s experience and ongoing study of large-scale penetration of wind power have
raised a number of challenges but also offered potential solutions. Integrating 400 MW of
new wind into the Oahu power system is feasible but will likely require the use of state-
of-the-art wind power forecasting in unit commitment scheduling and an increase in
HECO’s up-reserve requirement in order to better manage subhourly wind variability and
forecast uncertainties (HNEI 2011). Reducing thermal unit minimum loading and
reconsidering down-reserve requirements will also likely facilitate high-penetration wind,
as it is only HECO’s peaking units that are fast-start combustion generators. The ability
to leverage quick-response generation assets and controllable loads is also expected to
play a role (HNEI 2011).
Hawaii’s recent experiences and future plans indicate that high-penetration renewables
scenarios are feasible, even in remote island power systems. In cases like the Big Wind
Project, operational and equipment modifications may be necessary, but they are not
insurmountable obstacles to the deployment of wind power in Hawaii.
1.2.2 Kodiak Island
Kodiak is an isolated island community of roughly 15,000 residents off the south coast of
Alaska (U.S. Census 2012). The Kodiak Electric Association (KEA) operates the island’s
power system with a peak load of around 25 MW and a minimum load of about 11 MW
(Hieb 2011). KEA has a stated goal of meeting 95% of its generation needs from
5renewable hydropower and wind by 2020 (KEA 2012). Remarkably, KEA met nearly
90% of its electricity generation needs in 2011 with renewable energy (KEA 2012).
Kodiak’s primary power source comes from two hydroelectric generators at nearby
Terror Lake (Heib 2011). The combined hydro capacity is 11.25 MW (Heib 2011).
Nearly 80% of Kodiak’s electricity needs are met with these two hydro units (KEA
2012). The remaining electricity needs are met with wind and diesel generation. Diesel
generation is a combination of three reciprocating engines and a single diesel-fired
combined cycle unit (KEA 2012). In 2009, three 1.5-MW General Electric wind turbines
were installed on Pillar Mountain, constituting about 20% of peak demand. This facility
has reduced the yearly diesel electricity production from 20% to 11%; wind generation
now accounts for about 9% of annual generation (KEA 2012). The new wind power plant
is estimated to be saving about 900,000 gallons of diesel fuel annually (KEA 2012). As a
result of the success of the first three turbines installed on Kodiak Island, KEA is
planning to expand the existing wind plant from 4.5 MW to 9 MW (Xtreme Power 2012).
Adding a third hydro unit is also under consideration (Heib 2011).
To facilitate integration of wind on Kodiak, the Terror Lake hydro plant was given a
governor replacement, which improved response rates and frequency regulation
capability. However, frequency regulation has persisted as a concern and the current
system operates near its technical limits (Heib 2011). Expanding to wind capacity 9 MW
is expected to stress the existing system further and detailed study is under way to better
understand the system impacts of the planned expansion and to find technical solutions.
In April 2012, Xtreme Power announced that it would be installing a 3-MW battery
system to provide real and reactive power to the KEA system instantaneously to maintain
grid stability as the system moves from about 20% wind power as a share of peak
capacity where it is today to more than 35% wind power as a share of peak capacity as is
anticipated with the additional 4.5 MW of planned new capacity (Xtreme Power 2012).
1.2.3 Aruba
Aruba is a Dutch island territory in the South Caribbean with population of about
110,000 people (World Bank 2012a). Excluding cruise ship visits, just under 1 million
tourists travel to the island annually (ATA 2009). W.E.B. Aruba N.V. is the local utility
responsible for both power generation and freshwater production (W.E.B. Aruba 2012).
The island of Aruba does not have natural sources of freshwater, so desalinization of
seawater is the primary source of potable water on the island. N.V. Elmar is the local
electricity distributor and retailer (N.V. Elmar 2012).
The total conventional installed generating capacity in Aruba is 290 MW. This fleet
includes fuel oil powered steam units and fuel oil powered reciprocating power units, a
diesel-fueled gas turbine, and 30 MW of wind generation (W.E.B. Aruba 2012). Peak
load in Aruba is about 130 MW; minimum load is roughly 85 MW (Geerman and Croes
2010). The bulk of electrical generation is derived from steam turbines. The diesel
turbine is used primarily for emergencies and black starts, and sometimes as a peaking
plant (Geerman and Croes 2010). The primary fuel utilized by W.E.B. Aruba is No.6
heavy fuel oil (HFO) (W.E.B. Aruba 2012). Various projects are under way to reduce
Aruba’s dependence on imported oil—for example, by increasing existing generator and
6water production efficiency, expanding wind power assets, and potentially transitioning
its oil-fired generation to natural gas (Thiel and Boekhoudt 2010).
Interest in developing a wind power plant at Vader Piet in Aruba emerged in 2004
(W.E.B. Aruba 2012). In 2009 a 10-turbine, 30-MW wind power plant was completed at
an estimated cost of roughly $85 million, plus an additional $8 million in interconnection
costs (Theil and Boekhoudt 2010). The Vader Piet project uses Vestas V90 3-MW wind
turbines and is one of the largest wind facilities in the Caribbean region. It has been
estimated that the plant meets, on average, approximately 18% of daily load (Geerman
and Croes 2010). At minimum load, instantaneous penetrations of 30%–35% can be
observed (Geerman and Croes 2010).
The W.E.B. Aruba power system has demonstrated an ability to successfully integrate
wind power. However, it has suffered some reductions in the efficiency of its fossil units,
which has incrementally reduced the anticipated fuel savings from adding wind
generation to its portfolio. Nevertheless, the net fuel savings remains substantial, and
various operational strategies have been proposed to improve the efficiency of the
existing fossil generation fleet with wind on the system (Geerman and Croes 2010). The
estimated breakeven point for wind power in Aruba has been an estimated HFO cost of
about $55 per barrel (Theil and Boekhoudt 2010).
W.E.B. Aruba’s reciprocating engines have facilitated wind integration by providing
rapid-response up and down regulation and quick starts that assist in addressing wind
power variability on subhourly time scales. This stands in contrast to the utility’s steam
units, which have much slower (up to seven hours) cold start times (Geerman and Croes
2010). W.E.B. has also implemented a wind power forecasting system that produces wind
power production forecasts for up to seven days in advance. The forecast system does
involve some level of forecast error and uncertainties; however, it has proven to be a
useful tool for steam unit commitment and dispatch (Geerman and Croes 2010).
1.2.4 Jamaica
Another Caribbean nation utilizing wind power is Jamaica. Jamaica has a population of
about 2.7 million (World Bank 2012b), and, like many other islands, is heavily dependent
on imported oil. Jamaica’s power generation fleet consists of diesel oil based generation
capacity, several small hydropower plants, and wind power. Jamaica’s total installed
generation capacity is estimated at about 820 MW with a peak demand of roughly 650
MW (JPS 2009). Jamaica’s peak load has been projected to grow to 1.5 GW by 2028
(Nexant 2010).
Following a 225-kW installation at Munro College in 1996, utility-scale wind power was
introduced in the Jamaican energy mix in a significant way in the mid 2000s with the
commissioning of the Wigton I wind farm, a 20.7-MW facility (Chin Lenn 2011). The
Wigton I project, which utilized 23 900-kW NEG/Micon NM 52/900 turbines, was
placed in service in 2004 (Wigton Wind Farm 2012). In 2010, an expansion of the plant
added nine 2-MW Vestas V80 turbines, increasing the total capacity to 38.7 MW at a cost
of approximately $47.5 million. The annual capacity factor for the Wigton wind projects
is estimated at 30% (Wigton Wind Farm 2012). Another 3-MW wind farm in Jamaica is
7You can also read