Corospondent - Turning points - Coronation

Page created by Terry Grant
 
CONTINUE READING
Corospondent - Turning points - Coronation
corospondent
                    The Personal Investments Quarterly

                                              Turning
                                               points
SUMMER EDITION
JANUARY 2020
Corospondent - Turning points - Coronation
O U R C L I E N T C H A RT E R

                                          Our commitment to you
                                                       We have an                              We focus on
                   We strive to                                                                                                          We are
                                                       unwavering                             producing top
                  always put our                                                                                                     uncompromising
                                                    commitment to the                      performance over all
                    clients first                                                                                                      about ethics
                                                        long term                          meaningful periods

7th Floor, MontClare Place, Cnr Campground & Main Roads, Claremont 7708. PO Box 44684, Claremont 7735.
Client service: 0800 22 11 77 E-mail: clientservice@coronation.co.za www.coronation.com

All information and opinions provided are of a general nature and are not intended to address the circumstances of any particular individual or entity. As a result
thereof, there may be limitations as to the appropriateness of any information given. It is therefore recommended that the reader first obtain the appropriate legal,
tax, investment or other professional advice and formulate an appropriate investment strategy that would suit the risk profile of the reader prior to acting upon
information. Neither Coronation Fund Managers Limited, Coronation Management Company (RF) (Pty) Ltd nor any other subsidiary of Coronation Fund Managers
Limited (collectively “Coronation”) is acting, purporting to act and nor is it authorised to act in any way as an adviser. Coronation endeavours to provide accurate and
timely information but we make no representation or warranty, express or implied, with respect to the correctness, accuracy or completeness of the information and
opinions. Coronation does not undertake to update, modify or amend the information on a frequent basis or to advise any person if such information subsequently
becomes inaccurate. Any representation or opinion is provided for information purposes only. Unit trusts should be considered a medium- to long-term investment.
The value of units may go down as well as up, and is therefore not guaranteed. Past performance is not necessarily an indication of future performance. Unit trusts
are allowed to engage in scrip lending and borrowing. Performance is calculated by Coronation for a lump sum investment with income distributions reinvested.
All underlying price and distribution data is sourced from Morningstar. Performance figures are quoted after the deduction of all costs (including manager fees and
trading costs) incurred within the fund. Note that individual investor performance may differ as a result of the actual investment date, the date of reinvestment of
distributions and dividend withholding tax, where applicable. Annualised performance figures represent the geometric average return earned by the fund over the
given time period. Where foreign securities are included in a fund it may be exposed to macroeconomic, settlement, political, tax, reporting or illiquidity risk factors
that may be different to similar investments in the South African markets. Fluctuations or movements in exchange rates may cause the value of underlying investments
to go up or down. The Coronation Money Market fund is not a bank deposit account. The fund has a constant price, and the total return is made up of interest received
and any gain or loss made on any particular instrument, in most cases the return will merely have the effect of increasing or decreasing the daily yield, but in the case
of abnormal losses it can have the effect of reducing the capital value of the portfolio. Excessive withdrawals could place the fund under liquidity pressures, in such
circumstances a process of ring-fencing of redemption instructions and managed pay-outs over time may be followed. A fund of funds invests in collective investment
schemes that levy their own fees and charges, which could result in a higher fee structure for this fund. A feeder fund invests in a single fund of a collective investment
scheme, which levies its own charges and could result in a higher fee structure for the feeder fund. Coronation Management Company (RF) (Pty) Ltd is a Collective
Investment Schemes Manager approved by the Financial Sector Conduct Authority in terms of the Collective Investment Schemes Control Act. Unit trusts are traded
at ruling prices set on every day trading. Forward pricing is used. For Domestic Unit Trust Funds and Tax Free Investments, including rand-denominated International
Unit Trust Funds, fund valuations take place at approximately 15h00 each business day, except at month end when the valuation is performed at approximately 17h00
(JSE market close). For these Funds, instructions must reach the Management Company before 14h00 (12h00 for the Money Market Fund) to ensure same day value.
For International Unit Trust Funds that are denominated in a foreign currency, fund valuations take place at approximately 17h00 each business day (Irish Time) and
instructions must reach the Management Company before 12h00 (SA Time) to ensure the value of the next business day. For Retirement Products, fund valuations take
place at approximately 15h00 each business day, except at month end when valuation is performed at approximately 17h00 (JSE market close). For these Products,
instructions must reach the Management Company before 14h00 to ensure the value of the next business day. Additional information such as fund prices, brochures,
application forms and a schedule of fund fees and charges is available on our website, www.coronation.com. Coronation Fund Managers Limited is a Full member of
the Association for Savings & Investment SA (ASISA). Coronation Asset Management (Pty) Ltd (FSP 548), Coronation Investment Management International (Pty) Ltd
(FSP 45646) and Coronation Alternative Investment Managers (Pty) Ltd (FSP 49893) are authorised financial services providers.

On the cover: To herald the turning of the decade, we take a look at the world from a broad perspective as the impact of geopolitics is being felt in both global
economic policy and the markets. That said, while cognisant of these events and their impact on sectors and regions, we remain committed to our bottom-up,
valuation-driven investment approach.
Corospondent - Turning points - Coronation
Notes from my inbox
                       “Trust is undeniably linked to doing what is right. Ethical drivers such as
                       integrity, dependability and purpose drive the trust capital of business.”
                       – 2020 Edelman Trust Barometer

                       By P I E T E R K O E K E M O E R

  Pieter is Head of    MANY HAPPY RETURNS!                                 outcomes were enough to ensure that returns for
Personal Investments
                       2019 brought much-needed relief for our             the past decade created real wealth, our local
                       investors. Returns across most asset classes were   funds’ medium-term returns are still somewhat
                       ahead or in line with the expected outcomes         weaker than we would like them to be. We remain
                       and our funds benefited from strong outperfor-      confident that enough attractive opportunities
                       mance by our equity picks across local, emerging    are available today to expect good returns from
                       and developed markets. Coronation Top 20            our funds over the next decade. You can read
                       (+15.9%; 5.4% ahead of benchmark), Coronation       more about the performance and positioning of
                       Global Emerging Markets (+31.3%; 15.8% ahead        specific funds in the summary on page 29 or via
                       of benchmark), and Coronation Global Equity         the detailed fund commentaries available on our
                       Select (+33.9%; 10.4% ahead of benchmark) all       website.
                       had exceptional years. Our multi-asset funds
                       exceeded or matched their long-term real            TRUST DEFICIT
                       return objectives, with Coronation Balanced         Communications firm Edelman recently released
                       Plus, Coronation Capital Plus and Coronation        their trust barometer. They make the point
                       Balanced Defensive beating inflation by 8.7%,       that trust is granted on two distinct attributes:
                       5.1% and 5.4%, respectively. While these pleasing   competence (delivering on your promises) and

                                                                                                  TRUST IS EARNED™        3
Corospondent - Turning points - Coronation
ethical behaviour (doing the right thing and          inefficiency. President Cyril Ramaphosa acknowl-
working to improve society). Globally, their survey   edged in a recent letter to the nation that a
respondents perceived business as competent but       capable State starts with the people who work
not ethical, NGOs as ethical but not competent,       in it, who should be hired only based on skill, and
and the media and government as both unethical        should be held accountable for their actions. Time
and incompetent. The South African government         will tell whether there is enough commitment to
scored by far the lowest of the 28 survey countries   these fine words for trust in government to grow.
on both the competence and ethical metrics. This
trust deficit is the root cause of the sorry state    IN THIS EDITION
of our economy, as it undermines confidence,          Economist Marie Antelme reviews the very
reduces investment and thus limits the potential      challenging current fiscal conditions from the
growth rate.                                          perspective of a similarly tough period in the
                                                      early 1990s on page 8. Portfolio manager
Many structural issues that are perceived as          Neville Chester reviews the case for investing in
intractable have their roots in this. With evidence   local equities despite an unsupportive economic
of more ethics and integrity, issues that today       environment on page 6. Portfolio manager
look nearly unmanageable may come to be seen          Siphamandla Shozi unpacks the investment
as solvable for the greater good. Competent land      case for Distell on page 17. We have also asked
reform that supports labour-intensive small-scale     our Personal Investment team to share their top
farming may, under these conditions, be reframed      wealth creation tips for the next decade, which
as a necessary mechanism to deal with inequality      you can find on page 20.
and unemployment rather than a needless attack
on property rights; National Health Insurance         Thank you for your continued support. We know
may be understood as a rational public-private        that we would not be here without you. As always, I
partnership to roll out higher quality health care    invite you to let us know if there is any aspect of our
for more South Africans, rather than a cynical        service to you that did not live up to expectations.
attempt to gain control over private medical aid      You can mail us at clientservice@coronation.com.
premiums; and a larger tax and debt burden may        Good luck out there.
be seen to assist with restructuring electricity
supply and Eskom as a necessary contribution
to a just transition from fossil fuels to renewable
energy, rather than being forced to throw more
money down a bottomless pit of corruption and

                                           IN THIS ISSUE

            03                                    08                                     25
     Notes from my inbox                  Economic comment                        Demonetisation:
                                                                              India’s bolt from the blue
            05                                    13
      Key performance                        Bond outlook
                                                                                         29
          indicators                                                            Flagship fund update
    and fund performance
                                                  17
            06                            The investment case
                                                                                         34
                                                                                Flagship fund range
                                               for Distell
    The investment case for
    South African equities
                                                  20                                     38
                                                                               Long-term investment
                                          20 tips for the 2020s                    track record

4       COROSPONDENT
Corospondent - Turning points - Coronation
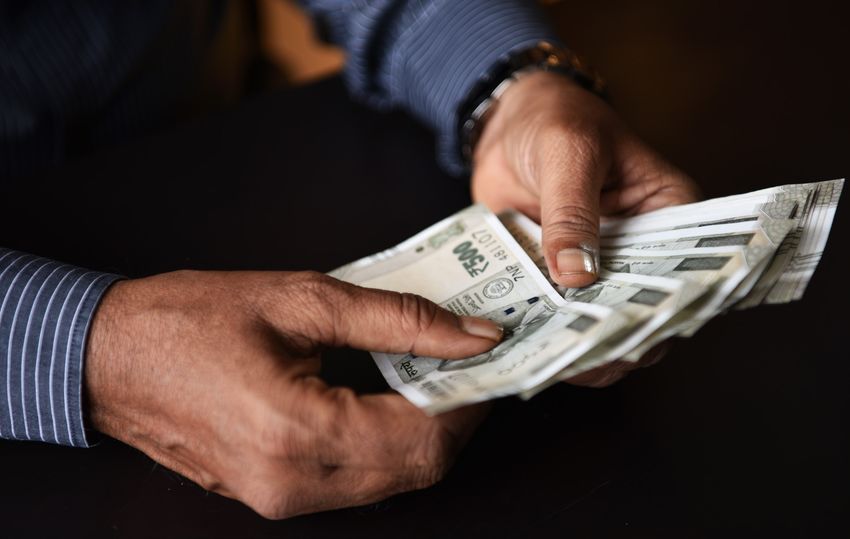
Key performance indicators and fund performance
AS AT 31 DECEMBER 2019
                                                                                  QTD           YTD       1 YEAR      3 YEARS       5 YEARS 10 YEARS 15 YEARS 20 YEARS
 DOMESTIC INDICES
CAPI (J303T)                                                                      4.9%        10.5%        10.5%          6.4%          5.7%        10.7%          14.0%         -
ALSI (J203T)                                                                      4.6%        12.0%        12.0%           7.4%         6.0%        10.8%          13.9%    13.4%
Top 40 (J200T)                                                                   4.5%         12.4%        12.4%          8.3%          6.1%        10.5%          13.6%    13.0%
SWIX (J403T)                                                                     4.8%          9.3%          9.3%         5.4%          4.8%         11.1%         13.8%         -
   ALSI Industrials (J257T)                                                      0.0%          8.9%          8.9%         3.2%          3.5%        13.8%          15.8%    13.7%
   ALSI Financials (J580T)                                                       2.8%          0.6%          0.6%         3.5%          3.9%        12.3%          12.3%    11.4%
   ALSI Resources (J258T)                                                       13.8%         28.5%        28.5%         20.5%          8.2%          3.3%         10.2%    11.7%
   All Property Index (J803T)                                                     1.2%        (0.4%)       (0.4%)        (5.0%)        (0.6%)         9.6%              -        -
BEASSA (TR) All Bond Index                                                        1.7%        10.3%        10.3%           9.4%         7.7%          8.9%          8.3%    10.5%
Short Term Fixed Interest 3 Month Cash Rate                                       1.6%         6.9%          6.9%          7.0%         6.8%          6.2%          7.1%         -
CPI                                                                              0.4%          4.1%          4.1%         4.4%          5.0%          5.1%          5.7%     5.9%
 INTERNATIONAL INDICES
MSCI ACWI (USD)                                                                   9.0%        26.6%        26.6%         12.4%          8.4%          8.8%          6.9%         -
MSCI WORLD (USD)                                                                  8.6%        27.7%         27.7%        12.6%          8.7%          9.5%          6.9%     4.5%
MSCI GEM (USD)                                                                  11.8%         18.4%        18.4%         11.6%          5.6%          3.7%          7.5%     6.7%
S&P 500 (USD)                                                                     9.1%        31.5%        31.5%         15.3%         11.7%        13.6%           9.0%     6.1%
BGBA (USD)                                                                        0.5%         6.8%          6.8%         4.3%          2.3%          2.5%          3.2%     4.5%
3 Month Libor (USD)                                                               0.5%         2.4%          2.4%         2.0%          1.4%          0.9%          1.8%     2.1%
MSCI ACWI (ZAR)                                                                  0.8%         23.5%        23.5%         13.3%         12.9%        16.0%          13.5%         -
MSCI WORLD (ZAR)                                                                 0.4%         24.5%        24.5%         13.4%         13.2%        16.7%          13.6%     8.9%
MSCI GEM (ZAR)                                                                   3.4%         15.5%        15.5%         12.4%          9.9%        10.5%          14.2%         -
3 Month Libor (ZAR)                                                             (7.0%)        (0.1%)        (0.1%)        2.8%          5.6%          7.5%          8.2%     6.4%
 SPOT RATES
Rand Dollar exchange rate                                                          15.1         14.4          14.4         13.7          11.5           7.4           5.6      6.1
   Rand Dollar % change                                                           8.1%         2.5%          2.5%        (0.7%)       (3.9%)        (6.2%)         (5.9%)   (4.0%)
Rand Euro exchange rate                                                           16.5          16.5          16.5         14.4          14.0          10.5           7.7      6.2
Rand Pound exchange rate                                                          18.6          18.3          18.3         16.7          18.0          11.9         10.9       9.9
Gold price (USD)                                                               1 485.3       1 281.7      1 281.7       1 159.1      1 199.3       1 087.5         435.6    290.3
Oil price (USD barrel)                                                            60.8          54.4         54.4          56.8          57.3          77.9         40.6      25.1

                                                                                                                                                                                       SINCE
                                                                                  QTD           YTD       1 YEAR      3 YEARS       5 YEAR S 10 YEARS 15 YEARS 20 YEARS              LAUNCH
 DOMESTIC FUNDS (PERFORMANCE IN RANDS)
Coronation Top 20 Fund                                                            7.6%        15.8%        15.8%          6.3%          5.1%        10.9%          15.1%         -      17.1%
   ASISA Mean of South African Equity General                                    4.4%          8.2%          8.2%         3.6%          3.4%          8.7%         11.8%         -      13.7%
Coronation Market Plus Fund**                                                     3.5%        13.3%        13.3%          5.2%          5.3%        10.8%          12.8%         -     15.0%
   ASISA Mean of South African Multi-Asset Flexible                              2.9%          8.3%          8.3%          4.1%         4.5%          9.4%         11.0%         -      11.2%
Coronation Balanced Plus Fund                                                     3.9%        12.8%        12.8%          6.0%          5.3%        10.3%          12.7%    13.0%       14.1%
   ASISA Mean of South African Multi-Asset High Equity                           2.5%          9.6%          9.6%         5.2%          5.0%          8.8%         11.0%    12.3%       12.1%
Coronation Capital Plus Fund                                                      1.2%         9.2%          9.2%         4.4%          4.4%          8.3%         10.1%         -      11.5%
   ASISA Mean of South African Multi-Asset Medium Equity                         2.0%          9.5%          9.5%         5.5%          5.1%          8.2%          9.3%         -     10.8%
Coronation Balanced Defensive Fund                                                1.3%         9.5%          9.5%         6.4%          6.2%          9.4%              -        -       9.3%
   ASISA Mean of South African Multi-Asset Low Equity                             1.5%         8.4%          8.4%         6.0%          5.9%          8.0%              -        -       7.7%
Coronation Strategic Income Fund                                                  1.3%         8.4%          8.4%         8.3%          8.2%          8.9%          9.0%         -     10.2%
   ASISA Mean of South African Multi-Asset Income                                 1.7%         8.2%          8.2%         8.0%          7.7%          7.2%          7.6%         -       9.0%
 INTERNATIONAL FUNDS (PERFORMANCE IN USD)
Coronation Global Opportunities Equity Fund                                     12.2%         27.2%        27.2%          11.1%         6.3%          8.0%              -        -       6.1%
Coronation Global Emerging Markets Fund                                         12.6%         38.2%        38.2%         12.1%          4.7%          4.8%              -        -       5.5%
Coronation Global Managed Fund                                                   8.3%         23.4%        23.4%           7.2%         4.5%               -            -        -       6.5%
Coronation Global Capital Plus Fund                                              4.2%         14.1%         14.1%         4.9%          3.5%          3.7%              -        -       4.3%
Coronation Global Strategic Income Fund                                           1.0%         4.7%          4.7%         2.2%          1.7%               -            -        -       2.6%

* All ASISA averages exclude Coronation funds in that category                                                                                                               Meaningful periods
** Highest annual return (Coronation Market Plus): 50.0% (Aug 2004 - Jul 2005); lowest annual return: -20.1% (Mar 2008 - Feb 2009); fund launch date 2 July 2001
Figures as at 31 December 2019; for detailed fund performance, refer to pages 34 and 36

                                                                                                                                                               TRUST IS EARNED™              5
Corospondent - Turning points - Coronation
INSIGHTS

     The investment
     case for
     South African
     equities
     Significant opportunities may underlie a bleak outlook

     By N E V I L L E C H E S T E R

                                           Fiscal consolidation                 Corruption, SOE failure                It is in conditions such
          THE                             and meaningful policy                and high debt levels have              as these that remarkable
         QUICK                        implementation is essential to            hamstrung the economy                opportunity can arise and
         TAKE                         restore investment confidence           and the aftermath is likely to         some SA stocks are worth
                                      and a meaningful growth path                 continue to do so                            watching

                                      THE OUTLOOK FOR domestic equity in the                  and an equivalent 8% dividend yield; and in
                                      period ahead is an exceptionally challenging            the large banks, where one can invest in a bank
                                      call to make, given the two vast extremes that          like Nedbank, which is trading at seven times
                                      will potentially drive market returns and how one       earnings and a 7% dividend yield.
                                      should be positioned.
                                                                                              The reason for the very low rating of South
       Neville manages                On most metrics, the FTSE/JSE All Share Index           African companies is obvious to all who live here.
         Coronation’s
      Aggressive Equity
                                      (ALSI) shows up as extremely cheap compared to          The economy is in a dire state and the political
       Strategy and has               its history. Like all averages, this hides a number     environment remains one where, despite all
    23 years of investment            of desperately cheap shares and some that are           the obvious challenges and problems, change
          experience.
                                      still looking fully valued.                             remains marginal at best and the status quo
                                                                                              prevails. Policies to truly step up growth are
                                      Companies that have been able to deliver con-           spoken about and alluded to, but we remain
                                      sistent earnings growth despite the challenging         stymied in a low-growth environment, made
                                      environment trade at eye-watering valuations.           much worse by the failure, both financially and
                                      At the high end of the spectrum, Clicks and             operationally, of Eskom.
                                      Capitec are estimated at forward price-to-
                                      earnings (P/E) ratios of 33 times and 22 times,         NOT ALL THOSE WHO WANDER ARE LOST
                                      respectively; whereas companies that have               Much like Robert Frost’s paths in the forest, we
                                      had a more challenging time are trading on              face two divergent roads ahead. Should we fail to
                                      multiples that we haven’t seen in well over             deal meaningfully with the economic challenges
                                      a decade. This is reflected in sectors such as          we face, the country is doomed to a low-growth
                                      the clothing retailers, where Truworths, for            future and all the attendant financial and social
                                      example, is trading at eight times earnings             risks that will come with it. In that case, these

6         COROSPONDENT
Corospondent - Turning points - Coronation
low single-digit P/E multiples will have proved          is not going to recur. To make matters worse, the
                   to be appropriate, pricing for an environment            debts incurred in the last decade need to be
                   where real earnings will continue to decline in          repaid, which means that a much tighter fiscal
                   perpetuity.                                              policy must be maintained. In plain English, this
                                                                            means that money will actually be taken out of
                   However, should we see signs of the country              the economy to service and settle the staggering
                   choosing to take the path ‘less travelled’, one with     debt run up by government and State-owned
                   short-term challenges, but ultimately leading to         enterprises.
                   a better state where fiscal consolidation occurs,
                   confidence returns and economic growth picks up,         The upshot of this is that businesses that seemed
                   there are unbelievable bargains to be had in the         to be able to grow their earnings regardless of
                   local equity market at the moment.                       the economic cycle in past times, may not be able
                                                                            to repeat that performance in the years ahead.
                   The challenge is being able to assess the                And therein lies the challenge: identifying
                   probability of which route South Africa is likely        investments that offer both upside potential and
                   to follow, how much is actually priced into              relative downside protection.
                   company valuations and which companies
                   can potentially grow under either scenario. As           A COLD COMING WE HAD OF IT
                   mentioned earlier, investors who are unimpressed         Why are we even bothering if the outlook is
                   by the trajectory of the South African economy,          so clouded and the risks are so high? Because
                   but want to maintain some local exposure, are            the opportunities for patient investors, should
                   prepared to pay incredibly high multiples for            we recover off the low levels to which we have
                   the perceived safety of shares that have shown           fallen, are significant. The last time South Africa
                   consistent earnings growth the past few years;           was in a similar situation was back in 2002/2003
                   and the consensus view is that they will continue.       when the outlook for the country was equally
                   They are priced for this growth, and then some,          pessimistic, and the world was still recovering
                   and should they disappoint, the gap between              from the shocks of the Dotcom bubble and the
                   expectation and reality will be enormous. A stock        9/11 terrorist attacks. The rand had weakened
                   re-rating from an expected 33 times earnings to          significantly, and domestic shares were trading
                   our assessment of a normal rating for an average         on ratings very similar to where they are today.
                   South African business would result in a 62%
                   decline in its share price.                              What followed was a period of very strong
                                                                            returns for domestic shares, as the situation
                   The brutal and all-encompassing nature of the            normalised and economic growth returned,
                   derating of the local market has meant that there        with the ALSI delivering a total return of 29.5%
             THE   are companies which we believe are above-average         per annum for the next four years. This is by no
  OPPORTUNITIES    quality businesses, trading today at ratings we          means guaranteed to be repeated, but given
     FOR PATIENT   think are overly pessimistic. These are companies        where valuations are currently trading, one has
      INVESTORS,   that should be able to defend their earnings base        to take a serious look at domestic companies as
     SHOULD WE     in real terms in a low-road scenario and, if we follow   potential investments for the next decade.
    RECOVER OFF    a better path, could deliver real earnings growth
 THE LOW LEVELS    that is not being priced for. These make excellent       A PROFESSIONAL GUIDE MAKES THE
   TO WHICH WE     investments where the pay-off profile is skewed to       JOURNEY
HAVE FALLEN, ARE   the upside.                                              Our key strength and the pillar that supports our
    SIGNIFICANT.
                                                                            investments at Coronation is our intense focus
                   UNCHARTERED TERRITORY                                    on proprietary research. This will, once again,
                   However, the future is unlikely to look much like the    be absolutely crucial in determining which
                   past decade in South Africa (refer to economist          companies will be the future winners and losers,
                   Marie Antelme’s article on page 8). Years of             not in the next 12 months, but over years. All in,
                   profligate spending by government and rampant            the above reinforces the oft-repeated view that
                   corruption meant that there was a lot of money           while investing is simple in theory, it is incredibly
                   sloshing around in the economy, a situation that         difficult in practice. +

                                                                                                     TRUST IS EARNED™           7
Corospondent - Turning points - Coronation
ECONOMIC COMMENT

    South Africa’s
    at risk of
    falling into
    a debt trap
    Let us not waste another crisis

    By M A R I E A N T E L M E

                                     A crisis is an             SA’s fiscus requires                                      The increased
         THE                                                                               The remedies that
                                  opportunity to turn             the most urgent                                    attractiveness of other
                                                                                          were available to SA
        QUICK                    poison into medicine,         attention; it’s almost
                                                                                          in the 1990s have all
                                                                                                                      emerging economies
        TAKE                     and it takes discipline         as if we’re back to                                    is not helping the
                                                                                              but dried up
                                      not alchemy                    square one                                              situation

                                 CRISES FORCE US to re-evaluate, to think differently,   reversed due to several interconnected and
                                 and to seek solutions that challenge the status         reinforcing causes, namely low nominal growth;
                                 quo. They are circumstances where all paradigms         failing confidence and investment; increasingly
                                 are up for debate and there is greater latitude to      complicated economic policies; institutional
                                 question leadership and existing norms.                 decay and State Capture; and, definitely not
                                                                                         least, the prevailing and intensifying crisis at
         Marie is an             In South Africa, we are not responding to the           Eskom. These events have combined to enforce
       economist with            current crisis. Not limited to Eskom, the economic      the reality that South Africa remains one of the
         19 years of
        experience in            and fiscal ramifications of weak growth have            world’s most unequal economies with respect
     financial markets.          become critical. GDP growth has averaged 0.8%           to both income and wealth. This is a gap that is
                                 over the past five years (2019 estimate) and is         exacerbated by diminishing resources with which
                                 unlikely to come in much above 0.3% in 2019.            to address this compound crisis.

                                 This compares to a post-democracy, pre-Global           This is not the first time we have been here. Some
                                 Financial Crisis average of 3.6%. Importantly for       of the metrics are different, some of the causes
                                 the current fiscal position, nominal GDP growth is      and consequences are too, but in 1993/1994,
                                 running at 4.7%, compared to 12% over the same          South Africa was struggling out of a three-year
                                 period.                                                 recession, exacerbated by a prolonged drought.

                                 FISCAL WOES TOP AGENDA                                  The fiscal position was under strain as a combina-
                                 The biggest economic casualty has been the              tion of weak growth and a sharp escalation in
                                 country’s fiscal position that had improved from        expenditure saw the deficit balloon to -6.3% of
                                 a very low base in 1993/1994, a condition not           GDP, from -1.2% three years earlier. Debt jumped
                                 very different to the one we’re in now, to one of       from 30.5% of GDP to 36.9%, heading up, and debt
                                 notable strength in early 2009. This has since          service costs climbed steadily to above 5% of GDP.

8        COROSPONDENT
Corospondent - Turning points - Coronation
Figure 1                                                                                                                reasonable forecast horizon. The official forecasts
REAL INTEREST COST VERSUS REAL GDP                                                                                      published in the October 2019 Medium-Term
      %
                                                                                                                        Budget Policy Statement (MTBPS) see gross
 6                                                                                                                      government debt rise from an estimated 60.8%
 5
                                                                                                                        in the current fiscal year to 71.3% in 2022/2023,
                                                                                                                        in the absence of any remedial interventions. This
 4
                                                                                                                        trajectory is unsustainable.
 3

 2                                                                                                                      The second is a ‘debt trap’ – this happens when real
  1
                                                                                                                        (nominal) interest payments exceed real (nominal)
                                                                                                                        GDP growth over a sustained period of time.
 0
                                                                                                                        This results in an ‘explosion’ in the government
 -1                                                                                                                     debt-to-GDP ratio, which can no longer be
 -2                                                                                                                     prevented because of limited remedial capacity.
 -3
                                                                                                                        Essentially this means that the State cannot
  1990             1995          2000             2005        2010            2015        2019/20e                      effectively raise revenue or cut expenditure in a
          Real GDP, %        Real interest cost                                                                         politically practicable manner, and this dynamic
Sources: SARB, Coronation
                                                                                                                        creates a self-perpetuating and compounding
                                                                                                                        increase in government debt.

Figure 2                                                                                                                The SARB paper compared the domestic data at
GENERAL GOVERNMENT MAIN BUDGET BALANCE                                                                                  the time to the IMF’s debt sustainability criteria,
      %                                                                                                                 which state that government debt will continue
 2                                                                                                  80                  to rise if the ratio of the primary balance to GDP
 1                                                                                                                      is smaller than the ratio of government debt to
                                                                                                    70
0
                                                                                                                        GDP, multiplied by the real cost of debt (interest
                                                                                                    60                  rate) minus real GDP growth rate. The rationale is
-1
                                                                                                    50                  that a government cannot indefinitely run deficits
-2
                                                                                                                        if the real rate of growth is below the real cost of
-3                                                                                                  40
                                                                                                                        financing its debt.
-4                                                                                                  30
-5
                                                                                                    20
                                                                                                                        The study found that while the government
-6                                                                                                                      was able to finance its deficit in a sustainable
-7
                                                                                                    10                  manner at the time, it raised serious concerns
-8                                                                                                  0                   about the risk of the economy falling into a debt
 1990             1995         2000          2005         2010           2015        2019/20e                           trap. Importantly, the risk of interest-cost growth
          General government consolidated deficit        Debt, % GDP (RHS)                                              relative to GDP (see Figure 1) could be a key driver
Sources: Coronation, National Treasury                                                                                  of debt accumulation. The fiscal assessment can
                                                                                                                        then be summarised as follows:

                                                                                                                        1. The large deficit, although partly reflecting
                                         In 1993, the South African Reserve Bank (SARB)                                    cyclical factors, was high relative to potential
                                         published a paper1 titled, “Is South Africa in a                                  GDP, making a recovery harder to realis-
                                         debt trap?” The parallels to today are sobering.                                  tically forecast. In the 1970s, when the deficit
                                         While the paper concluded that it was impossible                                  had ballooned before, potential growth was
                                         to assess categorically that the country was in                                   estimated at nearly 4%. In 1993, this was closer
                                         a debt trap, by most indicative measures, the                                     to 1% to 2% – slightly above the 1.1% that the
                                         economy was close to this critical position.                                      SARB currently estimates for 2020, implying an
                                                                                                                           increasingly unsustainable position.
                                         BACK TO THE FUTURE                                                             2. The increase in debt stock, albeit from relatively
                                         The details beg further analysis, and comparisons                                 manageable levels, implied a further rise in the
                                         to today’s position are worth highlighting – both                                 interest burden on tax revenue, which would
                                         the risk and the potential for remedy. To start, it                               persist should growth remain low.
                                         is important to describe two important concepts.                               3. Low domestic savings could raise borrowing
                                         First, ‘sustainable debt’ is debt that stabilises                                 costs, crowding out the private sector and
                                         or diminishes relative to output (GDP) over a                                     widening the current account deficit.
                                                                                                                        4. Concerns about public willingness to fund
                                                                                                                           increased borrowing, and at what cost, implied
                                         1
                                          E.J. van der Merwe, “Is South Africa in a debt trap?” South African Reserve
                                         Bank Occasional Paper No 6, May 1993                                              further upside risk to long-term interest rates.

                                                                                                                                                 TRUST IS EARNED™          9
Corospondent - Turning points - Coronation
5. Lastly, the report raised the possibility that,                                              Ongoing government dissaving has, and will
                                                                        as the debt burden increased, “authorities will                                              continue to, put pressure on the current account,
                                                                        be unable to prevent the financing of their                                                  making the fiscus and currency vulnerable to
                                                                        budgetary deficits by means of an increase in                                                a sudden stop in funding flows. Lastly, it could
                                                                        the money supply and monetary base of the                                                    be argued that the relative underperformance
                                                                        economy”. Under such circumstances, the SARB                                                 of South African fixed income to that of other
                                                                        warned, government debt will increasingly                                                    emerging markets in a very supportive global
                                                                        have to be monetised, destroying the ability of                                              environment already reflects the early onset of a
                                                                        the Central Bank to contain inflation.                                                       ‘loss of faith’ in government’s ability to implement
                                                                                                                                                                     sufficient remedial fiscal and policy action to
                                                                     POINT OF NO RETURN?                                                                             avoid a debt trap.
                                                                     There are clear parallels with South Africa’s
                                                                     position today. The recent deterioration in the                                                 With debt service costs already the fastest
                                                                     government deficit to an estimated 6% of GDP                                                    growing expenditure item over the medium-term
                                                                     (6.2%: 2019/2020 MTBPSe), ceteris paribus, is                                                   expenditure framework, with tax revenue as a
                                                                     well in excess of potential growth. The expected                                                percentage of GDP at already high levels and
                                                                     increase in debt stock and the concomitant                                                      stagnating growth, there are enough red flags to
                                                                     debt service burden suggest a return to interest                                                raise grave concerns about South Africa’s ability
                                                                     payments of close to 5% of GDP. There is some                                                   to avoid a debt trap.
                                                                     upside risk to this estimate should borrowing costs
                                                                     rise off the currently low (global) base.                                                       A LEAF FROM HISTORY
                                                                                                                                                                     In the early 1990s, and even more visibly from the
                                                                                                                                                                     early 2000s, a combination of nominal growth
Figure 3                                                                                                                                                             recovery and institutional reform enabled the
SOUTH AFRICA INTEREST PAYMENT, % GDP
                                                                                                                                                                     government not only to avoid a debt trap, but
                                                                                                                                                                     also to rehabilitate the fiscal position to one of
         %
                                                                                                                                                                     outright health. Despite the emerging market
  6
                                                                                                                                                                     crises between 1997 and 2000, South Africa
  5                                                                                                                                                                  managed to capitalise on a steady improvement
                                                                                                                                                                     in global growth, materially boosted by the
  4
                                                                                                                                                                     growth acceleration in China.
  3
                                                                                                                                                                     The domestic currency crisis in 2001 added
  2
                                                                                                                                                                     momentum to the recovery, because it left South
   1
                                                                                                                                                                     Africa with a severely undervalued currency. The
                                                                                                                                                                     boost to domestic terms of trade saw export prices
   0                                                                                                                                                                 rise meaningfully. This prompted a recovery in
        1990

                 1992

                        1994

                                1996

                                         1998

                                                       2000

                                                                 2002

                                                                         2004

                                                                                2006

                                                                                       2008

                                                                                              2010

                                                                                                      2012

                                                                                                                2014

                                                                                                                              2016

                                                                                                                                       2018

                                                                                                                                               2019/20e

                                                                                                                                                          2021/22f

                                                                                                                                                                     manufacturing production and an improvement
                                                                                                                                                                     in employment, and provided government with
Source: SARS                                                                                                                                                         much-needed revenue windfalls.

Figure 4                                                                                                                                                             During this time, South Africa also enjoyed several
WORLD REAL GDP, % YEAR ON YEAR                                                                                                                                       positive institutional changes, which not only
                                                                                                                                                                     facilitated an improvement in growth and thus
        %
                                                                                                                                                                     revenue collection, but also in confidence and in
 16
                                                                                                                                                                     policy implementation:
 14
 12
                                                                                                                                                                     • The Constitution was gazetted on 18 December
 10
                                                                                                                                                                       1996.
  8
                                                                                                                                                                     • The National Treasury presented the first
  6
                                                                                                                                                                       MTBPS in December 1997, preparing the way
  4
                                                                                                                                                                       for the first multi-year Budget determination
   2
                                                                                                                                                                       in February 1998.
  0
  -2
                                                                                                                                                                     • The SARB implemented inflation targeting,
                                                                                                                                                                       announced in September 1999 and starting
  -4
                                                                                                                                                                       in 2000.
       1991

                 1993

                         1995

                                  1997

                                                1999

                                                              2001

                                                                        2003

                                                                                2005

                                                                                       2007

                                                                                               2009

                                                                                                         2011

                                                                                                                       2013

                                                                                                                                     2015

                                                                                                                                              2017

                                                                                                                                                          2019

                                                                                                                                                                     • Mr Pravin Gordhan was appointed as
               World       Advanced economies                           Emerging markets              South Africa                    China               US           Commissioner of the South African Revenue
Source: IMF                                                                                                                                                            Service in 1999.

10               COROSPONDENT
Figure 5                                                                                       Early data for the fourth quarter of 2019 (Q4-19)
REAL EFFECTIVE EXCHANGE RATE VALUATION                                                         suggest tentative signs of stabilising domestic
                                                                                               output, with an annual rate of about 0.4% in
120
                                                                                               reach for the year as a whole.
110
                                                                                               However, the onset of loadshedding in early
100                                                                                            December, with the unprecedented escalation to
                                                                                               Schedule 6 and the persistence of a diminished
 90                                                                                            energy availability factor, will also compromise
                                                                                               this nascent recovery. A number of mining
 80                                                                                            companies closed early, and there is anecdotal
                                                                                               evidence that small and medium enterprises have
 70                                                                                            battled to sustain business activity as a result.

 60
                                                                                               More broadly, domestic sentiment was hit hard
  Mar 94     Mar 97     Mar 00     Mar 03    Mar 06     Mar 09      Mar 12   Jan 15   Mar 18
                                                                                               and confidence remains weak. The clear risk is
        REER        REER average            + 1 STDEV            - 1 STDEV
                                                                                               that considerably weaker Q4-19 growth will bleed
Sources: SARB, Coronation
                                                                                               into 2020 as power uncertainty persists, dragging
                                                                                               our 2020 outlook to 0.9% (1.1% previously) on the
                                                                                               back of the ongoing inadequate energy availa-
                                      In line with global inflation, spurred by the            bility factor.
                                      recovering exchange rate and facilitated by the
                                      new SARB mandate, domestic inflation (and                With real GDP growth of less than 1% and real
                                      borrowing costs) fell from 14% in 1993 to -0.7%          debt service costs heading for 5%, the interest
                                      in 2004. The now more disciplined fiscal process,        burden is set to reach almost 15% of total
                                      improved activity and the associated revenue             expenditure. Unless the gap narrows, interest
                                      benefits all helped to reduce the inherited fiscal       cost and debt will compound, and the rising debt
                                      deficit and debt stock.                                  burden will increasingly limit expenditure on all
                                                                                               other essential goods and services.
                                      The fiscal deficit narrowed from -6% of GDP in
                                      1994 via -7.0% in March 1997 to a small surplus          IS IT TERMINAL?
                                      of 0.3% in June 2002, with a full windfall from          The economy is in crisis. There really isn’t the luxury
                                      the weaker rand, high inflation and very high            of time. Until government creates policies that
                                      rand-based commodity prices. Some stimulus in            welcome innovation, innovation will not come.
                                      2003/2004 saw the deficit widen in the wake of           South Africa no longer has relative economic
                                      slower growth in 2002, notably lower revenue,            advantages to offset its challenges in attracting
                                      expanded social security and a big allocation to         new investment, driving employment and
                                      the contingency reserve out of the fiscus. With the      enhancing productivity.
                                      narrowing of the deficit thereafter, government
                                      gross debt fell from 48.8% of GDP in June 1997           There are lots of emerging market alternatives
                                      to a nadir of 26% in 2008/2009.                          that need skills and foreign savings, and which
                                                                                               create policies to facilitate their participation.
                                      OUT OF RESERVE                                           The progress of countries like India, China,
                                      Returning to the present day, the drivers of growth      Pakistan and Bangladesh in the World Bank Ease
                                      that saved South Africa from a debt trap in the          of Doing Business measures shows us this. South
                                      1990s have largely been drained. Their replen-           Africa’s performance, which has deteriorated by
                                      ishment would require an innovative shift in             52 places, from 32 in 2008 to 84 currently (where
                                      domestic economic policy, or a recovery in global        the lower the rank, the better the score), speaks
                                      growth and commodity prices, and preferably              for itself.
                                      both. It is possible that the currently elevated terms
                                      of trade and an uptick in global growth in the           A country that used to contemplate which policies
                                      second half of 2020 will provide a catalyst for an       could be used to best attract investment and
                                      acceleration in domestic growth momentum. But            was able to direct revenue to the most econo-
                                      the structure of the economy has also changed,           mically vulnerable, is struggling to grow. A fiercely
                                      and mining and manufacturing are consid-                 developmental economic agenda is at odds with
                                      erably smaller components of gross value added           economic innovation and growth. Redistribution
                                      – together now 19% from 29% in 1993/1994,                is not growth, but without growth, redistribution
                                      which limits the ability to fully capitalise on this     can only be limited. With growth, it could be
                                      improvement.                                             limitless.

                                                                                                                         TRUST IS EARNED™          11
POWER STATEMENT                                                  This powerful commitment flies in the face of
The near-term answer may lie in a bafflingly                     ongoing uncertainty and criticism that there is
overlooked commitment by the government in                       no ability or willingness to rethink private power
an opinion piece by President Cyril Ramaphosa                    generation in South Africa.
that was published in December last year.
‘A new era in energy generation’2 opens with the                 Stabilising energy availability; providing room
progressive statement that, “In the wake of the                  for scheduled maintenance; and sending a
hugely damaging power shortages of the last                      signal, not only that there is a plan to manage
two weeks, government has agreed – in keeping                    the Eskom crisis (at least to stabilise chaotic load
with the Integrated Resource Plan (IRP) 2019 – to                shedding), but also that government is willing to
allow users to generate power for their own use                  re-evaluate, to think differently, and seek solutions
and to accelerate the purchase of power from                     that challenge the status quo, despite inertia,
independent producers. In effect, the path has                   vested interests and factional resistance, would
been cleared for the expansion and diversification               be a grand step in the right direction to structural
of energy production on a significant scale”.                    reform of the economy.

2
 Daily Maverick Opinionista, “A new era in energy generation”,
Cyril Ramaphosa, 18 December 2019. www.dailymaverick.co.za/
                                                                 But words aren’t enough, we need to see these
opinionista/2019-12-18-a-new-era-in-energy-generation/           commitments come to life. +

12         COROSPONDENT
BOND OUTLOOK

 Valuing South
 African debt
 “The best time to plant a tree was 20 years ago.
 The second best time is now.” – Chinese proverb

 By N I S H A N M A H A R A J

                                                                Monetary and              The administration
       THE                      Local economic woes
                                                             fiscal policy, as well      must urgently make          Our analysis supports
                                 and policy inertia
      QUICK                     continue to weigh on
                                                               as global cost of         some hard decisions,         the inclusion of SA
      TAKE                                                    capital, drive local        such as cutting the         bonds in a portfolio
                                      SA bonds
                                                                     yields                public wage bill

                                THE LAST YEAR of the past decade, 2019, was            renewal more than South Africa’s. Despite the rally
                                the Chinese Year of the [Earth] Pig. Despite the       in global equity and bond markets, South African
                                images that might spring to mind, in Chinese           bond and equity markets underperformed their
                                astrology the pig represents wealth and treasure.      global peers. The local economy continued to slow
                                Considering the amount of turbulence that was          due to concerns about deteriorating government
                                injected into financial markets by geopolitical        finances and State-owned enterprises (SOEs),
Nishan is head of Fixed         game changers such as Brexit, the US-China trade       and specifically Eskom, as bouts of loadshedding
   Interest and has             war and the Hong Kong protests, the fortunes of        continued to intensify. The All Bond Index (ALBI)
17 years of investment
     experience.                the Earth Pig did shine on global equity markets       produced a total return of 10.3% in rands (13.1%
                                as they closed 2019 up more than 25% in US             in US dollars), which was driven by a rally in the
                                dollars (as measured by the MSCI World and All         three- to 12-year area of the curve, as expectations
                                Country World indices).                                of further interest rate cuts continued, given the
                                                                                       low growth and contained inflation environment.
                                Global bond markets were no exception, as most         The slow pace of policy change and implemen-
                                bond markets saw their yields compress over the        tation, and the requisite tough decisionmaking,
                                course of the year, driven by a slowdown in global     will continue to weigh on the country into 2020.
                                growth and a dovish twist by global central            That said, the flower that blooms in adversity is
                                banks. Emerging market bonds provided a total          the most rare and beautiful of all, so let’s hope
                                return of c. 14% in US dollars as the hunt for yield   South Africa can learn and heal from its damaged
                                intensified in a world where $11.2 trillion worth of   past, rather than run from it.
                                debt now trades at a negative yield.
                                                                                       FINDING THE SWEET SPOT
                                This year is the Chinese Year of the [Metal] Rat,      The only way a leopard can change its spots is
                                which symbolises renewal. For South Africans, this     by going from one spot to another. In 2020, the
                                is both auspicious and apt, as few economies need      spotlight will be on South Africa’s policymakers

                                                                                                                TRUST IS EARNED™        13
and their ability to change the course of the          (Eskom, SAA and Denel). Eskom has been and
                    local economy and show marked progress in              remains the biggest risk to the local economy.
                    the right direction. As long-term investors, our       Turnaround plans have been tabled and key
                    key objective is to make sure that we price risk       personnel have been replaced, but due to the
                    correctly and that our clients’ portfolios are         extent of a decade-plus of maladministration
                    robustly positioned. We do this by ensuring that       and corruption, operational turnaround has
                    they are well diversified, avoiding the risks that     been slow. It is inevitable that financial support
                    accompany positioning towards a single-market          will be ongoing, and government will need to cut
                    outcome.                                               expenditure in other areas to keep the nation’s
                                                                           ailing power supplier online.
                    This implies that a great deal of time is spent
                    on understanding the fundamental drivers of            The February 2020 Budget will be another
                    asset prices and whether the assets we hold on         watershed moment, as investors will again look
                    behalf of our clients are adequately priced with       to policymakers to make the hard, shorter-term
                    a sufficient margin of safety to buffer against        decisions, such as freezing or cutting the government
                    short-term adverse volatility. For South African       wage bill despite union objections. Most ratings
                    government bonds (SAGBs), this implies under-          agencies have given up hope on South Africa and
                    standing the fundamental direction of the local        moved us into subinvestment territory.
                    economy and ensuring that they are priced to
                    reflect prevailing and expected conditions.            Moody’s is the only agency that has retained
                                                                           South Africa at investment grade, which keeps
                    THE ECONOMY OF SOUTH AFRICAN YIELD                     us in the FTSE World Government Bond Index
                    There are three key drivers of SAGB yields:            (WGBI). However, given the deterioration seen
                                                                           over the last year, it is very likely that they will
                    1. Monetary policy expectations                        downgrade South Africa in 2020, which should
                    Monetary policy is driven by inflation and the         see outflows from the local bond market of
                    growth outlook. Inflation is expected to average       between R70 billion and R120 billion. This seems
                    close to 4.5% over the next two years, which is        like the end of the world, but we should not forget
                    at the midpoint of the inflation targeting band,       that:
                    while growth is not expected to reach 1.5% until
                    2021 (South Africa’s growth has averaged sub-1%        a) South Africa has a very deep and liquid bond
                    since 2015), while global growth is expected to           market.
                    average just above 3%. The Monetary Policy             b) The local savings industry is very large and
  THIS SEEMS LIKE   Committee (MPC) has reiterated that it wants              sophisticated.
  THE END OF THE    inflation to maintain the midpoint so that it          c) The fundamental deterioration and risks
 WORLD, BUT WE      can use monetary policy more effectively during           around it have been well flagged over the last
    SHOULD NOT      times of crisis.                                          two to three years, so investor positioning has
    FORGET THAT                                                               adjusted accordingly.
   SOUTH AFRICA     South Africa’s economy is struggling to grow, and      d) South Africa comprises less than 1% of the
 HAS A VERY DEEP
                    although monetary policy is a blunt tool, it can          WGBI, so at current valuations, investors might
AND LIQUID BOND
         MARKET.    be used to boost confidence and relieve some              choose not to exit.
                    consumer pressure. Currently, real policy rates are
                    above 2% and, if the repo rate does not move, the      While we are likely to see some fiscal effort in the
                    real policy rate will average 1.7% over the next two   budget and some tough stances regarding SOEs,
                    years. In previous cycles, when growth was this low,   keeping the policy trajectory headed in the right
                    the real policy rate averaged close to zero. This      direction, that doesn’t rule out an exit from the
                    suggests that there is room for the MPC to move        WGBI. In the worst case scenario, government
                    policy rates at least 50 basis points (bps) lower      doesn’t manage to paint a better scenario in
                    over the next year.                                    2020 and South Africa exits the WGBI, but that
                                                                           does not mean the end of the world for SAGBs,
                    2. Fiscal policy expectations                          given the current risk premium embedded in
                    In South Africa, fiscal policy has been on a           assets (refer to the point below).
                    slippery slope since the Global Financial Crisis,
                    as the administration has struggled to narrow          3. Global cost of capital
                    the fiscal deficit and government debt has             Global bonds are trading close to all-time lows
                    ballooned. The reasons for this are well known,        due to the slowdown in global growth, the flight
                    but in recent years the slowdown in growth has         to safe-haven assets because of geopolitical
                    decreased tax revenue, while expenditure has           uncertainty, and the dovish twist seen by global
                    continued to increase to rescue ailing SOEs            central banks in 2019.

14   COROSPONDENT
Figure                                                                                                                                                                 The backdrop for SAGBs is therefore mixed.
SOUTH AFRICAN 10-YEAR VERSUS US 10-YEAR SPREAD                                                                                                                         Monetary policy should be supportive, fiscal policy
        %                                                                                                                                                              will remain in the spotlight and the global cost of
8.5                                                                                                                                                                    capital, although it should remain supportive in
8.0                                                                                                                                                                    the short term, might be unfriendly over the longer
 7.5
                                                                                                                                                                       term.
7.0
                                                                                                                                                                       However, from a valuation perspective, these
6.5
                                                                                                                                                                       risks seem to be adequately priced. First, SAGBs’
6.0                                                                                                                                                                    spread over the US 10-year (global risk-free) rate
 5.5                                                                                                                                                                   is quite extended (see Figure 1). This suggests
5.0                                                                                                                                                                    enough room for SAGBs to absorb a move higher
4.5
                                                                                                                                                                       in global bonds. The follow-on question would
                                                                                                                                                                       surely be: if South Africa continues to deteriorate,
4.0
                                                                                                                                                                       should the breadth of the spread represent credit-
                                                                                                                                   Jul 18

                                                                                                                                                     Jul 19
       Jul 09

                    Jul 10

                                      Jul 11

                                                        Jul 12

                                                                 Jul 13

                                                                             Jul 14

                                                                                               Jul 15

                                                                                                                 Jul 16

                                                                                                                          Jul 17

                                                                                                                                                                       worthiness? At current levels, however, South
                South African 10-year – US 10-year
                                                                                                                                                                       Africa’s credit spread already trades very wide
                                                                                                                                                                       relative to both the investment grade (IG) and
Sources: Bloomberg, Coronation
                                                                                                                                                                       sub-IG indices (Figure 2), suggesting that further
                                                                                                                                                                       deterioration away from even sub-IG norms is
Figure 2                                                                                                                                                               being priced.
SOUTH AFRICA'S CREDIT SPREAD VERSUS THE IG AND SUB-IG INDICES
                                                                                                                                                                       THE RIGHT PRICE?
        %
175                                                                                                                                                                    Despite what might seem like an impressive
                                                                                                                                                                       return relative to cash in the local context, SAGBs
                                                                                                                                                                       have underperformed their peers considerably
125
                                                                                                                                                                       over the last five years due to a fundamental
                                                                                                                                                                       deterioration in South Africa. In the last five
 75
                                                                                                                                                                       years, SAGB nominal yields have risen by 148bps,
                                                                                                                                                                       while the implied 10-year real yield has risen by
 25                                                                                                                                                                    over 200bps. This compares to the emerging
                                                                                                                                                                       markets average of a 61bps compression in
 -25                                                                                                                                                                   nominal yields and a relatively small compression
                                                                                                                                                                       in implied real yields. As such, SAGBs are now the
-75
                                                                                                                                                                       cheapest in the emerging market universe from
                                                                                                                                                                       an implied real yield perspective and the second
       Dec 15

                             Jun 16

                                               Dec 16

                                                                 Jun 17

                                                                                      Dec 17

                                                                                                        Jun 18

                                                                                                                          Dec 18

                                                                                                                                            Jun 19

                                                                                                                                                              Dec 19

                                                                                                                                                                       cheapest from a nominal bond perspective
                South Africa versus BB Index                              South Africa versus BBB Index
                                                                                                                                                                       (Table 1 on page 16).
Sources: Bloomberg, Coronation
                                                                                                                                                                       Constructing a fair value for SAGBs using the
                                                                                                                                                                       global risk-free rate, inflation differentials
                                                                                                                                                                       (the difference between South African and US
                                                                   It is inevitable that bond yields will move higher                                                  expected 10-year inflation – see Table 2 on page
                                                                   over the next five to 10 years; however, in the next                                                16) and a measure of credit-worthiness for South
                                                                   two to three years, they could also move lower                                                      Africa (the South African credit spread) also
                                                                   before moving higher. Global inflation remains                                                      suggests that the South African 10-year bond,
                                                                   low, with global growth set to remain sluggish.                                                     currently trading at 9%, is at inexpensive levels.
                                                                                                                                                                       Even adjusting current variables for expectations
                                                                   Central banks around the world have continued                                                       around a rise in the global risk-free rate brings
                                                                   to inject large amounts of liquidity into financial                                                 one to a similar conclusion. The confluence of this
                                                                   markets to keep crises at bay and will continue to                                                  evidence suggests that SAGBs are adequately
                                                                   engineer a soft landing for the global economy.                                                     priced for current risks.
                                                                   This might not be the goldilocks economy of
                                                                   the early 2000s for emerging markets, but it will                                                   FINDING VALUE
                                                                   definitely be less turbulent than what we have                                                      We believe that bonds at the longer end of
                                                                   seen previously. Until we see a turn in global                                                      the curve continue to offer the best value.
                                                                   inflation, one should not expect a ramp-up in                                                       To ascertain which point on the SAGB yield
                                                                   global policy rates, which means that global                                                        curve is the most attractive, we use a total return
                                                                   bond yields should see only moderate fluctuation.                                                   analysis with a three-year horizon period across

                                                                                                                                                                                               TRUST IS EARNED™         15
various bond maturities. Table 3 shows how these       Table 1
bonds will perform if:                                 SAGBs NOW THE CHEAPEST IN THE EMERGING MARKET UNIVERSE

                                                                               Nominal        Implied real       5-year change in        5-year change in
1. The yield curve moves parallel up 1%;                                        yield            yield            nominal yield              real yield
2. The yield curve moves parallel down 1%;                                      11.9                0.4               4.22                    (0.42)
                                                       Turkey
3. How much each bond can sell off before it
                                                       South Africa              9.0                4.0               1.48                    2.14
   breaks even with the ALBI; and
                                                       Indonesia                 7.1                3.5               (0.61)                   1.81
4. How much each bond can sell off before it
   breaks even with the 10-year bond (R2030).          Mexico                    6.9                3.3               0.96                    1.02

                                                       Brazil                    6.8                3.0               (5.17)                  (2.42)
The previous analysis, taken together with the         India                     6.5                2.6               (1.42)                  (0.13)
fact that the difference between the 30-year and                                 6.2                2.4               (4.54)                  (1.42)
                                                       Russia
10-year areas of the SAGB yield curve is close to
                                                       Average                   5.0                1.3               (0.61)                  (0.21)
the widest it has ever been (1.39% during the
                                                                                 3.3                1.4               (0.56)                   1.10
taper tantrum of 2013), suggest that bonds at the      Malaysia

longer end of the curve continue to offer the best     Chile                     3.2                0.3               0.00                    0.44

value in our view.                                     China                     3.1                0.6               (0.41)                  (0.43)

                                                       Poland                    2.1               (0.5)              (0.39)                  (1.52)
PORTFOLIO ALLOCATION
                                                       Hungary                   2.0                (1.1)             (1.57)                  (2.03)
Inflation-linked bonds (ILBs), once again, under-
                                                       Czech Republic            1.5               (0.7)              0.81                    0.36
performed nominal bonds in 2019, with a return
of 2.6%. Only shorter-dated inflation-linked           Israel                    0.8               (0.4)              (1.36)                  (1.39)

bonds provided a positive return, albeit below
                                                       Sources: Bloomberg, Coronation
cash. A five-year ILB trades at a real yield of
3.6%. Using expected inflation of 4.5%, if one
holds this bond for the next three years, the          Table 2
nominal return would be in excess of 8%, which         SAGBs ADEQUATELY PRICED FOR CURRENT RISKS
compares very favourably to equivalent maturity
                                                                                                                               Current        Expected
nominal bonds.
                                                       US 10-year                                                              1.92%            2.75%

In addition, with expectations for the real policy     South African 10-year expected inflation                                5.04%           5.00%
rate to move closer to 1%, it makes the carry-on       US 10-year expected inflation                                           1.78%           2.00%
shorter-dated ILBs even more attractive. At current    South Africa’s credit spread                                            2.94%            2.94%
levels, shorter-dated ILBs therefore do warrant a
                                                       Fair value estimate                                                     8.12%           8.69%
position in a bond portfolio.
                                                       Sources: Bloomberg, Coronation

The South African economy has been plagued
with low growth, ballooning government finances
                                                       Table 3
and a volatile global geopolitical environment.
Low growth and well-contained inflation suggest        TOTAL RETURN ANALYSIS (THREE-YEAR HORIZON)
the trajectory for South Africa’s policy rates to be
                                                                                                Total return
lower over the next 12 months.                                                 Current  Yield curve    Yield curve     Breakeven     Breakeven relative
                                                       Bond        Maturity     yield sells off by 1% rallies by 1% relative to ALBI to 10-year (R2030)

In addition, South African bonds have continued to     R186        21 Dec 26   8.25%       9.93%            7.86%         (1.41%)             (1.16%)
underperform relative to their global and emerging     R2030       31 Jan 30    9.02%      11.43%           7.99%        (0.42%)
market counterparts, suggesting an increased           R2035       28 Feb 35    9.73%      12.85%            8.18%        0.01%               0.13%
risk premium, given South Africa’s precarious
                                                       R2040       31 Jan 40   10.03%      13.51%            8.17%        0.11%               0.22%
economic backdrop. At current levels, SAGBs seem
                                                       R2044       31 Jan 44   10.10%      13.82%           8.08%         0.13%               0.23%
adequately priced relative to underlying risks,
which suggest a neutral allocation in portfolios. +    Sources: Bloomberg, Coronation

16     COROSPONDENT
S T O C K A N A LY S I S

 The investment
 case for Distell
 A gem within the small- and mid-cap space

 by S I P H A M A N D L A S H O Z I

                                 Distell boasts a
                                                               Exposure to the            For beverage
      THE                     diversified portfolio                                                                 Quality management
                                                             fast-growing cider         companies, Africa
                                of brands, which                                                                     and a clear strategy
     QUICK                     generally rank first
                                                               market is a key         presents a multiyear
                                                                                                                    are key to unlocking
     TAKE                                                     driver for future          opportunity for
                                or second in their                                                                          value
                                                                   growth                    growth
                              respective categories

                              THE SMALL- TO MID-CAP space is littered with a         throughout South Africa as well as various countries
                              lot of poor-quality companies. Such companies          on the African continent and in Europe. Some
                              tend to flourish under favourable economic             of Distell’s well-known brands include Savanna,
                              conditions and struggle or cease to exist when         Hunter’s, Viceroy and Klipdrift. Figures 1 and 2 show
                              conditions deteriorate. They also often exhibit        the split of profits by product categories and main
                              a combination of the following characteris-            geographies. The biggest contributor to profits is
    Siphamandla is            tics: lack of scale, price taking, inexperienced       ciders (42%) and the biggest region is South Africa
  a portfolio manager         management teams, weak balance sheets and              (74%).
     with 15 years of
investment experience.        lack of product diversification.
                                                                                     TRENDS TIP THE BALANCE
                              As a result of these factors, the market generally     The South African alcohol market is mature,
                              punishes the small- to mid-cap sector by awarding      exceeding R200 billion in annual spend and a
                              a discount to its rating relative to the market. So,   relatively high per capita consumption. Overall
                              when we find a small- or mid-cap counter that          market growth has been very pedestrian over
                              generally displays the opposite of the above           the past decade, and changes in market share
                              characteristics but is priced attractively, we get     between categories and premiumisation have
                              very excited. We think Distell is one of those         been the key drivers of growth.
                              companies.
                                                                                     The beer category has the largest market share,
                              Distell is an alcoholic beverages business with        but has been losing ground to other categories,
                              its head office located in Stellenbosch. The           including ciders and spirits. Trends in the con-
                              company boasts a diversified portfolio of brands       sumption of alcohol have been changing from
                              across several categories including ciders, spirits    single- to mixed-gender occasions, the rejection of
                              and wines, and generally ranks first or second in      beer by health-conscious millennials and a notable
                              these categories. Production facilities are spread     increase in female drinkers.

                                                                                                              TRUST IS EARNED™         17
AN APPLE A DAY                                                         THE COMPETITIVE EDGE
                                     This shift requires companies to have a broad                          This growth has also attracted several
                                     portfolio of brands to cater to these trends.                          competitors into the category. In South Africa,
                                     Luckily, Distell has a portfolio that is very well                     consumers tend to lump ciders together with
                                     suited to these changing market dynamics. Over                         other flavoured alcoholic beverages (FABs) as
                                     the past couple of decades, the growth in cider                        one category, thus creating a bigger pool for
                                     has been phenomenal, at two to three times the                         competitors to attack one another. The biggest
                                     rate of beer. In South Africa, the category now                        competitors we worry about are Amalgamated
                                     occupies 9% of the market, compared to around                          Beverage Industries’ (ABI) Flying Fish (a flavoured
                                     6% to 7% internationally, making it the second                         beer) and Heineken’s Strongbow (a cider). While
                                     biggest cider market in the world after the UK.                        Flying Fish initially had some impact, it has
                                                                                                            faded, as ABI has been distracted by bedding
                                     Distell produces Savanna and Hunter’s, the                             down its acquisition of South African Breweries
                                     number one and two brands on the market, with                          (SAB). On the other hand, Heineken, which boasts
                                     a combined share of over 80%. These ciders have                        the largest cider brand (Strongbow) in the world,
                                     led to an impressive growth in group volumes and                       has had a negative impact, especially on the
                                     revenue of 5% and 10% per annum, respectively,                         Hunter’s brand.
                                     over the past 10 years. This stellar growth is even
                                     more impressive when one considers that growth                         However, Distell’s overall market share has surpris-
                                     in the spirits and wine categories has been                            ingly increased during this period. The company
                                     lacklustre due to the maturity of these markets.                       has been able to innovate by introducing brands
                                                                                                            like Bernini, a wine cooler, which leverages its
                                                                                                            strength in the wine market into the FAB category.
                                                                                                            This innovation has allowed Distell to fend off
                                                   Figure
                                                                                                            narrow competition looking to attack some of
                              EBIT CONTRIBUTION BY PRODUCT
                                                                                                            its big brands. It also demonstrates the value of
                                                                                                            having a deep, diversified portfolio of brands to
                                                                                  Sprits: 26%
                                                                                                            choose from. Given the low overall market share
                                                                                                            of the cider category, we believe the category has
                                                                                                            more legs for growth.
           Ciders: 42%
                                                                                                            NETWORK OPTIMISATION
                                                                                                            Due to historical reasons, Distell’s distribution of
                                                                                                            production facilities has been below optimal.
                                                                                                            This has contributed to a significant number of
                                                                                                            inefficiencies in its supply chain. A massive project
                                                                                                            to correct this has been undertaken, which involved
                                                                                                            closing some facilities while relocating others closer
                                                                                Wine: 32%
                                                                                                            to their respective markets. The benefits of this are
                                                                                                            multifold. Being closer to the markets allows better
                              Sources: Distell Annual Reports, Coronation estimates
                                                                                                            response times while reducing inventory holding
                                                                                                            time, thereby reducing the working capital cycle.
                                                   Figure
                                  EBIT CONTRIBUTION BY REGION                                               Moving production to bigger, scalable sites and
                                                                                                            decommissioning smaller, inefficient operations
                                                                                                            should also result in a lower unit cost of produc-
             Rest of Africa: 4%
                                                                                                            tion. These changes should improve both margins
                                                                                                            and free cash flows over the next few years.
     BLNS (Botswana,
     Lesotho, Namibia,
     Swaziland): 11%                                                                                        AFRICAN EXPANSION
                                                                                                            Excluding the last five or so years, Distell’s exports
                                                                                                            to African countries were booming, growing at
                                                                                        South Africa: 74%
      Rest of                                                                                               double digits for several years. However, the
      international: 7%
                                                                                                            slump in commodity prices led to currency fluctu-
                                                                                                            ations and a decline in demand for imported
                 Europe: 4%
                                                                                                            products in these countries. Some even raised
                                                                                                            import duties as they scrambled to fill gaps in
                                                                                                            their fiscal funding. This exposed the fragility of
                              Sources: Distell Annual Reports, Coronation estimates                         Distell’s export model as markets such as Angola,

18      COROSPONDENT
You can also read