Ai GROUP SUBMISSION 2019-20 FEDERAL BUDGET SUBMISSION - The Australian Industry Group
←
→
Page content transcription
If your browser does not render page correctly, please read the page content below
Ai GROUP
          SUBMISSION
2019-20 FEDERAL BUDGET SUBMISSION

                         JANUARY 2019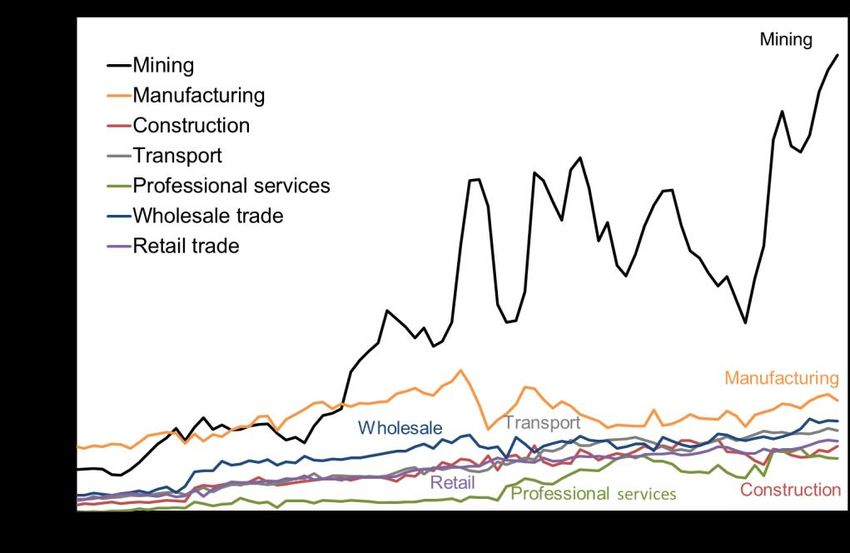
Australian Industry Group Submission to the 2019-20 Federal Budget

Contents
1.    Summary and Recommendations ................................................................................. 4
2.    Economic Outlook for Australian Business .................................................................... 9
2.1   Australian economy in 2018: a year of two speeds                                                                                9
2.2   Australian economic outlook: soft landing expected for 2019                                                                     17
2.3   Global outlook, challenges and risks in 2019                                                                                    23
2.4   Australian global competitiveness in 2019                                                                                       25
3.    Fiscal position ...................................................................................................................... 30
4.    Taxation Reform ................................................................................................................. 32
5.    Skills, Education and Training Policies .......................................................................... 37
5.1 Strategy to meet emerging skill needs                                                                                             37
5.2   Developing Australia’s STEM (STEM) capabilities                                                                                 41
5.3 Investment in continuous learning by existing workers                                                                             43
5.5   Reform of Australia’s apprenticeship system                                                                                     47
5.6   Investment in Australia’s VET system                                                                                            52
5.7 Connecting higher education                                                                                                       54
5.8 Towards a better-connected tertiary education system                                                                              57
5.9 Addressing youth unemployment                                                                                                     59
6.    Developing Australia’s business capabilities ............................................................. 62
6.1   Industry 4.0                                                                                                                    62
6.2   Digital capabilities                                                                                                            62
6.3   Cyber security capabilities                                                                                                     63
6.4   Improving Australia’s export capabilities .................................................................... 65
6.5   Improving Australia’s defence industry capabilities ................................................ 66
6.6   Energy and environment policy priorities ................................................................... 67
7     Innovation and Commercialisation Policies                                                                                       70
8     Annual skilled migration program ................................................................................. 72

                                                                                                                                             2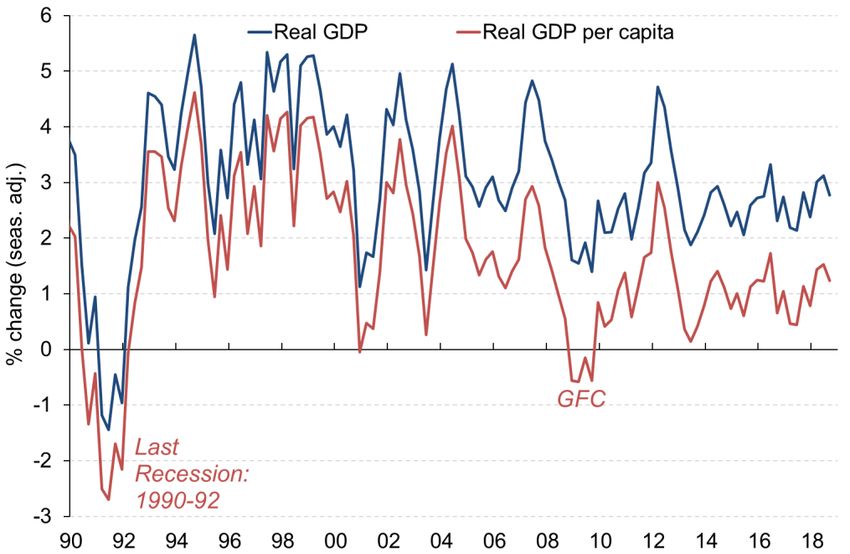
Australian Industry Group Submission to the 2019-20 Federal Budget

About Australian Industry Group
The Australian Industry Group (Ai Group) is a peak industry association in Australia which along with
its affiliates represents the interests of more than 60,000 businesses in an expanding range of
sectors including: manufacturing; engineering; construction; automotive; food; transport;
information technology; telecommunications; call centres; labour hire; printing; defence; mining
equipment and supplies; airlines; and other industries. The businesses which we represent employ
more than one million people. Ai Group members operate small, medium and large businesses
across a range of industries. Ai Group is closely affiliated with more than 50 other employer groups
in Australia alone and directly manages a number of those organisations.

Australian Industry Group contact for this submission
Dr Peter Burn, Head of Influence and Policy
Ph: 02 9466 5566
Email: peter.burn@aigroup.com.au

                                                                                                   3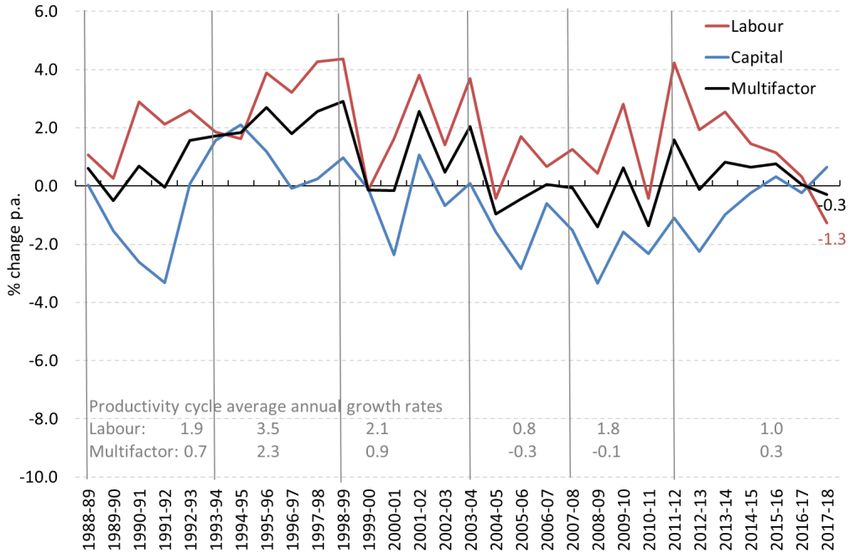
Australian Industry Group Submission to the 2019-20 Federal Budget

1. Summary and Recommendations

The domestic economy is slowing. Uncertainties about the direction of the global economy and the
prospect of further falls in trade volumes are creating international headwinds. And there are
significant domestic risks arising from high household indebtedness, falling residential property
prices, a constrained credit outlook and the impacts of high energy prices on key industrial sectors.

Jobs growth has been strong, the unemployment rate is lower than anticipated, participation rates
are high and reports of skill shortages are becoming more widespread. Nevertheless, there are still
clear frailties in the labour market with high rates of underemployment persisting and with youth
unemployment and underemployment remaining high.

While December’s Mid-Year Economic and Fiscal Outlook (MYEFO) showed a welcome
improvement in Australia’s fiscal position and heralded the return to structural budget surpluses,
the size of the projected surpluses suggests that further acceleration of fiscal consolidation will be
required to repay the stock of public-sector debt and rebuild a fiscal buffer that would restore our
fiscal resilience.

There is a risk that slower growth could undercut some of the MYEFO estimates of tax collections in
2018-19 and 2019-20. In this circumstance, while there is still a substantial medium-term task of
fiscal consolidation ahead, Ai Group would favour accepting a slower pace of fiscal consolidation in
the 2019-20 year rather than risk adding to the slowdown in momentum and further exposing the
frailties in the labour market by tightening fiscal policy in an attempt to preserve the thin surplus
estimated for 2019-20.

Inflation remains below the Reserve Bank’s target. Real wage growth appears to be rising gradually
but with a muted near-term outlook for the pace of productivity improvements, in most parts of
the economy further rises in real wages could only come at the expense of already-flat profitability.

In this environment Ai Group proposes modest and targeted allocations to underwrite medium to
longer-term productivity growth and to reinforce social cohesion with measures to address
entrenched youth unemployment and underemployment.

   •   Skills, education and training - including as a means of addressing some of the structural
       barriers to employment of segments of the workforce (particularly young people);
   •   Business capability development; and
   •   Innovation and commercialisation.

A further priority should be to maintain the current permanent migration target. There are
growing skill shortages across a range of industries and occupations and cutting back would
constrain domestic activity.

                                                                                                    4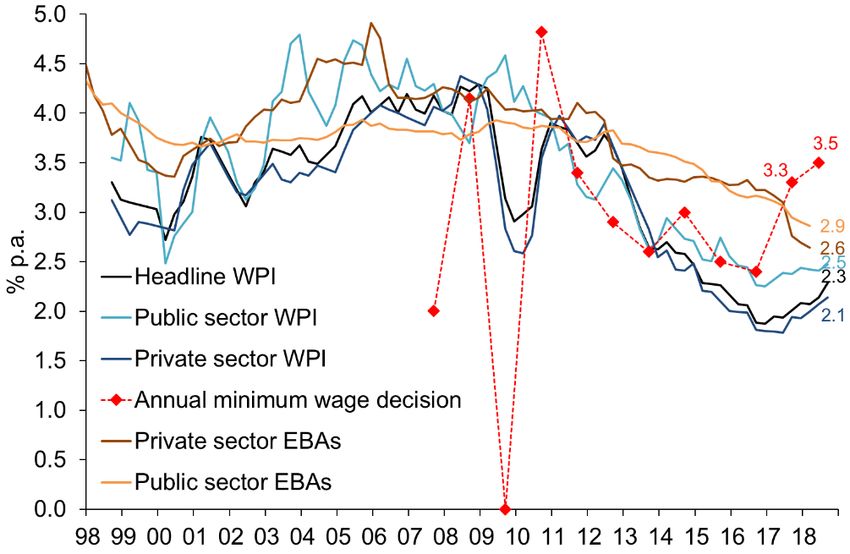
Australian Industry Group Submission to the 2019-20 Federal Budget

Policy Recommendations

Skills, Education and Training Policy

•   Invest in a renewed national skills forecasting system that incorporates increased regularity of
    reporting and assesses against broad sets of competencies.

•   Implement a national workforce strategy that provides industry-relevant workplace
    opportunities for students by coordinating partnerships between industry and the school and
    post-secondary education sectors.

•   Develop and effectively resource a national STEM skills strategy in conjunction with industry to
    expand the STEM-qualified workforce.

•   Implement measures to increase the level of STEM participation in the VET sector, especially
    through apprenticeships and traineeships relevant to STEM skills.

•   Develop specific measures to expand the STEM workforce in SMEs through cluster/network
    models.

•   Provide incentives for industry, focussing on SMEs, to assist with workforce planning to continue
    re-skilling its transitioning workforce.

•   Build capability for continuous learning in individuals through the curricula frameworks and
    teaching and learning practices of all education and training sectors.

•   A national foundation skills strategy needs to be provided with a sufficient budget to support
    workforce literacy and numeracy programs.

•   The Government commence discussions with industry and other appropriate stakeholders
    about the development of a new workplace LLN program.

•   Review Commonwealth employer apprenticeship incentives to include high skill (Diploma-level)
    traineeships that are Non-NSNL non-priority occupations.

•   Fund the ongoing development and rollout of the Industry 4.0 Higher Apprenticeship.

•   Encourage new employers of apprentices or employers with a poor track record of
    apprenticeship completions to participate in a workshop for apprentice supervisors to become
    eligible for Commonwealth incentives.

•   Facilitate direct industry and employer engagement by establishing a national body to oversee
    the apprenticeship system, including the Skilling Australians Fund. The oversight would include
    programs for which each state has powers to declare apprenticeships and determine funding
    levels.

                                                                                                   5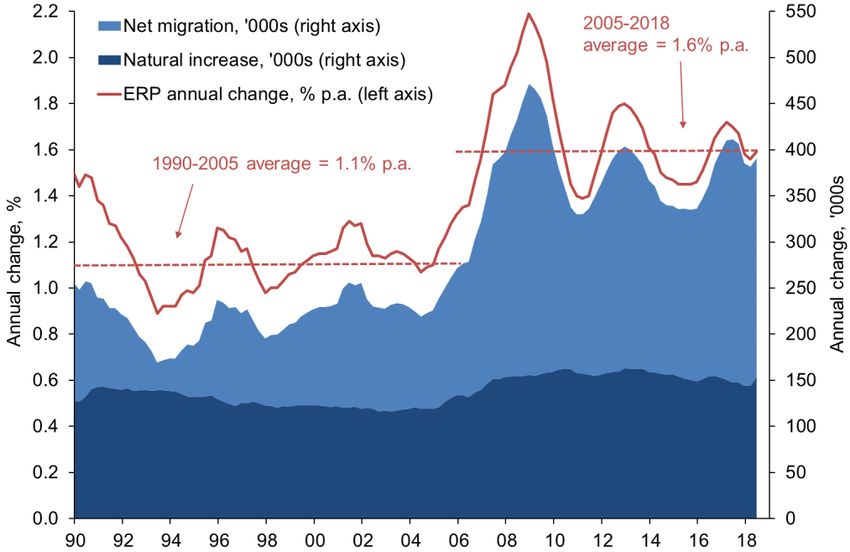
Australian Industry Group Submission to the 2019-20 Federal Budget

•   Provide targeted funding of GTOs to support their activities to help disadvantaged groups, and
    to help SMEs participate in the apprenticeship system, similar to the previous Joint Group
    Training Program.
•   Initiate a review of school-based apprenticeships to determine the reasons for low levels of
    participation and to develop strategies to facilitate greater participation by schools and industry.

•   Implement measures to achieve full national consistency for all apprenticeships across Australia,
    including consideration of an oversighting body to ensure programs and arrangements meet
    current and emerging occupational needs.

•   The Commonwealth and COAG should address declining investment in VET and increasingly
    uneven investment across jurisdictions, by examining the possibility of moving towards a
    nationally funded and nationally operated tertiary education system.

•   Commit further resources to the incorporation of higher order skills development within VET
    qualifications.

•   Fund pilots which examine a range of innovative models of connecting between industry and
    higher education providers, with the view to establishing new models of learning.

•   Implement incentives to assist SMEs provide opportunities for higher education students to
    experience the workforce and develop broad enterprise-focussed capabilities.

•   Investigate the establishment of a national independent coordinating agency to provide overall
    policy coherence for tertiary education.

•   Establish a more equitable funding arrangement for tertiary education with the first priority to
    address the decline in the funding for the VET sector.

•   Review the range of student loan schemes with a view to establishing a single, universal and
    more equitable system.

•   Increase investment in programs that prepare students for work and transition to the post-
    compulsory years while at school.

•   Fund programs to help young people deal with health and wellbeing challenges faced when
    moving out of the school environment.

•   Fund transition programs for unemployed young people that increase involvement by industry
    through work-based activities.

    Developing Business Capabilities

•   The Entrepreneurs’ Programme should continue to scale up in line with business demand and
    economic opportunity.

                                                                                                      6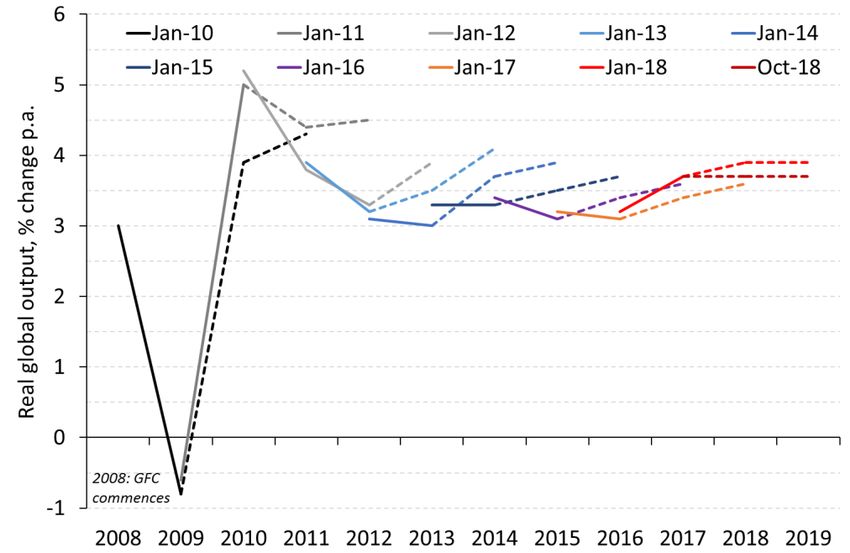
Australian Industry Group Submission to the 2019-20 Federal Budget

•   The Government should sponsor a public program targeted to SMEs to provide advice on
    options and facilitate their investment in digital capabilities. This should build on and
    complement the bDigital service available to clients of the Entrepreneurs’ Programme.

•   Given the rapidly evolving state of cyber threats and attacks, it is essential that our law
    enforcement bodies are sufficiently resourced, not only for protecting our national security, but
    also to protect business and consumers against global cyber crime.

•   It is critical that there is better collaboration between government and industry to tackle cyber
    security. Collaboration enables sharing of information about threats and helps build an
    innovative industry. In this context, Ai Group is working with our members to help them
    overcome these barriers, and we are open to working with industry and government to this end.

•   While the recently introduced encryption legislation requires amendment, businesses in the
    meantime are struggling to understand its implications for their legal and contractual
    obligations, regulatory costs and global competitiveness. The Government needs to fund
    outreach and information resources to address this.

•   Resource Austrade appropriately so it has the skills and resources to support Australian
    companies to access global value chains and to invest abroad.

•   Increase the availability of one-on-one support for new and emerging exporters.

•   Progressively increase the budget allocation for Export Market Development Grants (EMDG) by
    $12.4 million per year over the next three years to $175 million.

•   Maintain the Defence funding path as set out in the previous budget, with an underlying
    commitment to grow to two per cent of GDP by 2020-21.

•   Continue robust implementation of Australian Industry Capability plans in major Defence
    acquisition programs.

•   Finalise and implement key supporting Defence industry policies, including the Defence
    Sovereign Industrial Capability Priority implementation plans, the Defence Policy for Industry
    Participation and the Skilling and STEM strategy to support the training and skilling of Australia’s
    workforce to manage the ramp up of defence industry.

•   Provide additional transparency of the Government’s Defence investment plans through on-line
    access to the Integrated Investment Program.

•   Refresh the National Energy Productivity Plan and facilitate the provision of finance for energy
    efficiency in SME industry and rental properties.

•   Back the National Hydrogen Plan under development by the COAG Energy Council with finance
    for research, commercialization, skills and supporting infrastructure.

•   Bolster the Emissions Reduction Fund with at least a further $200m per year over four years as
    a stopgap while further climate policies are developed.
                                                                                                      7
Australian Industry Group Submission to the 2019-20 Federal Budget

•   Develop a program to support SME resource efficiency through information and the facilitation
    of funding.

    Innovation and Commercialisation Policy

•   Control the costs of the R&D Tax Incentive by adopting a $2m cap on the refundable element
    and investing in smarter systems to scrutinize claims. Do not proceed with the previously
    proposed stepping of the R&DTI rate based on research intensity, which would amount to a
    substantial across-the-board reduction in support for innovation and not provide meaningful
    incentives. Commit to maintaining broad stability for the overall R&DTI.

•   Provide additional funding of Defence research and development and innovation programs to
    help boost the ADF’s capability edge, including a review of the national security innovation
    system as a whole.

    Migration Policy

•   The annual permanent migration planning level should be maintained at the current cap of
    190,000.

•   Stronger priority should be given to the skilled migration stream within the permanent migration
    program and especially to the demand-driven components of skilled migration.

                                                                                                  8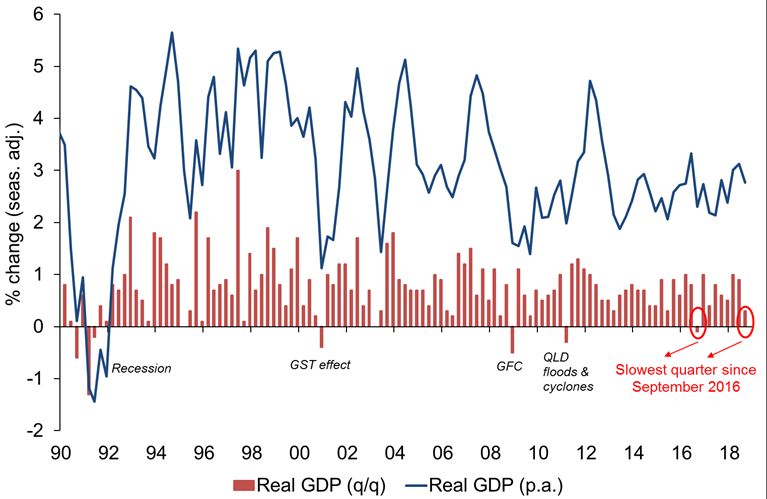
Australian Industry Group Submission to the 2019-20 Federal Budget

2. Economic Outlook for Australian Business
2018 was a year of two distinct halves for Australian businesses. The first half of 2018 saw a welcome
acceleration in business output, sales, employment and investment in response to improving global
and local conditions. In the second half of 2018 however, global growth was decelerating again,
under the weight of heightened trade tensions, geopolitical risk and slower industrial activity in
China. Locally, Australia’s growth looked relatively resilient and more broad-based than in the past,
with a greater range of locations and industries growing their output and employment in 2018. This
was supported by strong export earnings, high levels of public sector spending and investment (e.g.
for large long-term programs such as the National Disability Insurance Scheme and urban transport
infrastructure expansion and renewal) and relatively robust population growth. These positive
factors were countered somewhat by ongoing weakness in consumer spending and business
investment, long-term weakness in productivity growth and, more recently, by a shift downwards
in residential property prices and construction rates.

For many businesses, higher input costs - and especially higher energy input costs - ate into margins
in 2018, taking the shine off the increases in output and turnover that they were able to generate,
and reducing their ability to invest. This year’s annual Ai Group survey of Australian CEOs indicates
that although 57% of CEOs reported an increase in turnover in 2018, only 41% improved their profit
margins. 39% reported a fall in their margin in 2018. One third of CEOs said their general business
conditions improved in 2018 versus one quarter who saw a deterioration, relative to one year
earlier. In short, 2018 was a better year for many Australian businesses but it was not the ‘stellar
year’ that had been hoped for.

2019 is expected to be a touch slower for Australian businesses than was experienced in 2018, and
a touch slower than was previously expected for 2019. This reflects the very recent deceleration
that is evident across local and global indicators in recent months plus the increasing range of risks
on the horizon. This moderation in the outlook is apparent in the economic forecasts as well as in
business leaders’ expectations, plans and strategies. Heading into 2019, Ai Group’s annual CEO
survey reveals fewer CEOs are feeling optimistic about their general business conditions in 2019
than one year earlier. Indeed, on a net balance basis (optimists minus pessimists), fewer CEOs
expect an improvement in business conditions in 2019 than in any year since 2015. This largely
reflects their experiences in 2018 and especially the second half of 2018.

2.1    Australian economy in 2018: a year of two speeds
2018 was a year of two distinct halves for the Australian economy. The first half of 2018 saw a mild
but welcome acceleration in activity, employment, business incomes and investment, in response
to improving global and local conditions. In early 2018 commodity prices recovered but the
Australian dollar stayed low; population growth supported residential development and major
infrastructure projects; output increased across all industries except agriculture; and a solid run of
employment growth pushed participation up and unemployment down, including in regional
locations and among older Australians and Australian youth.

                                                                                                    9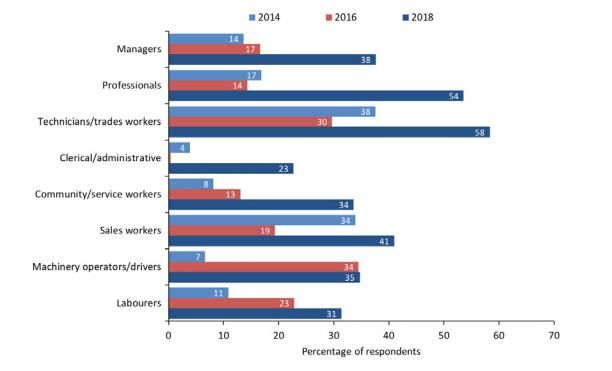
Australian Industry Group Submission to the 2019-20 Federal Budget
Agriculture and other industries in many regional locations were however, adversely affected by
protracted drought conditions through NSW and Queensland. Towards the end of 2018 global
conditions decelerated, under the weight of heightened trade tensions and geopolitical risk. And
locally, the beginnings of a downturn in residential property markets spread across east coast
metropolitan areas. These trends and emerging risks during the latter half of 2018 were evident
across key data and information sources including the ABS regular economic indicators (GDP,
CAPEX, employment), Ai Group’s monthly business surveys and the Ai Group annual CEO Business
Prospects survey for 2018-19.
Australian output growth in 2018
2018 marked 27 years since Australia last experienced a recession (1991), setting a modern record
among OECD countries. Australia’s real GDP grew at around its long-term average in the first half of
2018 (3.1% p.a. to June 2018) but then slowed in the second half, to 2.8% p.a. to September 2018
(chart 2.1). On the expenditure (demand) side of the economy, growth in 2018 was mainly driven
by net exports and government spending and government investment. An early boost to demand
from the residential construction boom had faded by mid-year, supplanted by major infrastructure
projects. Household spending was the weak link throughout 2018, constrained by slow incomes
growth and high housing debt.
CHART 2.1 Real GDP, annual and quarterly growth, 1990 to Q3 2018
Source: ABS, National Accounts, Sep 2018.
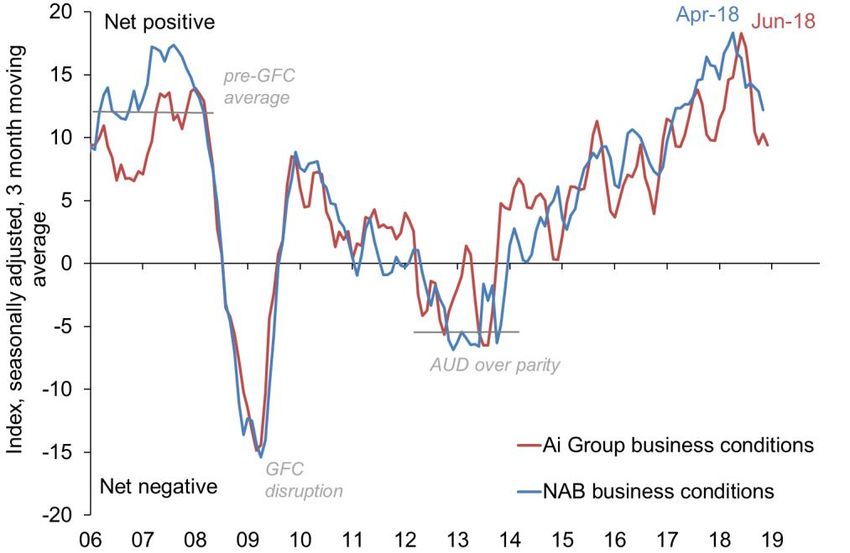
The two-speed nature of 2018 is more evident in the monthly surveys of private sector business
conditions conducted by Ai Group and the National Australia Bank (NAB). Both of these data series
clearly show business conditions (reflecting a composite of sales, profitability, exports, forward
orders and employment) improving through 2017 and into early 2018. Both series show a peak
10Australian Industry Group Submission to the 2019-20 Federal Budget
during Q2 of 2018, with decelerating – but not yet net negative – conditions through Q3 and Q4 of
2018 (chart 2.2).
CHART 2.2 Australian business conditions: Ai Group and NAB surveys, to Dec 2018
Sources: Ai Group Australian PMI, Australian PSI and Australian PCI; NAB Monthly Business Survey, to Dec 2018.
In line with improving local economic conditions in the first half of 2018, Australian CEOs
participating in this year’s Ai Group Business Prospects survey reported a broadly positive year. In
2018, a greater proportion of Australian CEOs reported improved performance and higher spending
on investment. Interestingly, more than half of respondents noted higher turnover in 2018 (57%)
but only 41% of respondents reported improving profit margins, with almost the same amount
reporting falling profit margins (39%). This can be at least partially explained by a high proportion
of respondents reporting increased inputs costs, especially regarding energy prices. Gas and
electricity prices increased to record highs in 2017, before easing partially in 2018. Most businesses
commit to energy contracts of more than one year, and price increases take time to filter through,
so many businesses may find themselves negotiating energy contracts that are much higher than
their previous contract. Steep energy price rises are proving difficult to pass on to customers and
are squeezing margins across a wide range of industries.
All industries except agriculture grew their output in the year to June 2018, but industrial sectors
lost some ground in the second half of 2018. Growth was strongest in 2018 in healthcare (reflecting
growth in the National Disability Insurance Scheme and other public sector programs) and in
services industries linked to real estate and/or large infrastructure projects. Output stumbled in Q3
however, across all of the industrial-related sectors including construction, manufacturing, mining,
utilities, agriculture, transport and telecommunications. Agricultural output was clearly affected by
drought in 2018 (down by 1.6% q/q and 7.9% p.a. in Q3), due to reduced grains and other crops.
(chart 2.3).
11Australian Industry Group Submission to the 2019-20 Federal Budget
As always, some states performed better than others in 2018. Population growth, housing demand
and government infrastructure projects all supported stronger activity in the large eastern states.
NSW and Victoria enjoyed stronger jobs growth and lower unemployment rates than other states
throughout 2018. A recovery in global commodity prices benefited Western Australia and, to a
lesser extent, Queensland.
CHART 2.3 Real output size and growth, by industry, Q3 2018
Source: ABS, National Accounts, Sep 2018.
Australian income growth in 2018
National income is influenced by more than just output volumes. The terms of trade is also a key
factor. As of September 2018, recovering commodity prices had lifted Australia’s terms of trade by
2.7% p.a.. This helped push up real gross domestic income (GDI) by more than just output alone;
real GDI rose by 0.4% q/q and 3.4% p.a., compared to 0.3%q/q and 2.8% p.a. for real GDP.
Nominal income growth was spread across all categories of income, including employees, financial
corporations (banks, building societies, superannuation funds and related entities), non-financial
private corporations and dwelling owned by individuals in 2018. The share of total income derived
from each type of income remained relatively stable over the year, at 52% for employees, 20% for
private sector non-financial corporations, 6.7% for private sector financial corporations, 9.6% to
small businesses and self-employed individuals and 8% in rents earned from dwellings owned by
individuals.
That said, income growth is extremely uneven across major industries, with most of the growth in
aggregate company profits accruing to the mining sector. Nominal gross operating profits (GOP) in
mining grew by 27% in the year to Q3 2018, accounting for 64% of all of the increase in profits and
rising to 37% of all GOP earned in that year. Nominal GOP in the non-mining sectors grew by a
modest 1.0% q/q and 6.8% p.a. in Q3. In contrast, nominal GOP in manufacturing fell by 5.1% q/q
12Australian Industry Group Submission to the 2019-20 Federal Budget
to $8.1 billion in Q3 2018, well below the industry’s high point of $10.1bn, which it reached just
before the GFC in June 2008 (chart 2.4).
CHART 2.4 Nominal aggregate company profits in industrial & related sectors,
to Q3 2018
Source: ABS, Business Indicators, Sep 2018.
Australian productivity growth in 2018
Productivity growth remains weak and patchy in 2018 and in the current ‘productivity cycle’. Across
all of the industries for which productivity estimates are available, labour productivity fell by 1.3%
in 2017-18 and multifactor productivity fell by 0.3%, on a quality adjusted hours worked basis. Over
the latest (incomplete) productivity cycle since the last peak in 2011-12, labour productivity growth
has averaged 1.0% p.a. and multifactor productivity has averaged 0.3% p.a. (chart 2.5).
Reflecting this weakness in recent productivity growth, GDP growth per capita fell by 0.1% in Q3
2018 (to be up by just 1.2% p.a.) and gross value added output per hour worked dropped by 0.1%,
to be up by just 0.6% over the year to Q3. This failure to generate meaningful productivity growth
has weighed on real incomes over an extended period, and continues to do so. It implies a greater
reliance on export prices, population growth and labour participation as key supports for Australia’s
output and income growth.
Australian employment growth in 2018
The labour market tightened somewhat in 2018. Full-time employment has grown for two years,
with an average increase of 20,300 per month. Part-time employment accounted for 31.5% of the
workforce in October 2018, down from a record high in earlier 2018. In trend terms, the national
unemployment rate fell to 5.1% by October 2018, its lowest level since June 2011. Most positively,
the youth unemployment rate (for those aged 15-24 years) fell to 11.2% in October 2018 from a
recent peak of 14.1% in November 2014. This was the lowest youth unemployment rate since the
13Australian Industry Group Submission to the 2019-20 Federal Budget
GFC began to bite in 2008. The underemployment rate (that is, the proportion of the labour force
who are working but able to work more hours) remained at 8.3% in October, which is relatively
elevated by historical standards. This indicates a greater degree of ‘spare capacity’ in the labour
market than is evident from the unemployment rate alone. This spare capacity continues to weigh
on wage growth, albeit more lightly than in recent years.
CHART 2.5 Productivity growth, all selected industries*, 1988-89 to 2017-18
* Quality adjusted hours worked basis, for all industries for which estimates are available. Source: ABS, Estimates
of Industry Multifactor Productivity, Dec 2018.
Stronger employment growth is attracting more people into the labour market and pushing up the
national participation rate (those that are working or looking for work). As of October, Australia’s
participation rate was 65.60%, just shy of the record high of 65.64% in December 2010 (trend). A
strong rise in female participation has more than offset a long-term fall in male participation. This
has occurred despite the long-term ageing of our population, which more typically sees participation
rates decline.
Australian wages and prices in 2018
Wage growth accelerated in 2018, from record slow rates in 2016 and 2017. The ABS Wage Price
Index (WPI) for the September quarter (Q3) of 2018 grew by 0.6% q/q and 2.3% p.a. This was its
fastest annual growth rate since Q3 2015. The ABS noted that “September quarter wages growth
was mainly influenced by increases to the national minimum wage [3.5% in 2018], regularly
scheduled enterprise agreement increases, modern awards and salary reviews timed to coincide
with the financial year.”
All wage setting methods contributed to wage growth over the year to Q3 2018, suggesting wage
growth has lifted from its slowest point in this cycle after reaching a recent low of 1.9% p.a. in 2016.
Public sector wages grew by 0.6% q/q and 2.5% p.a. in Q3 2018 and have been stronger than wage
increases in the private sector since 2014. Private sector wages excluding bonuses grew by 0.5% q/q
14Australian Industry Group Submission to the 2019-20 Federal Budget
and 2.1% p.a., their fastest annual growth rate since Q2 2015. Private sector wages including
bonuses rose by 2.7% p.a. in Q3, which suggests that more firms are now paying higher bonuses
instead of raising base rates (for example, in order to retain flexibility and reward stronger
performances) (chart 2.6).
CHART 2.6 Australian wage growth indicators, 1998 to 2018
Sources: ABS, Wage Price Index, Sep 2018; Fair Work Commission; Department of Jobs and Small Business,
Trends in Federal Enterprise Bargaining, June 2018.
Inflation remained weak in 2018, with the headline consumer price index (CPI) slowing to 1.9% p.a.
in the September quarter of 2018 (Q3), just below the RBA’s target band of 2 to 3% over the cycle.
Underlying inflation was slightly lower, easing to its slowest rate since early 2017, at 1.8% p.a., but
up from its lowest point in 2016. This deceleration in 2018 reflected modest price rises for housing-
related costs such as utilities, rents, property rates and charges, as well as price falls for out-of-
pocket childcare services expenses, communications and household equipment and services. On
the upside, weak national inflation means that relatively weak wages growth is still enough to
generate (very modest) real income growth.
Inflation is not quite so benign however, for all businesses. Input costs are, on average, rising more
strongly than output prices for producers of Australian goods and services. Price growth in
preliminary (+5.2% p.a.) and intermediate (4.7% p.a.) producer inputs strongly outpaced price
growth in producer outputs (+2.1% p.a.) in Q3 of 2018. This ‘growth gap’ between price rises for
final products versus preliminary and intermediate inputs indicates that business margins were
further compressed in Q3 2018.
In response to this mixed picture – and more particularly, in response to the glacial pace of change
in prices and wages - the Reserve Bank of Australia (RBA) left the cash rate on hold at a record low
of 1.50% for all of 2018, where it had been since August 2016 (a record length of time with no
movement).
15Australian Industry Group Submission to the 2019-20 Federal Budget
Australian well-being in 2018
Despite this mixed scorecard of economic factors, the OECD was strongly positive in its latest
assessment of Australia’s economic, personal and community well-being (chart 2.7). In Dec 2018 it
concluded:
“Australia's long span of positive output growth continues, demonstrating the economy's
resilience to shocks. The labour market has been equally resilient, with rising employment
and labour-force participation. Life is good, with high levels of well-being, including health,
and education.
… During the global financial crisis, comparatively limited exposure, but also good economic
management, saw output growth hold up well. Also, the economy's adjustment in the wake
of the commodity super-cycle has been reasonably smooth. This good macroeconomic
performance has strengthened the country's standing in terms of GDP per capita.
…scores are favourable on many other indicators of well-being. Australia scores particularly
well in health status, ranking first among OECD countries with life expectancy of 82.5 years
compared with an OECD average of 80.1 years and a high score in self-reported health. It
also scores well in terms of air pollution, ranking 5th in the OECD, subjective well-being and
social connections (both 7th place in the rankings). Immigration has played a fundamental
role in the demographic, economic and cultural development of Australia, and continues to
do so with broadly successful integration.” (pp. 6 and 11)
CHART 2.7 Australia’s ranking on OECD indicators of national well-being, 2018
Source: OECD 2018, OECD Economic Surveys: Australia. December 2018.
16Australian Industry Group Submission to the 2019-20 Federal Budget
2.2 Australian economic outlook: soft landing expected for 2019
After a stronger period of activity during 2017-18, the Australian economy looked to be slowing
again by the end of 2018. Reflecting this deceleration, the latest expectations for growth in 2019
remain cautiously positive but are a touch slower than was experienced in 2018, and a touch slower
than were previously expected for 2019. The risk profile has risen, locally (see below) and globally.
Government expectations for 2019
This moderation in the outlook is apparent in the economic forecasts as well as in business leaders’
expectations, plans and strategies. In its latest quarterly Statement on Monetary Policy (published
in November 2018, before the latest GDP estimates for Q3 2018 had been released), the RBA slightly
upgraded its forecasts for GDP growth to 3.5% for the end of 2018. This seems optimistic given the
latest data for 2018 to date, despite quarterly volatility and recent revisions to the published
estimates. The RBA expects GDP growth to then moderate to 3.25% in 2018-19 and 3.0% by the end
of 2020, as production volumes of new resource commodities (mainly LNG exports) come on
stream, stabilise and then cease to contribute to growth, albeit at a new, significantly higher level
of production volumes (see table 2.1).
As of the end of 2018, Treasury was feeling more circumspect than the RBA about headline GDP
growth rates for Australia in 2019, as was the OECD. Treasury forecasts GDP growth of 2.75% in
2018-19 and 3.0% in 2019-20 (and the OECD forecasts 3.0% for the 2019 calendar year), significantly
slower than the RBA’s forecast of 3.25% in both years (table 2.1). Both central government agencies
expect growth of around 3.0% in 2020 and beyond, which is around the long-run average for
Australian GDP growth, but rather faster than our average annual growth rate of 2.7% achieved
since 2010 (or 2.9% since 2000).
During 2019, the RBA and Treasury expect GDP growth to be supported by large-scale public
spending programs that are already under way, particularly for infrastructure projects and the
implementation of the National Disability Insurance Scheme (NDIS). They also expect better non-
mining business investment, after many years of weak spending. This should help to counter falls in
residential investment and building activity after the recent boom of 2018, when construction of
new apartments hit an all-time peak.
Strong jobs growth in 2018 may moderate in 2019, but it is still likely to push the unemployment
rate lower from the recent rate of 5.1% (as of October 2018). Indeed, unemployment is well on track
to falling below the RBA and Treasury’s expectation of 5.0% by the end of 2018-19. It has already
exceeded the OECDs’ estimate of 5.4% by December 2018. This recent tightening in the labour
market is already feeding through into wages growth, which bottomed out during 2018 and is now
accelerating gently. Ongoing long-term weakness in productivity growth plus slow background
inflation (CPI of 1.9% p.a. in Q3 2018) however, means wages growth seems unlikely to accelerate
from the current rate of around 2.3% p.a. (Wage Price Index, Q3 2018) all the way to 3.0% in 2019-
20 and 3.5% in 2020-21.
A cautious mood among households (encouraged by slow wages growth, high household debt and
falling house prices in Sydney, Melbourne and some other cities and regions), means that the key
uncertainty in the local economy for 2019 is the outlook for discretionary household spending.
Treasury hopes that household spending growth will pick up to 3.0% by 2020 as the labour market
17Australian Industry Group Submission to the 2019-20 Federal Budget
tightens and household incomes rise more strongly, but the OECD is expecting growth in real
household spending to slow to just 2.0% over the next two years (in line with its less positive
assessment of the labour market).
More positively, exports of services and manufactured goods are expected to keep growing in 2019
and beyond, supported by solid trading partner growth (mainly in Asia) and the depreciation of the
exchange rate since the start of 2018. Globally, growth has slowed in some economies but is
expected to remain above trend in major advanced economies. The risk of trade disruption and
protectionism are increasing however, which could slow global GDP, trade business confidence and
investment.
TABLE 2.1 Australian Economy: Latest Annual Growth Rates And Forecasts
2016-17 2017-18 2018- 2019-20 2020
RBA SoMP (Nov 2018)
e e 19 f f f
GDP, % change p.a., year end 1.8 3.1 3.25 3.25 3.0
Unemployment rate, %, year end 5.6 5.4 5.0 4.75 4.75
Inflation (CPI), % change p.a., year end 1.9 2.1 2.0 2.25 2.25
2016-17 2017-18 2018- 2019-20 2020-21 2021-22
Treasury MYEFO (Dec 2018)
e e 19 f f p p
GDP, % change p.a., year average 2.1 2.8 2.75 3.0 3.0 3.0
Household consumption, % p.a., yr ave. 2.6 2.8 2.5 3.0
Dwelling investment, % p.a., yr ave. 2.8 0.1 1.0 -4.0
Business investment, % p.a., yr ave. -4.0 6.0 1.0 5.0
Employment growth, % p.a., year end 1.9 2.7 1.75 1.75 1.5 1.5
Unemployment rate, %, year end 5.6 5.4 5.0 5.0 5.0 5.0
Inflation (CPI), % change p.a., year end 1.9 2.1 2.0 2.25 2.5 2.5
Wages (WPI), % change p.a., year end 1.9 2.1 2.5 3.0 3.5 3.5
Terms of trade, % change p.a., yr end 14.4 1.9 1.25 -6.0
OECD (Dec 2018), calendar years 2016 e 2017 e 2018 f 2019f
GDP, % change p.a., year end 2.6 2.2 2.9 3.0
Household consumption, % p.a., yr end 2.9 2.7 2.0 2.0
Dwelling investment, % p.a., year end 8.7 -2.2 -2.1 -2.2
Business investment, % p.a., year end -9.5 2.6 3.8 5.3
Employment growth, % p.a., year end 1.7 2.3 2.0 1.8
Unemployment rate, %, year end 5.7 5.6 5.4 5.3
Inflation (CPI), % change p.a., year end 1.3 2.0 2.1 2.3
e = estimates, as of December 2018. f = forecast p = projection. Sources: ABS various data; RBA Nov 2018 Statement
on Monetary Policy (SoMP); Australian Treasury Dec 2018, Mid-Year Economic and Financial Outlook 2018 (MYEFO);
OECD Dec 2018, OECD Economic Surveys, Australia.
In its latest assessment of the “resilient” Australian economy, the OECD identifies three key risks for
2019:
• Disruptions to the local housing market and residential construction sector, predicated by falling
residential dwelling prices in Melbourne and Sydney. The OECD says “The housing market poses
macroeconomic risks. Australia's housing market is a source of vulnerabilities due to elevated
prices and related household debt. House prices have fallen, although only gradually since late
last year; the current trajectory would suggest a soft landing, but some risk of a hard landing
remains”;
18Australian Industry Group Submission to the 2019-20 Federal Budget
• Disruptions to export markets due to rebalancing policies inside China. The OECD says
“Australia’s concentration of exports in commodities is a key element in Australia's risk profile.
Most critical are developments in demand and prices for iron ore and coal, particularly the
impact of China's economy on these. China is also of growing importance for Australia’s trade in
services, notably in tourism”; and
• Disruptions to export markets due to an escalation of international trade disputes. The OECD
says “the impacts on Australia of higher US tariffs on imports from China and Mexico are
probably not large but a widespread increase in tariffs globally could have substantial impact”.
Drought conditions are an additional, short-term drag on output growth in Australia during 2018-
19. A Federal election will be held during 2019, which might depress sentiment and delay spending.
Business expectations for 2019
Australian business expectations for 2019 are generally positive, albeit milder than one year earlier
(when they were asked about their expectations for 2018) and broadly similar to initial expectations
for 2016 and 2017. For 2019, one third of CEOs expect better general business conditions and a
further 41% expect no change in 2019. One quarter expect a deterioration in general business
conditions (chart 2.8). The single biggest caveat on this mildly positive outlook for most businesses
is concern about rising input costs and especially rising energy costs in 2019; 63% of CEOs expecting
their input prices to rise and a whopping 68% expecting their energy input costs to rise in 2019.
CHART 2.8 Expected Business Conditions*, 2013-2019
* ‘Net balance’ is the proportion of all survey respondents that improved minus the proportion that
deteriorated. Aggregate results include respondents from all surveyed industries and are weighted by ABS
estimates of output from each industry.
Opportunities and challenges for Australian businesses can arise offshore and onshore, from
external and internal factors. When asked which factors would provide the biggest challenge to
business in 2019, 31% of CEOs identified a ‘lack of customer demand’ as their most significant
19Australian Industry Group Submission to the 2019-20 Federal Budget
constraint, down from 45% of CEOs who said the same in 2018 (and down from most previous years,
since 2013) (see Chart 2.9).
Labour market concerns feature prominently for businesses in 2019. The second most pressing
concern for CEOs in 2019 is skill shortages with 21% of businesses nominating this as their top
concern. This is up from 17% of leaders that identified skill shortages as an impediment for 2018
and triple the proportion in 2017 (7%). These concerns reflect rising demand for labour seen in 2017
and 2018, as was indicated across a range of data sources including the monthly ABS Labour Force
surveys and Ai Group’s Australian PMI®, PSI® and PCI®. A further 7.5% of CEOs said the flexibility of
industrial relations is their top concern in 2019, up from 4% in 2018. Despite these widespread (and
growing) concerns about skill shortages and flexibilities, only 5% of CEOs ranked wage pressures as
their greatest inhibitor in 2019, similar to 2018 but well down from 12% of CEOs in 2017.
As reported in Ai Group's 2018 publication on workforce skill needs1, businesses note that employee
capabilities for both current and future-oriented occupations are not meeting demand with 75% of
respondents reporting shortages in the technician and trades worker category. Difficulties remain
for businesses recruiting employees with STEM skills and shortages were reported for those needing
skills in automation, Big Data and artificial intelligence.
CHART 2.9 Expected Inhibitors To Business Growth*, 2013 To 2019
* Percentage of respondents who ranked each factor first in each year, out of a list of possible inhibitors.
Competition from imports and online sources (14%) increased as a constraint for 2019 compared to
2018 (11%) but was well down from the recent peak in 2017 when it was a primary inhibitor for 28%
of responding businesses. Following the recent peak of the Australian dollar in January 2018
concerns about high and/or variable exchange rates was the main issue for 4% of businesses, which
1
Australian Industry Group, 2018, Skilling: A national imperative.
20Australian Industry Group Submission to the 2019-20 Federal Budget
was slightly up from 2018 (3%). This was much lower than the 10% of businesses that had nominated
this in 2015, when the trading range for the dollar had been much higher.
Government regulations were a primary constraint for around 7% of CEOs, down slightly from the
past couple of years. Other constraining factors for business in 2019 included: rising input costs due
to higher energy prices (the most commonly listed ‘other’ factor); uncertainty about international
trade; drought conditions and access to funding for operational and/or investment purposes.
With regard to prices, the majority of CEOs expect prices to rise for both their inputs (63% of CEOs)
and their outputs (52% of CEOs) in 2019 (chart 2.10). Indeed, a higher proportion of businesses plan
to implement price rises for their own goods and services in 2019 than in any of the preceding six
years. Just 10% of businesses plan to cut their selling prices in 2019, which is a lower proportion
than had planned to cut prices from 2013 to 2017.
At the same time, more businesses are expecting price volatility on the input side in 2019. A higher
proportion of businesses expect their input costs to rise in 2019 (63%) than in any of the previous
six years, but there is also a higher proportion (6%) who expect their input prices to fall in 2019. As
a result, a smaller proportion of businesses (30%) expect their input costs to remain unchanged in
2019, compared to CEOs’ pricing expectations for the previous six years (2013-18). This increase in
input price volatility adds an additional layer of uncertainty to business planning, that may not have
been present previously.
CHART 2.10 EXPECTED BUSINESS PRICING INDICATORS*, 2013-2019
* ‘Net balance’ is the proportion of all survey respondents that improved minus the proportion that deteriorated.
Aggregate results include respondents from all surveyed industries and are weighted by ABS estimates of output
from each industry.
This concern about input price changes largely (but not solely) relates to energy pricing. Over two-
thirds of CEOs (68%) expect energy input costs for their business to rise further in 2019. This comes
on top of reported energy price increases for 63% of businesses in 2018. Rising energy prices (and
reliability of energy supply) are becoming a key risk for an increasing number of Australian
21Australian Industry Group Submission to the 2019-20 Federal Budget
businesses, and across an increasing range of industries.
At the start of 2017, 50% of business expected energy prices to increase, compared to 64% of
business at the end of 2017 that reported higher energy prices. Energy costs were expected to get
worse in 2018, with almost three quarter of CEOs (71%) expecting energy costs for their business to
rise. At the end of 2018, 63% of CEOs reported higher energy prices. In 2019, 68% of CEOs expect
further increases to energy prices, 5% expect lower energy prices (+63% net balance) and 27%
expect no change in energy prices.
These significant input cost increases help to account for the more subdued expectations for profit
margins than for turnover in 2019, with 58% of CEOs expecting their turnover to improve in 2019
but only 46% expecting their profit margins to improve.
These price rises are denting an otherwise positive outlook for sales and margins. Nevertheless (or
possibly in response), the great majority of CEOs plan to maintain or grow their employment and
investment in 2019, albeit in fewer numbers than one year earlier. Most CEOs do not plan to change
the amount spend on staff training, physical CAPEX and R&D. 39% expecting to spend more on staff
training, 33% expecting to spend more on physical CAPEX and 23% expecting to spend more on
R&D. Very few CEOs intend to spend less on investment in 2019 (chart 2.11)
CHART 2.11 Expected Business Investment Indicators*, 2013-2019
* ‘Net balance’ is the proportion of all survey respondents that improved minus the proportion that deteriorated.
Aggregate results include respondents from all surveyed industries and are weighted by ABS estimates of output
from each industry.
These expectations for business investment are in line with the latest estimates of non-mining
business investment collected by the ABS. As of Q3 2018, the ABS’s fourth estimate of annual Private
New Capital Expenditure and Expected Expenditure (CAPEX) for 2018-19 indicated total CAPEX is
likely to fall by 2.1% from the previous year, due to a 14% fall in mining CAPEX. Mining CAPEX
accounted for 29% of all CAPEX in 2018, down from a peak of 59.4% at the height of the mining
investment super-cycle (chart 2.12).
22Australian Industry Group Submission to the 2019-20 Federal Budget
Outside of mining, CAPEX is expected to grow by around 9% p.a. (in nominal dollars), including a rise
of 6% among manufacturing businesses and 9.3% among other selected industries. Manufacturing
accounted for 8.3% of total CAPEX in 2018, down from around 20% in the early 2000s and a record
high of 27% during the last recession of 1991. CAPEX by selected industries outside mining and
manufacturing was back up to 62.5% of total CAPEX in 2018, after falling to an all-time low of 34%
during the mining super-cycle. In 2019 it will rise further in absolute terms and as a share of CAPEX,
as mining recedes.
CHART 2.12 Private Business Capital Expenditure (CAPEX),
Actual Annual Value And Expected Annual Value* In 2018-19
* five year average realisation ratio applied. Source: ABS, Private New Capital Expenditure and Expected
Expenditure, Sep 2018.
2.3 Global outlook, challenges and risks in 2019
2018 saw an improvement in economic growth rates in most but not all larger advanced economies.
The risks are growing that 2019 may see global growth rates flatten out or even decelerate, due to:
• trade tensions between the world’s largest and most influential economies including the USA,
China, the UK and the eurozone, which are already disrupting trade and investment;
• regional conflicts in the middle east and elsewhere which have the potential to further disrupt
trade flows and to affect oil prices and other key commodity prices;
• slower growth in the US as the benefits of temporary stimulus measures wane. Growth rates in
US employment, incomes and investment appear to have already peaked; and
• slower growth in China as its Government seeks to rebalance the economy, contain financial
risks and pursue non-financial goals such as pollution containment and urban consolidation. The
23Australian Industry Group Submission to the 2019-20 Federal Budget
RBA recently noted that Chinese authorities are easing fiscal policy in some areas to avoid overly
slow growth, while responding to financial stability risks. In the very long-term, growth in China
is expected to slow, reflecting structural factors such as a shrinking working age population.
In its last major assessment of the global economy for 2018, Australia’s RBA noted that trade
tensions are the single biggest risk for 2019. It said that the global outlook remains broadly positive,
but that current trade tensions between major economies run the risk of escalating and/or
spreading to involve other countries. The effect of these tensions on business investment decisions
in affected countries and globally are a separate but related concern, any cancelled or delayed
investment will also weigh on future growth.
For these and other reasons, by late 2018 the RBA had marked down its expectations for growth
among Australia’s trade partners in 2019 and 2020. In addition to a slower outlook for China,
Australia will face slower growth in Japan (partly due to consumption tax increases in 2019) and
stable growth rates at best throughout Southeast Asian economies that are trade-exposed to a
slower China. More positively, growth appears to be accelerating in New Zealand and India, which
are also major trade partners for Australia.
Similarly, the OECD2 downgraded its outlook for the global economy due to slower trade growth. In
December 2018, the OECD said global growth has already peaked and is set to weaken over the next
two years. The OECD is now forecasting “a soft landing”, with global output growth projected to
slow from 3.7% in 2018 to 3.5% in 2019 and 2020 (see Table 2.2). Growth in the OECD countries is
set to slow gradually from 2.4% p.a. in 2018 to 1.9% in 2020. This is partly because of slowing growth
in the United States in the coming two years, as the short-term benefits of recent tax cuts wear off
and trade tensions with China start to bite. The OECD says the risk of a harder landing has risen since
mid-2018 due to:
• escalating trade tensions and the fragmentation of multilateral rules-based trade systems;
• financial market instability and tightening financial conditions (e.g. rising interest rates); and
• China slowing more than expected as its authorities try to balance growth against stability.
TABLE 2.2 OECD Growth Forecasts, Selected Economies, November 2018
Real GDP, % change p.a. 2017e 2018f 2019f 2020f
World output 3.6 3.7 3.5 3.5
OECD countries 2.1 2.5 2.4 2.1
US 2.2 2.9 2.7 2.1
Euro area 2.5 1.9 1.8 1.6
Japan 1.7 0.9 1.0 0.7
Australia 2.2 3.1 2.9 2.6
Non-OECD countries 4.6 4.7 4.7 4.7
China 6.9 6.6 6.3 6.0
India 6.7 7.5 7.3 7.4
World trade volumes, % change p.a. 5.2 3.9 3.7 3.7
e = estimate, f = forecast. Source: OECD Economic Outlook, November 2018.
The International Monetary Fund (IMF) 3 had already downgraded its global growth outlook in
2
OECD November 2018, Economic Outlook.
3
IMF October 2018, World Economic Outlook.
24Australian Industry Group Submission to the 2019-20 Federal Budget
October 2018 , and for similar reasons, as it has in almost every update over the past decade.
Indeed, the pattern among all of the international economics agencies since the disruptions of the
GFC has been to over-estimate the growth outlook and subsequently revise it down (see chart 2.13).
This reflects a very protracted period of slow growth for many advanced economies since the GFC
commenced in 2008. In a detailed analysis attached to its latest World Economic Outlook, the IMF
says the GFC reduced long-term potential global growth by reducing fertility rates, migration, trade
and income equality in the countries that were most directly affected by it. Specific polices have
affected outcomes in individual countries. More positively for Australia, the IMF says countries such
as Australia that were in “better fiscal shape, with better regulated and supervised banks, and
flexible exchange rates generally suffered less [long-term] damage.”
CHART 2.13 Global GDP: Actual Annual Growth and IMF Forecasts*
* Solid lines = actual, Dotted lines = forecasts.
Sources: IMF October 2018, World Economic Outlook, and earlier editions.
2.4 Australian global competitiveness in 2019
Australia’s global competitiveness received a solid boost through 2018 from a sustained drop in the
trading range for the Australian dollar, to values below its long-run average of around 75 US cents
(see chart 2.14). This drop was influenced by external factors including lower global commodity
prices, rising perceptions of global risk and rising US interest rates and bond returns relative to
Australia’s during 2018. In 2019, recovering commodity prices could push the Australian dollar
higher once more, but this upward influence is likely to be countered by higher global interest rates
and financial market risk perceptions, which have historically pushed the Australian dollar lower
against the US dollar and other currencies.
25Australian Industry Group Submission to the 2019-20 Federal Budget
CHART 2.14 Australian Dollar, Commodity Prices and Terms Of Trade
Sources: RBA, end of month exchange rates, to end of Nov 2018; RBA, end of month commodity price indexes,
to end of Nov 2018; ABS, National Accounts, to Sep 2018.
Looking past the effects of movements in the dollar, the World Economic Forum (WEF) ranked
Australia as the 14th most competitive business environment in 2018 in its (revised) annual Global
Competitiveness Report, up one place since 2017. Australia scored 78.9 points out of a possible 100
points in 2018, up slightly from 78.2 points in 2017. This suggests a modest improvement in
Australia’s absolute competitive performance (the score) as well as its relative performance (the
rank). In the WEF’s 12 ‘pillars’ of performance, Australia shared top spot with 31 other countries for
‘macroeconomic stability’ and obtained a near perfect score for public health. Australia also
obtained high scores for the size and stability of the national financial system and for national
workforce skills (based on average education attainment, literacy rates and other metrics).
Compared to 2017, the WEF results for 2018 indicate Australia’s performance deteriorated most
notably in infrastructure (transport, communications and energy). This was balanced out by
improvements in ICT adoption, product markets and innovation capability (chart 2.15).
Australia’s lowest scores are in the pillars for ‘labour market’ and ‘innovation capability’. Australia’s
innovation capability score is almost 20 points below that of best-ranking Germany and Australia is
ranked 18th for this ‘innovation’ pillar. Looking at the individual indicators that make up the
‘innovation’ pillar, Australia performs well with regard to research and development (78.8 points)
but performs relatively poorly on the softer dimensions of the innovation ecosystem including
‘interacting and diversity’ (60.8 points) and ‘entrepreneurial culture’ (61.6 points) indexes.
Relatively poor labour market scores and rankings for Australia in the WEF global competitiveness
index reflect Australia’s centralised wage-setting system through a national minimum wage and
26You can also read