Review of the collaborative economy in NSW - NSW Department of Finance, Services and Innovation - Department of ...
←
→
Page content transcription
If your browser does not render page correctly, please read the page content below
Review of the
collaborative
economy in NSW

NSW Department of
Finance, Services and
Innovation

October 2015

Review of the collaborative economy in NSW

Contents
Executive Summary.................................................................................................................... i
1       What is the collaborative economy? ............................................................................... 8
        1.1      Definition.......................................................................................................................... 8
        1.2      Features of the collaborative economy............................................................................ 10
        1.3      Economics of the collaborative economy......................................................................... 11
        1.4      The rise of the collaborative economy in Australia........................................................... 12
2       Transportation and automotive..................................................................................... 16
        2.1      Ridesharing ..................................................................................................................... 16
        2.2      Car sharing...................................................................................................................... 18
        2.3      Peer-to-peer car sharing services .................................................................................... 19
3       Accommodation services .............................................................................................. 20
        3.1      Home sharing platforms .................................................................................................. 20
        3.2      Estate and space sharing ................................................................................................. 24
4       Financial services .......................................................................................................... 26
        4.1      Online crowdfunding....................................................................................................... 26
        4.2      Lending ........................................................................................................................... 32
        4.3      Other .............................................................................................................................. 35
5       The goods and redistribution market ............................................................................ 38
        5.1      The goods and redistribution market............................................................................... 39
6       Services and labour hire ................................................................................................ 42
        6.1      Personal services............................................................................................................. 42
        6.2      Professional services ....................................................................................................... 43
7       Education ...................................................................................................................... 45
        7.1      Collaborative courses ...................................................................................................... 45
        7.2      Peer-to-peer platforms ................................................................................................... 46
8       Other collaborative businesses...................................................................................... 48
        8.1      Logistics .......................................................................................................................... 48
        8.2      Utilities ........................................................................................................................... 48
        8.3      Media ............................................................................................................................. 49
        8.4      Equipment rental ............................................................................................................ 49
        8.5      Pet sitting ....................................................................................................................... 50
        8.6      Food and dining .............................................................................................................. 50
9       The future of the collaborative economy in NSW .......................................................... 51
        9.1      Potential areas of growth ................................................................................................ 51
        9.2      Sectors with collaborative economy potential ................................................................. 52
Liability limited by a scheme approved under Professional Standards Legislation.

Deloitte refers to one or more of Deloitte Touche Tohmatsu Limited, a UK private company limited by guarantee, and its networ k
of member firms, each of which is a legally separate and independent entity.
Please see www.deloitte.com/au/about for a detailed description of the legal structure of Deloitte Touche Tohmatsu Limited an d
its member firms.

© 2015 Deloitte Access Economics Pty Ltd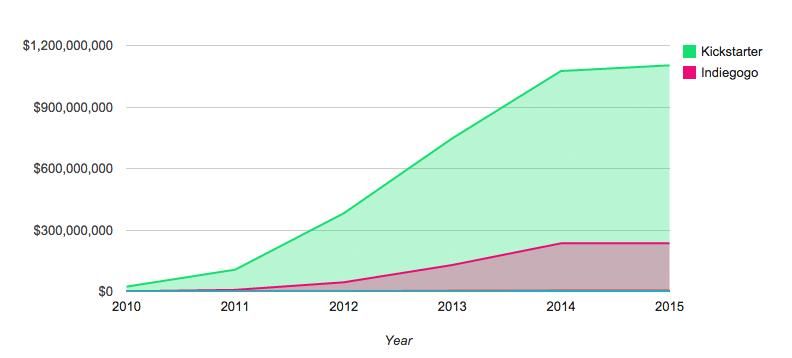
9.3    Challenges to growth ...................................................................................................... 59
Limitation of our work ............................................................................................................... 60

Executive Summary
       The ’collaborative economy’ has been an emerging and dynamic sector in the global
       economy in recent years. The NSW Department of Finance, Services and Innovation (DFSI)
       commissioned Deloitte Access Economics to conduct a review of the state of play of the
       collaborative economy in NSW.

       This report is a summary of the current scope and size of the collaborative economy in NSW
       based on publicly available data. The report considers the economic contribution of the
       collaborative economy in NSW by researching more than 80 collaborative businesses across
       a dozen sectors.

       This report is intended to provide the DFSI with a baseline understanding of the current
       state of play of the collaborative economy in NSW. The report also explores some sectors
       with potential for growth in NSW, which can be used as a starting point for more detailed
       analysis should the NSW Government seek to better understand the future direction of the
       collaborative economy.

       Definition of the collaborative economy

       There are many definitions of the ‘collaborative economy’. As the starting point, we adopt
       the following definition by Rachel Botsman:1

              “an economy built on distributed networks of connected individuals and
              communities versus centralised institutions, transforming how we can produce,
              consume, finance, and learn.”

       However, such a broad definition may also capture business models that are considered to
       be operating in the ‘mainstream’ economy, such as hobby farmers selling produce at a
       weekend farmers’ market. Collaboration has always been a part of economic development.
       It is not a new phenomenon. Elsewhere in economic and business literature, the
       collaborative economy has referred to workplace collaboration between employees, or
       organisations like Commonwealth Scientific and Industrial Research Organisation
       ‘collaborating’ with businesses like BHP Billiton. They are not the focus of this report.

       Recent developments in technology and the use of digital platforms have allowed wider
       and faster interactivity and connectivity between producers and consumers, which has
       enabled shared production and consumption around common objectives.2 This report
       focuses on aspects of the collaborative economy which are enabled by digital platforms.

       The ‘boundaries’ around the collaborative economy are not precise, and is evolving.
       Collaborative economy businesses generally facilitate connections between individuals and
       small and medium-sized businesses; allowing them to directly exchange goods or services

       1
        Rachel Botsman (2013), “The Sharing economy Lacks a Shared Definition”, available at:
       http://www.fastcoexist.com/3022028/the-sharing-economy-lacks-a-shared-definition#4
       2
        P2P Foundation (2012). “ Synthetic Overview of the Collaborative Economy “, available at:
       http://p2p.coop/files/reports/collaborative-economy-2012.pdf
Deloitte Access Economics                                                                                         i
                                                                                           Commercial-in-Confidence
for monetary or other consideration. However, as collaborative businesses evolve these
boundaries are changing, and aspects of these businesses are looking more like the
traditional businesses they are disrupting.
While a broad definition will capture too much, a narrow definition risks overlooking
innovation at the edges. As such, we note that what is included within the boundary is
often a matter of judgement. For example, while eBay is in-scope as an example of a digital
marketplace for retail goods, we have not included the website of the Trading Post; and the
Hipages Group is in-scope as an example of a digital marketplace for services, while the
Yellow Pages online directory is considered out of scope.
The report focused on the following sectors and areas:
transport and automotive;
accommodation services;
financial services;
the goods and redistribution market;
services and labour hire;
education; and
other collaborative businesses.
Table i (on pg. v) summarises the sectors and some example businesses that are covered in
the report.
Value and structure of the collaborative economy in NSW
We estimate that key businesses in the most developed collaborative economy sectors—
transport and automotive, accommodation services, financial services, the goods and
redistribution market, and services and labour hire—contribute a combined value added of
around $504 million per year to the NSW economy, with around 45,000 users having
earned income on collaborative economy platforms. These estimates are based on limited
publicly available data and assumptions of the share of NSW. This estimate is likely to be
conservative, with the total value of the collaborative economy in NSW likely to be larger.
This compares with a total size of the NSW economy of approximately $488 billion in 2013-
14.3
Overall, the collaborative economy is currently a relatively small part of the Australian and
NSW economies. Market share estimates vary across sectors, for example: around 4% in
accommodation; approximately 2% in point-to-point transport; and around 1.4% in retail
goods. In the personal lending market, collaborative business activity is only a fraction of
the market, and could be as low as 0.02%.
However, market share figures understate the importance of collaborative businesses,
given that growth has been fast, with many businesses non-existent even a few years ago,
and they may have competitive impacts on existing businesses. Many consumers have
‘tried’ the offerings of collaborative businesses (53% had participated in some form of
3
ABS (2015), Australian National Accounts: State Accounts, Cat. No 5222.0, 2013-14, November 2014.
Deloitte Access Economics ii
Commercial-in-Confidencecollaborative economy in the past year, formal and informal). The collaborative economy is
also becoming more diverse, beyond the headline brand names in transport,
accommodation and goods to new areas including personal and professional services, and
education.
The majority of collaborative businesses in Australia originated overseas, and many do not
have a headquarters in the traditional sense. Of the 27 businesses covered in this report
with known Australian starting points or headquarters, two-thirds were from NSW –
suggesting that NSW may represent a significant share of the collaborative economy in
Australia.
While Australian-based collaborative businesses are prevalent across all sectors that were
reviewed, most of these businesses are still relatively small. As Australia’s largest economy,
there may be considerable opportunity for NSW to support its development.
Future of the collaborative economy
It is likely that the collaborative economy will impact areas which we have yet to anticipate.
In fact, the nature of disruption means that it is almost impossible to predict exactly how
the collaborative economy will grow, but it could be a mix of:
wider availability of existing sharing economy services;
vertical or horizontal integration of existing collaborative economy firms; and/or
development of new collaborative economy services.
So far, the collaborative economy has been most prevalent with regards to the
consumption of goods and traditional services such as accommodation, transport, and
personal and professional services. The following may have contributed to their success:
Collaborative economy businesses tend to thrive when they connect people with assets
that are not fully utilised, but which they already own, with those who do not have
these assets.
Collaborative economy businesses that meet a market demand for an improved service.
Collaborative economy businesses that achieve network effects; where the number and
density of participants leads to greater outcomes for all parties involved.
A review of international experience suggests that ridesharing, accommodation, and food
sharing services are much less established in Australia than some overseas countries.
International experience also indicates that the financial sector presents a significant
opportunity. In particular, there appears to be a role for the collaborative economy to
support small and medium enterprise financing, which is, at this stage, largely negligible. It
is in markets such as these where we are likely to witness the most interesting
opportunities.
We reviewed the start-up activity at a number of major incubators and accelerators in
NSW. While not all of these start-up businesses are collaborative businesses, trends in tech
start-up activity can offer insights into the areas that entrepreneurs are focusing their
efforts, which may provide an indication of new growth sectors. We found that more than
30% of these start-ups are related to services and labour hire. The second most common
category of start-up business, representing 15% of the start-ups reviewed, related to
Deloitte Access Economics iii
Commercial-in-Confidencefinancial services. Education related start-up businesses comprised 10% of the businesses
reviewed, with a focus on educational tools that facilitate distance education via the
internet. Most of our economy is driven by services, so that is the area of greatest
potential growth for the sharing economy.
We speculate that the sharing of resources from utilities such as Wi-Fi and energy, as well
as services and labour hire, in particular in logistics, are two sectors of potential growth in
NSW. Furthermore, we recognise that Sydney has an advantage in financial services which
could see significant development. Nonetheless, as this activity grows, the risks associated
with financial services means that appropriate regulatory oversight will likely be more
important in this sector than any other.
This paper does not analyse regulatory issues in depth, but it is obvious that the
appropriate balance of regulation is needed to ensure fair outcomes for all participants and
also allow for continuing innovation.
In the digital age, the ‘time at the top’ for new businesses is increasingly limited. Innovative
developments may replace the collaborative economy business models in years to come, as
the ‘disrupters’ themselves become ‘disrupted’. Flexibility, in terms of the business models
of individual businesses, as well as the institutional framework within which they operate, is
important.
Deloitte Access Economics iv
Commercial-in-ConfidenceTable i: Summary of sectors included in the report
Industry Examples of major players Which key areas are included Key conclusions
in this report?
Transportation and Ridesharing UberX contributed over 1 million rides and around $20m in
automotive Car sharing income in Sydney in the year since its launch in May 2014,
P2P car sharing representing 1.2% of all point-to-point transport activity
according to our calculations
Pocketbook claims that around $1 is spent on Uber services
for every $12 on taxis
31.6% of all car sharing platforms were established in NSW
GoGet the most established brand in the Australian car
sharing market (22.1% market share) was launched in
Sydney
Accommodation Home sharing Airbnb contributed approximately $284m in income last
services platforms year nationwide and $115m in NSW. This represents
Estate and space approximately 3.4% of the total hotel, resort and motel
sharing market in Australia
Sydney is the 10th largest Airbnb market worldwide
With 80% of Sydney’s Airbnb listed properties outside of
main hotel areas such as the city centre, Airbnb claims that it
allows tourists to see a different side of Sydney
Financial services Online crowdfunding The current size of P2P lending in Australia is small (only one
Lending founded before 2014), but has significant room for growth
Other financial in the future
services Future prospects will depend on the regulatory approach
taken by policymakers
Deloitte Access Economics v
Commercial-in-ConfidenceIndustry Examples of major players Which key areas are included Key conclusions
in this report?
The goods and Peer-to-peer The collaborative economy probably makes up around 1-2%
redistribution market marketplaces of the retail goods market. eBay accounted for 20.3% of
Peer-to-peer sharing total online retail shopping visits in Australia for 2014 (this
Crowdsourcing includes both eBay Australia and eBay overseas). Online
retail shopping is now a $16.9b industry representing 6.8%
of traditional retail spending
Services and labour Personal services Digital labour marketplaces provide a significant opportunity
hire Professional services for flexible working options
A whole new market of services has emerged – for example
line queuing
Some platforms such as Hipages Group have over 55,000
listed service providers which represents around 3% of the
entire tradesperson industry in Australia
It is possible that the collaborative economy will be one of
the most significant forces affecting the nature of work and
workplaces in the coming decades
Education Collaborative courses Massive open online courses have made education more
Peer-to-peer platforms collaborative between students
such as the used Textbook rentals and second hand exchanges are making
textbook and tuition education more accessible and affordable
market Around 780,000 users are registered on StudentVIP, a
second hand tertiary textbook marketplace, compared to 1.3
million enrolled tertiary students in Australia
Deloitte Access Economics vi
Commercial-in-ConfidenceIndustry Examples of major players Which key areas are included Key conclusions
in this report?
Other collaborative Additional markets covered The collaborative economy is very diverse and far reaching.
businesses include: It is affecting a range of different industries such as pet
Logistics sitting, utilities, logistics, food, media and equipment rental
Utilities Organisations such as One Big Switch have used the
Media collective power of people in bargaining arrangements and
Equipment rental claims to have reduced energy bills from Energy Australia by
Pet sitting 22%
Food and dining Crowd shipping companies such as MeeMeep have used
their platform to reduce transport costs of small goods by
approximately 55% compared to standard delivery methods
Deloitte Access Economics vii
Commercial-in-Confidence1 What is the collaborative
economy?
The ’collaborative economy’ has been an emerging and dynamic sector in the global
economy in recent years. While not a new concept, recent developments and rapid growth
facilitated by technology have led to a renewed focus on its scope and operations. Indeed,
brand names such as Uber and Airbnb have become household names despite having only
recently entered our lexicon.
The growth of the collaborative economy has raised a range of issues for the Government
and regulators. Its innovative growth has had a disruptive impact on several industries, and
has implications for regulation, particularly in relation to consumer protection.
It is in this context that the NSW Department of Finance, Services and Innovation (DFSI) has
commissioned Deloitte Access Economics to conduct a review of the collaborative economy
in NSW.
This report is a summary of the current scope and size of the collaborative economy in NSW
based on publicly available data. The NSW Government has demonstrated its support of
business innovation, including with the establishment of Innovate NSW in 2013 which
connects technology SMEs and businesses in key sectors of the NSW economy. This report
is intended to provide the DFSI with a baseline understanding of the current state of play of
the collaborative economy in NSW. The report also explores some sectors with potential for
growth in NSW, which can be used as a starting point for more detailed analysis should the
NSW Government seek to better understand the future direction of the collaborative
economy.
This chapter provides a definition and overview of the collaborative economy.
1.1 Definition
The term ‘collaborative economy’ is sometimes used interchangeably with the “sharing
economy” and the “peer-to-peer market although they may be subtly different from each
other. There are many definitions of the collaborative economy and what it includes.
Rachel Botsman (2014)4 has defined the collaborative economy as:
“an economy built on distributed networks of connected individuals and
communities versus centralised institutions, transforming how we can produce,
consume, finance, and learn.”
4
Rachel Botsman (2013), “The Sharing economy Lacks a Shared Definition”, available at:
http://www.fastcoexist.com/3022028/the-sharing-economy-lacks-a-shared-definitionOn the other hand, the sharing economy as defined by Botsman5 as:
“an economic model based on sharing underutilised assets from spaces to skills
to stuff for monetary or non-monetary benefits. It is currently largely talked
about in relation to peer-to-peer (P2P) marketplaces but equal opportunity lies
in the business to consumer (B2C) models.”
Separately, the peer-to-peer market refers to the parts of the collaborative or sharing
economies which do not involve transactions with businesses.
As the starting point, this report adopts Botsman’s definition of the collaborative economy.6
However, such a broad definition may also capture business models that are considered to
be operating in the ‘mainstream’ economy, such as hobby farmers selling produce at a
weekend farmers’ market. Collaboration has always been a part of economic development.
It is not a new phenomenon. Elsewhere in economic and business literature, the
collaborative economy has referred to workplace collaboration between employees, or
organisations like Commonwealth Scientific and Industrial Research Organisation
‘collaborating’ with businesses like BHP Billiton. They are not the focus of this report.
Recent developments in technology and the use of digital platforms have allowed wider
and faster interactivity and connectivity between producers and consumers, which has
enabled shared production and consumption around common objectives. 7 What is and is
not included as part of the collaborative economy is a matter of judgement. Practically, this
report is not limited by rigid criteria. However, we focus on businesses which are enabled
by digital platforms, rather than bricks-and-mortar collaborative economy applications.
The ‘boundaries’ around the collaborative economy are not precise, and is evolving.
Collaborative economy businesses generally facilitate connections between individuals and
small and medium-sized businesses; allowing them to directly exchange goods or services
for monetary or other consideration. However, as collaborative businesses evolve these
boundaries are changing, and aspects of these businesses are looking more like the
traditional businesses they are disrupting. While a broad definition will capture too much,
a narrow definition risks overlooking innovation at the edges.
In this study, we consider a number of sectors in the collaborative economy, including:
transport and automotive;
accommodation services;
financial services;
the goods and redistribution market;
5
Ibid
6
It should be noted that the “collaborative economy” has also been used in other areas to refer to the benefits
of workplace or business collaboration in improving productivity and output. This definition is not used in this
report.
7
P2P Foundation (2012). “ Synthetic Overview of the Collaborative Economy “, available at:
http://p2p.coop/files/reports/collaborative-economy-2012.pdf
Deloitte Access Economics 9
Commercial-in-Confidence services and labour hire;
education; and
other collaborative businesses
1.2 Features of the collaborative economy
Without seeking to limit the scope of the collaborative economy, this section presents
some of the key features common to collaborative economy businesses.
One of the defining characteristics of the collaborative economy is the existence of a
platform connecting buyers and sellers, reducing transactions costs. While a focus has
been on collaborative economy businesses which involve digital platforms, the platform
need not necessarily be online, but may involve more traditional connection of buyers and
sellers, for example through newspapers or other media.
The platform may or may not be owned by the parties involved in the transaction. In some
definitions, the platform owner is considered to be a third party separate from the buyer
and seller (as is the case for collaborative economy businesses such as Uber). On the other
hand, companies such as GoGet own both the assets (cars) and also run the platform. In
this study, we include all businesses involving a platform, regardless of its ownership.
Another characteristic of the collaborative economy is trade. This may involve a financial
transaction between parties when an asset or service is provided (such as for Airbnb), or
may involve an ‘in kind’ transaction (Couchsurfing members may trade travel knowledge
and cook for their hosts).
The collaborative economy is not limited to peer-to-peer transactions (such as through
Gumtree), but also includes transactions where one party may be a business (bricks-and-
mortar retailers diversifying their selling channels through eBay).
The collaborative economy also encompasses anything that can be bought, rented or sold,
and is not limited to physical unwanted or underutilised assets (Parkhound), but may
include the trade of time (Airtasker) and money (Kickstarter).
Peer review systems may also be a feature of collaborative economy operations. These
systems allow for the provided goods and services to be rated, with the aim of ensuring
minimum standards and upholding consumer protection in the absence of direct
regulation.
Deloitte Access Economics 10
Commercial-in-Confidence1.3 Economics of the collaborative economy
The rise of the collaborative economy is largely attributable to technology-driven solutions
which address market failures and target the demands of consumers in a dynamic market.
Some of the key drivers of the collaborative economy are noted in the figure below.
Figure 1.1: Drivers of the sharing economy
Source: Deloitte Access Economics
Platforms connecting buyers and sellers reduce transaction costs and reflects a changing
role of intermediaries. Every market exchange has a transaction cost made up of search and
information costs, bargaining and decision costs and policing and enforcement costs.
Where transaction costs are too high, mutually beneficial transactions that could occur do
not.
Essentially, the sharing economy emerged because developments in information and
communications technology have significantly lowered transactions costs.8 For example,
owners of under-utilised assets can more easily find users willing to pay for the use of their
assets, allowing access to excess capacity, potentially from users around the world.
Platforms also provide coordination benefits, and reduce bargaining costs as individual
contracts may not need to be negotiated for every transaction. They can also assist with
policing and enforcement through self-regulation structures and requirements for criminal
checks or insurance.
Their take-up also reflects the fact that the collaborative economy is meeting consumer
demands for such services; for example, it allows owners of idle assets to recover the cost
8
Institute of Public Affairs (2014), “The sharing economy: how over regulation could destroy and economic
revolution”, available at: https://ipa.org.au/portal/uploads/Sharing_Economy_December_2014.pdf.
Deloitte Access Economics 11
Commercial-in-Confidenceof time, space or money allocated to an asset that would otherwise have not been used.
The benefit to renters of idle assets is that they can consume the services of those assets
for less than they would need to spend to purchase and own the asset outright, reflecting
changing views about asset ownership. This is particularly the case for large and costly
assets, such as cars, where the collaborative economy allows some consumers access when
they may simply be unable to consume their services without the opportunity to rent rather
than own.
A 2011 survey by BAV Consulting9 showed that 66% of consumers (and 77% of millennials)
preferred a pared down lifestyle with fewer possessions. Consumer demand for
collaborative economy offerings is clear, for example:
worldwide, Airbnb averages 425,000 guests per night (more than 155 million guest
stays annually, nearly 22% more than Hilton Worldwide, which served 127 million
guests in 2014; and
Uber operates in more than 250 cities worldwide and as of February 2015 was valued
at $41.2 billion, exceeding the market capitalisation of companies such as Delta Air
Lines, American Airlines and United Continental.
The collaborative economy also facilitates more flexible employment options for its
participants – people are able to earn either a part or full income from selling goods or
services at a time and in a manner which suits them. For example, ridesharing drivers may
choose to supplement their income by driving a few hours a week in their spare time or a
host may choose to list a spare room occasionally or more regularly.
Social media and online reviews have facilitated the growth of the collaborative economy
by breaking down barriers, encouraging transparency and allowing people to connect with
others involved in the transaction. This allows for the ‘trust’ required in the trading
relationship with people who would otherwise have been strangers.
The collaborative economy has largely come about through businesses seeking flexibility in
regulation – with a number of collaborative economy businesses operating on the
boundaries of existing regulation, particularly in the areas of point to point transport and in
accommodation.
1.4 The rise of the collaborative economy in
Australia
A 2014 report, The Emerging Collaborative Economy in Australia10 highlights the uptake and
awareness of the collaborative economy in Australia. The report involved some bespoke
analysis and surveys. Some of the key findings are presented below.
9
The post-recession consumer mindset (2011). See: http://bavconsulting.com/wp-
content/uploads/2013/11/The-Post-Recession-Consumer-Mindset-Escan-Credit-Union.pdf
10
Collaborative Lab and Vision Critical (2014), “The Emerging Collaborative Economy in Australia
Deloitte Access Economics 12
Commercial-in-ConfidenceFigure 1.2: Involvement in the collaborative economy in Australia
were aware of had plan on
61% collaborative
economy
53% participated in
some form of
63% participating in
some form of
services in collaborative collaborative
Australia economy in economy
the past year activity in the
(formal and near future
informal)
Source: Deloitte Access Economics based on Collaborative Lab and VisionCritical data (2014).
Valuing the collaborative economy in NSW
There are a number of significant businesses included in the collaborative economy in NSW
which are having a disruptive impact on other industry players. However, it is difficult to
estimate the total value of the collaborative economy in NSW for a number of reasons.
Firstly, there is no single agreed definition of the collaborative economy, and different
analyses will include or exclude different businesses. Further, the collaborative economy
can be measured from the different angles of the producer and the consumer.
There is also the challenge of valuing the NSW component of a business’ value. Producers
and consumers may be in different physical locations. In some instances, the value of
collaborative economy businesses in NSW may be greater than NSW’s proportional share of
population, given where businesses have originated and derive most of their activity.
Many collaborative economy businesses are new or start-up businesses and as such do not
have published annual reports of their value. Where information is available, businesses
tend to report their revenue, not their value added, which is a more accurate measure of
their value.
Furthermore, NSW specific data were often not available. In these cases, to calculate the
level of economic activity in the NSW collaborative economy, we adjusted the national
estimate by a factor that is proportionate to NSW’s share in population to the rest of
Australia. Estimates are summarised in the following table.
Deloitte Access Economics 13
Commercial-in-ConfidenceTable 1.3: NSW collaborative economy business values
Sector Example Revenue Multiplier Value added Users who
business generated($m) ($m) earned income
Transportation and Uber 38.5 0.83 32.0 6,904
automotive
Accommodation Airbnb 115.6 0.54 62.4 16,518
services
Financial services SocietyOne 3.6 0.40 1.4 2,449
Goods and eBay 951.0 0.24 228.2 955
redistribution
Services and labour Hipages 461.8 0.39 180.1 17,516
hire
Total 1,570 504
The full list of areas and businesses analysed include:
Transportation and automotive – Ridesharing (Uber), car sharing (entire Australian
industry) and P2P car sharing (Car Next Door and DriveMyCar)
Accommodation services – Airbnb and Divvy
Financial services – Crowdfunding (Kickstarter and Pozible) and P2P lending (entire
Australian industry)
Goods and redistribution – eBay, Gumtree and DesignCrowd
Services and labour hire – Airtasker and Hipages
For consistency, revenue generated figures were based on the estimated revenue
generated by the platform (eg. commissions on Uber) and suppliers (eg. income earned by
Uber drivers, Airbnb hosts, P2P banking lenders etc.). In most cases, this would involve the
listing price of goods (eg. selling price of eBay good) and services (fare paid by customers
for an Uber ride) on the collaborative economy platform.
The value added to the NSW economy was estimated based on the product between the
annual revenue generated and the industry value added ‘multiplier’. The multipliers for
each sector was based on estimates of industry value add as a share of revenue from
IBISWorld in comparable sectors namely: Taxi and Limousine, Hotels and Resorts, Finance,
Online Shopping and Plumbing Services11.
Additionally, we also estimated the number of people in NSW that have earned income
using collaborative economy platforms in the past year. Estimates of users earning income
in financial services were difficult as they were not directly comparable to other industries.
To estimate the number of users who earned income in collaborative economy businesses
in crowdfunding we used the average annual amount of projects in NSW as the number of
11
These multipliers are used as proxies to estimate value add in the collaborative economy, although
multipliers may be greater or smaller than for traditional businesses.
Deloitte Access Economics 14
Commercial-in-Confidenceindividuals that obtained funding and income for crowd funding services. This may under
represent (if multiple individuals receive funding for each project eg. an orchestra) or over
represent (if the same project owners engage in multiple projects) the figures.
For P2P lending we estimated the total number of NSW lenders based on 1,400 lenders on
the RateSetter platform nationally, which has loans on book of $8.5 million compared to
$25 million across all P2P lending platforms.
There were difficulties in estimating the total number of users who earned income for
goods and redistribution platforms such as eBay as they do not disclose their total number
of sellers12. As such, we used public information of at least 3,000 eBay sellers13. However,
this number is likely to be underestimated. This figure was adjusted to obtain an estimated
representation of the number of eBay sellers in NSW.
For estimating revenue in ‘goods and redistribution’ we used total online retail spending
numbers of $10.8b in 2015 and adjusted this by each business’ share in total site visits to
obtain a total business activity estimate14. The multiplier used in this calculation was based
on industry value added/revenue estimates for Online Shopping in Australia from IBISWorld
which predominantly refers to websites such as Coles Online and Woolworths Online. Their
business models may differ to goods and redistribution platforms in the collaborative
economy such as eBay and Gumtree, which will affect the final estimates.
As such, we present estimates of the value of five key NSW collaborative economy sectors
based on key businesses15. The five sectors, listed in table 1.1, contributed to a combined
value added of around $504 million in NSW with around 45,000 users who have earned
income on collaborative economy platforms in NSW. This compares with a total size of the
NSW economy of approximately $488 billion in 2013-1416.
12
The only public sources include a survey from AC Nielson in 2006 that suggests there were 1.3m eBay sellers
globally and 430,000 from the US. We know there are at least 3,000 Australian eBay sellers based on: an eBay
Media release (2012) that can be found at: http://media.ebay.com.au/ebay%E2%80%99s-top-australian-
businesses-reach-new-heights.
13
We know there are at least 3,000 Australian eBay sellers based on: an eBay Media release (2012) that can be
found at: http://media.ebay.com.au/ebay%E2%80%99s-top-australian-businesses-reach-new-heights
14
eMarketer (2015), Australian retail eCommerce sales to top $10 billion in 2015, available at:
http://www.emarketer.com/Article/Australian-Retail-Ecommerce-Sales-Top-10-Billion-2015/1011823
15
This is likely to be a conservative estimate of the collaborative economy, with the total value of the
collaborative economy in NSW being at least as large as the value added of these major players.
16
ABS (2015), Australian National Accounts: State Accounts, Cat. No 5222.0, 2013-14, November 2014.
Deloitte Access Economics 15
Commercial-in-Confidence2 Transportation and automotive
Australia is an attractive market for collaborative and sharing economy applications in the
transportation industry, due to the very high internet penetration in Australia for
broadband (70% of households), mobile phones (around 130% of consumers) and
smartphones (around 74% of all mobile users).
The three main applications currently available include:
Ridesharing, which is the sharing of rides to save costs;
Car sharing, which allows users to rent cars for short periods of time often by the hour;
and
Peer-to-peer car sharing, where private citizens can make their vehicles available for
others to rent for short periods of time and users are matched on a platform.
Key highlights:
As at May 2015, UberX contributed over 1 million rides and around $20m in income in
Sydney, which according to our calculations represents approximately 1.2% of all point-
to-point transport activity.
Pocketbook also claims that around $1 is spent on Uber services for every $12 on taxis 17
31.6% of all car sharing platforms were established in NSW
major players in this sector include:
• ridesharing platforms such as UberX (initially launched in Sydney);
• car sharing platforms such as GoGet (founded in Sydney), Hertz 24/7 (US
based), GreenShareCar (founded in Melbourne) and Flexicar (founded in
Melbourne); and
• P2P car sharing platforms such as DriveMyCar (Australian based) and Car Next
Door (founded in Sydney).
2.1 Ridesharing
Real time ridesharing platforms allow drivers and potential riders to be efficiently matched
based on their geographic location within minutes which has reduced the need for
Australians to rely on visiting taxi ranks and hailing on the street. Additionally, both riders
and drivers are required to assess each other through their ratings system, which
incentivises users to improve their quality of service and behaviour.
Australia currently has only one major ridesharing platform with the arrival of UberBlack
(premium option) in November 2012; UberTaxi in June 2013; and the low cost UberX
platform in April 2014, all of which were initially launched in the Sydney market. It is also
the most recognisable collaborative economy service with 27% of Australians aware of
Uber according to the 2014 Emerging Collaborative Economy report from Vision Critical.
17
Pocketbook (2014), The rise and rise of Uber in Australia, Available at: https://getpocketbook.com/blog/the-
rise-and-rise-of-uber-in-australia/
Deloitte Access Economics 16
Commercial-in-ConfidenceThere are several other carpooling and ridesharing platforms available in Australia including
Shareurride, Catchalift, Coseats and Hitch-A-Ride as well as taxi hailing apps such as
Ingogo. These carpooling and ridesharing apps however lack the same amount of users,
scale or low cost as the UberX platform. Scale is crucial in establishing the critical mass
needed to create a reliable and convenient platform, as well as increases the likelihood that
nearby riders and drivers is matched which can reduce average waiting times.
Since its launch, UberX has managed to complete over one million rides in Sydney within
one year18 with average arrival times of 4.1 minutes compared to 8.1 minutes for the taxi
industry19. With taxi plates in Sydney representing around 83% of total taxi plates in NSW20
and 97m of taxi rides annually in NSW21, UberX rides represent around 1.2% of Sydney’s
point-to-point transport market.
Considering that average UberX fare costs may be cheaper than average taxi fares of
$23.9722 (ATIA, 2014), UberX has generated around $20 million in economic activity in
Sydney over the past year for 3,000 Sydney drivers. Many of these drivers are based in
disadvantaged regions, with $4m of fares collected by drivers in the top 30 highest
unemployment postcodes including Lakemba, Bankstown and Auburn.
It is not clear whether low-cost real time ridesharing services such as UberX have taken
away market share from taxis in the point-to-point transport market. Total annual rides in
the taxi and limousine industry have remained stable and growing with 227 million rides
Australia wide in 2014 compared to 213 million rides in 2013 before the launch of UberX in
Australia23.
On the other hand, UberX has been effective in addressing demand and bringing business
for point-to-point transport services in underserviced areas in Sydney, with 64.4% of Uber
trips beginning or ending in a transport desert which is defined as being at least 800 metres
away from the nearest form of medium frequency public transport 24.
Lyft, which is another major international ridesharing platform, has expressed interest in
eventually launching in Australia which will provide additional competition against the Uber
platform.25
18
Uber (2015), “One Year, One Million Rides”, available at: https://newsroom.uber.com/sydney/2015/05/one-
year-one-million-rides-2/
19
IPART (2015), The Taxi Industry Model, created by the Centre for International Economics (CIE), July 2015
20
NSW Taxi Council (2014), See: https://www.nswtaxi.org.au/sites/default/files/NSW-Taxi-Council-Submission-
to-IPART-2014-Licence-and-Fare-Review.pdf
21
ATIA (2014), 2014 State and Territory Taxi Statistics
22
ibid
23
ATIA (2013), 2013 State and Territory Taxi Statistics
24
Uber (2015), “Connecting Sydney’s Villages”, available at:
https://newsroom.uber.com/sydney/2015/05/connecting-sydneys-villages/
25
Startup Smart (2015), “Australian launch in the offing for Lyft, according to executive from partner app
Moovit”, available at: http://www.startupsmart.com.au/growth/start-up-profiles/australian-launch-in-the-
offing-for-lyft-according-to-executive-from-partner-app-moovit/2015033114450.html
Deloitte Access Economics 17
Commercial-in-Confidence2.2 Car sharing
Car sharing is different from standard car rental services as it reduces commitment
significantly for users. Vehicles can be rented on an hourly rather than daily or weekly basis
and other operator costs such as fuel, vehicle maintenance and insurance are included in
the hourly cost instead of being charged on a lump sum basis. Car share spots are also
dispersed around cities instead of being in a central location for car rental services and
typically require to be returned to its original location or another car sharing spot at the
end of the booking.
According to IBISWorld26 (2014), the 15 current car sharing providers in Australia generated
$55.7m in annual revenue and have been growing annually at a rate of 26.8% over the past
five years. Around 70% of car sharing consumers are aged between 15 and 34 as they spend
the greatest amount of time online and are the quickest demographic to adopt new mobile
technologies and applications. NSW hosts the majority of car-sharing establishments
(31.6%) followed by Victoria (27.4%) and Queensland (21.5%).
Chart 2.1: Car sharing establishments by Australian state and territory, 2014-15
Source: IBISWorld (2014)
GoGet is the most established brand in the Australian car sharing market (representing
22.1%) and was launched in Sydney in 2003 with three vehicles and 12 founding members.
This has since grown to around 1,900 vehicles and 65,000 members in NSW, Victoria,
Queensland and South Australia in 2015. Other significant players include Hertz 24/7
(14.7% market share) and GreenShareCar (10.1%) and Flexicar.
26
IBIS World (2014), Car Sharing Providers in Australia
Deloitte Access Economics 18
Commercial-in-ConfidenceCar sharing growth forecasts are expected to remain strong at 22.9% annually over the next
five years, primarily driven by high petrol prices and vehicle upkeep, congested inner-city
traffic and increased innovation and use of mobile technology.
2.3 Peer-to-peer car sharing services
Increased mobile adoption and use of geo-location based services have also allowed
existing car owners to make their vehicles available to others for rent for short periods of
time through peer-to-peer car sharing networks.
DriveMyCar was the first peer-to-peer car sharing service launched in Australia in
December 2008. Since then, it now has over 400 registered vehicles nationwide, over
14,500 registered users, over 4,850 bookings and $4.4 million paid out to owners according
to its website statistics.
Car Next Door which was founded in Sydney in 2012 and is currently available in Sydney
and Melbourne, has 250 owned cars registered on their site used by 5,000 people and is
aiming to grow its platform to 10,000 cars and 180,000 users over the next couple of
years27. With currently around 1,500 monthly rentals and listed vehicle owners earning
around $250 per month, Car Next Door generates approximately $750,000 in annual
economic activity, with more than half being contributed by Sydney. If future projections of
10,000 cars and 180,000 users are accurate, economic activity could increase by 40 fold to
$30 million of annual economic activity.
27
Collaborative Consumption (2014), “Collaborative Pioneer Interview with Will Davies, Founder of Car Next
Door:, available at: http://www.collaborativeconsumption.com/2014/10/01/car-next-door/
Deloitte Access Economics 19
Commercial-in-Confidence3 Accommodation services
Underutilised accommodation, space and real estate are increasingly becoming shared
amongst Australians through property, parking and land listing platforms such as Airbnb,
ParkHound and Land Share. Additionally, accommodation platforms that involve mutually
beneficial but non-financial transactions such as Couchsurfing have remained popular in
expensive rental cities such as Sydney and Melbourne.
According to the Emerging Collaborative Economy in Australia report28, Airbnb (20%) and
Couchsurfing (15%) are two of the most recognisable collaborative economy services in
Australia.
Key highlights:
home sharing platforms such as Airbnb contributed approximately $284 million in
income last year nationwide and around $115 million from 16,000 rooms in NSW for
2014
although this representation is currently small compared to the total Hotel and Resorts
($6 billion) and Motels industry ($2.3 billion) in Australia29, Airbnb already advertises
over 40,000 rooms which is more than the largest traditional hotel operator in
Australia, Accor, which manages around 26,000 rooms
Sydney is the 10th largest Airbnb market worldwide
Airbnb allows tourists to see a different side of Sydney, with 80% of properties listed
outside of main hotel areas (such as the city centre) and 46% of daylight guest time is
spent in the suburb they stayed
major players in this sector include:
• home sharing platforms such as Airbnb (office built in Sydney) and
Couchsurfing (US based); and
• space sharing platforms such as ParkHound (founded in Melbourne) and Divvy
(founded in Sydney) for parking spaces, Fishburners (Sydney based) for office
space and Landshare (UK based) for areas to grow produce.
3.1 Home sharing platforms
3.1.1 Airbnb
Airbnb allows owners to list their properties for short term rental amongst its network of
users. Estimations by BIS Shrapnel30 between August 2012 and July 2013 found that
28
Collaborative Lab and Vision Critical (2014), “The Emerging Collaborative Economy in Australia”
29
IBISWorld (2014) , “2014-15 for Hotels and Resorts in Australia and Motels in Australia”
30
BIS Shrapnel (2013), Airbnb economic impact, See: http://blog.airbnb.com/economic-impact-airbnb/
Deloitte Access Economics 20
Commercial-in-ConfidenceAirbnb’s 2,205 local Australian hosts supported $214 million in economic activity (both
direct and indirect) and 1,642 jobs over that period.
According to Airbnb, its Australian platform currently has around 40,000 available listings
which have doubled over the past year. Around 60% of its listings are entire homes and
40% are private rooms. Listed property owners expect to earn around $7,100 per annum
(based on renting out 51 nights per year on average), contributing to approximately $284
million in income annually nationwide.
Sydney is Airbnb’s 10th largest market worldwide. Sydney currently has approximately
10,800 listings which have grown by 78% since last year. 5,400 listings are available in the
rest of NSW, including Sydney this combines to 16,200 NSW listings and around $115
million in annual revenue.
Unlike many other collaborative economy platforms where usage is higher amongst
younger age cohorts, the distribution of Airbnb usage amongst different age groups is more
varied with average guests being 42 years old. This could be due to barriers such as
potential hosts being limited to segments of the population that have excess capacity to
rent out their property and higher accommodation costs for potential Airbnb users
compared to low-cost and budget options such as hostels and motels.
Chart 3.1: Distribution of Airbnb hosts, by age in Sydney
Source: NSW Parliamentary Research Service (2015)
Deloitte Access Economics 21
Commercial-in-ConfidenceChart 3.2: Airbnb guests, by age in Sydney
Source: NSW Parliamentary Research Service (2015)
According to the NSW Parliamentary Research Service31 and calculations from BIS
Shrapnel32 , most of Airbnb’s users are international. Three quarters of Airbnb’s Sydney
guests are not from Australia with 41% and 21% coming from Europe and North America
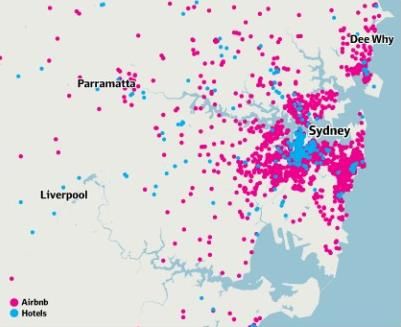
respectively. Additionally, 80% of Airbnb’s Sydney properties are located outside of main
hotel areas such as the Central Business District, Haymarket, Potts Point and Surry Hills,
where residents and businesses may not have traditionally experienced tourism benefits.
This allows visitors to see a different side of Sydney, with 46% of their daytime spent in the
suburb where they stayed.
31
NSW Parliamentary Research Service (2015), Uber and Airbnb: the legal and policy debate in NSW
32
BIS Shrapnel (2013), Airbnb economic impact, See: http://blog.airbnb.com/economic-impact-airbnb/
Deloitte Access Economics 22
Commercial-in-ConfidenceFigure 3.1: Airbnb listings compared with hotels in Sydney
Source: BIS Shrapnel (2013)
The feedback, ratings and review mechanism in Airbnb provides an incentive for hosts to
provide a quality service and improve the guest’s experience. 98% of hosts suggest nearby
local restaurants, cafes, bars and shops to their guests and average Airbnb guests spend
$751 more than average tourists per visit. 63% of Airbnb’s guests also say that Airbnb
increases their likelihood to return to Sydney in the future.
However, a current policy issue is that short-term accommodation providers are required to
comply with local council regulations which may not be straightforward and can often differ
significantly between councils. For example, the City of Sydney Council does not currently
permit visitor accommodation in residential areas; however long-term leases bypass the
need for council approval.
3.1.2 Couchsurfing
Couchsurfing is a global platform where hosts can offer temporary accommodation which
can range from a couch, airbed, private room or shared sleeping surface to guests at no
financial cost.
It is most popular amongst younger age cohorts with 44% of its users aged under 24.
Australia has the 9th largest Couchsurfing member base worldwide, with over 107,500
members, behind USA, Germany, France, England, Canada, Spain, Italy and Brazil.
Because of the reputational mechanism where hosts and guests are required to provide a
written positive or negative recommendation, guests typically offer services such as
cooking, cleaning, socialising, knowledge exchange (such as languages or other skills) and
insights to their local country which may be beneficial to the host. In return, hosts often
provide in depth local knowledge of their city which can provide a more enriching and
personal travel experience for travellers who do not have local networks in their
destination city, compared to attending travel tours and groups.
Deloitte Access Economics 23
Commercial-in-ConfidenceThe social aspect of Couchsurfing has been also extended to regular hosted events and
meet-up options which allows members to readily find a network of like-minded travellers
to participate with as well as locals who may be willing to give their time to provide a local
perspective of their city to a traveller.
3.2 Estate and space sharing
Digital technology has allowed excess and idle spaces such as parking spots and growing
land to be shared amongst users, reducing the need for individual ownership.
Launched in 2013, Parkhound is currently the largest Australian peer-to-peer platform that
allows residential property owners to lease their empty driveways or garages to drivers for
temporary periods in return for a fee (which is typically up to 60% lower than commercial
parking options). According to their co-founder Michael Nuciforo, there are currently over
3,000 available parking spaces and 10,000 members on the platform generating more than
60,000 weekly website hits33. Based on Parkhound projections, total parking spaces on the
platform are estimated to grow to 10,000 by 201634 and generate over $2m via in-site
bookings.
Other emerging parking space sharing platforms include Divvy which connects drivers to
unused private car spaces with listed parking spaces in the CBD earning between $2,000
and $3,500 per year. The platform currently has over 3,000 users and 1,000 listings with
150-200 booking made each month in Australia.
This concept also extends to other sharing spaces, such as land used to potentially grow
vegetables and produce. Landshare which was launched in the United Kingdom in 2009 has
since grown to a community of 57,000 growers, shares and helpers across the UK. The
concept connects growers who need land for cultivating food to individuals who have spare
land that they are prepared to share. There are currently 2,772 members using the
platform in Australia.
Collaborative workspaces such as Sydney based Fishburners, which is Australia’s largest
start-up co-working space, have also been growing since its launch in 2011. The Fishburners
office space now hosts 151 companies, 240 people and has around 500 visitors to its events
each week. Because of the co-sharing space concept and being a non-profit company,
Fishburners is able to keep costs low at around $400 per month per person which is
important for early start-ups before they move on to larger office spaces typically between
12-18 months. They have recently received $20,000 in funding from the NSW
Government35.
33
Jonathon Lobban, the Australian (2015) “The Borrowers: Rise of the sharing economy”, available at:
http://www.theaustralian.com.au/life/weekend-australian-magazine/the-borrowers-rise-of-the-sharing-
economy/story-fntiyzqf-1227313802611
34
Jacinda Tutty, Courier Mail (2015), “Homeowners rent out driveways and lawns to motorists desperate for
parking in CBD”, available at: http://www.couriermail.com.au/business/homeowners-rent-out-driveways-and-
lawns-to-motorists-desperate-for-parking-in-cbd/story-fnihsps3-1227375180534
35
Oliver Milman,Startup Smart (2011), “Fishburners gets $20k NSW Govt sponsorship boost”, available at:
http://www.startupsmart.com.au/financing-a-business/fishburners-gets-20k-sponsorship-
boost/201108233666.html
Deloitte Access Economics 24
Commercial-in-ConfidenceYou can also read