Public Report on the State-Owned Enterprises and Shares in 2015 - Riga 2016
←
→
Page content transcription
If your browser does not render page correctly, please read the page content below
Public Report on the State-Owned
      Enterprises and Shares
              in 2015

            Riga 2016
Public Report on the State-Owned
      Enterprises and Shares
              in 2015

    Cross-Sectoral Coordination Centre
                Riga 2016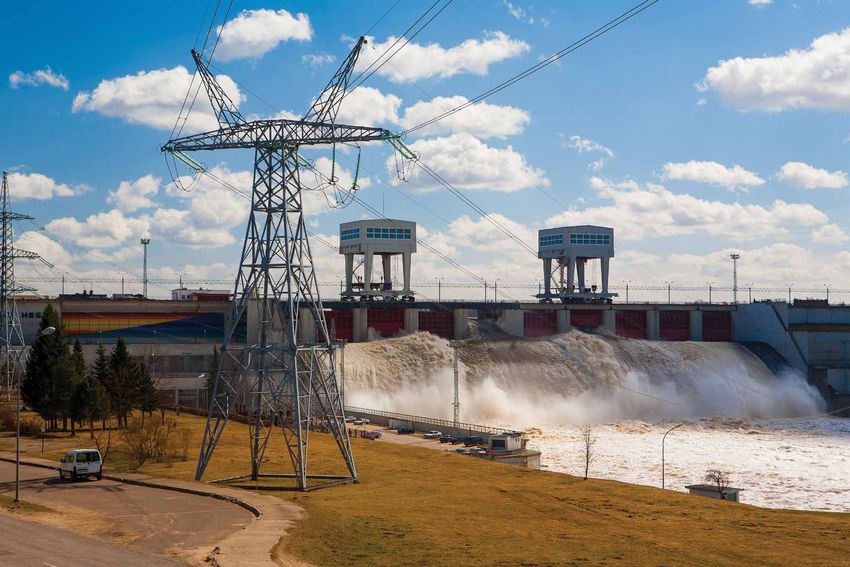
This is the latest annual report on the state-
                                                                     owned enterprises and shares prepared by
                                                                     the Cross-Sectoral Coordination Centre of the
                                                                     Republic of Latvia, and it provides information on
                                                                     the governance of state-owned enterprises and
                                                                     performance results in 2015.

    Dear cooperation partners and citizens,

     The year 2015 has been an important time of change in           members has been substantially changed and is now based on
the field of governance of state-owned enterprises. At the           previously defined experience and competence requirements;
beginning of the year, the new “Law on Governance of Capital         compulsory public call for application of candidates is ensured
Shares of a Public Person and Capital Companies” came into           and nomination committees are being developed, which
force, the drafting of which was based on the OECD Guidelines        include independent experts and observers, in order to select
on Corporate Governance of State-Owned Enterprises. In               the best professionals for the positions of supervisory council
accordance with the law, on May 2015, the Cabinet of Ministers       and management board members in state-owned enterprises
appointed the Cross-Sectoral Coordination Centre (CSCC) as the       through a professional and transparent selection process.
institution performing the tasks of an institution responsible for       State-owned enterprises have a major impact on State
coordination of governance of state-owned enterprises. During        development, employment and State budget revenues; that
the reporting period, the CSCC developed a legitimate legal          is why it is particularly important to ensure efficient use of
framework at the level of the Cabinet of Ministers, including for    the capital invested by the State, thus improving the rates of
such important issues as the dividend policy of state-owned          return and contributing to an increase in value of state-owned
enterprises, selection of supervisory council and management         enterprises. This report allows us to find out more about the
board members and evaluation of performance results of state-        progress in achieving these indicators and assess the efficiency
owned enterprises.                                                   of measures attempted while being open-minded and
     Alongside the introduction of the new law, both general         encouraging suggestions for the improvement of governance
accessibility to information about performance of state-owned        of state-owned enterprises and its coordination.
enterprises and government’s awareness of strategic issues of            Finally, I would like to say thank you for jointly achieved results
state-owned enterprises have improved, thereby contributing          and wish a smart and professional public asset management!
to more balanced and valid decisions on the development of
state-owned enterprises, incl., by taking into account a detailed
analysis by a coordination institution and an evaluation that
is independent of shareholders. The practice of selecting and        Pēteris Vilks
appointing the management board and supervisory council              Head of the Cross-Sectoral Coordination Centre

2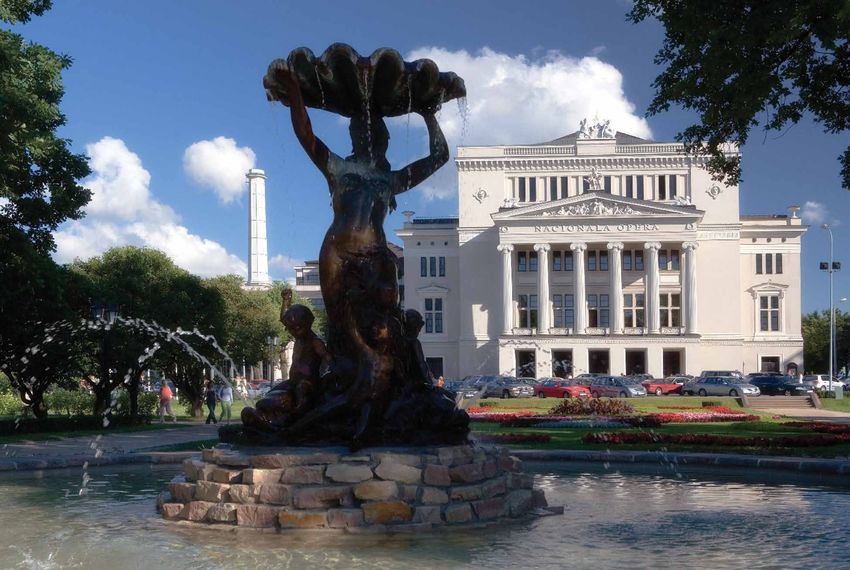
Table of contents
Introduction...................................................................................................................................................................................................................................................................................6
Financial summary about the financial indicators of use of State capital................................................................................................................................................8
Methodology used in the report....................................................................................................................................................................................................................................13

Overview of the sectors
                Energy............................................................................................................................................................................................................................................................................14
                Forestry and agriculture.....................................................................................................................................................................................................................................21
                Transport and logistics.......................................................................................................................................................................................................................................25
                Communications....................................................................................................................................................................................................................................................35
                Real estate...................................................................................................................................................................................................................................................................40
                Health care..................................................................................................................................................................................................................................................................45
                Culture...........................................................................................................................................................................................................................................................................53

Other sectors
                Certification, conformity assessment and metrology.....................................................................................................................................................................56
                Financial services....................................................................................................................................................................................................................................................57
                Public electronic mass media.........................................................................................................................................................................................................................59
                Education and sports...........................................................................................................................................................................................................................................62
                Other state-owned enterprises.....................................................................................................................................................................................................................64

Planned development of governance of state-owned enterprises in 2016........................................................................................................................................69

Annex
                SOEs, State-owned equity shares, equity shares belonging to the SOEs and enterprises effectively controlled by the State.........70

                                                                                                                                                                                                                                                                                                 3
List of tables

Table 1. Aggregate financial indicators characterising the operation of SOEs and capital companies with
state-owned equity shares...................................................................................................................................................................................................................................................8
Table 2. Performance indicators of SOEs of energy sector..........................................................................................................................................................................17
Table 3. Financial indicators of SOEs in the energy sector.............................................................................................................................................................................17
Table 4. Main financial indicators of the JSC Latvenergo Group.........................................................................................................................................................................18
Table 5. Main financial indicators of JSC Augstsprieguma tīkls............................................................................................................................................................................19
Table 6. Main financial indicators of JSC RĪGAS SILTUMS......................................................................................................................................................................................20
Table 7. Performance indicators of SOEs in the forestry sector........................................................................................................................................................................22
Table 8. Performance indicators of SOEs in the agricultural sector...............................................................................................................................................................23
Table 9. Financial indicators of the forestry sector....................................................................................................................................................................................................23
Table 10. Financial indicators of the agricultural sector........................................................................................................................................................................................23
Table 11. Financial indicators of JSC Latvijas Valsts meži......................................................................................................................................................................................24
Table 12. Performance indicators of SOEs in the transport and logistics sector..................................................................................................................................27
Table 13. Financial indicators of the transport and logistics sector..............................................................................................................................................................28
Table 14. Financial indicators of the SJSC Latvijas dzelzceļš group...............................................................................................................................................................29
Table 15. Financial indicators of JSC Pasažieru Vilciens..........................................................................................................................................................................................30
Table 16. Financial indicators of SJSC Latvijas autoceļu uzturētājs................................................................................................................................................................30
Table 17. Financial indicators of SJSC Ceļu satiksmes drošības direkcija.....................................................................................................................................................31
Table 18. Financial indicators of SJSC Starptautiskā lidosta “Rīga”..................................................................................................................................................................32
Table 19. Financial indicators of SJSC Latvijas gaisa satiksme...........................................................................................................................................................................33
Table 20. Financial indicators of JSC Air Baltic Corporation................................................................................................................................................................................34
Table 21. Performance indicators of SOEs in the communications sector...............................................................................................................................................36
Table 22. Financial indicators of the communications sector...........................................................................................................................................................................37
Table 23. Financial indicators of SJSC Latvijas Pasts.................................................................................................................................................................................................37
Table 24. Financial indicators of the LLC Lattelecom group..............................................................................................................................................................................38
Table 25. Financial indicators of the LLC Latvijas Mobilais Telefons group..............................................................................................................................................39
Table 26. Performance indicators of SOEs in the real estate sector...............................................................................................................................................................42
Table 27. Financial indicators of the real estate sector............................................................................................................................................................................................43
Table 28. Financial indicators of SJSC Valsts nekustamie īpašumi..................................................................................................................................................................4 4
Table 29. Performance indicators of SOEs in the health care sector.............................................................................................................................................................47
Table 30. Summary of performance indicators of SOEs in the health care sector..............................................................................................................................48
Table 31. Financial indicators of the health care sector.........................................................................................................................................................................................49
Table 32. Financial indicators of SLLC Paula Stradiņa Klīniskā universitātes slimnīca........................................................................................................................50
Table 33. Financial indicators of SLLC Rīgas Austrumu klīniskā universitātes slimnīca.....................................................................................................................51
Table 34. Financial indicators of SLLC Bērnu klīniskā universitātes slimnīca...........................................................................................................................................52
Table 35. Financial indicators of SLLC Rīgas Psihiatrijas un narkoloģijas centrs......................................................................................................................................52
Table 36. Performance indicators of SOEs in the cultural sector....................................................................................................................................................................54
Table 37. Financial indicators of the cultural sector..................................................................................................................................................................................................55
Table 38. Financial indicators of SLLC Latvijas Nacionālā opera un balets...............................................................................................................................................55

4

Table 39. Performance indicators of SOEs in the field of certification, conformity assessment and metrology...........................................................56
Table 40. Financial indicators of the field of certification, conformity assessment and metrology........................................................................................57
Table 41. Performance indicators of SOEs in the financial service sector.................................................................................................................................................57
Table 42. Financial indicators of the financial services sector...........................................................................................................................................................................58
Table 43. Performance indicators of SOEs in the public electronic mass media sector..................................................................................................................59
Table 44. Financial indicators of the public electronic mass media sector.............................................................................................................................................59
Table 45. Financial indicators of SLLC Latvijas Televīzija.......................................................................................................................................................................................60
Table 46. Financial indicators of SLLC Latvijas Radio...............................................................................................................................................................................................61
Table 47. Performance indicators of SOEs in the education sector...............................................................................................................................................................63
Table 48. Financial indicators of the education sector...........................................................................................................................................................................................63
Table 49. Performance indicators of SOEs in the sports sector........................................................................................................................................................................64
Table 50. Financial indicators of the sports sector....................................................................................................................................................................................................64
Table 51. Other State-owned equity shares and SOEs...........................................................................................................................................................................................65
Table 52. Financial indicators of SOEs of other sectors..........................................................................................................................................................................................65
Table 53. Financial indicators of SJSC Latvijas Loto..................................................................................................................................................................................................66
Table 54. Financial indicators of SJSC Privatizācijas aģentūra...........................................................................................................................................................................66
Table 55. State-owned equity shares held by SJSC Privatizācijas aģentūra............................................................................................................................................67
Table 56. Ownership of companies by SJSC Privatizācijas aģentūra............................................................................................................................................................67
Table 57. Financial indicators of SLLC Latvijas Vides, ģeoloģijas un meteoroloģijas centrs..........................................................................................................68

Figures
Figure 1. Main financial indicators characterising the operation of SOEs...................................................................................................................................................8
Figure 2. Total assets of SOEs by sector in 2015.............................................................................................................................................................................................................9
Figure 3. Equity capital of SOEs by sector in 2015........................................................................................................................................................................................................9
Figure 4. Net turnover of SOEs by sector, million EUR..............................................................................................................................................................................................9
Figure 5. Number of employees in SOEs by sector, average per year..........................................................................................................................................................10
Figure 6. Average gross remuneration paid per employee per year, thousand EUR........................................................................................................................10
Figure 7. Dividends paid by SOEs for the previous year, million EUR............................................................................................................................................................11
Figure 8. Instalments made by the SOEs in the budget, million EUR...........................................................................................................................................................11
Figure 9. Budget funding received by SOEs, million EUR.....................................................................................................................................................................................11
Figure 10. Donations made by SOEs by sector, thousand EUR........................................................................................................................................................................12
Figure 11. Donations received by SOEs by sector, thousand EUR..................................................................................................................................................................12

                                                                                                                                                                                                                                                           5
Introduction
     The annual public report (hereinafter – the annual report) has         of eight ministries and representatives delegated by the Free Trade
been drafted by the Cross-Sectoral Coordination Centre (hereinafter         Union of Latvia, the Latvian Association of Local Governments and
– the CSCC) pursuant to Paragraph 5 of Part 2, Section 22 of the Law        the Employers’ Confederation of Latvia. The Coordination Institution
on Governance of Shares and Enterprises owned by Public Entities.           Council began active work in early 2016 when a number of draft
Starting from 1 June 2015, pursuant to Order of the Cabinet of Ministers    guidelines produced by the CSCC were examined at its meetings.
No. 273 “On Institution Coordinating the Governance of State-                    One of the key tasks of SOEs governance in 2015 was to draft all
Owned Enterprises and Shares” of 26 May 2015, the CSCC is providing         regulations of the Cabinet of Ministers for which respective delegation
coordination and supervision of corporate governance of state-              is provided in the Law On Governance of Shares and Enterprises
owned enterprises and state-owned shares. For this purpose, the             owned by Public Entities.
Corporate Governance Division was created at the CSCC, providing                 The following regulations of the Cabinet of Ministers were drafted
uniform coordination and supervision of state-owned enterprises and         and approved in 2015:
shares, common direction of the state-owned enterprises and shares               • Cabinet Regulation No.518 “Regulation of the Council of the
reform, and fulfils the tasks laid down in the “Law On Governance of        Institution Coordinating Corporate Governance of State-Owned
Capital Shares of a Public Person and Capital Companies, including:         Enterprises and Shares” of 8 September 2015” that stipulates the
     develops the guidelines and Cabinet Regulations                        composition of the Coordination Institution Council and the decision
concerning the practice of corporate governance of state-owned              making procedure;
enterprises (SOEs);                                                              • Cabinet Regulation No.680 “Procedure for Making Deductions
     • evaluates the draft operational strategies and annual                to the Privatisation Agency for the Privatisation of Public Property,
reports submitted by SOEs and subordinate institutions (agencies            Disposal of State-Owned Shares and other Activities Laid Down in
and public institutions) for their enforcement, and provides opinions       Laws and Regulations, as well as for Establishing and Using a Reserve
thereof;                                                                    Fund and Making Payments to the State Budget”. This regulation
     • provides opinion on the grounds for state participation              replaces the previous regulations, which ceased to apply, because the
 in a SOE – its preservation, termination or initiation;                    regulatory act on the grounds of which it was issued, expired. The
     • consults the Prime Minister, the Cabinet of Ministers,               new regulation includes a number of amendments as compared
holders of state-owned shares (ministries) and the management of            with the previous legislation, the most important being the changes
enterprises and responsible personnel, as well as organizes training        to the amount of deductions to the Privatisation Agency from the
on issues relating to SOE governance;                                       privatisation and leasing of public property;
     • produces an annual consolidated report on SOEs and                        • Cabinet Regulation No.686 “Procedure for Nomination of
shares;                                                                     Candidates for Posts of Management Board Members in Capital
     • ensures regular exchange of information with the                     Companies where the State as a Participant (Shareholder) has the
Working Party on State-Owned Enterprises and Privatization                  Right to Nominate Board and Supervisory Council Members and
Practices of the Organization for Economic Co-operation and                 Board Members in SOEs with a Supervisory Council” of 1 December
Development (OECD) and contributes to the implementation of                 2015. This regulation was in part based on the previously adopted
the OECD guidelines for SOE governance, as well as the compliance           Cabinet Instruction No. 6 “Procedure for Selection of Candidates
of the Latvian SOEs with the best corporate governance practices            for Posts of Management Board and Supervisory Council Members
recognized by developed countries.                                          in enterprises where the State as a Shareholder (Stockholder) has
     Pursuant to Cabinet Regulation No.518 “Regulation of the Council       the Right to Nominate Management Board or Supervisory Council
of the Institution Coordinating Corporate Governance of State-Owned         Members” of 23 September 2014. The regulation was drafted
Enterprises and Shares” of 8 September 2015, the Cabinet of Ministers       in line with the OECD recommendations on the openness of
has established the Council of Institution Coordinating Governance of       the nomination process and professionally managed process to
State-Owned Shares and Enterprises (hereinafter – the Coordination          ensure that professional managers are appointed to the posts of
Institution Council). The Coordination Institution Council is a collegial   management board and supervisory council members who are
institution that examines and, prior to approval, harmonises the draft      capable of successful managing and developing an undertaking by
guidelines developed by the Coordination Institution in the field of        bringing the required value added. The main novelties in the process
governance of capital shares of a public person and, in cases required      of nomination of management board and supervisory council
by law, examines the opinion of the Coordination Institution if the         members are clearly defined basic requirements for candidates,
holder of state-owned shares or a SOE Board (if any) disagrees with         such as language proficiency, education and work experience,
it or has requested that the matter be raised at the Coordination           compulsory public application procedure, a number of additional
Institution Council. The Coordination Institution Council is entitled       criteria for independent supervisory council members, candidates’
to make proposals to the Coordination Institution also regarding            confidentiality rules (prohibition to disclose or transfer to third parties
other issues relating to governance of shares owned by a public             information about candidates), clear requirements (for example, the
person. The Coordination Institution is composed of representatives         experience in managing limited liability companies, recruitment or

6
in the sector where a capital company operates) for the composition           fulfilment of non-financial objectives.
of the Nomination Commission, the regulation for making the                         The following four guidelines were drafted in the area of
information about the nomination process public and open.                     governance of capital companies in 2015 and approved in 2016, the
      • Cabinet Regulation No.791 “Regulations on the Number                  drafting of which is delegated in the Law on Governance of Capital
of Management Board and Supervisory Council Members in                        Shares of a Public Person and Capital Companies:
Capital Companies of a Public Person and Public Private Capital                     • The Guidelines for Setting General Strategic Goals for
Companies in Accordance with Indicators Characterising the Size of            ownership of the State in a Capital Company;
a Capital Company, Maximum Amount of Monthly Remuneration                           • The Guidelines for Drafting Medium-Term Operational
of Management Board and Supervisory Council Members”. This                    Strategies of State-Owned Enterprises;
regulation replaces the previous regulation of the Cabinet of                       • The Guidelines for Publishing the Information for
Ministers while making substantial changes regarding the groups of            State-Owned Enterprises and Shareholders;
capital companies’ size and maximum amount of remuneration for                      • The Guidelines for Assessment of Performance Results in
management board and supervisory council members depending                    Capital Companies where the State Exerts an effective control.
on the size of a capital company. Also the main principles have                     In the autumn of 2015, the CSCC organized training for responsible
been established for determining specific amount of remuneration              officials of line ministries and SOEs’ board members. Nine training
in a specific capital company, namely, the resources, which are at            seminars were organised, including on the drafting of operational
the disposal of a capital company for remuneration, the proportion            strategies of capital companies, on corporate governance and
of capital company’s own revenues and the proportion of public                enforcement of the Law On Governance of Shares and Enterprises
financial resources, as well as a number of other additional criteria         owned by Public Entities. The training seminars were attended by 115
need to be evaluated;                                                         participants who gave a positive overall assessment of the training
      • Cabinet Regulation No.806 “Procedure for State-Owned                  opportunities provided and submitted their recommendations for
Enterprises and Public Private Capital Companies where the State is           organising further training.
a Shareholder (Stockholder) to Anticipate and Determine the Share of                In the autumn of 2015 and spring of 2016, the CSCC worked actively
Profit to be Paid in Dividends and Make Payments in the State Budget          on the process of negotiations on Latvia’s accession to the OECD, by
for the Use of Public Capital” of 22 December 2015. This regulation           considering the recommendations made in the OECD’s report on
that replaces the previous regulation provides an essentially new             the governance of SOEs of Latvia. The key OECD recommendations
approach to determining a share of profit to be paid in dividends,            were attributable to establishing professional supervisory councils
by linking it with the medium-term operational strategy of a capital          and drafting of annual reports of large SOEs in line with international
company and the investment and development plans laid down                    financial reporting standards, practical implementation of the Law
therein, as well as by anticipating that if a share (as a percentage) of      On Governance of Shares and Enterprises owned by Public Entities,
profit to be paid in dividends that is anticipated for respective time        particularly in respect of development of medium-term operational
period in a draft strategy differs from that fixed in laws and regulations,   strategies of capital companies, financial and non-financial target
then the shareholder submits a respective proposal to the Cabinet of          setting, clear definition of the ownership policy criteria and
Ministers. If the Cabinet of Ministers, when examining this proposal          strengthening the capacity of the Coordination Institution. The CSCC’s
and the CSCC’s opinion, makes a decision to allow to determine a              representatives ensured active cooperation with responsible officials
distinctive share (as a percentage) of profit to be paid in dividends,        of line ministries and the OECD Secretariat in order to ensure the
then the shareholder approves the strategy and dividends are paid             implementation of recommendations of the OECD report in Latvia,
in the state budget in line with the strategy rather than with laws and       as well as attended the meetings of the OECD Corporate Governance
regulations.                                                                  Committee and the Working Party on State-Owned Enterprises and
      Cabinet Regulation No.95 “Procedure for Assessment of                   Privatisation Practices to inform about Latvia’s accomplishments
Performance Results and Financial Indicators for a Capital Company            regarding the implementation of recommendations and its stance on
where the State Exerts an Effective Control” of 9 February 2016               ways to implement the recommendations. In April 2016, the technical
was drafted in 2015 and approved in 2016. This regulation provides            negotiations on the accession were concluded in the Corporate
a procedure for assessment of performance results of a capital                Governance Committee and the Working Party on State-Owned
company by establishing that the initial assessment and information           Enterprises and Privatisation Practices and the assessment procedure
on performance results is provided by the board of a capital company;         was completed on SOE governance, leading to a favourable
they are examined by a line ministry (as regards the implementation           opinion of the Corporate Governance Committee regarding Latvia’s
of sectoral policy objectives) and a shareholder that submits the             compliance with the OECD Guidelines on Corporate Governance of
initial assessment of the board and a shareholder to the Coordination         State-Owned Enterprises, while providing for the implementation of a
Institution. The Coordination Institution presents its assessment             number of recommendations after Latvia’s accession to the OECD, on
regarding the fulfilment of financial objectives of a capital company,        which Latvia will need to inform the Working Party on State-Owned
by considering it in context with other financial indicators and              Enterprises and Privatisation Practices in April 2017.

                                                                                                                                                    7
Financial summary of the financial indicators
of use of state-owned assets
    The State is a significant owner of assets in Latvia. The analysed      communications. A number of SOEs that ensure rendering of
enterprises are operating in many areas. In this annual report the          important public services operate in the fields of health care and
SOEs have been grouped into eight sectors: energy, forestry and             culture.
agriculture, transport and logistics, communications, real estate,
                                                                            Figure 1. Main financial indicators characterising the operation of
health care, culture and other sectors. SOEs of other sectors have
                                                                            SOEs
been grouped into five sub-sectors: certification, conformity
assessment and metrology, financial services, public electronic
                                                                                                  year 2014     year 2015
media, education and sports, other SOEs. These groups have been
used to analyse trends in the sectors and activities of the SOEs
subject to the specific characteristics of the sector.                      Turnover

    Table 1. Aggregate financial indicators characterising the operation
    of SOEs and capital companies with state-owned equity shares            Profit/loss
    Financial indicators, EUR ‘000 000
    Indicators                                       2014          2015
                                                                            EBITDA
    Turnover                                       3 566.2       3 404.5
    Profit/loss                                        17.4       164.4
    EBITDA                                            531.7       673.2     EBIT

    EBIT                                              98.4         217.3
    Total assets                                   11 082.4      8 170.3    Total assets
    Share capital                                  3 898.5       3 905.5
    Equity                                          3 805.9      3 809.8
                                                                            Equity
    Factors
    Profit and turnover ratio, %                        0.5          4.8
    EBITDA and turnover ratio, %                       14.9         19.8
    Return on assets, ROA, %                            0.2          2.0                        Million, EUR
    Return on equity, ROE, %                            0.5          4.3
    Total liquidity indicator                           4.6          2.8    Total amount of assets of SOEs
    Liabilities-to-equity ratio                         1.9          1.1
    Other indicators                                                             The total balance sheet value of SOEs decreased in 2015
    Number of employees on average per year         54 135       52 239     by 2.9 billion euros or 26.3%, and in 2015 it was almost 8.2
    Gross remuneration average per employee1,                               billion euros. This figure only includes the assets listed on the
                                                       13.2         13.3
    in thousands of euros                                                   balance sheets of SOEs, and it does not include, for example,
    Investment in fixed assets                       674.7         676.5    forests (the owner of Latvia’s forests is the State as represented
    Dividends paid into the national budget                                 by the Ministry of Agriculture. The value of state forests is not
                                                      110.9        127.0
    from the profits of the previous year                                   reflected in the assets of JSC Latvijas Valsts meži), real estate and
    All payments in the budget (including,                                  roads. The energy sector has the highest proportion (46.4%)
                                                     802.3         815.2
    dividends, taxes, duty)                                                 in the assets of SOEs. Transport and logistics ranks next in
    Funding received directly or indirectly from                            the amount of assets in the SOEs balance sheet − 18.7%; the
    the national budget (subsidies, payment for      565.6        558.0     following are the communications and real estate governance
    services and other financial recourses)                                 sectors with 9.5% and 9.1%. A considerable decrease in SOEs
                                                                            total assets is associated with the selling of JSC Citadele Banka
Role of SOEs in the national economy of Latvia                              in the first half of 20151. Assets of JSC Citadele Banka at the
                                                                            end of 2014 added up 2.9 billion Euros. Taking into account
    In terms of turnover, balance sheet total and indicators of the         the exclusion of JSC Citadele Banka assets from the 2015
number of employees, the key sectors where SOEs are operating               assets, the assets of the rest of undertakings in 2015 decreased
are energy, forestry and agriculture, transport and logistics and           by 57.5 million Euros or by 0.7%.
                                                                                 In terms of value of assets, the four largest SOEs on 31
                                                                            December 2015 were JSC Latvenergo Group (3.5 billion euros),
1
  Average remuneration is calculated by weighted awerage method. Average    SJSC Latvijas Dzelzceļš (1 billion euros), SJSC Valsts nekustamie
remuneration =Σall sectors Average remuneration in the sector x number of
employees in the sector /Σall sectors number of employees
                                                                            īpašumi (409.5 million euros) and JSC Attīstības finanšu institūcija
2
  Source: Annual Report of JSC “Privatizācijas aģentūra” of 2015, p.6.      Altum (404 million euros).

8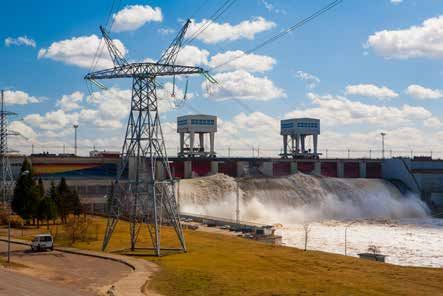
Figure 2. Total assets of SOEs by sector in 2015                      Total turnover of SOEs

                                                                          The total turnover of SOEs fell by 4.5% (from 3 566.2
                                                                      million euros in 2014 to 3 404.5 million euros in 2015). In terms
                                                                      of turnover, the largest sectors are energy and transport and
                                                                      logistics - both make almost two thirds of the total turnover of
                                                                      SOEs (64%). In the transport sector, about 73.1% of turnover is
                                                                      formed by SJSC Latvijas dzelzceļš and JSC Air Baltic Corporation
                                                                      with 420.2 million euros and 284.6 million euros respectively.
                                                                      JSC Latvenergo Group with 929.1 million euros was the largest
                                                                      SOE in terms of turnover in 2015 and made up 27.3% of the total
                                                                      turnover of SOEs.

                                                                      Figure 4. Net turnover of SOEs by sector, million EUR

  Energy Forestry and agriculture Transport and logistics
  Communications Real estate Health care Culture
  Other SOEs

Total equity capital of SOEs
                                                                      Net turnover, million EUR

     The total value of the equity capital of SOEs increased in
2015 by 3.9 million euros or by 0.1%, and on 31 December 2015
it amounted to 3.8 billion euros. JSC Latvenergo Group was the
largest SOE by the equity balance sheet value - it was 2.1 billion
euros or 55% of the total equity capital of SOE. The energy sector
forms 58.4% of the total equity capital of SOEs. In terms of equity
capital, the second and third largest SOEs are SJSC Latvijas
dzelzceļš and JSC Latvijas Valsts meži with a proportion of 356.7                                      year 2014                   year 2015
million euros or 9.4% and 329.6 million euros or 8.7% respectively
in the total equity capital of SOEs.                                                              Energy Forestry and agriculture Transport and logistics
                                                                                                  Communications Real estate Health care Culture
Figure 3. Equity capital of SOEs by sector in 2015                                                Other SOEs

                                                                      Total EBITDA and EBIT

                                                                           In 2015, the total EBITDA of SOEs was 673 million euros and the
                                                                      total EBITDA/turnover ratio was 19.8%.
                                                                           In 2015, the greatest contributions to total EBITDA were made
                                                                      by JSC Latvenergo Group (45.6%), JSC Latvijas Valsts meži (14.8%),
                                                                      SJSC Latvijas dzelzceļš Group (11%), LLC Lattelecom Group (10.6%)
                                                                      and LLC Latvijas Mobilais Telefons (8.7%).
                                                                           The greatest contributions to total EBIT in 2015 were from JSC
                                                                      Latvenergo Group (49.8%), JSC Latvijas Valsts meži (32.9%), LLC
                                                                      Lattelecom Group (16.8%), LLC Latvijas Mobilais Telefons (11.7%)
                                                                      and SJSC Latvijas Loto (3.3%).
                                                                           Among the sectors, in 2015, the largest contributions to total
  Energy Forestry and agriculture Transport and logistics
                                                                      EBITDA were from energy (48.2%) and communications (21.2%),
  Communications Real estate Health care Culture
  Other SOEs                                                          and the largest contributions to total EBIT were from energy
                                                                      (51.1%), forestry (32.9%) and communications (30.5%).

                                                                                                                                                            9
SOEs return on equity Figure 5. Number of employees in SOEs by sector, average per year
The total return on equity (ROE) of SOEs in 2015 was 4.3%. Just Average number of employees in 2014
as in 2014, the forestry and agriculture as well as communications
sectors had the highest ROE values. The lowest ROE values with
negative return were for health care and culture. The existing SOEs
of those sectors receive a significant national budget financing for
public service rendering.
The best ROE indicators among the ten largest companies
by turnover were for JSC Latvijas Valsts meži (18.0%, change
Average number of employees in 2015
comparing to 2014 -4.2%), LLC Latvijas Mobilais telefons (16.8%,
change +14.4%) and LLC Lattelecom (12.26%, change +0.71%). In
2014, the best indicators were for JSC Latvijas Valsts meži (22.2%),
JSC RĪGAS SILTUMS (17.0%) and LLC Lattelecom (11.55%).
The highest return on equity indicator (ROE) in 2015 was
in SJSC Latvijas Loto − 58.4%. It was followed by LLC Veselības
aprūpes nekustamie īpašumi (51.7%), SLLC Kremerata Baltica1
(51.1%), LLC Biroju centrs Ezerparks (20.0%), SJSC Latvijas Pasts
(19.4%) and JSC Latvijas Valsts meži (18.0%)
Energy Forestry and agriculture Transport and logistics
Communications Real estate Health care Culture
Number of employees and average remuneration Other SOEs
In 2015, around 52.2 thousand people worked in SOEs or 5.4%
Weighted average gross payment per employee has increased
of all persons employed in Latvia1. In comparison with 2014, it is
by 0.8% − from 13.2 thousand euros in 2014 to 13.3 thousand
by 1.9 thousand or by 3.5% less than before. The largest number
euros in 2015. The highest average remuneration is in the energy,
of employees is in the transport sector (18 293 people), health care
forestry and agriculture sectors.
(13 601 people) and communications (7 401 people) sectors.
According to the data, the largest SOEs − employers − SJSC Figure 6. Gross remuneration on average per one employee per
Latvijas dzelzceļš, which employs 12 260 people, LLC Rīgas year, thousand EUR
Austrumu klīniskā universitātes slimnīca with 4 543 employees,
SJSC Latvijas Pasts with 4 236 people, and 4 162 people are year 2014 year 2015
working in JSC Latvenergo Group.
Energy
Forestry and agriculture
Transport and logistics
Communications
Real estate
Health care
Culture
Other SOEs
All SOEs
3
On 31 December 2015, SLLC Kremerata Baltica equity was 610 euros
4
According to the data of the Central Statistics Bureau, the number of
economically active residents in 2014 and 2015 was 965.8 and 965.2 thousands
respectively (source: www.csb.gov.lv). Gross remuneration, thousand EUR
10The highest average remuneration in 2015 was in JSC Reverta Figure 8. Instalments made by SOEs in the budget, million EUR
group −40 296 euros. It is followed by SJSC Elektroniskie sakari −
31 531 euros, SJSC Latvijas gaisa satiksme −31 522 euros and JSC
Instalments in the budget, million EUR
Air Baltic Corporation − 30 503 euros per year.
Dividends
In 2015, 127 million euros was paid out to the State in dividends
that is by 16.1 million or by 14.5% more than in 2014. The largest
dividends were paid by forestry and agriculture, energy and
communications sector SOEs.
Figure 7. Dividends paid by SOEs for the previous year, million
EUR
year 2014 year 2015
Energy Forestry and agriculture Transport and logistics
Communications Real estate Health care Culture
Other SOEs
Dividends, million EUR
Budget funding received by SOEs6
The funding received by SOEs in 2015 amounted to 558 million
euros. Most of the funding was provided to health care, transport
and storage sectors.
Figure 9. Budget funding received by SOEs, million EUR
year 2014 year 2015
Energy Forestry and agriculture Transport and logistics
Communications Real estate Health care Culture
Other SOEs
Budget funding received, million EUR
Instalments made by SOEs in the state budget5
In 2015, instalments made by SOEs in the budget amounted
to 815.2 million euros. The largest instalments in the budget
were made by the transport and logistics, energy, forestry and
agriculture sectors.
year 2014 year 2015
Energy Forestry and agriculture Transport and logistics
Communications Real estate Health care Culture
Other SOEs
5
Taxes, duties and dividends
6
Budget allocation and other direct or indirect state budget funding (e.g. on
contractual basis, co-funding of the European Union funds, targeted aid to
restrict increase in compulsory procurement component)
11Donations made by SOEs Gender representation in boards and councils of
SOEs
Figure 10. Donations made by SOEs by sector, thousand EUR
According to shareholder data, in 2015, SOEs boards and
Energy councils had 161 member − 114 or 71% of them were men and 47
or 29% were women.
Transport and logistics
Forestry
Agriculture
Communications
Real estate
Health care
Culture
Other SOEs
Donations made, thousand EUR
In 2015, the donations made by SOEs amounted to 5.3 million
euros, and the largest donors were the SOEs of the forestry and
communications sectors.
Donations received by SOEs
Figure 11. Donations received by SOEs by sector, thousand EUR
Energy
Transport and logistics
Forestry
Agriculture
Communications
Real estate
Health care
Culture
Other SOEs
Donations received, thousand EUR
In 2015, SOEs received donations in the amount of 869.8
thousand euros. The donations were received by SOEs of two
sectors − health care and culture.
12Methodology used in the report
The report lists and analyses all of the direct state-owned conformity with the IFRS; however there are some disparities
shares in the SOEs and most of the indirect state-owned shares that could also affect the assessment of assets and liabilities. The
in the enterprises in order to promote efficient State asset Latvian legislation is not so strict with respect to the disclosure of
governance. To ensure continuity, the annual report and analysis financial information.
are prepared on an annual basis, as well as the measures are taken Since the consolidated financial reports (in terms of the IFRS)
to improve compliance of SOEs performance indicators with SOEs were not available for all SOEs, then, in some cases, summarised
form of operation, including in the fields of finance and corporate financial data have been used. Mutual transactions between the
governance. This report analyses and compares the financial data enterprises were not excluded from the calculations because the
of SOEs from 2014 to 2015. Essential information and indicators are justification required for that is not available in the financial report.
also given about the SOEs related sectors. The report does not The enterprises may have different accounting principles, for
analyse non-financial indicators of companies. example, fixed assets have been counted both by the acquisition
price and the results of re-evaluation, investment in property
Analysis of SOEs − both by the purchase price and the true value. Other major
disparities may arise due to accounting of loss in relation to the
The Annex to the annual report ‘’SOEs, State-Owned Equity loss of value of long-term assets, saving policy, classification and
Shares, Equity Shares belonging to the SOEs and enterprises accounting of employee benefits.
Effectively Controlled by the State’’ includes various enterprises
− SOEs, their dependent companies, Public-Private SOEs, state-
owned subsidiaries and SOEs effectively controlled by the State, as
well as private SOEs where the State has no controlling power, but
more information in the report is provided about the SOEs or the
enterprises effectively controlled by the State and economically
(JSC RĪGAS SILTUMS) or publicly (LLC Latvijas Olimpiskā vienība)
relevant enterprises where the State is a shareholder. The data
of 2014 include also SOEs that in 2015 closed their sales process
(JSC Citadele Banka) and reorganised SOEs (JSC Attīstības finanšu
institūcija, consolidated data are included in 2014). The State
owns many SOEs that serve the public and their objectives are
social rather than commercial. This circumstance makes financial
analysis more complicated because the evaluation techniques
and methods, which are intended for the assessment of typical
commercial companies, are not so well suited to analysing and
objectively evaluating the benefits for the general public and
non-financial goals achieved.
Data collection methodology
The financial information provided in this annual report has
not been additionally audited, and it has been received from the
representative of the shareholder, from annual reports audited
by sworn auditors and published by the SOEs and from other
publicly available data and registers. Data required for the report
was not available regarding several enterprises categorised as
Other Sectors (these are enterprises where the State holds less
than 20% of the shares).
It should be taken into account that financial reports of the
SOEs have been prepared by using different standards − some
have been prepared according international financial reporting
standards (IFRS), others according to the Latvian legislation that
applies to accounting. In general, the Latvian legislation is in
13© Photo: Aleksandrs Kendenkovs 14
15
 Energy
Energy
     In this report, the energy sector has been divided into two large        2 569 MWh. Most of the electricity consumed is produced in power
groups: electricity and the centralised supply of heating. The energy         plants − Riga TEC-1, Riga TEC-2 and the Daugava Hydro Power Plant
sector makes up approximately 3% of the GDP in Latvia. Latvia’s               complex, which is the largest source of generation in the Baltic States.
energy policy is focused on enhancing the security of energy supply           Since 2014, the electricity wholesale market transactions have been
by reducing the country’s dependence on external supplies, by                 taking place through the Nord Pool Spot exchange, the remaining
diversifying their supply routes and sources, as well as by strengthening     electricity is delivered to the market directly from the producer to the
the security of the power supply networks and systems. Energy                 consumer, where the market players agree on the price.
sustainability and competitive energy price for the consumers are
essential aspects in the implementation of energy policy.                     Electricity trade
     Operation of the sector is governed by the Energy Law, the
Electricity Market Law, the Subsidised Electricity Tax Law and the Law             At the end of 2015, the Electricity Producer Register included 76
on Regulators of Public Utilities. On 9 February 2016, the National           economic operators, from which 16 economic operators provided
Energy Development Guidelines for 2016-2020 were adopted.                     electricity trade service. Within a year, 16 economic operators were
     As the result of global price decline for energy resources, in 2015,     excluded from the register, while one new economic operator of
electricity wholesale prices in Latvia and other Baltic States decreased;     electricity trade was included. At the same time, 12 economic operators
it was also promoted by further integration in the Nordic electricity         were registered in the Electricity wholesale bureau ‘’Nordpool’’ in
market. It is foreseen that by the end of 2015, the completed new             Latvia’s trade district.
electricity transmission system cross-border connections (Lithuania                In 2015, JSC Latvenergo Group successfully maintained the
and Sweden’s cross-connection NordBalt, as well as Lithuania and              position of electricity sales leader in the Baltic States. The market share of
Poland’s cross-connection LitPolLink) will substantially influence            the JSC Latvenergo Group in the Baltic States accounted for 32% of the
the functioning of electricity market, by balancing trade flows and           total Baltic electricity market. Under conditions of an open electricity
electricity prices in the Baltic States.                                      market, most of the Latvian households have chosen Latvenergo as
     Development of the energy sector is closely linked to the                their electricity trader.
liberalisation of the market. As of 1 January 2015, the Latvian electricity
market has been fully liberalised. Complete liberalisation of the natural     Electricity transmission
gas market is scheduled by April 2017, by separating the transmission
and storage system operator from the activities related to natural gas              JSC Augstsprieguma tīkls is managing the transmission network
distribution or trade, as well as by providing the opportunity for all        that is receiving electricity from the hydro power plants and thermal
natural gas users to freely choose the company selling them natural           power plants of Latvia, as well as from Lithuania, Estonia and Russia, and
gas. Gradual opening of the market is planned for households by               is transferring it further to the enterprises of the distribution network.
maintaining the right to receive natural gas at the rates set forth by        It is servicing all 330kV and 110 kV power lines in the territory of Latvia,
the regulator.                                                                providing for the operation, maintenance and repair of equipment
                                                                              installed in the substations and distribution points. In 2015, the total
Electricity                                                                   length of the electricity transmission networks in Latvia reached 1,359
                                                                              km for power lines with 330 kV voltage and 3,891 km for power lines
    The key elements of the Latvian electricity market are electricity        with 110kV voltage.
generation, transmission, distribution and trade. In the Latvian
electricity sector, there are 256 economic operators for public service       Electricity distribution
rendering; 102 or 39% are active while 14 economic operators are
authorised to render more than one electricity service at the same time            To ensure electricity supply to users’ objects (there are more than
- generation, transmission, distribution and trade.                           one million in Latvia), the provision of high-quality services of the
                                                                              distribution system plays a major role. The functions of the distribution
Electricity generation                                                        system operator in Latvia are performed by 11 enterprises, the largest
                                                                              being JSC Sadales tīkls that is a company of the JSC Latvenergo Group.
     The Latvian electricity market is supplied by the local electricity      It supplies electricity to more than 99% of electricity users in the
generation enterprises and by electricity imported from other                 country and the connection of power equipment of new electricity
countries. At the end of 2015, there were 200 electricity producers           users to the electricity network, as well as monitors the use of electricity,
registered in Latvia, only 77 of which are active in producing electricity.   records electricity consumption and activities to reduce losses in
During 2015, 16 economic operators were excluded from the register            the distribution network. 7 distribution system operators have also
of electricity producers.                                                     registered in the Electricity Trader Register; 6 of them are active in trade.
     The largest electricity producer is JSC Latvenergo with capacity of           The total length of the electricity distribution network in Latvia

16
You can also read