South Africa Future state, demands and pressures
←
→
Page content transcription
If your browser does not render page correctly, please read the page content below

South Africa
Future state, demands
and pressures

                               September 2017
               © 2017 BankservAfrica and PASA. All rights reserved.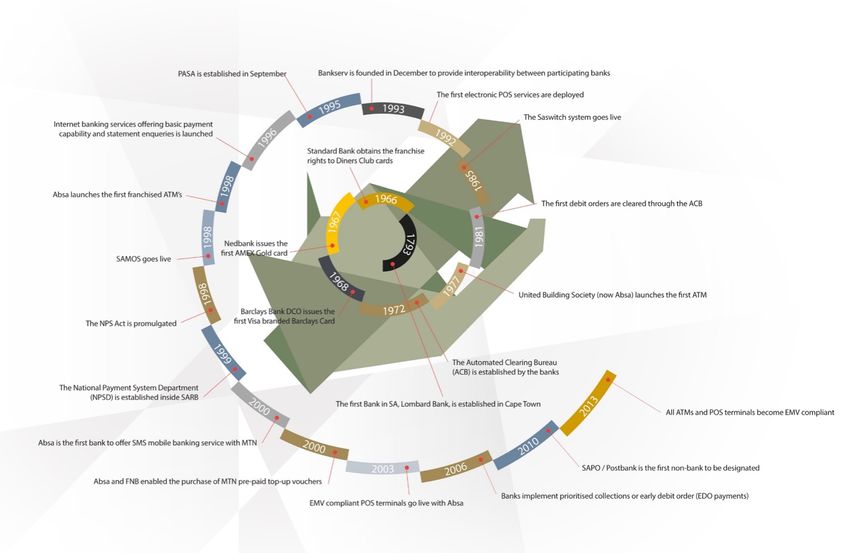
Contents

•       Introduction
          • Methodology
          • Acknowledgements
          • Payment trends in South Africa
•       South African demographic and economic context
•       Proposed goals of modernisation
•       Proposed approach to modernisation
•       Appendix
          • Macroeconomic scenarios
          • Four pillars of financial inclusion
          • Feasibility and impact analysis
          • SA LVPI modernisation risks
          • Reference list
          • Terms and definitions

                                                           2
    © 2017 BankservAfrica and PASA. All rights reserved.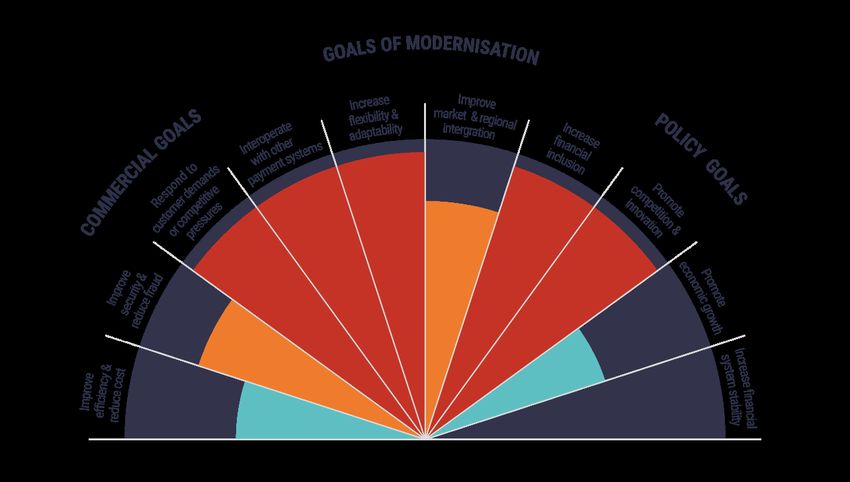
Introduction
Future state, demands and pressures
This report is the second part of a three-part series on low-value payment system infrastructure (LVPI) modernisation. It aims to provide a
substantiated view of the future consumer and user demands on South Africa’s LVPI, including anticipated demographic changes and
pressures in South Africa, the impact of these changes on consumer and user needs, and the technological, and societal pressures that
contribute to them. Over 40 in-depth industry interviews have also provided deep insight into how these changes are perceived by the
industry and its customers, and the requirements of a modernisation programme.

Report objectives
        Describe and discuss current and future concerns of South African stakeholders, both in the public and private sectors, related
        to:
        •   Consumer and user demands and pressures
        •   Technology demands and pressures

        Provide an analysis of the impact of demographic and socio-political changes on consumer demand on the LVPI. This analysis
        also includes a review of the economic situation, projections for future economic growth and the impact on the LVPI.

        Provide an analysis of the impact of financial inclusivity requirements on the LVPI.

Report outline
This report is structured into three parts following the introductory section:

1. The first part details the South Africa context within which modernisation of the LVPI needs to occur and determines the
   implications for the design that is required to serve all South Africans.
2. The second part examines proposed modernisation goals expressed by South Africa interviewees. These goals relate to future
   user and consumer demands, regulatory and technology pressures that are the impetus for modernisation. Feedback from
   interviews is then compared to modernisation goals from other markets as examined in report 1A, Modernising payment
   systems: International comparison.
3. Lastly, the report derives an approach to the process of modernisation from the suggestions made by interviewees.

                                                                                                                                          3
 © 2017 BankservAfrica and PASA. All rights reserved.
Methodology
A broad range of methods were used to gain insight

Research methodology summary

 Data collection                                                                         Analysis
 Primary research                                  Secondary research
                                                                                         All interviews were transcribed and the transcripts
 In-depth discussions with 45                      Review of existing literature
                                                                                         were reviewed to create thematic codes. Thematic
 industry stakeholders from a                      and public sources, including
                                                                                         coding is a form of qualitative analysis which
 range of stakeholders in the                      the World Bank, StatsSA,
                                                                                         involves recording or identifying passages of text
 payments industry, including                      SARB, the UN, and the WEF
                                                                                         or images that are linked by a common theme or
 banks, system operators, users,                   (a complete list of sources are
                                                                                         idea allowing you to index the text into categories
 and associations. Also                            provided in the appendix of
                                                                                         and therefore establish a framework of
 commissioned economic                             this section)
                                                                                         thematic ideas.
 scenarios to judge the impact of
 growth on payments.

Project timeline
                     Project start date                      Interviews with stakeholders                 Completion of deliverables
                     May 2017                                June - July 2017                             August - September 2017

                                        May - June 2017                              July – August 2017
                                        Project planning &                           Analysis
                                        secondary research

Report contributors
Lipis Advisors is an international company based in Berlin,                    IQbusiness is a South African independent management
focused solely on the payment system industry. Leo Lipis is the                consulting company with 18 years experience in payments
founder of Lipis Advisors, and has nearly 20 years of experience               related change projects across 17 countries in Africa, with
in payment systems management, consulting and research                         extensive work in the financial services sector. Natalie Matthews
throughout Europe and the Americas.                                            leads the Card and Payments team at IQbusiness.
                                                                                                                                                   4
 © 2017 BankservAfrica and PASA. All rights reserved.
Acknowledgements
The authors would like to extend their gratitude to the individuals who participated in the primary research
section of the study during the five week data collection period.
Organisations Individuals
1. Kotie Coetzee – U Bank 27. Ravi Shunmugam - FNB
Banking Other
2. Ghita Erling – Discovery Bank 28. Hendrik Pelser – Absa
• Absa • Old Mutual
3. Mark Elliott - MasterCard 29. Gavin Reubenson – ATM Solutions
• Bidvest Bank • CENFRI
4. Rudi Botha - Direct Transact 30. Pieter Swanepoel – Real Pay / CIBA
• Capitec Bank • Shoprite
5. Hennie Dreyer - Direct Transact 31. Edward Leach- SARB
• Discovery Bank • APIS
6. Anthony de Gery-Birch - Direct 32. Annah Manganyi – SARB
• FNB • Gates
Transact 33. Shaun Rayfield - SARB
• Investec Foundation
7. Jan Moganwa - Absa 34. Arif Ismail - SARB
• Mercantile Bank
8. Jill Murtagh – Bidvest Bank 35. Tim Masela - SARB
• Nedbank
9. Neil Capazorio – Bidvest Bank 36. Sydney Gericke - Nedbank
• Standard Bank
10. Elan Sean Krug – Bidvest Bank 37. Graeme Holmes - Nedbank
• SARB
11. Matthew Coaker – Mercantile Bank 38. Ian Carter - Nedbank
• Ubank
12. John Elliott - Investec 39. Richard Southey – Absa
13. Rufaida Ismail - Investec 40. Ingrid Goodspeed – PASA Board
14. Richard Williams – Investec 41. Steven Kark – Pay Corp
System Operators
15. Tremaine Hechter – Shoprite 42. Nic Smalle – APIS
• ATM Solutions
16. Andre Du Plessis – Capitec Bank 43. John Anderson – Standard Bank
• BankservAfrica
17. Andre Bouwer – Capitec Bank 44. Arthur Cousins – SADC Banking
• Direct Transact
18. Michael Swart – Capitec Bank Association
• MasterCard
19. Johann van Tonder – ASISA 45. Elizabeth McQuerry – Glenbrook /
• Pay Corp
20. Chris Van Wyk – Old Mutual Gates Foundation
• Real Pay
21. Paul Mauritz – Old Mutual 46. Chris Hamilton – BankservAfrica
22. Leizl Lubbe – Old Mutual 47. Martin Grunewald – BankservAfrica
23. Lumke Dlukulu – Old Mutual 48. Emile Burger – BankservAfrica
• Associations
24. Arthur Schenck – Old Mutual 49. Ruhling Herbst – BankservAfrica
• ASISA
25. Wayne Poolman – Old Mutual 50. Dale Morris – BankservAfrica
• CIBA
26. Barry Cooper – CENFRI 51. Walter Volker – PASA
• PASA
52. Maurits Pretorius – PASA
• SADC Banking Association
53. Gail Clarke - BankservAfrica
5
© 2017 BankservAfrica and PASA. All rights reserved.A brief history 50 years of payments in SA
6
© 2017 BankservAfrica and PASA. All rights reserved.The existing South African LVPI
According to PASA, the National Payment System (NPS) encompasses the entire payment process from payer to beneficiary and includes
settlement between banks. The process includes all the tools, systems, mechanisms, institutions, agreements, procedures, rules or laws related to
payments. The NPS facilitates the circulation of money, that is, it enables transacting parties to exchange value. The Low Value Payments
Infrastructure (LVPI) supports payments which fall below R5 million. Various payment streams exist for low value payments, as summarised below.
The Existing LVPI
Cash EFT Card Cheques
• SA is a predominantly • EFT includes all varieties of • Cards make up more than • Cheques have seen a
cash-based society. electronic credit and debit half of all non-cash massive reduction over the
instruments and this transaction volumes but last ten years and are not
• Cash usage continues to system has served the only 7% of the value of accepted by most
grow with more than 50% country well for many retail payments in 2016.
merchants.
of the value of consumer years. Card usage has increased
transactions being from 45% to 56% of retail
• EFT Credits made up 79% • Cheques make up just 1%
completed with notes and volumes since 2010.
of retail payments by value of the value of retail
coins according to a recent
study. in 2016, up from 70% in • High transaction costs payments in SA, but only
2010. affect the affordability of 0.2% of the volumes.
• Cash is particularly vital to card for certain segments
lower LSMs. Some South • EFTs are popular as they of the market. • SARB has declared the
Africans who have bank are a trusted payment intention to phase out
accounts continue to method. A 2015 study by • Lack of access to paper cheques.
transact exclusively in IPSOS indicated that 22% infrastructure such as
cash. of South African internet ATMs and POS for rural
users made purchases South Africans plays a part
• Trust, convenience, and using EFT Credit as their in the limited use of cards
lack of fees combine to preferred method. in these areas.
make cash attractive.
• South Africa was early to
launch real-time, low-value
payments. Uptake has
been low due to high cost
and inconsistent service
levels.
7
© 2017 BankservAfrica and PASA. All rights reserved.Payment trends in SA
Retail transactions by type per year The use of electronic payments is on the rise in SA
as demonstrated by the increase in EFT and card
Volumes values and volumes over the past decade. However,
3 500
cash usage also continues to grow.
3 000
Combined Card
2 500 EFT Debit The use of electronic payments
§ The volumes and values of electronic payments have
2 000 EFT Credit
steadily increased since 2010.
1 500 RTC § EFT credit transactions make up the bulk of retail
Millions
Cheque transaction values and have increased from 70% to
1 000
79% since 2010.
500 § RTC has increased in terms of values and volumes
over the period, however only made up 3% of the retail
-
transactions in 2016.
2010 2011 2012 2013 2014 2015 2016 § EFT debit and AEDO values and volumes have
increased. NAEDO volumes have decreased by 1% in
Values the last year (although values have increased by 6%).
12000 000
§ Card values have remained constant at 7% of the
10000 000 value of retail transactions between 2010 and 2016,
however they made up 56% of the volumes in 2016
Combined Card (versus 45% in 2010). Card values have also been
Millions
8000 000
EFT Debit increasing and are up 19% in the last year.
6000 000 § ATM volumes and values are also increasing steadily
EFT Credit
with a 9% increase recorded in values in 2016.
4000 000 RTC
Cheque Cash usage in SA
2000 000 Cash payments have also steadily increased over the
period.
-
§ Cash figures are difficult to obtain however cash
2010 2011 2012 2013 2014 2015 2016
makes up at least 50% of retail transactions in SA.
Source: PASA 2016
§ Cash usage is reported to be increasing by 13%
annually in SA.
8
© 2017 BankservAfrica and PASA. All rights reserved.The financial services landscape continues to evolve
While the use of electronic payments and formal financial services has been increasing, the use of informal financial services has also been rising.
Portion of adult Formal financial services: SA has a very high banking concentration as the largest banks hold the majority of
population served by assets. Since 2001, Capitec has transformed the “big four” into the “big five”. The largest banks typically service the
formal and informal banked (middle and upper) market. However, in the near future, further competitive pressure will come from new
financial services entrants such as Discovery Bank and Tyme. The government also has plans for a retail offering of its own through
the Post Bank. The three are expected to launch by late 2018. According to PASA, 34 banks are members of
PASA, and there are 171 TPPPs and 87 SOs in operation. Remittance services are also used extensively in SA
2004 although these may be serviced through formal and informal channels. Retailers commonly offer access to
50%
56% 44% remittance services and closed-loop financial services, bridging the gap between formal and informal financial
50%
services.
Informal financial services: Informal financial services refer to all forms of credit and savings options such as
money-lenders, taking goods on credit at spaza shops or even pawn shops. An example of an innovative informal
solution is SaveAct. Over the past few years this local NGO has been pioneering savings in poor rural communities
2013
29%
in South Africa. The model that they have used has enabled around 15 000 members of savings groups to reduce
debt and improve their economic resilience. According to the Finmark Trust survey, over six million members in
Africa are actively working their way out of poverty by building up savings, and lending to each other, without formal
49%
51% structures or rules. While fulfilling the needs of the underserviced, informal finance can be unreliable, expensive,
and risky.
79%
Informal business / market: According to Statistics South Africa, approximately 1.5m people run informal
businesses in South Africa. They point out that more than half of these businesses have a monthly turnover of less
2015 than R1500, with only 14.6% showing sales of more than R6000. As small business development is a critical driver
26% of South Africa’s economy, with half of the country’s GDP stemming from small and medium enterprises, the
informal business community is an important focus area. While traditionally a cash economy, financial services
48% continue to evolve even here. An example is the collaboration between iKhokha and Mastercard to increase access
52% to cashless payment technology for KwaMashu’s informal traders. The solution enables debit or credit card
84% payments via iKhokha’s mobile point-of-sale device, as well as mobile payments via Mastercard’s MasterPass,
minimising the amount of cash a trader is required to keep on hand. Of the trial base, 80% had never accepted
cards or any digital payments before. Stokvels are collective savings groups which provide for mutual financial
Formally serviced assistance as well as social and entertainment needs. There are over 800,000 stokvel groups in SA and these are
estimated to be worth R49bn according to the National Stokvel Association of SA (NASASA). While traditionally
Informally serviced
informal, banks have started offering formal savings products for stokvels.
Source: FinScope South Africa, 2015 Financing in this sector is a major stumbling block to its growth and the future financial landscape will need to
provide appropriate solutions. 9
© 2017 BankservAfrica and PASA. All rights reserved.Recent modernisation efforts in SA
The research undertaken to develop this report is complementary
The ISO 20022 Journey
to the ongoing modernisation efforts in South Africa.
Modernisation of the LVPI was initiated in 2009 as the ISO 20022
initiative by the PASA EPC (Electronic, Paper and Cheque) Strategy 2009
Forum. Two work groups were established: Business and Technical. By ISO20022 initiative initiated
2013, most efforts were focused on mapping the existing 180-byte
standard to the relevant ISO 20022 pacs message structures. In
addition, the business principles and requirements were defined and
clarified. On 27 May 2013 the PASA Council conditionally endorsed the
strategic intent and direction to move to a new EFT platform. May 2013
PASA Council conditionally endorsed
During the period of 2011 to 2013, SARB reviewed the Early Collections the strategic intent to move to a new
environment and instructed PASA to initiate a project to address EFT platform messaging standard
authentication of mandates for debit transactions by accountholders.
The Authenticated Collections (AC) project was launched as a result and
was tasked to develop its solution on the ISO 20022 message standard.
August 2014
The Modernisation of Payments (MoP) Project was initiated during Modernisation of Payments (MoP)
August 2014 with the strategic objective to “modernise all electronic Project was initiated
funds payments systems by establishing a common standards platform
based on ISO 20022 methodology and standards.”
The Authenticated Collections project re-proposed a phased
June 2016
implementation plan to the SARB in August 2016 which was approved in
September of that year. The pilot commenced in July 2017 and ramp-up MoP Credits Platform Project re-
will begin in February 2018. The AC project is one of the largest initiated
interbank payment projects in SA to-date, and has largely absorbed the
focus and resources of the payments ecosystem for the past two years.
The research project which led to the development of this report, is a July 2017
complementary effort to the modernisation work that has been ongoing.
Authenticated Collections platform
It is anticipated that this report will serve as one of the documents upon implemented
which industry consensus can be achieved in order to determine an
overarching approach and roadmap for modernisation of the LVPI.
10
© 2017 BankservAfrica and PASA. All rights reserved.SARB’s Vision 2025
The SARB has developed its much anticipated Vision 2025 document, however its release has been delayed. It is
anticipated that this research echoes and supports the ten themes which Vision 2025 encapsulates. The goals of any
modernisation will have to be aligned with SARB’s vision for the National Payment System.
The Reserve Bank’s Vision 2015 Vision 2025
In 2011, SARB released its Vision 2015 outlining eight main According to SARB, “Vision 2025 aspires to modernise the NPS thereby
strategic objectives: enhancing the safety, efficiency and accessibility of the NPS in a manner that
meets both domestic and international requirements and benefits all South
1. Continue to evaluate and improve the participation of non- African citizens.” Ten themes emanated from an extensive consultation
bank stakeholders in the clearing system and/or in formal process which was undertaken with all stakeholders. The themes aim to
payment system management structures. support and address the four main goals of financial sector regulation which
2. Enhance the oversight of banks and increase the focus are: financial stability, efficiency and integrity of the financial system, financial
on non-banks. inclusion, and prevention of financial crime.
3. Enhance communication among stakeholders regarding § Theme 1: Competition and collaboration within payment systems
NPS matters.
§ Theme 2: Regulation and governance of the NPS
4. Participate in international workgroups and forums.
§ Theme 3: Standards and interoperability
5. Enhance payment system human resources capacity in
§ Theme 4: Innovation in payments infrastructure
the broader NPS.
§ Theme 5: Risk and cybersecurity in the NPS
6. Ensure a high level of operational effectiveness of the
payment system infrastructure. § Theme 6: Interchange determination in the NPS
7. Facilitate regional payment system infrastructure § Theme 7: Financial inclusion
integration to meet the needs of the SADC region.
§ Theme 8: Capacity building and consumer education
8. Formalise and implement the interchange determination
§ Theme 9: Integrated management information in the NPS
process.
§ Theme 10: Regional integration and international participation
When released, SARB’s Vision 2025 will serve as the cornerstone for
modernising the LVPI in South Africa.
11
© 2017 BankservAfrica and PASA. All rights reserved.Contents
• Introduction
• Methodology
• Acknowledgements
• Payment trends in South Africa
• South African demographic and economic context
• Proposed goals of modernisation
• Proposed approach to modernisation
• Appendix
• Macroeconomic scenarios
• Four pillars of financial inclusion
• Feasibility and impact analysis
• SA LVPI modernisation risks
• Reference list
• Terms and definitions
12
© 2017 BankservAfrica and PASA. All rights reserved.Demands and pressures on the LVPI
South African demographic and economic context
South Africa remains one of the most unequal societies in the world. Despite this difficult outlook, the industry must embrace the NDP’s spirit.
Macroeconomic indicators paint a bleak picture: the country is emerging The gap between South Africa’s two economies must converge, with
from a technical recession, has been downgraded, unemployment and the goal of ultimately becoming one. The current situation is
poverty are increasing, and economic growth is slowing. SARB has unsustainable and the consequences of inaction are beyond
lowered its growth expectations for 2017 to 0.5%. consideration.
The South African government has stated its ambitions through the The NPS is not a magic wand and cannot directly improve the
National Development Plan 2030 (NDP), which lays out specific goals economy, but it can act as an obstacle to economic growth if it fails to
for the South African economy to reach by 2030. Key goals include: meet the needs of users and regulators. Many stakeholders are
required to work together to start to address the country’s challenges,
§ Increase GDP by 270% (avg. annual GDP growth of 5.4%). including government, business, labour, and society at large. The NPS
§ Increase GDP per capita to R110,000 per person (from approx. can play a key role in supporting GDP growth.
R50,000 per person in 2010).
The banking industry will have to focus on making the pie bigger – on
§ Steady reduction in the unemployment rate to 14% in 2020, with the inclusive growth. Studies show a direct link between personal income
ultimate goal of 6% by 2030. This requires the addition of 11 million and financial inclusion and participation. By strengthening the economy
jobs and a rise in total employment from 13 million to 24 million. and broadening its base, the industry can help contribute to the
§ Reducing income inequality to a Gini coefficient of 0.6 (from 0.7). stabilisation of society while at the same time enlarging its customer
base.
§ Reduce population living below lower-bound poverty line to 0% (39%
in 2010) and reduce poverty-induced hunger to 0%. Development of the LVPI needs to occur along two parallel tracks,
although these should converge in the long-term. The industry needs to
§ Increase share of income to bottom 40% of income earners from 6%
continue serving the financially included while offering services to the
today to 10% in 2030.
unbanked that can help bring them into the formal financial system. The
Many are skeptical of the feasibility of these goals. Indeed, the LVPI needs to be “future-proofed” and the payment system should be
economic development scenarios commissioned for this report confirm built with the next decades in mind. Given these requirements, as well
this skepticism: The highest growth scenario predicts 3% annual GDP as uncertainty in the macroeconomic environment, the LVPI will need to
growth going forward, with flat growth leading up to the next general be designed to be inclusive, flexible, low cost and scalable.
election in two years’ time. Reductions in unemployment are only
expected under the high growth scenario, and will be insufficient to meet
the NDP targets.
13
© 2017 BankservAfrica and PASA. All rights reserved.South Africa has a dual economy
South Africa is classified as an upper middle income developing country, nevertheless it has one of the most unequal societies
in the world. The two sectors of the country’s economy highlight this inequality. Of 56.52 million South Africans, more than one in
two live in poverty, while the top 19% have the needs of modern consumers in a developed economy. The corporate sector
comprises multinationals that compete on the global stage and banks which are ranked globally in the top two for being the
“most sound”.
Developing Developed
§ High levels of poverty – 55% live in poverty (over 30.4 § Advanced infrastructure (ports, roads, telecoms etc.)
million people)
§ Large and sophisticated business sector
§ High unemployment - 27.7% § Skilled professionals
§ High income and wealth inequality – 63.4 Gini coefficient § Relatively high number of successful MNCs originate
from SA
§ Social grants - R164.9 billion in 2016/17, 29.7% receive
grants. § Highly developed financial system
§ SA’s banks ranked 2nd “most sound” in the world
§ Low standard of education (72th of 138 countries)
(behind Finland) (Lafferty’s 2017 Global Bank Quality
§ High drop out rates – more than 40% by matric. benchmarking)
§ Maths and science ranked 138 out of 138 § Efficient financial markets
§ Low skill workers § Sophisticated payment system
§ Poor healthcare § Upper middle income – R77,606 GDP per capita
§ Poor nutrition – 13.8 million live below the food poverty line § SA is ranked as the second most competitive economy in
§ Low life expectancy - Estimated at 59.7 years for males Africa according to the WEF’s Global Competitiveness
and 65.1 years for females (66th out of 79 developing Report in 2017, and it is ranked 47 overall (an improvement
countries) from its 2015 position on the index).
§ Moderately banked population (58% are formally banked,
and that number increases to 77% when SASSA grant
recipients are taken into account), but still primarily cash-
based.
14
© 2017 BankservAfrica and PASA. All rights reserved.The economy is struggling to serve all South Africans
South Africa has been plagued by weak economic growth with many factors seemingly conspiring to constrain growth. Unfortunately, many of the
challenges have been self-inflicted through, among other things, policy uncertainty and poor policy implementation. While salaries are growing at the
fastest rate since 2015 and the Gini coefficient has improved slightly, poverty has increased. Over a quarter of the population, mainly children, are
unable to obtain enough food to provide them with a sufficient diet for healthy development.
Current economic trend
• Average GDP growth between 2009 to 2016 was 1.6% per year. However, average GDP growth slowed to 1.1% over 2014 to 2016.
• SARB lowered the growth expectation for 2017 to 0.5%, while growth of 1.2% and 1.5% is expected in 2018 and 2019, respectively.
• SA is emerging from a technical recession and has been downgraded by international ratings agencies.
• Unemployment is increasing. Since 2011, the unemployment rate has increased from 24% to 27.7%.
• Poverty and hunger are increasing – over 55% now live in poverty (refer to the box below).
• Fragile States Index - South Africa finds itself within the Elevated Warning category. SA has had a “rapid decline” over the past decade, with
“only Libya, Syria, Yemen, Mali, and Senegal having worsened more in the past ten years.” The economic decline factor has also worsened.
Unfortunately, these trends are likely to continue until underlying structural issues start to be addressed. Investor and consumer confidence have
been eroded and continue to be affected by the political climate which will likely remain volatile until the next general elections in 2019. A
depressed economy stifles employment creation, which means that it will be difficult to reduce poverty.
Poverty is on the rise
More than half of South Africans are considered poor. Poverty has increased from 53.2% to 55.5% since 2011. Only 44% of the population is
deemed ‘non poor’.
POOR AND NON-POOR
Three poverty Income % below Number of Description SOUTH AFRICANS
lines pppm* line people (2015 FIGURES)
Upper-bound R1138 55.5% Over 30,4 Individuals able to purchase FPL
poverty line mn adequate levels of food and non-food poor
25%
(UBPL) items. Non
poor
Lower-bound line R758 40% 21.9 mn Individuals forced to sacrifice food to LBPL 44%
(LBPL) obtain essential non-food items. poor
15%
Food poverty line R531 25.2% 13.8 mn Extreme poverty: Individuals unable
UBPL
(FPL) to obtain enough food to provide a poor
sufficient diet for healthy 16%
development.
Source: StatsSA Poverty Trends, 2017
*Per person per month, inflation adjusted prices
15
© 2017 BankservAfrica and PASA. All rights reserved.Over-burdened middle class can’t provide sustainable growth
The middle class is essentially a very small “pie” upon which business and government depend for revenue. The middle class is relatively small
and is under pressure. At the broadest definition, the middle class make up just 16% of the population. Given high levels of competition for this
market, this segment is not significant enough to support sustainable growth. The proverbial “pie” needs to grow and both sectors of the economy
need to improve.
Middle class “three salaries away from poverty”
• The ‘middle class’ is difficult to define:
• It is variously defined as households with an income ranging from R5,600 to a maximum of R40,000 per month after
direct income tax for a family of four (although FinScope defines the upper class as those earning above R30,000 per
month).
• Its size is estimated as being between 13.7% to 16% of the population or approximately 6 million people at the upper end of the
range. However, there are claims that the South African middle-class is shrinking.
• Social anthropology expert, professor Leslie Bank, says that the middle-class is too small and needs to increase by “at
least 20% to 30%” if economic growth is to become sustainable.
• The middle class is under pressure and finds itself in a precarious position:
• Three quarters are purported to be under financial stress.
• Dangerously high levels of debt have been reported.
• Much of the middle class are approximately three salaries away from poverty (i.e. the length of time the banks allow for
catch-up on unpaid mortgages, after which a foreclosure is initiated).
• The repossession rate is four times higher than the world average on a per-capita basis.
• The size of a country’s middle class is viewed as an indicator of the health of an economy. It is an important source of tax
revenue and spending. Unfortunately, SA’s middle class has been described as vulnerable as even mild economic shocks may
be sufficient to push households back below the threshold of poverty.
• The IRR’s 2015 report found that “any significant future middle class expansion would depend on South Africa securing an
economic growth turnaround”.
16
© 2017 BankservAfrica and PASA. All rights reserved.Economic strengthening is critical for creating stability
The government adopted the NDP in 2012 as a strategic framework to address socioeconomic and developmental challenges in SA, with the
overarching goal to eliminate poverty and reduce inequality in SA by 2030. However, since being adopted, progress has been poor and, in certain
areas, SA has regressed. The goals may appear to be too ambitious given the current challenges, however the industry must embrace its spirit. The
LVPI needs to be built for the economy that South Africans want as the current situation is unsustainable. The consequences of inaction are beyond
consideration.
NDP economic goals for 2030 Most recent status of economic goals*
• Gross Domestic Product (GDP) should increase by 2.7 NDP Target Baseline 2030 Most Recent
times in real terms, requiring average annual GDP growth Target Status
of 5.4 percent over the period.
Reducing the proportion of persons 39.0% (2009) 0% 40.0% (2015)
• GDP per capita should increase to R110 000 per person living below the lower-bound
in 2030 from about R50 000 per person in 2010, in constant poverty line from 39% (in 2009) to
prices. 0% by 2030.
Reducing income inequality from 0.70 (2010) 0,60 0.68 (2015)
• The unemployment rate should fall from 24.9 percent in 0.7 in 2010 to 0.6 by 2030.
June 2012 to 14 percent by 2020 and to 6 percent by 2030.
This requires an additional 11 million jobs. Total The share of income going to the 6.0% (2010) 10,0% 8.3% (2015)
employment should rise to 24 million from 13 million. bottom 40% of income earners
should rise from 6% to 10%.
• Income inequality (measured by the Gini coefficient)
Reducing poverty-induced hunger 21.4% (2011) 0% 25.2% (2015)
should decrease to 0.6 in 2030, from 0.7 in 2010.
to 0% by 2030.
• Reduce the proportion of the population living below the *Sourced from the StatsSA Poverty Report 2017
lower-bound poverty line from 39% in 2009 to 0% by 2030.
• Reduce poverty-induced hunger to 0% by 2030.
• Increase the share of income going to the bottom 40% of
income earners to 10% (from 6%).
17
© 2017 BankservAfrica and PASA. All rights reserved.Economic scenarios highlight the challenge of NDP goals
Three scenarios (a high growth, base case and low growth scenario) were included in an analysis undertaken to determine the possible influences
that each may have on the modernisation of the LVPI and the requirements for the payment system. The scenarios commissioned for this report
confirm the challenge of achieving the NDP goals: The highest growth scenario predicts 3% annual GDP growth going forward, with flat growth
leading up to the next general election in two years. Even the most “sunny day” scenario will be insufficient to meet NDP targets.
Base case Low growth High growth
Just over 2% on average per year Below 1% on average per year Just more than 3% on average per year
Although it is impossible to make an exact forecast on demographic
Historic South African GDP across three scenarios and economic variables, scenario planning can help to provide different
potential paths of the future given current forces or trends. The three
5,0
scenarios are closely linked to the international and domestic economic
4,5 environments. Domestic political decisions and policies, as well as
policy implementation, quality of leadership and human capital
Constant 2010 prices (R trillions)
4,0
development are also seen as important drivers of the different
3,5 scenarios.
3,0
In all three forecasts, low growth is expected in the next two years
2,5
before the next general election. The high growth scenario does not
2,0 demonstrate an average growth of more than 3% because, assuming
1,5 that the elections yield a result that encourages investment in SA, that
investment will take time to realise. Unemployment, in particular, only
1,0 sees an improvement in the high growth scenario. The variance in the
0,5 GDP per capita for the different growth scenarios is relatively small
(R62,100 for the base case in 2030, R45,800 in 2030 for the low growth
0,0
case and R71,700 in 2030 for the high growth case). Refer to Appendix
2008
2009
2010
2011
2012
2013
2014
2015
2016
2017
2018
2019
2020
2021
2022
2023
2024
2025
2026
2027
2028
2029
2030
1 for further detail.
Base case Low growth High growth While these scenarios make a big difference for the lives of South
Africans, they don’t make a significant difference in the
Stats SA, 2017, Own forecasts
requirements for the payment system under current projections.
18
© 2017 BankservAfrica and PASA. All rights reserved.Inclusive growth is required
Growth of the economy needs to be inclusive to benefit the majority of South Africans. Achieving inclusive growth requires many stakeholders,
including government, business, labour, and civil society, to work together to start to address the country’s challenges,. The National Payment
System is one of the contributors which can play a role in supporting inclusive growth.
Defining inclusive growth The role of the National Payment System
The South African payment ecosystem stakeholders interviewed for this report
The OECD defines inclusive growth as “economic growth believe that the payment system is one of the elements that can support inclusive
that creates opportunity for all segments of the population economic growth.
and distributes the dividends of increased prosperity,
both in monetary and non-monetary terms, fairly across Including a greater proportion of the population in the formal payment system
society.” brings a variety of benefits, such as:
• Improving the lives of individuals and families, and can contribute to inclusive
In order for poverty reduction to be achieved, the World
growth and economic development.
Bank claims that economic growth must be both rapid
and sustainable. Sustainable economic growth has • Reducing reliance on cash reduces the costs and risks associated with cash
become synonymous with inclusive growth, which means handling and management.
including the majority of a country’s labour force in • Allowing consumers to build payments data history which can be leveraged to
economic activity. However, inclusive growth emphasises access credit and which also assists financial organisations to better assess
the need for productive employment, rather than credit risk.
employment or income redistribution in themselves. As • Reducing marginal operating costs through greater numbers of consumers.
such, inclusive growth is a long-term perspective and is
hinged on the meaningful engagement of a country’s • Reducing incidents of crime, particularly cash theft
workforce in economic activity through equal • Reducing black market activity
opportunities, and access to markets and resources.
• Increasing tax revenue
The NDP is the South African government’s leading • Increasing the ability to oversee and manage the economy holistically
policy framework. It was adopted by the South African It is widely acknowledged that the NPS is only a part of the solution. The NPS is
Government in 2012 as a long term vision and plan for not a “silver bullet,” but it can be a significant obstacle to growth and economic
the country. The NDP aims to eliminate poverty and development if not designed correctly. Many stakeholders will be required to
reduce inequality by 2030. According to the Plan, South work together to address complex issues, ranging from policy amendments to
Africa can achieve these goals through the energies of its financial education. Other stakeholders, such as SASSA, ICASA, and retailers
people, growing an inclusive economy, enhancing the will need to work with the NPS to enable it to provide full benefit to all South
capacity of the state, and stimulating leadership and Africans. This includes many aspects from a fit-for-purpose regulatory framework
partnerships throughout society. through to improving telecommunications infrastructure.
19
© 2017 BankservAfrica and PASA. All rights reserved.Inclusive growth improves income & market for financial services
The banking industry will have to focus on making the pie bigger – on inclusive growth for the developed and developing sectors of the economy.
Growth of the economy needs to be inclusive to benefit the majority of South Africans. There is a relationship between personal income and bank
accounts that demonstrates that once the former reaches a certain level, that bank accounts become near universal.
Increasing income is linked to account National income explains much of the variations in account penetration across all
penetration economies – but far less among lower income economies. Each dot on the chart
below represent the percentage of adults with a bank account and GDP per capita by
• The statistical record is clear that once personal country. Although South Africa appears to be above the trend line (the yellow line) for
incomes reach a certain threshold, bank accounts its account penetration, the number is inflated because of SASSA accounts. Without
become an indispensable way of securely storing these, it would be below the line. Countries with a GDP per capita of more than $20k
and accessing personal assets. In other words, have nearly universal bank account penetration.
growing the economy and ensuring a more equal
distribution of wealth increases the customer base
for the payment system. Adults with an account at a formal financial institution (%)
• South Africa already has a moderately banked 100
population : 58% have a formal bank account and
90
that number jumps to 77% when the SASSA grant
80
Bank account penetration
beneficiary card holders are included. (2014, %, age 15+)
70
• Unfortunately, many low income account holders
use their accounts as a mailbox, withdrawing all 60
funds in a single transaction when they are 50
South Africa
received. Many reasons exist for this behaviour,
40
including a lack of card acceptance infrastructure
in rural areas. 30
20
• Ordinary South Africans, particularly the poor,
require more income to improve usage of their 10
accounts. Economic growth and lower inequality 0
are required to drive the need for and use of bank 0 20000 40000 60000 80000 100000 120000
accounts. GDP per capita (USD, 2014)
Source: World Bank, own analysis
20
© 2017 BankservAfrica and PASA. All rights reserved.Linking payments, financial inclusion, & inclusive growth
The link between electronic payments and macroeconomic growth is difficult to quantify, however the use of electronic payments is widely
believed to be beneficial to the economy. Electronic payments are an aspect of financial inclusion that can reduce waste and improve efficiency,
convenience, and safety, as detailed below. But there are a number of barriers that hinder the adoption of electronic payments. These barriers
require action from many stakeholders to address.
Financial High-level Reduces waste Improves efficiency, Barriers to the adoption and use
service benefits convenience and safety of electronic payments
Access to • Makes • ↓ cost of making / receiving • ↑ speed • Low income levels & high fees/
electronic everyday payments • ↑ transparency and ability to banking costs
payments financial • ↓ travel (e.g., to bank track payments • Lack of ubiquitous electronic
transactions branch or ATM) • ↑ control money ecosystem
more efficient, • ↓ wait times / inefficiency • ↑ confidentiality • Lack of consumer trust and
convenient and • ↓ losses due to • ↑ productivity / output willingness
safe unauthorised / incorrect • ↑ automation of operations • Low levels of literacy & financial
• Reduces payments (human error) • ↑ consumption education
friction • ↓ administration costs for • ↑ security • Poor marketing
government/business • ↑ access to credit - regular bill • Culture / consumer behavior /
• ↓ working capital / ↑ interest payments via account can build habit
• ↓ crime / theft and payments data history, which • A focus on commercial drivers
corruption can be leveraged for better by the role players in the
• ↓ ‘ghost’ accounts / fake access to credit / allows ecosystem
recipients for government assessment of credit risk • Regulation (AML & KYC)
payments • ↑ empowerment of women • Risk management requirements
• ↓ reduce non-performing which has been found to result • Disconnect between different
loan (NPL) portfolio for in increased spending on health, channels (lack of interoperability)
financial institutions when housing and nutritious food • Lack of connectivity and high
payments data history is data costs
assessed for credit risk
The four pillars of financial inclusion are access to electronic payments, savings, credit and insurance. The table summarises the benefits that have
been found to be associated with electronic payments. Not all of the pillars are equal in reaching development goals. Microcredit has had mixed
results while the benefit of insurance is less clear. Access to electronic payments, as well as appropriate savings mechanisms, report the biggest
impacts on development goals, such as lower poverty and inequality, according to the World Bank. Refer to Appendix 2 for the full table which
includes all four pillars of financial inclusion.
21
© 2017 BankservAfrica and PASA. All rights reserved.Creating an LVPI for all South Africans
The LVPI needs to be developed with the next decades in mind. It must serve all South Africans in the developed and developing economies, and
should be built to serve the economy that South Africans want.
The LVPI needs to be future-proofed cater for new use cases as expectations evolve
• The LVPI needs to be built with the next 20 years in mind. It is nearly impossible to predict the changes and new technologies or
solutions that will be developed in that time. Fifteen years ago, no one could have foreseen the impact that smartphones would
have on our lives, so it is fair to say that we may all be surprised by what emerges in 10 to 20 years.
• The rise of on-demand services has resulted in consumers seeking seamless services and experiences, and collaboration among
Flexible brands to provide these. Payments will disappear into the process as it becomes a holistic experience that becomes intuitive,
habitual, and automatic, requiring less and less from the consumer to enable it.
• The use of international standards such as ISO 20022 can increase the flexibility, utility, and appeal of the LVPI by providing a
single data standard that can be used to implement a panoply of payment instruments and services.
The LVPI therefore needs to be built with flexibility, scalability and modular extensibility in mind.
Building for the economy that South Africans want requires that the LVPI is inclusive
• The development of the LVPI needs to cater the developed and developing economies in South Africa. The requirements of each
sector of the economy are driven by different factors. Serving both economies requires a dual strategy from the payment system.
It needs to support modern, advanced payments for the financially included and corporate users. But it also needs to provide
Inclusive paths in and out of the financial system for the excluded. Development must occur along two parallel tracks, although these
should converge in the long-term.
• The LVPI needs to be inclusive of more stakeholders as the payments ecosystem extends well beyond the banks. This is likely to
involve the participation on non-banks (fintechs, users, and others) in governance bodies.
The LVPI must be low-cost
• The high-volume, low-value nature of LVPI payments requires a cost efficient infrastructure.
Low cost • Supporting the underbanked with appropriately priced accounts and payments can increase financial inclusion.
• Corporate users require low-cost payments to reduce friction in the economy.
The LVPI needs to be scalable to ensure that it caters for the economy that South Africa has and for the one it wants
• The three possible scenarios do not change the underlying needs that exist for the payment system. Volumes, distribution and
cost per transaction may change depending on the scenario; but the underlying functionality that is required does not change.
Scalable • No matter the real outcome, the payment system will have to cater for a bigger population and a more tech savvy consumer.
Population growth estimates put numbers at 59 million by 2020 and 65.6 million by 2030. Millennials are, at the oldest end, 37
years of age today and the generations born since will all continue to be more comfortable with technology and therefore likely to
accept newer payment methods.
22
© 2017 BankservAfrica and PASA. All rights reserved.A modernised LVPI can help SA meet its challenges
• Macroeconomic indicators paint a bleak picture in South Africa. Increasing unemployment and poverty figures attest to
the worsening situation faced by far too many citizens, while growth expectations have been lowered to 0.5%
• South Africa faces many challenges, structural and otherwise, in its efforts to meet the targets laid out in the NDP.
• Despite the difficult outlook, the industry must embrace the NDP’s spirit. The gap between South Africa’s two economies
must converge, with the goal of ultimately becoming one.
• Many stakeholders will be required to work together to achieve the ambitions of the NDP, and the NPS has a role to play
in supporting inclusive growth which is required.
• In order to do this, the LVPI must serve all South Africans, now and in the future. It must serve the financially included
while offering services to those not currently included.
• To meet this need and in order to ‘future-proof’ itself, the LVPI’s design must be: flexible, inclusive, low-cost, and
scalable.
• Flexibility can be achieved chiefly through a technological and business model design that encourages innovation.
• Inclusivity can be achieved by including all stakeholders in the decision-making process.
• Low-cost can be achieved through clever system design and expanding the pie, maximising the volume being put
through a fixed-cost infrastructure.
• Scalability is primarily function of the technological design.
23
© 2017 BankservAfrica and PASA. All rights reserved.Contents
• Introduction
• Methodology
• Acknowledgements
• Payment trends in South Africa
• South African demographic and economic context
• Proposed goals of modernisation
• Proposed approach to modernisation
• Appendix
• Macroeconomic scenarios
• Four pillars of financial inclusion
• Feasibility and impact analysis
• SA LVPI modernisation risks
• Reference list
• Terms and definitions
24
© 2017 BankservAfrica and PASA. All rights reserved.Goals proposed for the modernisation of the LVPI
Stakeholder views on the goals of payment modernisation
When asked about the goals of payment system modernisation, South The goals are linked; one goal can assist in achieving another goal.
African stakeholders echoed nine of the ten goals found in the Some of the goals are significantly more difficult to achieve than
international comparison: others, while some can be achieved within a relatively short period.
• Promote competition and innovation The pursuit of any or all of the goals needs to be determined through
• Respond to consumer demands and competitive pressures an inclusive process.
• Interoperate with other payment systems
The diagram highlights the goals that were articulated in the local
• Increase flexibility and adaptability
interviews. The research team subjectively estimated the importance of
• Increase financial inclusion each goal based on the relative frequency, enthusiasm, and emphasis
• Improve security and reduce fraud of the topic in the interviews, as well as the impact that the goal has on
• Improve market and regional integration achieving the other stated goals.
• Improve efficiency and reduce cost
• Promote economic growth The section following describes and comments on each of the goals
proposed by the interviewees.
The interviewees did not articulate any new goals. The remaining goal
was not perceived as specifically needing to be addressed by the
modernisation programme.
25
© 2017 BankservAfrica and PASA. All rights reserved.Linked nature of modernisation goals
The proposed modernisation goals are linked. Reaching one goal can assist in achieving another. For example, achieving interoperability between
money transfers can assist with promoting competition & innovation.
demands & competitive
The table to the left summarises the ways in which the
Promote competition &
Interoperate with other
Respond to consumer
Improve efficiency &
ten goals influence one another. Certain goals have a
Improve market and
Increase flexibility &
regional integration
Promote economic
Improve security &
The achievement of
payment systems
Increase financial
broad influence (e.g. interoperability). Others, such as
the goal listed below
financial inclusion, are influenced by all of the other
reduce costs
reduce fraud
impacts the
adaptability
innovation goals. This reflects the emphasis in the interviews that
pressures
achievement of the
inclusion
goal listed to the right some goals are more important than others, either
growth
because of their strong impact on others or the
complexity required to achieve them.
Promote competition The achievement of all other goals has a positive
& innovation x x x
impact on financial inclusion, however its impact is not
reciprocal. The only goal supported by financial
Respond to consumer inclusion is promote economic growth.
demands & x x
competitive pressures
The importance of two goals, interoperability with other
payment systems and increasing flexibility &
Interoperate with other adaptability, is underscored by their impact on other
payment systems x x x x x x x
goals. They have a positive impact on all other goals,
except for improving security & reducing fraud.
Increase financial
inclusion x
Some goals have a bi-directional influence. For
Increase flexibility & example; financial inclusion and promote economic
adaptability x x x x x x x growth can positively impact each other; as can
promote competition & innovation and respond to
Improve security & consumer demands & competitive pressures.
reduce fraud x x x
The table also emphasises that goals are not equal in
Improve market and complexity. Although it is not a table of dependencies –
regional integration x x x x
financial inclusion does not require market and regional
integration, for example, even though market and
Improve efficiency & regional integration can support financial inclusion –
reduce costs x x
the more a goal is impacted by others, the more
Promote economic
complex it is likely to be. Financial inclusion, and
growth x x responding to consumer demands and competitive
pressures stand out in this regard.
26
© 2017 BankservAfrica and PASA. All rights reserved.Goal: Promote competition & innovation
Description and drivers
GLOBAL DESCRIPTION
Encourage the entry of new providers and the development of new services.
This is primarily a policy goal but has commercial implications if achieved: more innovation attracts customers and increases
usage of electronic payments. From a policy point of view, more competition reduces prices and improves options for
consumers while innovation can improve the services that are provided to citizens. Several interviewees suggested goals
are actually broader than payments and include banking services. More broadly, separating payment services from banking
services has been a key policy tool employed in other countries (e.g., Brazil, EU, Nigeria, UK) to promote greater
competition.
Promoting competition and innovation can be achieved through technical changes, rule changes or a combination of both.
Drivers:
• The need to increase usage of electronic payment systems and the ubiquity of payment services.
DRIVERS AND BENEFITS
• The need to meet corporate and consumer demands for new services.
• The need to support effective commerce and trading.
Benefits:
• Increased consumer choice
• Increased variety of services
• Improved services / addition of value added services
• Improved customer experience
• Attraction of new consumers
• Possible inclusion of unbanked
• Increased usage of the payment system
• Lower cost / prices.
27
© 2017 BankservAfrica and PASA. All rights reserved.Key
SA interviewees’ suggestion
Goal: Promote competition & innovation SA suggestion & applied
Internationally
Applied internationally
Insights from the interviews and the available levers Authors’ suggestion
Insights from South African voices Suggested levers
Potential levers Benefits of levers
Two major themes emerged from the interviews:
Awareness of options improves consumer
Financial education / literacy
choices
1. The role of new entrants in creating innovation.
• They bring competition, innovative ideas and a balance of power. Micro payment model A lower cost model provides alternative option
• New entrants will be important contributors to furthering financial
Risk-based regulation Allows new entrants and includes unbanked
inclusion.
Increase consumer access to the Increased usage of the payment system
However, the existing bank stakeholders believe that other payment system incentivises providers to provide new solutions
organisations do not appreciate the regulatory burden that banks Online alternative to card
Increases options for consumers
have and that new entrants need to fairly accept some of this payments
burden if they want to participate. Link legacy payment system &
alternatives for the Increases options for consumers
“Let’s have more people participating but on a fair basis.” underbanked
2. Regulation for innovation. Enables value added services through additional
ISO 20022
data
A common sentiment shared by many respondents is that
Visibility of pricing allows comparisons by
regulation is a hurdle to innovation. Transparency requirements
consumers
• Regulation inhibits new players from entry, thereby stifling
innovation. Require standardised APIs
Allows access to provide new services & reduces
• The regulatory burden can also limit innovation by existing players. risk
• Regulation can inadvertently suppress innovation and hinder financial
Expansion of participants Increases options for consumers
inclusion, i.e., by requiring players to follow the same KYC regulations
when providing services to the underbanked. Creates opportunities for non-banks to provide
Broaden access to non-banks
payment services
The suggestions that emerged from the interviews were: Including more organisations in governance can
• A layered approach to regulation - such that parties are only regulated Inclusive governance
create rules / services that better serve needs
according to the realm within which they play and the relative risk that
they bring to the system. This could facilitate the inclusion of new RT pull payments / RFP
Increases options for consumers
instrument
players into the value chain.
• Some flexibility where it makes sense to improve financial inclusion. Proxy database Makes electronic payments more convenient
“ The industry can create rails. They can create platforms and they can Pricing regulation Prevents overcharging for services
create regulatory incentives, or at least an environment where innovation Revise settlement method Can enable new entrants
can take place.”
Real-time payments Platform for innovative products & services
28
© 2017 BankservAfrica and PASA. All rights reserved.You can also read