Advancements in the Aerosol Robotic Network (AERONET) Version 3 database - automated near-real-time quality control algorithm with improved cloud ...
←
→
Page content transcription
If your browser does not render page correctly, please read the page content below
Atmos. Meas. Tech., 12, 169–209, 2019
https://doi.org/10.5194/amt-12-169-2019
© Author(s) 2019. This work is distributed under
the Creative Commons Attribution 4.0 License.

Advancements in the Aerosol Robotic Network (AERONET)
Version 3 database – automated near-real-time quality control
algorithm with improved cloud screening for Sun photometer
aerosol optical depth (AOD) measurements
David M. Giles1,2 , Alexander Sinyuk1,2 , Mikhail G. Sorokin1,2 , Joel S. Schafer1,2 , Alexander Smirnov1,2 ,
Ilya Slutsker1,2 , Thomas F. Eck2,3 , Brent N. Holben2 , Jasper R. Lewis2,4 , James R. Campbell5 , Ellsworth J. Welton2 ,
Sergey V. Korkin2,3 , and Alexei I. Lyapustin2
1 Science Systems and Applications Inc. (SSAI), Lanham, MD 20706, USA
2 NASA   Goddard Space Flight Center (GSFC), Greenbelt, MD 20771, USA
3 Universities Space Research Association (USRA), Columbia, MD 21046, USA
4 Joint Center for Earth Systems Technology, University of Maryland, Baltimore County, Baltimore, MD 21250, USA
5 Marine Meteorology Division, Naval Research Laboratory (NRL), Monterey, CA 93943, USA

Correspondence: David M. Giles (david.m.giles@nasa.gov)

Received: 16 August 2018 – Discussion started: 10 September 2018
Revised: 12 December 2018 – Accepted: 13 December 2018 – Published: 11 January 2019

Abstract. The Aerosol Robotic Network (AERONET) has               time from up to several months. Near-real-time estimated un-
provided highly accurate, ground-truth measurements of the        certainty is determined using data qualified as V3 Level 2.0
aerosol optical depth (AOD) using Cimel Electronique Sun–         AOD and considering the difference between the AOD com-
sky radiometers for more than 25 years. In Version 2 (V2)         puted with the pre-field calibration and AOD computed with
of the AERONET database, the near-real-time AOD was               pre-field and post-field calibration. This assessment provides
semiautomatically quality controlled utilizing mainly cloud-      a near-real-time uncertainty estimate for which average dif-
screening methodology, while additional AOD data contam-          ferences of AOD suggest a + 0.02 bias and one sigma un-
inated by clouds or affected by instrument anomalies were         certainty of 0.02, spectrally, but the bias and uncertainty
removed manually before attaining quality-assured status          can be significantly larger for specific instrument deploy-
(Level 2.0). The large growth in the number of AERONET            ments. Long-term monthly averages analyzed for the entire
sites over the past 25 years resulted in significant burden to    V3 and V2 databases produced average differences (V3–V2)
the manual quality control of millions of measurements in         of +0.002 with a ±0.02 SD (standard deviation), yet monthly
a consistent manner. The AERONET Version 3 (V3) algo-             averages calculated using time-matched observations in both
rithm provides fully automatic cloud screening and instru-        databases were analyzed to compute an average difference
ment anomaly quality controls. All of these new algorithm         of −0.002 with a ±0.004 SD. The high statistical agreement
updates apply to near-real-time data as well as post-field-       in multiyear monthly averaged AOD validates the advanced
deployment processed data, and AERONET reprocessed the            automatic data quality control algorithms and suggests that
database in 2018. A full algorithm redevelopment provided         migrating research to the V3 database will corroborate most
the opportunity to improve data inputs and corrections such       V2 research conclusions and likely lead to more accurate re-
as unique filter-specific temperature characterizations for all   sults in some cases.
visible and near-infrared wavelengths, updated gaseous and
water vapor absorption coefficients, and ancillary data sets.
The Level 2.0 AOD quality-assured data set is now available
within a month after post-field calibration, reducing the lag

Published by Copernicus Publications on behalf of the European Geosciences Union.
170                                                  D. M. Giles et al.: Advancements in the AERONET version 3 database

1   Introduction                                                  taire – PHOTONS) (Goloub et al., 2008), University of Val-
                                                                  ladolid (Red Ibérica de medida Fotométrica de Aerosoles
Space-based, airborne, and surface-based Earth observing          – RIMA) (Toledano et al., 2011), other subnetworks (e.g.,
platforms can remotely retrieve or measure aerosol abun-          AEROCAN, Bokoye et al., 2001; AeroSpan, Mitchell et
dance. Each method has its own assumptions and dependen-          al., 2017; AeroSibnet, Sakerin et al., 2005; CARSNET, Che
cies in which the aerosol total column abundance quantified       et al., 2015), collaborators at agencies, institutes, and uni-
by aerosol optical depth (AOD) introduces uncertainty in the      versities, and individual scientists worldwide. Conceived in
retrieval or measurement. At the forefront, ground-based Sun      the late 1980s, AERONET’s primary objective was to pro-
photometry has been considered the ground truth in the mea-       vide an aerosol database for validation of Earth Observ-
surement of AOD given minimal assumptions, reliable cal-          ing System (EOS) satellite retrievals of AOD and atmo-
ibration, and weak dependency on trace gases at carefully         spheric correction (Kaufman and Tanré, 1996). In addi-
selected wavelength bands, thus resulting in highly accurate      tion to columnar direct Sun AOD, sky radiances were used
data (Holben et al., 1998, 2001). Meanwhile, AOD inferred         to infer aerosol characteristics initially from Nakajima et
from other observing platforms such as satellite retrievals       al. (1996) (SkyRad.PAK) and later by the Dubovik and
provides quantitative AOD but with significantly higher un-       King (2000) inversion algorithm to obtain products such as
certainty (Remer et al., 2005; Li et al., 2009; Levy et al.,      aerosol volume size distribution, complex index of refrac-
2010; Sayer et al., 2013). Further, in situ measurements lack     tion, single scattering albedo, and phase functions.
the ability to provide a reliable columnar AOD due to the            AERONET is a network of autonomously operated Cimel
requirement of measuring aerosols vertically in each layer        Electronique Sun–sky photometers used to measure Sun col-
while not perturbing or modifying the particle properties dur-    limated direct beam irradiance and directional sky radiance
ing the measurement (Redemann et al., 2003; Andrews et            and provide scientific-quality column-integrated aerosol
al., 2017). Lidar is fundamental in the determination of the      properties of AOD and aerosol microphysical and radia-
vertical aerosol extinction distribution (Welton et al., 2000;    tive properties (Holben et al., 1998; https://aeronet.gsfc.nasa.
Omar et al., 2013). Quantification of columnar AOD from           gov, last access: 12 December 2018). The development and
ground-based lidar, for example, may be less reliable due to      growth of the program relies on imposing standardization
low signal-to-noise ratio during the daylight hours at high al-   of instrumentation, measurement protocols, calibration, data
titudes and below the overlap region in which the aerosols        distribution, and processing algorithms derived from the best
very near the surface are poorly observed by lidar. Satel-        scientific knowledge available. This instrument network de-
lite retrieval issues include determining the AOD for very        sign has led to a growth from two instruments in 1993 to
high aerosol loading episodes, cloud adjacency effects, land–     over 600 in 2018. During that time, improvements were made
water mask depiction, surface reflectance, highly varying to-     to the Cimel instruments to provide weather-hardy, robust
pography, and aerosol type assumptions (Levy et al., 2010,        measurements in a variety of extreme conditions. While the
2013; Omar et al., 2013). With each of these measurement          basic optical technology has evolved progressively from ana-
platforms, uncertainties exist with AOD; however, these con-      log to digital processing over the past 25 years, the most re-
cerns are minimized with AOD measurements from surface-           cent Sun–sky–lunar CE318-T instruments provide a number
based Sun photometry such as from the federated Aerosol           of new capabilities in measurement protocols, integrity, and
Robotic Network (AERONET). Ground-based Sun photom-               customizability (Barreto et al., 2016).
etry, a passive remote-sensing technique, is robust in mea-          All of the slightly varying models of the Cimel instru-
suring collimated direct sunlight routinely during the day-       ments can have measurement anomalies affecting direct Sun
time in mainly cloud-free conditions (Shaw, 1983; Holben          measurements, which include measurements in the pres-
et al., 1998; Takamura and Nakajima, 2004; Smirnov et             ence of clouds, various obstructions in the instrument’s field
al., 2009; Kazadzis et al., 2018). While these surface-based      of view, or systematic instrumental issues such as elec-
measurements are only point measurements, the federated           trical connections, high dark currents, and clock shifts to
AERONET provides measurements of columnar AOD and                 name a few. Some of these issues depend on the instru-
aerosol characteristics over an expansive and diverse geo-        ment model and, for more than a decade, these anomalies
graphic area of the Earth’s surface at high temporal resolu-      have been removed semiautomatically utilizing the cloud-
tion.                                                             screening method developed by Smirnov et al. (2000) and
   Standardization of Sun photometer instrumentation, cali-       further quality controlled by an analyst to remove additional
bration, and freely available data dissemination of AOD and       cloud-contaminated data and instrument artifacts from the
related aerosol databases highlights the success of the fed-      database. Chew et al. (2011) identified up to 0.03 of AOD
erated AERONET. For more than 25 years, the AERONET               bias at Singapore due to optically thin cirrus clouds for Ver-
federation has expanded due to the investments and ef-            sion 2 Level 2.0 data. Coincidentally, Huang et al. (2011)
forts of NASA (Goddard Space Flight Center, GSFC) (Hol-           examined how cirrus clouds could contaminate AOD mea-
ben et al., 1998), the University of Lille (PHOtométrie           surements in up to 25 % (on average) of the data in April
pour le Traitement Opérationnel de Normalisation Satelli-         at Phimai, Thailand, in the Version 2 Level 2.0 data set.

Atmos. Meas. Tech., 12, 169–209, 2019                                                www.atmos-meas-tech.net/12/169/2019/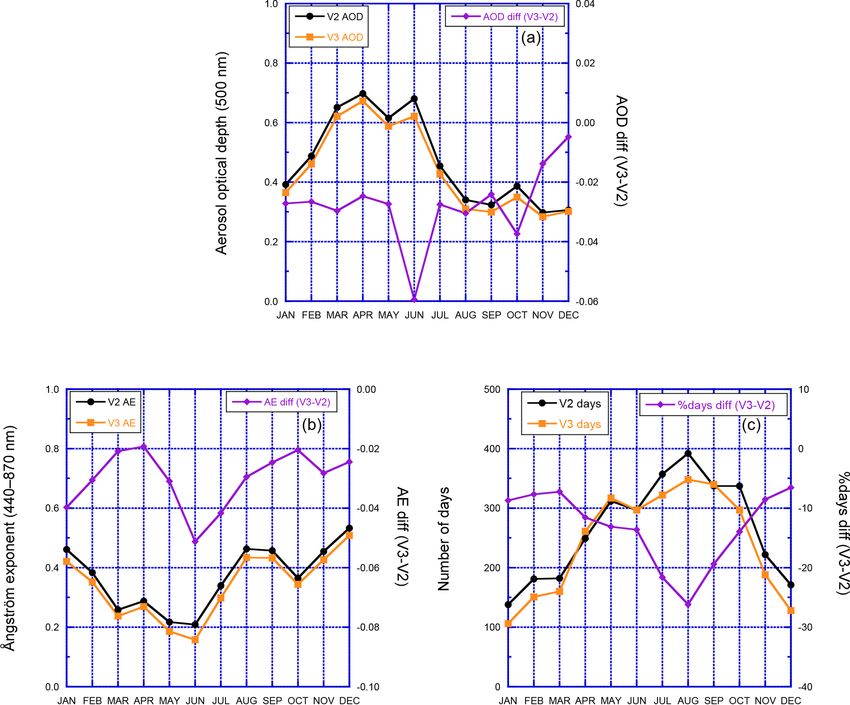
D. M. Giles et al.: Advancements in the AERONET version 3 database 171
The number of AERONET sites has increased to more than As shown by Holben et al. (1998) and for completeness in
600 sites in the network as of 2018 and the labor-intensive this discussion, the Beer–Lambert–Bouguer law converted to
effort of quality controlling hundreds of thousands of mea- instrument digital counts is shown in Eq. (1):
surements manually had resulted in a significant delay of
quality-assured data (Level 2.0) in the AERONET Version 2 V (λ) = Vo (λ) · d 2 · exp [−τ (λ)Total · m] , (1)
database.
With these issues at hand, the cloud-screening quality con- where V (λ) is the measured spectral voltage of the instru-
trol procedure as well as all other aspects of the AERONET ment dependent on the wavelength (λ), Vo (λ) is the rela-
processing algorithm including instrument temperature char- tive extraterrestrial spectral calibration coefficient dependent
acterization, ancillary data set updates, and further quality on λ, d is the ratio of the average to the actual Earth–Sun dis-
control automation were reassessed. Utilizing these improve- tance (Michalsky, 1988; USNO, 2018), τ (λ)Total is the total
ments, the Version 3 Level 2.0 quality-controlled data set re- optical depth, and m is the optical air mass, which is strongly
quires only the pre-field and post-field calibrations to be ap- dependent on the secant of the solar zenith angle (Kasten and
plied to the data so these data can now be released within a Young, 1989). For the Cimel Sun photometer, the voltage
month of the final post-field instrument calibration instead of signal is expressed as integer digital counts or digital num-
being delayed up to several months. As encouraged by the ber (DN). The error in the τ (λ)Total is generally dependent
AERONET community, automatic quality controls in Ver- on the optical air mass (m) by δτ proportional to m−1 and
sion 3 are now also applied to near-real-time Level 1.5 AOD hence the AOD computation error will tend to be at a max-
products allowing for improved data quality necessary for imum at m = 1 (Hamonou et al., 1999). Cimel instrument
numerous applications such as numerical weather prediction, repeatability is tested during calibration procedures by com-
atmospheric transport models, satellite evaluation, data syn- paring voltage ratios between the field instrument and refer-
ergism, and air quality. ence instrument to be less than ±1 % (Holben et al., 1998).
The AERONET Version 3 processing algorithm marks a The absolute uncertainty in the AOD measurement can be
significant improvement in the quality controls of the Sun described as Eq. (2), with calibration uncertainty of Vo being
photometer AOD measurements, particularly in near real the overwhelmingly dominant error source:
time. The revised AERONET algorithm is introduced by 1
δV δVo
1 δVo
first reviewing the calculations made to compute the AOD δτ = · + + τ · δm ∼ = · . (2)
m V Vo m Vo
plus changes in the input data sets and the resulting calcu-
lation of optical depth components. Next, the preprocess- The spectral AOD (τ (λ)Aerosol ) should be computed from the
ing steps and data prescreening are discussed for the Ver- cloud-free spectral total optical depth τ (λ)Total ) and the sub-
sion 3 quality control algorithm. Cloud screening and instru- traction of the contributions of Rayleigh scattering optical
ment quality control algorithm changes are discussed with depth and spectrally dependent atmospheric trace gases as
reference to Smirnov et al. (2000), and the solar aureole cir- shown in Eq. (3).
rus cloud-screening quality control is introduced for the first
time. The automation of instrument anomaly quality controls τ (λ)Aerosol = τ (λ)Total − τ (λ)Rayleigh − τ (λ)H2 O
and additional cloud screening is described in the subsequent − τ (λ)O3 − τ (λ)NO2 − τ (λ)CO2 − τ (λ)CH4 (3)
sections. Lastly, the AERONET Version 2 and Version 3
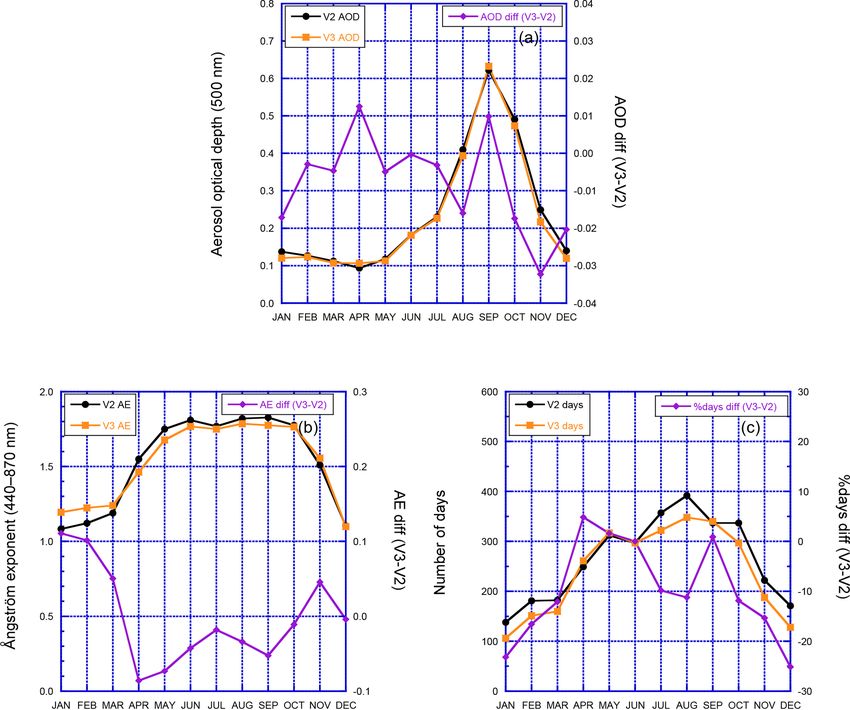
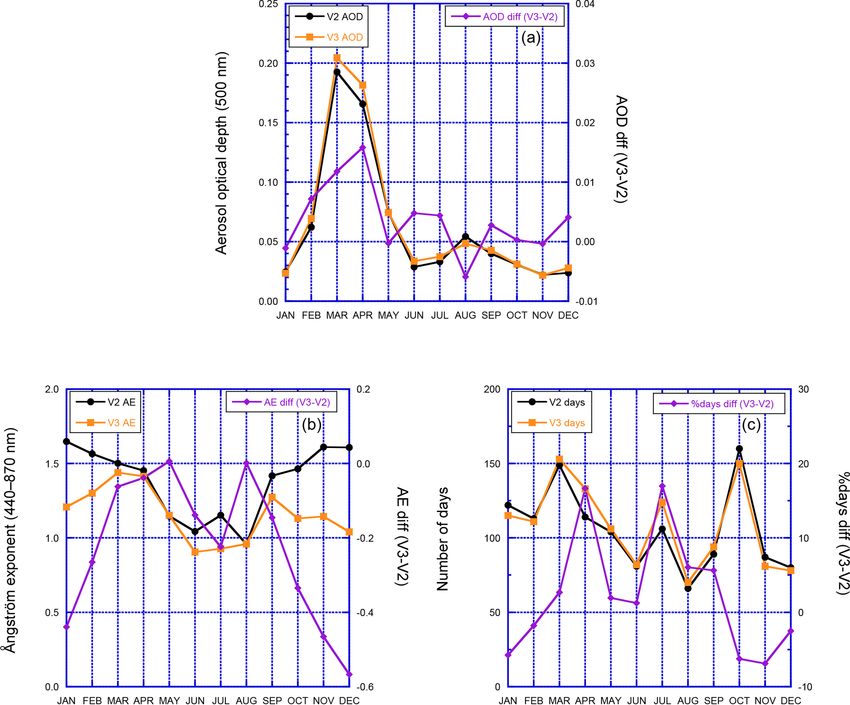
database results are analyzed for the entire data set as well The Rayleigh optical depth (τRayleigh ) is calculated based
as for selected sites. on the assumptions defined in Holben et al. (1998), op-
tical air mass (Kasten and Young, 1989), and the for-
mula by Bodhaine et al. (1999), except correcting the
2 Aerosol optical depth computation result based on the NCEP-derived station pressure. The
ozone (O3 ) optical depth (τO3 ) is dependent on the O3 ab-
Sun photometry is a passive remote-sensing measurement sorption coefficient (aO3 ) for the specific wavelength, the ge-
technique in which mainly collimated light generally not ographic and temporally dependent multiyear monthly cli-
scattered or absorbed by the atmosphere illuminates a pho- matological Total Ozone Mapping Spectrometer (TOMS)
todiode detector and this light energy is converted to a digital O3 concentration (CO3 ), and the O3 optical air mass (mO3 )
signal. The digital signal (V ) measured by the instrument is (Komhyr et al., 1989) using the following formulation:
proportional to the solar irradiance. The relative solar calibra- τO3 = aO3 · CO3 · mO3 /m. Similarly, nitrogen dioxide (NO2 )
tion is derived from the Langley method (Ångström, 1970; optical depth (τNO2 ) is computed using absorption coef-
Shaw et al., 1973) utilizing the digital counts from the in- ficient (aNO2 ) and geographic and temporally dependent
strument versus the optical air mass to obtain the calibration multiyear monthly climatological Ozone Monitoring In-
coefficient (Vo ) by choosing the intercept at which optical air strument (OMI) NO2 concentration (CNO2 ) assuming NO2
mass is zero at the top of the atmosphere (Shaw, 1983). The scale height is equal to aerosol: τNO2 = aNO2 · CNO2 . The
relative extraterrestrial solar irradiance is proportional to Vo . water vapor optical depth (τH2 O ) is calculated based on
www.atmos-meas-tech.net/12/169/2019/ Atmos. Meas. Tech., 12, 169–209, 2019
172                                                   D. M. Giles et al.: Advancements in the AERONET version 3 database

filter-dependent (e.g., 1020 and 1640 nm) A and B co-              Table 1. Nominal AERONET wavelengths for ion-assisted deposi-
efficients (discussed further below) and precipitable wa-          tion filters used for aerosol remote sensing and spectral corrections
ter (PW) in centimeters (u) using the following linear for-        or components for each channel.
mulation: τH2 O = A + Bu. The carbon dioxide (CO2 ) opti-
cal depth (τCO2 ) and methane (τCH4 ) use station-elevation-             Nominal            Filter    Spectral corrections/
dependent formulations: τCO2 = 0.0087 · P /P0 and τCH4 =                 central         bandpass     components
0.0047 · P /P0 , assuming the US standard atmosphere (1976)              wavelengths         (nm)
                                                                         (nm)
and absorption constants derived from HITRAN. Further de-
scriptions of these calculations are provided below.                     340                     2    Rayleigh, NO2 , O3
    Table 1 provides a list of the spectral corrections used in          380                     2    Rayleigh, NO2
the calculation of AOD and PW from 935 nm. The nominal                   440                    10    Rayleigh, NO2
standard aerosol wavelengths are 340, 380, 440, 500, 675,                500                    10    Rayleigh, NO2 , O3
870, 1020, and 1640 nm. For wavelengths shorter than and                 675                    10    Rayleigh, O3
                                                                         870                    10    Rayleigh
equal to 1020 nm, these channels are measured using a sil-
                                                                         935                    10    Rayleigh, aerosol
icon photodiode detector with a spectral range from 320 to               1020                   10    Rayleigh, H2 O
1100 nm. If the Cimel instrument has an InGaAs detector                  1640                   25    Rayleigh, H2 O, CO2 , CH4
with a 900 to 1700 nm spectral range, then the 1640 nm
wavelength is measured along with a redundant 1020 nm
measurement used to compare instrument optical charac-
teristics among detectors, lenses, and collimator tubes. The
Cimel SeaPrism instrument models, which are deployed on            TW = ln T935 nm[Measured] − ln T935 nm[Extrapolated] ,           (4)
ocean or lake platforms as part of the AERONET Ocean                               h              i
Color component to retrieve normalized water leaving radi-         − ln [TW ] = ln Vo 935 nm · d 2 − ln [V935 nm ]
ances at 8–12 additional visible band wavelengths for ocean
                                                                              − m · τ935 nm AOD + τ935 nm Rayleigh ,                (5)
and lake remote-sensing studies, are similarly corrected for
atmospheric effects (Zibordi et al., 2010).

                                                                        TW
    Rayleigh optical depth calculations require the use of         ln         = −A · (mW · u)B ,                                    (6)
                                                                         C
the station pressure (Bodhaine et al., 1999) as well as the             h      i1/B
                                                                          ln TW
optical air mass (Kasten and Young 1989). To determine                     −A
AERONET site station pressure (PS ), the NCEP/NCAR re-             u=               ,                                               (7)
                                                                            mW
analysis mean sea level pressure and geopotential heights at
standard levels (1000, 925, 850, 700, and 600 hPa) are fitted      where TW is the water vapor transmission, constants A and B
by a quadratic function in logarithmic space to infer the sta-     are absorption constants unique to the particular 935nm filter,
tion pressure at the corresponding interpolated geopotential       C is an absorption constant assumed to be equal to 1 (Ingold
height. The NCEP/NCAR reanalysis data are available rou-           et al., 2000), d and m are defined in Eq. (1), mW is the water
tinely at 6-hourly temporal resolution and 2.5◦ spatial reso-      vapor optical air mass (Kasten, 1965), and u is the total col-
lution (Kalnay et al., 1996). Errors in the station pressure are   umn water vapor abundance (Schmid et al., 2001; Smirnov
generally less than 2 hPa when the station elevation is accu-      et al., 2004). The total column water vapor abundance (u)
rate and the weather conditions are benign (i.e., atmospheric      is converted to total column water content or PW by using
pressure tends to be stable) since aerosol measurements are        the normalization factor (uo = 10 kg m−2 ) and dividing it by
typically performed in mainly cloud-free conditions.               the mean value of water density (po = 1000 kg m−3 ) to ob-
    The 935 nm wavelength is used to determine the water va-       tain water column height units of centimeters (Bruegge et al.,
por optical depth contribution, which is consequently sub-         1992; Ingold et al., 2000).
tracted from the longer aerosol wavelengths (i.e., 709 nm             In the calculation of the filter-dependent A and B con-
SeaPrism, 1020, and 1640 nm). The AOD at 935 nm is ex-             stants, the water vapor absorption optical thickness is deter-
trapolated based on the Ångström exponent (AE) computed            mined by the integration of water vapor extinction coefficient
from the linear regression of the AOD and wavelengths in           over height from the bottom to the top of the atmosphere.
logarithmic space within the range of 440–870 nm exclud-           This calculation requires the following inputs to determine
ing channels affected by water vapor absorption (Eck et al.,       the extinction at each height: HITRAN spectral lines with as-
1999). To extract the PW in centimeters from the 935 nm            sumed US Standard Atmosphere, 1976 temperature and pres-
measurements, the Rayleigh optical depth and the AOD com-          sure profiles, the absorption continuum lookup table from the
ponents need to be subtracted from the total optical depth at      Atmospheric and Environmental Research (AER) Radiative
935 nm. As a result, the dimensionless column water vapor          Transfer Working Group (Clough et al., 1989; Mlawer et al.,
abundance (u) is obtained using the following equations (4–        2012), and total internal partition sums that define the shape
7):                                                                and position of lines dependent on temperature (Gamache et

Atmos. Meas. Tech., 12, 169–209, 2019                                                   www.atmos-meas-tech.net/12/169/2019/
D. M. Giles et al.: Advancements in the AERONET version 3 database                                                            173

al., 2017). Nine defined total column water vapor amounts         1640 nm filter, respectively, and adjusted to the station eleva-
(0.5, 1.0, 1.5, 2.0, 2.5, 3.0, 4.0, 5.0, and 6.5 cm) are used     tion.
to generate water vapor absorption optical depth lookup ta-          The calibration of the AOD measurements is traced to
bles. From these lookup tables, transmittances are calcu-         a Langley measurement performed by a reference instru-
lated based on the bandpass and averaged spectral solar ir-       ment (Shaw, 1983; Holben et al., 1998). The reference in-
radiance for the quiet Sun obtained from the University of        struments obtain a calibration based on the Langley method
Colorado LASP/NRL2 model (Coddington et al., 2016) to             morning-only analyses based on typically 4 to 20 days of
generate filter-specific A and B coefficients. The one sigma      data performed at a mountaintop calibration site. The pri-
uncertainty in the calculation of PW in centimeters is ex-        mary mountaintop calibration sites in AERONET are lo-
pected to be less than 10 % compared to GPS PW retrievals         cated at Mauna Loa Observatory (latitude 19.536, longitude
(Halthore et al., 1997; Bokoye et al., 2003; Sapucci et al.,      −155.576, 3402 m) on the island of Hawai’i and Izana Ob-
2007; Alexandrov et al., 2009; Prasad and Singh, 2009; Bock       servatory (latitude 28.309, longitude −16.499, 2401 m) on
et al., 2013; Van Malderen et al., 2014; Pérez-Ramírez et         the island of Tenerife in the Canary Islands (Toledano et al.,
al., 2014; Campenelli et al., 2018). The spectral water va-       2018). These reference instruments are routinely monitored
por optical thickness (τH2 O (λ)) is determined by computing      for stability and typically recalibrated every 3 to 8 months.
the average of all A and B constants from the suite of filters    Reference instruments rotate between mountaintop calibra-
affected by water vapor absorption (i.e., 709 nm SeaPrism,        tion sites and inter-calibration facilities at NASA GSFC (lat-
935, 1020, and 1640 nm) in the AERONET database. The              itude 38.993, longitude −76.839, 87 m) in Maryland, Car-
τH2 O (λ) (Eq. 8) is also dependent on the dimensionless to-      pentras (latitude 44.083, longitude 5.058, 107 m) in France,
tal column water vapor abundance (Michalsky et al., 1995;         and Valladolid (latitude 41.664, longitude −4.706, 705 m) in
Schmid et al., 1996):                                             Spain, where reference instruments operate simultaneously
                                                                  with field instruments to obtain pre-field and post-field de-
τH2 O (λ) = A(λ) + B(λ) · u.                               (8)
                                                                  ployment calibrations. For periods when the AOD is low
The contribution of ozone (O3 ) optical depth is determined       (τ440 nm < 0.2), optical air mass is low (m < 2), and aerosol
utilizing the total column TOMS monthly average clima-            loading is stable, the reference Cimel calibration may be
tology (1978–2004) of O3 concentration at 1.00◦ × 1.25◦           transferred to field instruments (Holben et al., 1998). Eck et
spatial resolution, the O3 optical air mass using O3 scale        al. (1999) estimate the reference instrument calibration un-
height adjustment by latitude (Komhyr et al., 1989), and          certainty impact on AOD varies from 0.0025 to 0.0055 with
the O3 absorption coefficient (Burrows et al., 1999). The         the maximum representing uncertainty only in the UV chan-
OMI O3 data set is not used here due to instrument sam-           nels (340 and 380 nm). In Version 3, the field instrument
pling anomalies (McPeters et al., 2015). While the TOMS           AOD uncertainty is still estimated to be from 0.01 to 0.02
O3 data set is extensive and generally characterizes the dis-     with the maximum representing the uncertainty only in the
tribution of O3 , recent changes in concentration could intro-    UV channels (340 and 380 nm).
duce some minor uncertainty in AOD. Similarly, the nitro-            The Version 2 processing used default temperature cor-
gen dioxide (NO2 ) optical depth is calculated using the to-      rections based on three sensor head temperature (TS ) ranges
tal column OMI monthly average climatology (2004–2013)            (TS < 21 ◦ C, 21 ◦ C ≤ TS ≤ 32 ◦ C, and TS > 32 ◦ C) using
of NO2 concentration at 0.25◦ × 0.25◦ spatial resolution and      a constant nominal temperature sensitivity only for the
the NO2 absorption coefficient (Burrows et al., 1998). Tropo-     1020 nm filter direct Sun measurements. In Version 3, mea-
spheric NO2 is highly variable spatially due to various source    surement temperature sensitivity has been updated for all
emissions, and stratospheric NO2 concentrations are more          wavelengths ≥ 400 nm and all measurement types (i.e., direct
stable spatially than the tropospheric NO2 and can bias the       solar, sky, water, and lunar viewing measurements). Begin-
calculation of AOD if neglected (Arola and Koskela, 2004;         ning in 2010, the temperature sensitivity was characterized
Boersma et al., 2004). Therefore, regions with high tropo-        for almost all wavelengths uniquely for each Cimel instru-
spheric NO2 emission will tend to have greater proclivity         ment. The temperature effect on signal (i.e., DN per degree
for deviating from climatological means. Further, NO2 can         Celsius) is a function of the combined sensitivity of the de-
vary significantly on the diurnal scale (Boersma et al., 2008).   tector and the filter material itself. If any Cimel data relying
Improved satellite observations, models, or collocation with      on a filter were in use prior to 2010 and the filter was not
surface-based PANDORA instruments measuring temporal              temperature characterized, then the default values for the fil-
total column O3 and NO2 may assist in reducing the un-            ter and manufacturer type are applied, if established. Filters
certainty and determination of the total column NO2 optical       in the ultraviolet (i.e., 340 and 380 nm) are not measured for
depth contribution in later versions of the algorithm (Her-       temperature dependence because of low integrating sphere
man et al., 2009; Tzortziou et al., 2012). Concentrations for     radiance output at these wavelengths. Due to temperature de-
carbon dioxide (CO2 ) and methane (CH4 ) are assumed con-         pendence of the field instrument and the reference instru-
stant and optical depths are computed based on the HITRAN-        ment, the Sun and sky calibration transfer needs to be ad-
derived absorption coefficients of 0.0087 and 0.0047 for the      justed by computing the ratio of the Cimel temperature coef-

www.atmos-meas-tech.net/12/169/2019/                                                  Atmos. Meas. Tech., 12, 169–209, 2019
174                                                   D. M. Giles et al.: Advancements in the AERONET version 3 database

ficients for each wavelength and for the temperature observed      creasing the temporal availability of the AOD measurements
at the time of the calibration. In addition, when the AOD is       in the AERONET database.
computed for field instruments, the sensor head temperature
is measured for each direct Sun measurement so these data
can be adjusted to the temperature response of the instrument      3     Automatic quality controls of Sun photometrically
optics (i.e., combined effect of the detector and filters) and           measured aerosol optical depth
electronics.
   The temperature response is measured at the AERONET             The AERONET database has provided three distinct levels
calibration facilities using an integrating sphere and a tem-      for data quality: Level 1.0, Level 1.5, and Level 2.0. In Ver-
perature chamber in which the temperature is varied from           sion 2, Level 1.0 was defined as prescreened data, Level 1.5
−40 to +50 ◦ C. The wavelength-dependent temperature co-           represented near-real-time automatically cloud-cleared data,
efficient is typically determined from the slope of ordi-          and Level 2.0 signified an automatically cloud-cleared, man-
nary least-squares (OLS) regression fit of the digital volt-       ually quality-controlled data set with pre- and post-field cali-
age counts versus the sensor head temperature reading. For         brations applied. In Version 3, the definitions have been mod-
this relationship, the second-order polynomial fit is com-         ified substantially for Level 1.5 and Level 2.0. Version 3
puted for 1020 nm, while other filters use either a linear or      Level 1.5 now represents near-real-time automatic cloud
second-order polynomial fit (depending on the larger cor-          screening and automatic instrument anomaly quality controls
relation coefficient). For Cimel model 4 and some model 5          and Level 2.0 additionally applies pre-field and post-field cal-
instruments with two silicon photodiode detectors, the dig-        ibrations. The Version 3 fully automated cloud screening and
ital counts for solar aureole and sky instrument gains are         quality control checks eliminate the need for manual quality
used to determine temperature coefficients for each detector       control and cloud screening by an analyst and increases the
(Holben et al., 1998; https://aeronet.gsfc.nasa.gov, last ac-      timeliness of quality-assured data. Note that in all cases each
cess: 12 December 2018). Some model 5 and all CE318-T              subsequent data quality level requires the previous data level
instruments perform the direct Sun and sky measurements            to be available as input (e.g., Level 1.5 requires Level 1.0 and
on the same detector (silicon or InGaAs) and typically uti-        Level 2.0 requires Level 1.5). The following sections will de-
lize the solar aureole gain digital counts (Barreto et al.,        scribe these new definitions and automatic quality controls
2016; https://aeronet.gsfc.nasa.gov, last access: 12 Decem-        and the impact these new quality assurance measures have
ber 2018).                                                         on the AERONET database in detail.
   According to Holben et al. (1998), all instruments gener-
                                                                   3.1     Preprocessing steps and prescreening
ally perform measurements sequentially from longer wave-
length to the shortest wavelength filters on a rotating fil-       Most preprocessing data quality criteria operate on voltage
ter wheel inside the sensor head, which positions each fil-        (V , expressed as the integer DN) or sensor head tempera-
ter in front of the photodiode detector and behind the sensor      ture (TS ). The impact of these conditions may immediately
head lenses and collimator tube. The robotically controlled        remove data from Level 1.0 consideration or later only im-
sensor head points automatically at the Sun based on the           pact Level 1.5 and Level 2.0 AOD. Each quality control sec-
time and geolocation of the instrument. The laboratory-tuned       tion describes the reasoning for the screening at the specified
four-quadrant detector provides nearly perfect solar and lunar     data quality level. Digital count anomalies typically result
tracking to one motor step or ∼ 0.1◦ immediately following         from anomalous electronic issues such as very low or high
the geographic pointing. A dual-tube external collimator with      battery voltages, malfunctioning amplifiers, or loose connec-
internal baffles attached to the top of the sensor head reduces    tions of internal control box components. These digital count
stray light effects into the sensor head 1.2◦ field-of-view op-    anomalies mostly affect older Cimel model 4 (CE318-1) and
tical train.                                                       model 5 (CE318-N) instruments (Holben et al., 1998; https://
   The instrument performs measurements of the Sun using           aeronet.gsfc.nasa.gov, last access: 12 December 2018), while
measurement triplets, that is, performing the series of mea-       several of these connection issues have been mitigated in the
surements of all filters starting at 0 s of the minute for a du-   Cimel model T (CE318-T) instruments (Barreto et al., 2016).
ration of about 8 s, and then repeating this measurement se-
quence at 30 s and 60 s from the initial measurement time.         3.1.1    Electronic instability
The resulting 1 min averaged measurement sequence is de-
fined as a triplet measurement and the maximum to minimum          Cimel model 4 instruments use a 16-bit analog–digital (A/D)
range of these measurements is termed the triplet variability.     converter in the processing unit in which the analog signal
The triplet measurement advantageously allows for separa-          from the sensor head detector to the control box is sub-
tion of homogeneously dispersed aerosols versus highly tem-        ject to electronic noise. Cimel model 5 instruments use a
porally variable clouds. The triplet measurements are per-         16-bit A/D converter inside the sensor head and the instru-
formed either every 15 min for older model 4 instruments or        ment invokes electronic chopping to reduce electronic noise.
every 3 min for newer model 5 and CE318-T instruments in-          Cimel model T instruments utilize an increased quantization

Atmos. Meas. Tech., 12, 169–209, 2019                                                  www.atmos-meas-tech.net/12/169/2019/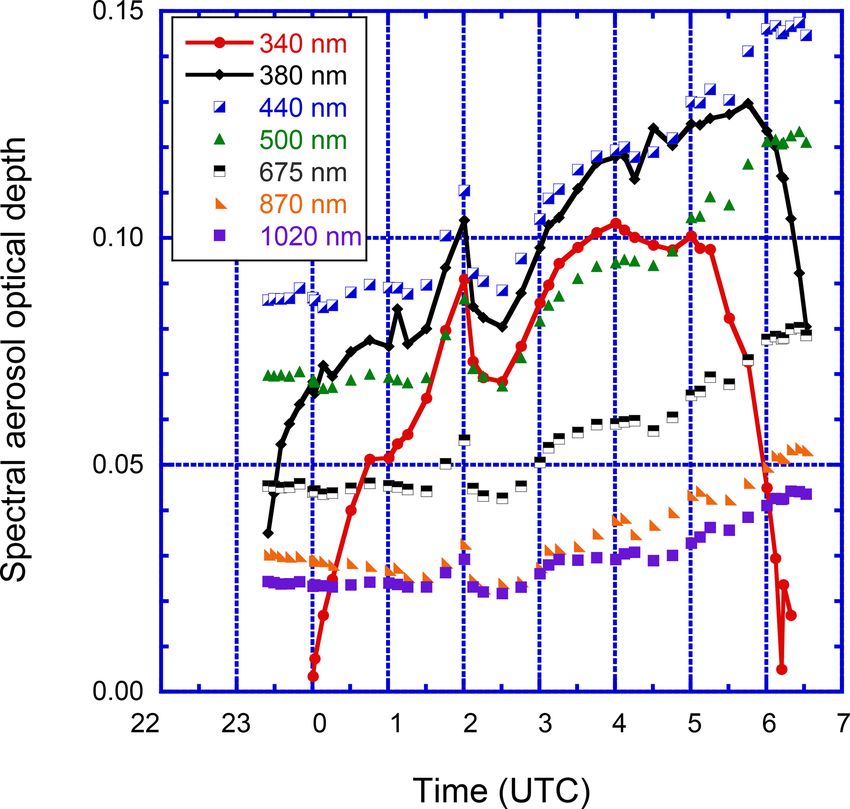
D. M. Giles et al.: Advancements in the AERONET version 3 database                                                                 175

from 16 to 24 bits, which significantly reduces noise effects.
Cimel model 5 and model T instruments internally adjust for
the dark current (VD ) with each measurement and no sep-
arate record is logged. Cimel model 4 instruments perform
VD measurements after each sky scan (approximately hourly)
for each spectrally dependent instrument gain parameter (i.e.,
Sun, aureole, and sky). Large VD values generally represent
significant instrument electronic instability. Quality controls
applied to the VD will remove the entire day for model 4 in-
strument data from all of the quality levels for either of the
following conditions: (1) a single dark current measurement
is greater than 100 counts for greater than N −1 wavelengths,
where N is the total number of wavelengths, or (2) more than
three dark current measurements are greater than 100 counts
for three or more wavelengths.
   Amplifiers in the Cimel model 4 instruments can produce
unphysical increases in the digital counts or decreases in
the AOD for the 340 and 380 nm wavelengths at large op-            Figure 1. Aerosol optical depth (AOD) data from AERONET Us-
tical air mass (Fig. 1). These instability issues are evaluated    suriysk site (43.70◦ N, 132.16◦ E) on 30 November 2005 show elec-
                                                                   tronic instability. For the Cimel model 4 instruments, the electronic
simply using a relative threshold with respect to the avail-
                                                                   sensitivity of the UV AOD data (340 and 380 nm) can be high due
able visible wavelength AOD measurements. If the τ380 is
                                                                   to a bad amplifier. The resulting AOD data for the UV channels
greater than 0.5·τ340 and (τ440 +τ500 or 675 < τ380 +τ340 −2.0),   are out of spectral dependence the entire day with a maximum er-
then the triplet measurements for 340 and 380 nm are re-           ror for large optical air mass due to large dark current values. The
moved from the database for Level 1.5 and subsequent lev-          UV channels (identified by line plots) are removed by the quality
els. These quality controls are limited to model 4 instruments     control while preserving other wavelengths that are not affected by
that were not manufactured after 2001; however, the early          this condition.
AERONET database (1993–2005) contains many of these
data. New Cimel model T instruments are replacing model 4
instruments but over 40 model 4 instruments remain active             Version 2 data processing assessed the instrument elec-
in 2018.                                                           tronic and diffuse light sensitivity by defining a DN of 10
   The instrument may rarely malfunction by producing con-         to remove solar AOD triplet measurements. Electronic is-
stant digital voltages for triplet measurements and the result     sues impact Cimel model 4 instruments in the UV and short
of keeping these data in the database leads to unphysical vari-    visible wavelengths due to high DN(VD ). Scattered diffuse
ations in the AOD. A frequency analysis is performed to de-        light into the collimated field of view can affect all instru-
termine if any DN values occur more than 10 times in a day.        ments and produce unusual AOD changes with optical air
If more than 50 % of the DNs are from the same triplet mea-        mass, especially when the aerosol loading is high and opti-
surement, then this measurement is identified as an anoma-         cal air mass is large. The signal-to-noise ratio of the Cimel
lous measurement. If more than 50 % of the triplet measure-        instrument requires setting a minimum threshold for the de-
ments in the day are considered anomalous, then the entire         termination of the solar measured DN(V ) to limit the effect
day will be removed from Levels 1.5 and 2.0.                       of diffuse radiance in the instrument field of view (Sinyuk
                                                                   et al., 2012). A dark current DN(VD ) (e.g., ∼ 50–100) nearly
3.1.2   Radiometer sensitivity evaluation                          equal to or larger than the measured solar DN(V ) (e.g., ∼ 25–
                                                                   50) will result in V and τ decreasing with increasing optical
The Cimel four-quadrant solar near-infrared detector re-           air mass. All wavelengths are evaluated to determine if the
quires enough sensitivity to track the Sun, and a DN thresh-       measured solar DN(V ) (subtracted from the closest temporal
old of 100 in the near infrared is needed to have sufficient       dark current DN(VD ) for model 4 instruments only) is less
signal. Near-infrared wavelengths (e.g., 1020 nm) typically        than DN(VO )/1500; then the identified wavelength will be
have a higher measured solar DN(V ) due to higher atmo-            removed from all AOD levels. A threshold of 1500 is cal-
spheric transmission in the presence of fine-mode-dominated        culated from a DN of 15 000, a typical average DN(VO ) for
aerosols even in very high aerosol loading conditions. When        Cimel models 4 and 5, normalized to a minimum signal DN
the DN (V870 nm or V1020 nm ) is less than 100 counts for any      of 10. The maximum product of AOD times optical air mass
measurement of the solar triplet, then the entire solar triplet    (τm = τ · m) of approximately 7.3 is computed by the natural
AOD will be removed for all wavelengths from Level 1.0 and         logarithm of 1500 (i.e., ln(15 000/10)) for Cimel model T in-
subsequent levels due to potential solar tracking accuracy is-     struments. For non-model T instruments, the 100 DN thresh-
sues.                                                              old for 870 and 1020 nm limits the τm to approximately 5.0

www.atmos-meas-tech.net/12/169/2019/                                                     Atmos. Meas. Tech., 12, 169–209, 2019
176                                                    D. M. Giles et al.: Advancements in the AERONET version 3 database

Figure 2. Spectral-dependent low digital number removal at NASA Goddard Space Flight Center (GSFC; lat 38.99, long −76.84).
(a) Level 1.0 AOD data from GSFC on 8 July 2002 are plotted for the Quebec forest fire smoke event. Significantly fewer Level 1.0 AOD
data are available for the shorter wavelengths near local sunrise (∼ 11:00 UTC) and sunset (∼ 23:30 UTC). (b) The distribution of the AOD
measurements with respect to optical air mass clearly shows the removal of short wavelengths for large air mass in this fine-mode aerosol
event. The high aerosol loading due to smoke and haze results in significant extinction at UV and visible wavelengths, which corresponds
to low digital counts. The low digital count quality control removes AOD measurements impacted by diffuse radiation scattered into the
instrument field of view (Sinyuk et al., 2012).

(i.e., ln(15 000/100)) for only those two wavelengths. The             optics and digital counts can have dependence on the sen-
τm maximum threshold applies to all channels; however, the             sor head temperature (TS ), which is saved with each mea-
signal count can decrease significantly with optical air mass          surement triplet. Sensor head temperatures may be erro-
and depend on the wavelength dependence of VO . For val-               neous due to instrument electronic instability or communi-
ues exceeding the τm maximum threshold, the diffuse radi-              cation issues. These potentially unphysical values of TS are
ation increases the signal and, as a result, unfiltered AODs           evaluated by a number of algorithm steps such as checks
show a decrease in magnitude as optical air mass increases             for (1) constant TS values, (2) unphysical extreme high or
for high AOD even when DN(VD ) equals zero. A measured                 low TS , (3) potentially physical yet anomalously low TS
solar DN(V ) lower than the ratio DN(VO )/1500 threshold               with respect to the NCEP/NCAR reanalysis ambient temper-
will result in the removal of the solar triplet AOD for the            atures, and (4) unphysical TS decreases (dips) or increases
specific wavelength (Fig. 2).                                          (spikes). When the algorithm removes a TS reading or the
                                                                       TS measurement is missing, an assessment is made on the
3.1.3   Digital number triplet variance                                instrument temperature response based on ±15 ◦ C of the
                                                                       NCEP/NCAR reanalysis temperature for the date and loca-
As mentioned in Sect. 2, the Cimel instrument performs a               tion to determine whether the temperature characterization
direct Sun triplet measurement at regular intervals through-           coefficient for a specific wavelength would result in a change
out the day. A variance threshold is applied based on the              of AOD by more than 0.02. If this condition is met for a spe-
root-mean-square (RMS) differences of the triplet measure-             cific wavelength, then data associated with this wavelength-
ments relative to the mean of these three values. If the               specific triplet measurement will be removed at Level 1.5 and
(RMS/mean) · 100 % of the DN triplet values is greater than            subsequent levels while preserving other less-temperature-
16 %, then these data are not qualified as Level 1.0 AOD (Eck          dependent spectral triplet measurements.
et al., 2014). The DN temporal variance threshold is sensitive
to clouds with large spatial-temporal variance in cloud opti-
                                                                       3.1.5   Eclipse circumstance screening
cal depth and optically thick clouds such as cumulus clouds
as well as issues due to poor tracking of the instrument.
                                                                       During episodic solar or lunar eclipses, AOD will increase
3.1.4   Sensor head temperature anomaly identification                 to the maximum obscuration of the eclipse at a particular lo-
                                                                       cation on the Earth’s surface. The AOD increases due to the
Each Cimel instrument has a fixed resistance (model 4) or              reduction of the irradiance and the celestial body (Moon or
band gap (models 5 and T) temperature sensor inside the op-            Earth) obscuring the calibrated light source (Sun or Moon).
tical head within 0.5 cm of the detector, filter wheel, and op-        While any one point on Earth infrequently experiences an
tical train assembly. As discussed in Sect. 2, the instrument          eclipse, when an eclipse episode does occur, the eclipse can

Atmos. Meas. Tech., 12, 169–209, 2019                                                      www.atmos-meas-tech.net/12/169/2019/
D. M. Giles et al.: Advancements in the AERONET version 3 database                                                                     177

affect many locations nearly simultaneously, making man-
ual removal tedious at sites distributed globally. To auto-
mate the removal of eclipse episodes, the NASA solar and
lunar eclipse databases are queried for eclipse circumstances
based on geographic position of the site to produce a table
of eclipse episodes starting from 1992. The eclipse tool uti-
lizes established Besselian elements based on the Five Mil-
lennium Canon of Solar Eclipses: −1999 to +3000 (Espe-
nak and Meeus, 2006) to quantify the geometric and tempo-
ral position of the celestial bodies (Sun, Earth, and Moon),
determine the type of eclipse (e.g., partial, annular, total),
and predict times of the various stages of the solar or lunar
eclipse. For the Version 3 database, the eclipse site-specific
tables are used to discretely remove triplet measurements af-
fected by any stage of the eclipse circumstance. For exam-
ple, during a solar eclipse, solar triplets will be removed be-
tween the partial eclipse first contact and the partial eclipse
last contact regardless of the eclipse obscuration or magni-        Figure 3. Eclipse circumstance at the NASA Goddard Space Flight
tude for Level 1.5 data and subsequent levels (Fig. 3). The         Center (GSFC; lat 38.99, long −76.84) on 25 December 2000 be-
                                                                    tween 16:04:13 and 19:16:25 UTC. The maximum AOD during the
partial eclipse first contact is defined as the time at which the
                                                                    eclipse occurs at the maximum obscuration of 0.42, which results
penumbral shadow is visible at a point on the Earth’s sur-          in a change of ∼ 0.28 for AOD at 500 nm compared to data be-
face and the partial eclipse last contact is defined as the time    fore and after the solar eclipse. Utilizing the NASA Solar Eclipse
at which the penumbral shadow is no longer a visible point          database, the AOD measurements are removed between the partial
on the Earth’s surface. Efforts to retain AOD during solar          eclipse first contact and partial eclipse last contact as denoted by the
eclipse episodes have been attempted by the authors in which        vertical dashed lines.
up to 95 % of the AOD can be corrected based on adjusting
calibration coefficients by the eclipse obscuration. However,
spectral calibration coefficients also need to be adjusted to       3.1.7   Total potential daily measurements
account for the solar atmosphere spectral irradiance, which
becomes more dominant during the solar eclipse episode and          Cloud-screening methods in Sect. 3.2 may incompletely re-
is a topic of further investigation.                                move all cloud-contaminated points and leave data frag-
                                                                    ments. To mitigate this issue, a methodology was developed
3.1.6   Very high AOD retention                                     based on the total number of potential measurements in the
                                                                    day and calculated AE values. The total number of poten-
Cloud-screening procedures in the next section may inadver-         tial measurements in the day is defined as the number of
tently remove aerosol in very high aerosol loading cases due        triplet measurements plus the number of wet sensor acti-
to biomass burning smoke and urban pollution as discussed           vations. If the number of remaining measurements after all
by Smirnov et al. (2000). For Version 3, each triplet reach-        screening steps in Sect. 3.2 are performed is less than three
ing Level 1.0 is evaluated for possible retention in the event      measurements or less than 10 % of the potential measure-
that a specific Level 1.5 cloud-screening procedure removes         ments (whichever is greater), then the algorithm will remove
the triplet. When the AOD measurement for 870 nm is > 0.5           the remaining measurements. This condition is repeated after
and AOD 1020 nm > 0.0, these conditions will potentially            each cloud-screening step in Sect. 3.2 and will only be acti-
qualify the triplet for very high AOD retention. Further anal-      vated when the very high AOD restoration is not triggered
ysis is performed on those qualified triplets to remove the         (see Sect. 3.1.6) or when the AE440−870 nm is less than 1.0
effect of heavily cloud-contaminated data using the AE for          for a triplet measurement, indicating large particles such as
the wavelength ranges of 675–1020 or 870–1020 nm (Eck et            clouds may contaminate the remaining measurements.
al., 1999). If the AE675−1020 nm 1.2 (or AE870−1020 nm > 1.3,
if AOD675 nm is not available), and the AE for the same range       3.1.8   Optical air mass range
is less than 3.0, then the triplet qualifies for very high AOD
retention and the triplet can be retained at Level 1.5 even         The basic Cimel Sun photometer Sun and sky measurement
if the measurement does not pass Level 1.5 cloud-screening          protocols were specified to NASA requirements in Holben
quality control steps in Sect. 3.2.                                 et al. (1992, 1998, 2006) and have only been slightly modi-
                                                                    fied since that time for improved measurement capability of
                                                                    the model 5 and model T instruments (Barreto et al., 2016).
                                                                    All instruments systematically perform direct Sun measure-

www.atmos-meas-tech.net/12/169/2019/                                                       Atmos. Meas. Tech., 12, 169–209, 2019
178                                                                       D. M. Giles et al.: Advancements in the AERONET version 3 database

ments between the optical air mass (m) of 7.0 in the morn-                              (τeclipse ), and instrument anomalies (0anomaly adjustment fac-
ing and m of 7.0 in the evening. In Version 2 and earlier                               tor). Given cloud-free conditions and perfect instrument op-
databases, AERONET data processing limited the Level 1.5                                eration, the additional non-aerosol τ components would be
and Level 2.0 AOD computation from m of 5.0 in the morn-                                zero and Ccirrus and 0anomaly would be 1. However, the Cimel
ing to m of 5.0 in the evening. The m limitation may avoid                              Sun photometer always attempts to measure the Sun if it can
potential error in the computation of the optical air mass at                           be tracked regardless of the total optical depth magnitude.
large solar zenith angles (Russell et al., 1993) and possible                              Clouds are a major factor in the effort to quality control re-
increased cloud contamination (Smirnov et al., 2000). For                               motely sensed aerosol data (Smirnov et al., 2000; Martins et
Version 2 and 3 processing, the Kasten and Young (1989)                                 al., 2002; Kaufman et al., 2005; Chew et al., 2011; Kahn and
formulation was used to account for very small differences                              Gaitley, 2015). A significant portion of the liquid cloud con-
in the optical air mass calculations at high solar zenith an-                           tribution is removed by the prescreening prior to Level 1.0
gles. Noting that the AOD error (δτ/m) has a minimum at                                 as discussed in Sect. 3.1.3. The τapp Total should be adjusted
large m values (conversely a maximum at solar noon), the                                based on a multiplier dependent on the cirrus crystal size
maximum m of 5.0 was extended to m of 7.0 in Version 3                                  (τcorrect = Ccirrus · τapp Total ) according to Kinne et al. (1997).
processing. The larger optical air mass range leads to an                               While this cirrus coefficient (Ccirrus ) is not specifically mod-
increase in the number of solar measurements occurring in                               eled by Kinne et al. (1997) for the Cimel instrument field
the early morning and the early evening contributing to ad-                             of view half angle of 0.6◦ , this multiplier is likely to be
ditional AOD measurements used for input for almucantar                                 close to 1 for small cirrus crystals (e.g., reff = 6–16 µm), but
and hybrid inversions plus an increase in AOD measurements                              near 2 for larger cirrus crystal sizes (e.g., reff = 25–177 µm).
at high-latitude sites when solar zenith angles may be large                            These adjustment factors would result in the reduction of the
even at solar noon. The impact on the cloud-screening perfor-                           τapp Total due to forward scattering in the presence of cirrus.
mance appears to be minimal for measurements closer to the                              Conversely, liquid water cloud droplets would significantly
horizon. The fidelity of the Version 3 cloud-screening (see                             increase the τapp Total in a manner similar to large dust parti-
Sect. 3.2) AODs supports the extended optical air mass range                            cles.
for Level 2.0.                                                                             Cimel instruments may also have internal and external
                                                                                        anomalous conditions that modify the optical characteristics
3.2    Level 1.5 AOD cloud-screening quality controls                                   or response of the instrument, resulting in amplification or
                                                                                        dampening impacts (0anomaly ) of varying magnitudes on the
As discussed in Sect. 3.1, several preprocessed criteria and                            computation of the τapp Total . These anomaly adjustments can
parameters are necessary to quality control the AOD data                                be difficult to quantify and can have strong dependence on
quality in near real time. Cloud-screening procedures pro-                              optical air mass (m) or the sensor head temperature (TS ).
posed by Smirnov et al. (2000) were designated to remove or                             As a result, the following sections will describe the mech-
reduce cloud-contaminated AOD measurements. However,                                    anisms in which these additional cloud and anomaly compo-
these procedures also had the effect of surreptitiously oc-                             nents are automatically eliminated or reduced to as close to
casionally removing other non-cloud anomalies such as re-                               zero as possible to provide a quality-assured AOD (τaerosol )
peated AOD diurnal dependence when AOD had a large max-                                 after final calibration is applied (see Sect. 4) across the global
imum at midday and minimum at high optical air masses due                               AERONET AOD database.
to environmental impacts on the optical characteristics of the
instrument (e.g., moisture on the sensor head lens or spider                            3.2.1   Cloud-screening quality controls
webs in the collimator tube). While these cloud-screening
methods have been implemented for about 25 years, the state                             As Level 1.0 AOD data may have cloud contamination,
of knowledge has progressed over this period and thus ne-                               these data should be considered potentially cloud contami-
cessitates review and modification of cloud-screening quality                           nated where the triplet measurement represents the apparent
control procedures (Kaufman et al., 2005, Chew et al., 2011;                            AOD (τapp aerosol ) as defined in the previous section. Table 2
Huang et al., 2011). The calculation of the AOD at Level 1.0                            provides a summary of the cloud-screening quality control
essentially represents the following in Eq. (9):                                        changes from Version 2 to Version 3 and these changes are
                  1

                                           τcirrus
                                                                                       discussed in detail below and Sect. 3.2.2.
τapp Total =                  τaerosol +           + τliquid cloud + τeclipse ,   (9)      Cimel triplet measurements are performed typically ev-
               0anomaly                    Ccirrus
                                                                                        ery 3 min (every 15 min for older instrument types) and
where τapp Total is the apparent total optical depth, which at                          these triplet measurements can detect rapid changes in the
this point in the data processing may be affected by the con-                           τapp aerosol by analyzing the maximum to minimum variabil-
tributions of liquid cloud droplets (τliquid cloud ), cirrus am-                        ity (i.e., the 1τapp aerosol {MAX–MIN}). Assuming that spa-
plification factor (Ccirrus ) applied to the cirrus crystal op-                         tial and temporal variance of aerosols plus clouds is much
tical depth (τcirrus ) due to strong forward scattering into                            greater than aerosols alone, in many cases, 1τaerosol would
the field of view of the instrument, solar or lunar eclipses                            be near zero and 1τcloud should be much larger than zero

Atmos. Meas. Tech., 12, 169–209, 2019                                                                        www.atmos-meas-tech.net/12/169/2019/
D. M. Giles et al.: Advancements in the AERONET version 3 database 179
Table 2. Summary of cloud-screening-related quality control changes from Version 2 to Version 3.
Algorithm/parameter Version 2 Version 3
Very high AOD restoration n/a τ 870 > 0.5; α675 − 1020 > 1.2 or α870 − 1020 > 1.3, restore if
eliminated by cloud screening
Optical air mass range Maximum of 5.0 Maximum of 7.0
Number of potential Nremain < 3, reject all After all checks applied, reject all measurements in the
measurements measurements in the day day if Nremain < MAX{3 or 10 % of N }
Triplet criterion All wavelengths AOD triplet variability > MAX{0.01 or 0.015 · τaerosol }
checked; AOD triplet for 675, 870, and 1020 nm wavelengths simultaneously
variability > MAX{0.02
or 0.03 · τaerosol }
Ångström exponent (AE) n/a If AE440−870 nm < −1.0 or AE440−870 nm > 3.0, then eliminate
limitation triplet measurement.
Smoothness check D < 16 For AOD 500 nm (or 440 nm) 1τaerosol > 0.01 per minute,
then remove larger τaerosol in pair. Repeat condition for
each pair until points are not removed.
Solar aureole radiance n/a Using 1020 nm solar aureole radiances, compute the
curvature check curvature (k) between 3.2 and 6.0◦ scattering angle (ϕ)
(Sect. 3.2.2) at the smallest scattering angle. If k < 2.0 × 10⁻⁵ ϕ and if
slope of curvature (M) is greater than 4.3 (empirically
determined), then radiances are cloud contaminated. For
sky scan measurements, all τaerosol measurements are
removed within 30 min of the sky measurement. For
Model T, special aureole scan measurements will
remove all τaerosol within a 2 min period
superseding any sky scan aureole measurements.
Stand-alone measurements n/a If no data exist within 1 h of a measurement, then reject
it unless AE 440–870 nm > 1.0.
AOD stability check Same as Version 3 If daily averaged AOD 500 nm (or 440 nm) has σ less than
0.015, then do not perform 3-σ check.
3-σ check Same as Version 3 AOD 500 nm and AE 440–870 nm should be within the
MEAN ± 3σ ; otherwise, the points are rejected.
n/a = not applicable.
when especially liquid-phase cloud droplets exist. For Ver- Considering these factors, several potential techniques
sion 2 and earlier databases, Smirnov et al. (2000) methodol- were explored utilizing various wavelength combinations
ogy utilized all available wavelengths to perform τapp aerosol and utilizing the spectral deconvolution algorithm (SDA)
triplet screening for cloud contamination. Therefore, large fine- and coarse-mode triplet separation (O’Neill et al., 2001,
triplet variability would indicate the presence of clouds due 2003). While the SDA-algorithm-derived triplets for coarse-
to large 1τcloud . Analyses (e.g., Eck et al., 2018) have shown mode AOD relative change tended to show utility in cloud
that removing the entire triplet measurement when only one removal, the SDA algorithm itself could not be applied uni-
or more of the shorter wavelengths indicates a large variation versally to the AERONET database due to anomalous re-
(1τaerosol (λ) much greater than zero) may not be the most sults in which fine- and coarse-mode AODs can have a neg-
robust approach. For example, cases of highly variable fine- ative relationship when the number of available wavelengths
mode aerosols such as smoke can produce large triplet vari- or wavelength range is not satisfied. Anomalies in SDA re-
ability as a result of the inhomogeneous nature of the aerosol trievals can occur when the uncertainty in AOD is relatively
plume, especially for shorter wavelengths (e.g., 340, 380, large near solar noon compared to the magnitude of AOD as
440 nm) at which fine-mode-dominated aerosol particles can is sometimes the case when only the pre-field deployment
have radii similar to short wavelength measurements. calibration has been applied. Upon further consideration of
www.atmos-meas-tech.net/12/169/2019/ Atmos. Meas. Tech., 12, 169–209, 2019You can also read