Ausgabe 2/2020 - Sciamus - Sport und Management
←
→
Page content transcription
If your browser does not render page correctly, please read the page content below

Ausgabe 2/2020

Impressum

 Herausgeber Prof. Dr. Frank Daumann
 Prof. Dr. Benedikt Römmelt

 Editorial Board Prof. Dr. Gerd Nufer
 Prof. Dr. André Bühler
 Prof. Dr. Rainer Cherkeh

 Reviewer Board Prof. Dr. Markus Breuer
 Prof. Dr. Michael Dinkel
 Prof. Dr. Eike Emrich
 Prof. Dr. Albert Galli
 Prof. Dr. Andreas Hebbel-Seeger
 Prof. Dr. Gregor Hovemann
 Prof. Dr. Gerhard Schewe

 Chefredakteur/ Dr. Anne Engelhardt
 Editor-in-Chief E-Mail: redaktion@sciamus.de

 Layout/ Design Dr. Anne Engelhardt

 Verlag/ Publisher Sciamus GmbH
 Waldsteinweg 14
 D-95182 Döhlau
 E- Mail: redaktion@sciamus.de

 Erscheinungsweise Die Zeitschrift Sciamus – Sport und Management erscheint mehrmals
 jährlich; die Themenhefte erscheinen in unregelmäßigen
 Abständen.

 Für Autoren/ Wenn Sie Interesse an der Veröffentlichung eines eigenen Beitrages
 Anzeigen haben oder eine Anzeige schalten möchten, können Sie über die
 folgende Adresse Kontakt mit uns aufnehmen:

 Sciamus GmbH
 Waldsteinweg 14
 D-95182 Döhlau
 - Redaktion -

 E-Mail: redaktion@sciamus.de

 ISSN 1869-8247
 Ausgabe 2/2020
 © 2010 - 2020 Sciamus GmbH, Döhlau

 Copyright Die Zeitschrift und alle in ihr enthaltenen Beiträge und Abbildungen
 sind urheberrechtlich geschützt. Jede Verwertung außerhalb der
 Grenzen des Urheberrechtsgesetzes ist unzulässig. Der Nachdruck
 sowie die Übersetzung und andere Verwertungen sind nur mit
 ausdrücklicher Genehmigung der Redaktion und des Verlages unter
 Angabe der Quellen gestattet.

 Elektronische www.sport-und-management.de
 Volltexte

Inhaltsverzeichnis

Christoph Bühren, Tim Meyer & Christian Pierdzioch
Experimental evidence on forecaster (anti-)herding in sports
markets….…………………………………………………………………………… 1

Florian Follert , Frank Daumann & Lana Passon
Zur Bedeutung der Fans im professionellen Fußball im Lichte der CO-
VID-19-Pandemie………………………………………………………………….. 28

Lukas Richau
Allokation von Spielertalent im Fußball – Eine Analyse der
Wettbewerbsausgeglichenheit in Europas Top-
Ligen………………………………………………....................................... 50

Rainer Cherkeh
Buchvorstellung – 4. Auflage des „PRAXISHANDBUCH SPORT-
RECHT“………………………………………………………………………………. 79

1

Christoph Bühren, Tim Meyer & Christian Pierdzioch

Experimental evidence on forecaster
(anti-)herding in sports markets
Abstract

We experimentally analyzed whether (anti-)herding behavior of forecasters in sport-
betting markets is influenced by the incentive structure of the market (winner-takes-
all vs. equal payment of most accurate forecasts) and by personal traits of forecasters.
We found evidence of anti-herding in forecasts of the German Bundesliga. Self-
reported knowledge and, more surprisingly, winner-takes-all incentives reduced
anti-herding. On average, forecasts were less accurate with stronger anti-herding.
Winner-takes-all incentives and self-reported knowledge improved forecasts.

Schlüsselwörter: (Anti-)Herding, Sports forecasting, Experiment, Survey data

1. Introduction

In recent years, several researchers have studied forecasting efficiency in sports
markets. Leitner et al. (2010), e.g., report that the bookmaker consensus model
correctly predicted that the final of the UEFA European Championship in 2008 would
be Spain vs. Germany. Inefficient sports-betting markets lead to enormous welfare
losses: The global sports-betting and gaming group GVC (including Bwin) announces
revenues of nearly 3 billion £ and a gross profit of over £ 2 billion in 20181. Analyzing
the Betfair betting market (revenue of £ 475.6 million £), Deutscher et al. (2017) find
evidence for match-fixing in the German Bundesliga from 2010 to 2015 – a
phenomenon that is more likely to occur in inefficient betting-markets.

One potential source of inefficiencies is (anti-)herding behavior of forecasters.
Deschamps and Gergaud (2008) observe that French tipsters' forecasts of horse races
are excessively original, exaggerated, distant from public information, and inefficient.
They show that most tipsters try to "anti-herd". In the same vein, Spann and Skiera
(2009) show that prediction markets and betting odds both strongly outperform the
accuracy of tipsters' forecasts for the Bundesliga. Whereas Dixon and Pope (2004)
calculate that published odds in the UK soccer betting markets are inefficient, Forrest
et al. (2005) argue that experts' forecasts of English soccer games, measured by odds,

1
 See GVC, 2019.

SCIAMUS – Sport und Management 2/2020

2

are efficient over 5 years. For English and Scottish soccer matches, Forrest and
Simmons (2000) report that three newspaper tipsters outperform the accuracy of
random forecasting methods and that a consensus of the three tipsters is more precise
than any single forecast.

Forecaster herding has been analyzed in many different contexts. Recent
contributions, for example, analyze markets for crypto-currencies and find evidence
for herding behavior of investors, who seem to imitate other’s decisions disregarding
their own beliefs.2 While Yarovaya and Matkovskyy (2020) confirm this result, they
reject their hypothesis that the COVID-19 pandemic amplifies herding tendencies in
markets for crypto-currencies.

In the general forecasting literature, there is an ongoing debate on whether evidence
of clustering of forecasts around a consensus forecast indicates herding behavior or
rather reflects influences like correlated information, market-wide shocks, or
systematic optimism/pessimism of analyst3. Controlling for such influences, Bernhardt
et al. (2006) find evidence of anti-herding of stock-market analysts 4 . Similarly,
Pierdzioch and Rülke (2012), using the U.S. Livingston survey data, report evidence of
anti-herding of stock-market forecasters. Forecaster anti-herding has also been
observed for forecasts of metal prices5, exchange-rate forecasts6, forecasts of inflation
rates7, and business-cycle forecasts8.

In general, evidence of forecaster herding is likely to depend on how a researcher
models the information set available to a forecaster at the time a forecast is being
made9 because the information set defines the consensus forecast that may anchor a
forecast. Controlling for a forecaster's information set is possible in an experimental
setting.

Meub et al. (2015) conduct a lab experiment on strategic coordination in a neutral
forecasting task. In their experimental design, they introduce (monetary) incentives
for coordination and indeed observe herding-behavior. Meub et al. (2015) conclude
that opposite incentive structures might foster anti-herding. In a large online
experiment, Drehman et al. (2007) also use treatments with payoff externalities that

2
 Ballis & Drakos, 2020; Gurdgiev & O‘Loughlin, 2020; Amirat & Alwafi, 2020; Haryanto et al., 2020; Da
Gama Silva et al., 2019.
3
 Bernhardt, Campello & Kusoati, 2006; for models of forecaster (anti-)herding, see Scharfstein & Stein,
1990; Laster, Bennet, & Geoum, 1999.
4
 For earnings forcecasts of German analysts, see Naujoks, Aretz, Kerl & Walter, 2009.
5
 Pierdzioch, Rülke & Stadtmann, 2013.
6
 Pierdzioch, Rülke & Stadtmann, 2012.
7
 Pierdzioch & Rülke, 2013.
8
 Rülke, Silgoner & Wörz, 2016.
9
 e.g., Pierdzioch, Reid & Gupta, 2016.

SCIAMUS – Sport und Management 2/2020

3

should trigger coordination (“Network” and “Follower”) on the one hand, and
discoordination (“Early Bird” and “Hipster”) on the other hand. In Network (Follower),
subjects receive additional payment for every group member (every follower) with
the same forecast. In Early Bird, subjects had to pay for every predecessor with the
same forecast, and Hipster was a combination of Early Bird and Follower. Drehman et
al. (2007) observe extreme herding behavior in Network, herding in Follower, and
anti-herding in Early Bird and Hipster. Thus, the incentive structure of the market is
highly likely to influence herding or anti-herding behavior. In our experiment, we
introduce winner-takes-all incentives vs. equal payment of most accurate forecasts.
According to the results of Meub et al. (2015) and Drehmen et al. (2007), winner-takes-
all incentives should foster anti-herding.

Our study aims to contribute to recent experimental research on forecaster (anti-)
herding. In doing so, we combine methods of the general forecasting literature10 with
experimental methods11. This is new in both streams of the literature and important:
Fildes (2015), e.g., argue that interdisciplinary research, including an experimental
approach, is needed for any decomposition of a forecast error (e.g., into psychological
and organizational factors).

In our online-experiment, we found evidence of anti-herding in forecasts of the
German Bundesliga. We show that the anti-herding behavior of forecasters in sport-
betting markets is influenced by the incentive structure of the market and by personal
traits of forecasters. These results are likely also relevant in other markets where
herding or anti-herding can be observed.

2. Experiment
2.1. Procedure

The participants were recruited online via university mailing lists several weeks
before the start of the 2015/2016 Bundesliga season. The list of participants consisted
of students and academic staff. Participants were informed about the betting game
itself, its rules, and its course over the first eight matchdays of the season. They were
guaranteed anonymity, given an individual ID number, and assured that the generated
data would only be used for scientific purposes.

The game comprised eight match days, which were equal to the first eight matchdays
of the Bundesliga. We chose the first eight matchdays because at the beginning of the
season, as opposed to the end of the season, there are a lot of changes in the ranking
of the teams. We sent out a notification e-mail to the participants every Wednesday

10
 Bernhardt et al., 2006; Pierdzioch et al., 2012.
11
 Drehmann, Oechssler & Roider, 2007; Meub, Proeger, Bizer, Spiwoks, 2015.

SCIAMUS – Sport und Management 2/2020
4

morning, asking them to give their predictions by Friday noon, several hours before
the start of the match day. Participants had to answer questions regarding the
expected position in the ranking of all eighteen teams after the current (short-term
forecasts) and after the eighth matchday (longer-term forecasts). Both questions were
set up as drag-and-drop questions. All eighteen teams of the Bundesliga were
displayed on the left side of the screen in random order to avoid order effects. They
could be dragged over to the right side and put in the order anticipated by the
participant. At the bottom of the screen, the participants were then additionally asked
to state their confidence level on a scale from 0 to 100. The experiment was
implemented using the free online survey SoSci Survey12.

We implemented four different treatments during the eight matchdays. An overview
is given in Table 1. Initially, we provided no additional information, neither within the
notification e-mails nor within the online experiment. On match days three to six, we
provided additional information, which was available for the participants upon
request, i.e., they had to actively follow a link to open the document containing the
information. In this way, we were able to track what additional information our subjects
used. Five different pieces of additional information were provided:

1. The average predicted Bundesliga ranking of a team on the previous matchday

2. A historical Bundesliga ranking, showing the historical average ranking of a team
after the eighth matchday of the season

3. The current ranking of the Bundesliga after the previous match day

4. The ranking of the best single predictions of the previous match day

5. The overall betting game ranking of our subjects

 Matchday Add. Information Payoff Scheme
 1 No Equal
 2 No Equal
 3 Yes Equal
 4 Yes Equal
 5 Yes Winner-takes-all
 6 Yes Winner-takes-all
 7 No Winner-takes-all
 8 No Winner-takes-all
 Table 1: Treatments

12
 Leiner, 2014.

SCIAMUS – Sport und Management 2/2020
5

We provided information on the overall game ranking and the best single bets of the
previous match days because the most successful participants would benefit from a
payoff at the end of the game. Participants were only paid out if they participated in
every round of the betting game. After the eighth matchday, the most successful
participants were given a financial payoff in the form of Amazon gift cards. The first
place got €20, the second place €15, and the third place €10. Additionally, the best
participants of every match day were rewarded with a voucher(s) for in total €15: For
the first four match days, the amount was equally divided between the three best
participants (payoff scheme: equal). For the last four match days, the payoff scheme
for the best bets of the current match day was changed to winner-takes-all (, and we
paid out only one participant). We calculated the participants’ ranking within the
betting game by loss points. Each forecaster was assigned a loss-point account based
on an individual ID number. Every week, the squared deviation of the predictions from
the actual positions of the Bundesliga teams in the ranking was added to the account
in the form of loss points. The participant with the fewest loss points led the ranking.

Our experimental design is related to the lab experiments of Meub et al. (2015) and
Lehman et al. (2007).13 Moreover, it shares some features of the online-experiment via
mTurk by Bhanot and Williamson (2020), who show that subjects tend to switch to the
most popular answer in trivial pursuit questions – and thus tend to herd – if there are
financial incentives to be correct. Similar to our design, Bhanot and Williamson (2020)
also vary the information on others’ “forecasts” (by revealing the most popular answer
or not) and the incentives (from $0 to $3 if the answer to a randomly selected question
is correct). The correctness of our subjects’ forecasts is always incentivized.
Additionally, we try to vary the incentives to herd or anti-herd with our payoff schemes
equal payment and winner-takes-all.

2.2. Descriptive statistics

After the initial recruitment phase, 215 respondents registered for the game. In total,
148 participants started in the first week. The participation decreased over the course
of the game reaching its lowest numbers in weeks six and eight (see Figure 1).
Throughout the last four weeks, the number of participants remained at around 50. It
should be noted that the overall participation does not correspond to those
participants who played all rounds of the game. The forecasters were able to skip a
week and join in later again, yet they could not receive any payoffs then. 35
participants played all eight rounds. We call them completers.

13
 See Introduction.

SCIAMUS – Sport und Management 2/2020
6

 Figure 1: Participation

Table 2 presents the actual Bundesliga ranking over the first eight match days. The
sorting of the table is based on the final position after the previous season plus the
promoted teams from the 2nd Bundesliga on positions 17 and 18 (Column MD0).
Because FC Ingolstadt 04 was playing in the 2015/2016 Bundesliga season for the first
time in the Bundesliga, we could not compute the historical Bundesliga ranking for this
team and excluded it from our sample for further analyses.

SCIAMUS – Sport und Management 2/2020
7 Team MD 0 MD 1 MD 2 MD 3 MD 4 MD 5 MD 6 MD 7 MD 8 Mean Median FC Bayern München 1 1 2 2 2 2 1 1 1 1.50 1.50 0.53 VfL Wolfsburg 2 5 6 3 3 3 4 4 9 4.63 4.00 2.07 Borussia M'gladbach 3 17 18 18 18 18 16 14 13 16.50 17.50 2.00 Bayer 04 Leverkusen 4 5 3 6 13 13 11 5 7 7.88 6.50 3.91 FC Augsburg 5 13 14 15 14 14 14 16 16 14.50 14.00 1.07 FC Schalke 04 6 3 4 9 5 4 3 3 3 4.25 3.50 2.05 Borussia Dortmund 7 2 1 1 1 1 2 2 2 1.50 1.50 0.53 TSG 1899 Hoffenheim 8 11 16 14 15 15 17 15 15 14.75 15.00 1.75 Eintracht Frankfurt 9 11 12 8 4 8 12 11 12 9.75 11.00 2.87 SV Werder Bremen 10 16 15 11 6 9 13 13 14 12.13 13.00 3.31 1. FSV Mainz 05 11 13 8 5 10 7 9 12 8 9.00 8.50 2.62 1. FC Köln 12 4 5 4 8 5 7 7 5 5.63 5.00 1.51 Hannover 96 13 9 12 16 16 16 18 18 17 15.25 16.00 3.15 VfB Stuttgart 14 15 17 17 17 17 15 17 18 16.63 17.00 1.06 Hertha BSC 15 7 7 10 7 11 5 6 4 7.13 7.00 2.36 Hamburger SV 16 18 10 13 12 10 6 10 11 11.25 10.50 3.41 FC Ingolstadt 04 17 7 9 7 9 6 8 8 6 7.50 7.50 1.20 SV Darmstadt 98 18 9 11 12 11 12 10 9 10 10.50 10.50 1.20 Table 2: Actual Bundesliga Ranking Table 3 shows the median predicted ranking for all eighteen teams after the current (short-term forecasts) match day along with summary statistics. Table 4 summarizes the median predicted ranking and corresponding summary statistics for all eighteen teams after the eighth matchday (longer-term forecasts). SCIAMUS – Sport und Management 2/2020
8 Team MD 0 MD 1 MD 2 MD 3 MD 4 MD 5 MD 6 MD 7 MD 8 Mean Median FC Bayern München 1 1 1 2 2 2 2 1 1 1.50 1.50 0.53 VfL Wolfsburg 2 3 4 5 3 3 4 4 4 3.75 4.00 0.71 Borussia M'gladbach 3 9 10 15 14 18 17 15 14 14.00 14.50 3.12 Bayer 04 Leverkusen 4 4 5 5 4 12 10 6 5 6.38 5.00 2.97 FC Augsburg 5 8 13 10 16 14 14 14 16 13.13 14.00 2.80 FC Schalke 04 6 6 3 6 7 5 3 3 2 4.38 4.00 1.85 Borussia Dortmund 7 6 2 1 1 1 1 2 3 2.13 1.50 1.73 TSG 1899 Hoffenheim 8 14 16 12 14.5 15 16 17 15 14.94 15.00 1.52 Eintracht Frankfurt 9 15 11 13 9.5 6 9 7 10 10.06 9.75 2.96 SV Werder Bremen 10 11 14 15 11 6 9 13 13 11.50 12.00 2.93 1. FSV Mainz 05 11 6 15 7 7 7 8 11 11.5 9.06 7.50 3.12 1. FC Köln 12 11 7 4 5 7 5 6 9 6.75 6.50 2.31 Hannover 96 13 9 12 15 17 16 17 18 18 15.25 16.50 3.20 VfB Stuttgart 14 9 12 15 17 17 16 15 17 14.75 15.50 2.87 Hertha BSC 15 12 7 9 10 9 12 8 6 9.13 9.00 2.17 Hamburger SV 16 18 18 12 14 11 11 8 11 12.88 11.50 3.56 FC Ingolstadt 04 17 14 10 11 8.5 10 6 9 8 9.56 9.50 2.35 SV Darmstadt 98 18 12 13 14 12 12 13 12 9 12.13 12.00 1.46 Table 3: Median Predicted Bundesliga Ranking – Short-Term Forcecasts Team MD 0 MD 1 MD 2 MD 3 MD 4 MD 5 MD 6 MD 7 Mean Median FC Bayern München 1 1 1 1 1 1 1 1 1.00 1.00 0.00 VfL Wolfsburg 2 3 3 4 3 3 3 4 3.29 3.00 0.49 Borussia M'gladbach 3 5 6 9 11 15 16 15 11.00 11.00 4.51 Bayer 04 Leverkusen 4 4 5 3 4 7 7 6 5.14 5.00 1.57 FC Augsburg 5 10 11 12 14 14 13.5 14 12.64 13.50 1.65 FC Schalke 04 6 6 4 4 6 4 4 3 4.43 4.00 1.13 Borussia Dortmund 7 4 2 2 2 2 2 2 2.29 2.00 0.76 TSG 1899 Hoffenheim 8 10 11 12 13 16 16 16 13.43 13.00 2.57 Eintracht Frankfurt 9 11 10 12 9 6 8 7 9.00 9.00 2.16 SV Werder Bremen 10 10 12 13 10 6.5 9 13 10.50 10.00 2.36 1. FSV Mainz 05 11 9.5 13 9 8 9 8 10 9.50 9.00 1.71 1. FC Köln 12 12 9 7 6 8 6 7 7.86 7.00 2.12 Hannover 96 13 13 14 14 17 17 17 18 15.71 17.00 1.98 VfB Stuttgart 14 12 12 12 16 16.5 16 15 14.21 15.00 2.12 Hertha BSC 15 13 10 10 11 10 12 8 10.57 10.00 1.62 Hamburger SV 16 16 17 15 15 11 11 8 13.29 15.00 3.30 FC Ingolstadt 04 17 17 13 14 12 12 9 10 12.43 12.00 2.64 SV Darmstadt 98 18 16 16 16 15 13 13.5 12 14.50 15.00 1.66 Table 4: Median Predicted Bundesliga Ranking - Longer-Term Forecasts SCIAMUS – Sport und Management 2/2020
9

3. Testing for (anti-)herding
3.1. The herding statistic

We implemented a test developed by Bernhardt et al. (2006) to study whether the
participants of our experiment (anti-)herd. 14 The test measures the position of a
forecast relative to the consensus forecast. We measured the consensus forecast in two
ways. First, in a benchmark scenario, when we did not provide participants with any
additional information on the forecasts of other participants, then we used the position
of a team in the league table after the previous match day to measure the consensus
forecast. This information was always in the information set of every participant, and it
represents a scenario in which the best forecast of a team's future position in the league
table is a team's current position. Second, when we provided additional information,
and a participant inspected this information (we kept track of this), we measured the
consensus forecast using the average forecast - of the position of a team in the league
table after the previous match day - from all participants (made before the previous
matchday).

To explain how the test works15, we start by defining as a benchmark a situation in
which a participant forms a median-unbiased private forecast of a team's position in
the league table. The probability that such an unbiased forecast overshoots
(undershoots) the actual position of a team in the league table after the next match day
should be equal to 0.5, irrespective of the consensus forecast. 16 Similarly, the
conditional probability that a forecast above (below) the consensus forecast
overshoots (undershoots) a team's position in the league table after the next match day
should be 0.5.

A constituent feature of herding is that a published forecast is biased towards the
consensus forecast. Accordingly, if the biased published forecast exceeds the
consensus forecast then the probability that the forecast overshoots a team's position
in the league table after the next match day should be less than 0.5. By the same token,
if the biased published forecast is less than the consensus forecast then the probability
that the forecast undershoots a team's position in the league table after the next match
day also should be less than 0.5. In contrast, a constituent feature of anti-herding is that
participants try to differentiate their forecasts from the forecasts of others. Hence, in

14 Another extensively applied procedures for studying the herding behavior of investors are
regression models (see Christie and Huang, 1995; Chang et al., 2000). The key idea motivating these
regression models is that in the case of investor herding the cross-sectional dispersion of stock returns
should systematically decrease especially in periods of market turmoil. It should be quite obvious that
such regression models are less suited to study (anti-)herding behavior in the context of our
experimental setting than the procedure proposed by Bernhardt et al., 2006.
15
 For a detailed description, see also Rülke et al., 2016.
16
 This is not true for teams being first or last in the league table (see next subsection).

SCIAMUS – Sport und Management 2/2020
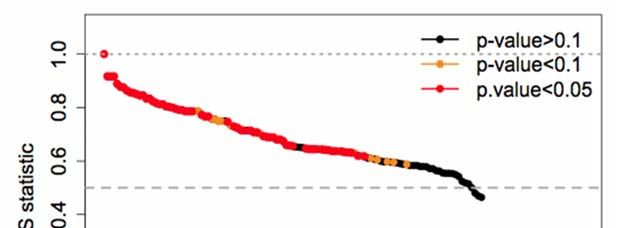
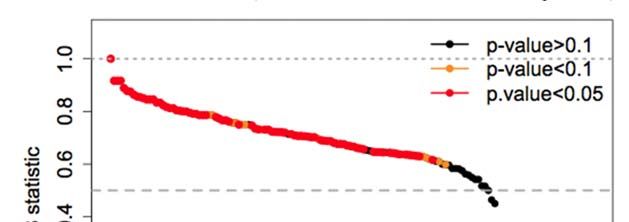
10

the case of anti-herding, the consensus forecast “repels” forecasts, and the over- and
undershooting probabilities should exceed 0.5.

The herding statistic, S, proposed by Bernhardt et al. (2006), is computed as the
average of the sample estimates of the overshooting and undershooting probabilities.
Accordingly, the S statistic is 0.5 for unbiased forecasts, the S statistic is smaller than
0.5 in the case of forecaster herding, and the S statistic exceeds 0.5 in the case of
forecaster anti-herding. Averaging the two probabilities makes the herding statistic
robust to various forms of "misspecification". For example, averaging the two
probabilities implies that the statistic does not depend on whether participants target
the median or the mean of a potentially asymmetric distribution over a team's position
in the league table after the next match day. The herding statistic has an asymptotic
normal distribution. The null hypothesis is that participants form unbiased forecasts.
Hence, under the null hypothesis, we have S=0.5. Bernhardt et al. (2006) show that the
variance of the herding statistic attains a maximum under the null hypothesis. In other
words, the herding statistic is conservative in the sense that, under the null hypothesis,
we maximize the difficulty to reject unbiasedness of forecasts.

3.2. Results

Figure 2 summarizes results for the S-statistic estimated on short-term forecasts. To
compute the figure, we sorted the S-statistic from left to right in descending order.
Panel A summarizes the results that we obtained when we used the position of a team
in the Bundesliga league table after the previous match day to approximate the
consensus forecast, irrespective of whether a participant used the average predicted
Bundesliga ranking of a team on the previous matchday (match days five through
eight). In this regard, it should be noted that the historical league table does not
necessarily present recent team strength, though the historical league table can be
interpreted as a rough summary statistic of past successes of teams and, therefore,
their popularity (and perhaps also their recent financial conditions). In any way, given
the limitations of the historical league table, we summarize in Panel B the results that
we obtained when we used (i) the position of a team in the Bundesliga league table
after the previous match day to approximate the consensus forecast when a participant
did not use additional information, and, (ii), the average predicted Bundesliga ranking
of a team on the previous matchday when a participant made use of this information
(match days five through eight).

Two results stand out. First, there is evidence of forecaster anti-herding. While the S-
statistic is significantly smaller than its benchmark value of 0.5 at conventional
significance levels for only one participant in Panel A and two participants in Panel B,
the majority of S-statistics is significantly larger than 0.5. Second, the curve in Panel B
showing the S-statistics computed based on a consensus forecast conditional on

SCIAMUS – Sport und Management 2/2020
11

whether a participant used additional information decreases somewhat faster than the
curve in Panel A showing the S-statistics based on a consensus forecast always
computed using the position of a team in the Bundesliga league table after the previous
matchday. This result mirrors findings reported by Pierdzioch et al. (2016) for
forecaster herding. They find that forecaster herding is strong when a forecaster's
information set contains no information on the contemporaneous forecasts of others,
and that evidence of forecaster herding weakens when they randomly allocate
forecasters into a group of early forecasters who can only observe the past forecasts
of others and late forecasters who can also observe the contemporaneous forecasters
of their predecessors. Correspondingly, our results indicate that forecaster anti-
herding tends to weaken when forecasters use the information on the consensus
forecasts on the previous matchday.

SCIAMUS – Sport und Management 2/2020
12

 Panel A: Short-term forecasts (consensus based on the historical league table)

 Panel B: Short-term forecasts (consensus based on average predicted ranking
 of a team on the previous matchday if a subject used this information)

 Figure 2: S-Statistic for Short-Term Forecasts

SCIAMUS – Sport und Management 2/2020
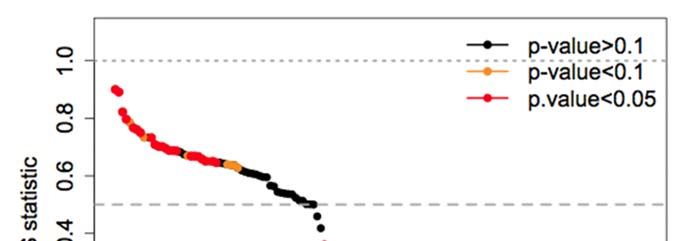
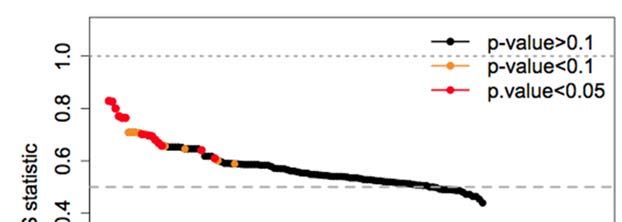
13

Figure 3 plots the results for longer-term forecasts. We focus on the results that we
obtained when we always used the position of a team in the Bundesliga league table
after the previous match day to approximate the consensus forecast. The results that
we obtained when we used additional information on the average predicted
Bundesliga ranking of a team on the previous matchday are similar (available upon
request from the authors). The key message to take home from Figure 3 is that, as
compared to the results plotted in Figure 2, the evidence of forecaster anti-herding is
weaker for longer-term forecasts than for short-term forecasts. The longer-term
forecasts reflect expectations of a team's position in the Bundesliga league table after
eight match days. A team's position in the league table after eight match days, in turn,
to some extent averages out idiosyncratic effects that may arise on individual match
days and is likely to reflect to a stronger extent the "fundamental" strength or
weaknesses of a team relative to the other teams in the Bundesliga. It is, therefore, not
surprising that the incentive to anti-herd is weaker for longer-term than for short-term
forecasts.

 Figure 3: S-Statistics for Longer-Term Forecasts

Figure 4 shows the S-statistic for short-term forecasts for the winner-takes-all payoff
scheme, where we computed the consensus forecasts taking into account whether a
participant used additional information on the average predicted Bundesliga ranking
of a team on the previous matchday. Because we used the winner-takes-all payoff
scheme only for match days five through eight, Figure 4 depicts results for fewer
participants than Figure 2 (Panel B). When comparing the figures, one should also bear
in mind that the figures display the ordered S-statistics, implying that the ordering of
the participants along the vertical axis is not identical across figures. Notwithstanding
this, eyeballing Figure 4 and comparing it with the S-statistics plotted in Figure 2

SCIAMUS – Sport und Management 2/2020
14

(Panel B) shows that a winner-takes-all payoff scheme, surprisingly, tends to lessen the
incentive to anti-herd.

 Figure 4: S-Statistic for Short-Term Forecasts (Winner-takes-all Payoff Scheme)

Figure 5 shows how the S-statistic evolves across match days, where the S-statistic was
computed taking into account whether a participant used additional information on the
average predicted Bundesliga ranking of a team on the previous matchday. The figure
shows the average of the S-statistic across participants who submitted forecasts for a
match day. As for short-term forecasts (Panel A), the S-statistic starts with a relatively
large value of around 0.8. The S-statistic takes values closer to its benchmark of 0.5 at
matchday three to six when participants had access to additional information. The S-
statistic climbs to a higher level when we again restricted access to additional
information, especially at matchday eight. For longer-term forecasts (Panel B), the S-
statistic shows a tendency to decrease across match days. It starts with a value of
around 0.6 on matchday two and ends at a value of around 0.4 on matchday eight.
Figure 5 also illustrates a limitation of our experimental study in that treatment effects
are interfered with round effects, especially for longer-term forecasts.

As a robustness check, we studied whether our results are sensitive as to whether we
exclude the top teams and the teams often ranked at the lower end of the league table
from our sample. For such teams, the probability that an unbiased forecast overshoots
(undershoots) the actual position of a team in the league table after the next match day
cannot be equal to 0.5. Specifically, we deleted FC Bayern München, Borussia
Dortmund, Borussia Mönchengladbach, Hannover 96, and VfB Stuttgart from the

SCIAMUS – Sport und Management 2/2020
15

sample. Results turned out to be qualitatively similar to the results plotted in Figures 2
to 4 (the results of the robustness check are not reported for the sake of brevity, but
are available from the authors upon request).
 Panel A: Short term forecasts

 Panel B: Longer-term forecasts

 Figure 5: Evolution of the S-Statistic across Match Days

SCIAMUS – Sport und Management 2/2020
16

 Forecast Horizon Individual S-Statistic Obs. Mean SD
 Short-term forecasts Consensus based only on 445 0.67 0.18
 historical information

 Short-term forecasts Consensus based on historical or 448 0.66 0.18
 additional information
 Longer-term forecasts Consensus based only on 397 0.55 0.13
 historical information
 Longer-term forecasts Consensus based on historical or 391 0.56 0.13
 additional information
Individual S-statistics are computed per participants and match day. Additional information = Subject
used information on the average predicted Bundesliga ranking of a team on the previous matchday.
 Table 5: Descriptive Statistics of Individual (Anti-)Herding Statistics

Table 5 summarizes the descriptive statistics of our individual (anti-)herding statistics
computed per round. In line with the figures presented in this subsection, the average
of the S-statistics is larger for short-term than for longer-term forecasters and, in the
case of the short-term forecasts, when only historical information was used to proxy
the consensus forecast.

4. Explaining (anti-)herding and forecast performance

To explain individual differences in anti-herding behavior, we used the individual S-
values of our subjects per round and regressed them on our two treatments (info vs.
no info and winner-takes-all vs. equal payment) as well as on the control variables of
our survey. 17 Panel A (Panel B) of Table 6 summarizes the results for short-term
(longer-term) forecasts, where we focused on those variables that turned out to be
significant in one or the other model. In line with the results reported in the last section,
we observed on average anti-herding behavior in our experimental data. Anti-
herding behavior tended to be stronger, on average, for short-term than for longer-
term forecasts.

According to Models (1) and (3) in Panel A, anti-herding in short-term forecasts was
reduced when we provided information and introduced the winner-takes-all rule.
Furthermore, women tended to exhibit less anti-herding behavior. Self-reported
knowledge of the Bundesliga also reduced anti-herding behavior. When we estimated
the regression model on data for those subjects who took part in every round
(completers in Models (2) and (4)), we found that knowledge of the Bundesliga was no
longer able to explain (anti-)herding behavior in our experiment. A possible reason
for this finding is that completers reported on average higher knowledge scores than
non-completers according to a two-sided t-test (7.74 vs. 7.36, p=0.06).

17
 The procedure, related literature, and results of our survey are reported in Bühren et al., 2020.

SCIAMUS – Sport und Management 2/2020
17

The individual S-values in Models (3) and (4) take into account whether a subject used
additional information on the average predicted Bundesliga ranking of a team on the
previous matchday. The results for these models show that completers exhibited less
anti-herding in short-term forecasts if they described themselves as being less risk-
averse.

Models (5) to (8) in Panel B look at the longer-term forecasts. Again, winner-takes-all
incentives reduced anti-herding. However, providing information strengthened anti-
herding behavior in the case of longer-term forecasts. Model (7), which calculates the
consensus taking into account whether a subject used information on the average
predicted Bundesliga ranking or not, confirms that anti-herding was reduced by being
female as well as by self-reported knowledge about the Bundesliga and by being less
risk-averse.
 Panel A: Short-Term Forecasts

 Model 1 Model 2 Model 3 Model 4

 S-statistic (Case A) S-statistic (Case A) S-statistic (Case B) S-statistic (Case B)
 (completers only) (completers only)

 Coef. t-test Coef. t-test Coef. t-test Coef. t-test

Info -0.12*** -8.3 -0.13*** -6.43 -0.16*** -11.36 -0.16*** -8.19
Winner-takes-all -0.08*** -5-53 -0.86*** -5.01 -0.05*** -3.97 -0.06*** -3.55
Female -0.06** -2-30 -0.24 -0.67 -0.05** -2.36 -0.04 -1.57
Knowledge -0.01*** -2.85 -0.01 -1.22 -0.01** -2.58 -0.01 -1.24
Risk-taking >-0.01 -0.61 -0.01 -1.44 -0.01 -1.28 -0.01** -2.21
Constant 0.89*** 18.14 0.89*** 10.99 0.89*** 18.62 0.91*** 12.28
R^2 0.17 0.18 0.22 0.21
F-test 27.25*** 13.14*** 43.97*** 24.73***
Obs. 445 243 448 244
t-tests were calculated using robust standard errors clustered by subject. *: p
18

 Panel B: Longer-Term Forecasts

 Model 5 Model 6 Model 7 Model 8

 S-statistic (Case A) S-statistic (Case A) S-statistic (Case B) S-statistic (Case B)
 (completers only) (completers only)
 Coef. t-test Coef. t-test Coef. t-test Coef. t-test
Info 0.03*** 3.23 0.04*** 3.07 0.03*** 2.88 0.04*** 3.05
Winner-takes-all -1.14*** -11.85 -0.14*** -8.99 -0.13*** -10.29 -0.13*** -7.84
Female -0.03* -1.82 -0.02 -0.99 -0.03** -2.41 -0.03* -1.78
Knowledge -0.01** -2.39 >-0.01 -0.80 -0.01** -2.5 >-0.01 -1.00
Risk-taking >-0.01 -1.53 -0.01 -1.20 -0.01** -2.17 -0.01 -1.52
Constant 0.67*** 19.04 0.63*** 10.44 0.68*** 20.41 0.65*** 11.09
R^2 0.31 0.29 0.27 0.26
F-test 40.93*** 24.52*** 33.27*** 21.33***
Obs. 397 210 391 204
t-tests were calculated using robust standard errors clustered by subject. *: p
19

 Model 1 Model 2

 Cumulated loss points Cumulated loss points
 (completers only)
 Coef. t-test Coef. t-test
 Info -195.34*** -9.42 -118.10*** -5.40
 Winner-takes-all -545.05*** -25.15 -500.76*** -25.57
 Optimism -24.40 -1.35 -46.89** -2.17
 Female -42.82 -0.96 -14.71 -0.30
 Knowledge -7.00 -0.80 -24.71** -2.10
 Risk-taking -26.01** -2.53 -27.27* -1.94
 Constant 1399.63*** 6.05 1563.86*** 5.29
 R^2 0.50 0.51
 F-test 183.81*** 186.98***
 Obs. 578 280
t-tests were calculated using robust standard errors clustered by subject. *: p
20

 Panel A: Short-Term Forecasts

 Model 1 Model 2 Model 3 Model 4

 Short term loss points Short term loss points Short term loss points Short term loss points
 (Case A) (Case A) (Case B) (Case B)
 (completers only) (completers only)
 Coef. t-test Coef. t-test Coef. t-test Coef. t-test
Info 12.17 0.97 18.73 1.35 27.42* 1.94 32.18** 2.06
Winner-takes- all -123.62*** -7.92 -107.07*** -6.71 -127.57*** -8.73 -108.75*** -7.53
Optimism -14.89 -1.40 -25.20** -1.93 -15.12 -1.45 -24.96* -1.97
Female -22.84 -0.86 -3.47 -0.12 -22.36 -0.84 2.67 0.09
Risk-taking -3.52 -0.76 -11.28* -1.72 -2.50 -0.56 -9.99 -1.61
Knowledge -15.73** -2.61 -12.50 -1.49 -15.89*** -2.71 -12.11 -1.50
S-statistic 279.65*** 4.84 208.31*** 3.19 312.99*** 5.60 257.01*** 3.95
Constant 331.1*** 3.02 442.11*** 3.03 302.80*** 3.06 391.40*** 3.01
R^2 0.42 0.49 0.43 0.51
F-test 50.61*** 54.70*** 59.24*** 71.68***
Obs. 445 243 448 244
t-tests were calculated using robust standard errors clustered by subject. *: p
21

 cont.
 Panel B: Longer-Term Forecasts

 Model 5 Model 6 Model 7 Model 8

 Longer-term loss points Longer-term loss points Longer-term loss points Longer-term loss points
 (Case A) (Case A) (Case B) (Case B)
 (completers only) (completers only)
 Coef. t-test Coef. t-test Coef. t-test Coef. t-test

Info -69.80*** -6.67 -56.57*** -4.96 -68.99*** -6.64 -60.15*** -5.30
Winner-takes-all -90.22*** -4.61 -86.95*** -4.36 -98.54*** -5.19 -87.71*** -4.73
Optimism -9.08 -0.91 -20.58** -2.04 -10.45 -1.02 -21.65** -2.13
Female -13.88 -0.52 -10.03 -0.33 -10.63 -0.40 -1.67 -0.05
Risk-taking -3.55 -0.84 -12.55** -2.12 -1.79 -0.41 -10.55* -1.74
Knowledge -12.20*** -2.46 -15.97** -2.47 -12.36** -2.46 -15.39** -2.41
S-statistic 610.67*** 7.04 582.78*** 5.71 582.31*** 7.08 599.07*** 6.21
Constant 290.20*** 3.28 442.80*** 5.04 308.87*** 3.44 426.51*** 4.85
R^2 0.49 0.56 0.49 0.58
F-test 64.68*** 31.94*** 72.31*** 32.57***
Obs. 397 210 391 204
t-tests were calculated using robust standard errors clustered by subject. *: p
22

The within-subject design of our experiment can be seen as a further limitation:
Participants likely learned from round to round. Two aspects of the design of our
experiment may have re-enforced this learning effect: i) successful participants in
early rounds were perhaps more likely to continue the experiment to the end to get
their payoffs, and, ii) forecasting in later rounds perhaps was easier than in earlier
rounds because the variation of possible rankings decreased and more information
became available. Thus, our treatment (and herding) effects may interfere with round
effects.

6. Discussion and conclusion

We analyzed forecasts of the team rankings in the German Bundesliga in an
experimental setting. We found evidence of anti-herding behavior for short-term
forecasts. Evidence of anti-herding behavior is weaker for longer-term forecasts.
Providing information on the average predicted Bundesliga ranking of a team on the
previous matchday reduced (increases) anti-herding for the short-term (longer-term)
forecasts. Winner-takes-all incentives reduced anti-herding for both forecasts.

On average, forecasts were less accurate the stronger the anti-herding behavior of
subjects. When we controlled for (anti-)herding behavior, winner-takes-all incentives
improved the quality of forecasts compared to the equal payoff scheme for both types
of forecasts. Providing information improved the performance of longer-term
forecasts. However, it worsened the performance of short-term forecasts when we
considered whether participants clicked on the information in calculating the (anti-
)herding statistic.

We combined our experimental data with questionnaire data on personal traits of our
subjects that we assessed before the experiment. Self-reported knowledge of the
Bundesliga reduced anti-herding and was positively associated with the performance
of forecasts in all specifications. Subjects who took part in every match day made
better short-term forecasts if they were more optimistic, and better longer-term
forecasts if they were less risk-averse.

In sum, our results show that in markets with evidence of anti-herding, forecasters who
are more optimistic, less risk-averse, and who claim to know more perform better.
Moreover, winner-takes-all incentives are better suited than equal payment schemes
to improve the average forecast accuracy if forecasters anti-herd. In future research,
further experimental evidence is needed to get an idea of whether our results can be
generalized to other settings and markets. For example, football is the most popular
sport in Germany. It is, therefore, interesting whether anti-herding and the treatment
effects we have documented in this research can also be detected in forecasting
experiments in which subjects forecast match outcomes or league rankings of less

SCIAMUS – Sport und Management 2/2020
23

popular sports like handball and volleyball. It is also interesting to study whether
results similar to those we have documented can be found not only for team sports but
also for individual sports. The negative correlation of anti-herding behavior and
winner-takes-all incentives also deserve special attention in future research - both in
experimental and in theoretical research.

Our findings have implications for the uncertainty of outcome literature18: We show
that behavioral biases, like anti-herding, reduce the accurateness of game outcome
predictions by individuals. The differences between objective and subjective
forecasts of game outcomes are likely to influence the demand for sports and might
explain differences between the practical relevance and the empirical findings of the
uncertainty of outcome hypothesis.

18
 See Coates, Humphreys & Zhou, 2014; Pawlowski, Nalbantis & Coates, 2018.

SCIAMUS – Sport und Management 2/2020
24

 Zu den Autoren
 Dr. Christoph Bühren vertritt die Professur für
 Volkswirtschaftslehre an der Technischen Universität Clausthal.
 An der Universität Kassel ist er Dozent für Verhaltensökonomik
 und Mitarbeiter im Fach-gebiet für angewandte Mikroökonomik.
 Seine Forschungsschwerpunkte liegen in den Bereichen
 Verhaltens-, Umwelt- und Sportökonomik.

 Kontakt:
 TU Clausthal, Institut für Wirtschaftswissenschaft, Abteilung für
 Volkswirtschaftslehre
 Julius-Albert-Straße 2
 38678 Clausthal-Zellerfeld
 Telefon: +49 5323 72 7630
 E-Mail: christoph.buehren@tu-clausthal.de

 Tim Meyer ist externer Doktorand am Lehrstuhl für Monetäre
 Ökonomik der Helmut-Schmidt-Universität/Universität der
 Bundeswehr Hamburg. Seine Forschungsinteressen liegen in
 den Bereichen Makroökonomik, Immobilienökonomik,
 Prognosen, Sportökonomik und Ökonomik des Ehrenamtes.

 Kontakt:
 Lehrstuhl für Monetäre Ökonomik
 Helmut-Schmidt-Universität Hamburg
 Holstenhofweg 85
 22043 Hamburg
 Email: tim.meyer@hsu-hh.de

 Prof. Dr. Christian Pierdzioch ist Professor für Monetäre
 Ökonomik an der Helmut-Schmidt-Universität/Universität der
 Bundeswehr Hamburg. Seine Forschungsschwerpunkte liegen in
 den Bereichen Monetäre Ökonomik, Internationale Finanzmärkte
 und Sportökonomie.

 Kontakt:
 Lehrstuhl für Volkswirtschaftslehre (insbesondere Monetäre
 Ökonomik)
 Holstenhofweg 85
 22043 Hamburg
 E-Mail: macroeconomics@hsu-hh.de

SCIAMUS – Sport und Management 2/2020
25

References

Amirat, A., & Alwafi, W. (2020). Does herding behavior exist in cryptocurrency
market?. Cogent Economics & Finance, 8(1), 1735680.

Ballis, A., & Drakos, K. (2020). Testing for herding in the cryptocurrency market.
Finance Research Letters, 33, 101210.

Bhanot, S. P., & Williamson, C. (2020). Financial incentives and herding: Evidence from
two online experiments. Southern Economic Journal, 86(4), 1559-1575.

Bernhardt, D., Campello, M., & Kutsoati, E. (2006). Who herds?. Journal of Financial
Economics, 80(3), 657-675.

Bühren, C., Meyer, T. & Pierdzioch, C. (2020): Experimental evidence on forecaster
(anti-)herding in sports markets. MAGKS Joint Discussion Paper Series in Economics
38-2020.

Chang, E. C., Cheng, J. W., & Khorana, A. (2000): An examination of herd behavior in
equity markets: An international perspective. Journal of Banking and Finance, 24(10),
1651-1679.

Christie, W. G., & Huang, R. D. (1995). Following the pied piper: Do individual returns
herd around the market? Financial Analysts Journal, 51(4), 31-3

Coates, D., Humphreys, B. R., & Zhou, L. (2014). Reference‐dependent preferences,
loss aversion, and live game attendance. Economic Inquiry, 52(3), 959-973.

Da Gama Silva, P. V. J., Klotzle, M. C., Pinto, A. C. F., & Gomes, L. L. (2019). Herding
behavior and contagion in the cryptocurrency market. Journal of Behavioral and
Experimental Finance, 22, 41-50.

Deschamps, B., & Gergaud, O. (2008). Efficiency in horse races betting markets: The
role of professional tipsters. Handbook of Sports and Lottery Markets, 341-354.

Deutscher, C., Dimant, E., & Humphreys, B. R. (2017). Match fixing and sports betting
in football: Empirical evidence from the German Bundesliga. Available at SSRN
2910662.

Dixon, M. J., & Pope, P. F. (2004). The value of statistical forecasts in the UK association
football betting market. International Journal of Forecasting, 20(4),
697-711.

SCIAMUS – Sport und Management 2/2020
26

Drehmann, M., Oechssler, J., & Roider, A. (2007). Herding with and without payoff
externalities—an internet experiment. International Journal of Industrial Organization,
25(2), 391-415.

Fildes, R. (2015). Forecasters and rationality - A comment on Fritsche et al.,
Forecasting the Brazilian Real and Mexican Peso: Asymmetric loss, forecast rationality
and forecaster herding. International Journal of Forecasting, 31(1), 140-143.

Forrest, D., Goddard, J., & Simmons, R. (2005). Odds-setters as forecasters: The case
of English football. International Journal of Forecasting, 21(3), 551-564.

Forrest, D., & Simmons, R. (2000). Forecasting sport: The behaviour and performance
of football tipsters. International Journal of Forecasting, 16(3), 317-331.

Haryanto, S., Subroto, A., & Ulpah, M. (2020). Disposition effect and herding behavior
in the cryptocurrency market. Journal of Industrial and Business Economics, 47(1),
115-132.

Gurdgiev, C., & O’Loughlin, D. (2020). Herding and anchoring in cryptocurrency
markets: Investor reaction to fear and uncertainty. Journal of Behavioral and
Experimental Finance, 25, 100271.

GVC (2019). Final results for the year ended 31 December 2018. Available at
https://gvc-plc.com/wp-content/uploads/2019/03/2018-Full-Year-Results.pdf
[5 March 2019].

Laster, D., Bennett, P. B., & Geoum, I. S. (1999). Rational bias in macroeconomic
forecasts. Quarterly Journal of Economics, 114(1), 293-318.

Leiner, D. J. (2014). SoSci Survey. Available at https://www.soscisurvey.de

Leitner, C., Zeileis, A., & Hornik, K. (2010). Forecasting sports tournaments by ratings
of (prob) abilities: A comparison for the EURO 2008. International Journal of
Forecasting, 26(3), 471-481.

Meub, L., Proeger, T., Bizer, K., & Spiwoks, M. (2015). Strategic coordination in
forecasting–An experimental study. Finance Research Letters, 13, 155-162.

Naujoks, M., Aretz, K., Kerl, A. G., & Walter, A. (2009). Do German security analysts
herd?. Financial Markets and Portfolio Management, 23, 3-29.

Pawlowski, T., Nalbantis, G., & Coates, D. (2018). Perceived game uncertainty,
suspense and the demand for sport. Economic Inquiry, 56(1), 173-192.

SCIAMUS – Sport und Management 2/2020
27

Pierdzioch, C, & Rülke, J.-C. (2012). Forecasting stock prices: Do forecasters herd?.
Economics Letters, 116, 326-329.

Pierdzioch, C, & Rülke, J.-C. (2013). Do inflation targets anchor inflation expectations?.
Economic Modelling, 35, 214-223.

Pierdzioch, C., Rülke, J. C., & Stadtmann, G. (2012). A Note on forecasting emerging
market exchange rates: Evidence of anti‐herding. Review of International Economics,
20(5), 974-984.

Pierdzioch, C., Rülke, J. C., & Stadtmann, G. (2013). Forecasting metal prices: Do
forecasters herd?. Journal of Banking and Finance, 37, 150-158.

Pierdzioch, C., Reid, M., & Gupta, R. (2016). Inflation forecasts and forecaster herding:
Evidence from South African survey data. Journal of Behavioral and Experimental
Economics, 62, 42–50.

Ruülke, J.-C., Silgoner, M., & Worz, J. (2016). Herding behavior of business cycle
forecasters. International Journal of Forecasting, 32, 23-33.

Scharfstein, D. S. & Stein, J. C. (1990.) Herd behavior and investment. American
Economic Review, 80, 465-479.

Spann, M., & Skiera, B. (2009). Sports forecasting: a comparison of the forecast
accuracy of prediction markets, betting odds and tipsters. Journal of Forecasting,
28(1), 55-72.

Yarovaya, L., Matkovskyy, R., & Jalan, A. (2020). The Effects of a 'Black Swan' Event
(COVID-19) on Herding Behavior in Cryptocurrency Markets: Evidence from
Cryptocurrency USD, EUR, JPY and KRW Markets. EUR, JPY and KRW Markets (April
27, 2020).

SCIAMUS – Sport und Management 2/2020
28

Florian Follert, Frank Daumann & Lana Passon

Zur Bedeutung der Fans im professionellen
Fußball im Lichte der COVID-19-Pandemie
Abstract

Dass Fans als „12. Mann“ einen nicht zu unterschätzenden Beitrag zur Produktion
des modernen Profifußballs leisten, dürfte weitgehend unbestritten sein. Dies wird
insbesondere durch die COVID-19-Pandemie-bedingte Einführung sog. „Geister-
spiele“ deutlich: Hierdurch wurde offenbar, welchen wichtigen Beitrag die Fans
und die von ihnen produzierte Stadionatmosphäre zum gewohnten Konsum eines
Fußballspiels beitragen. Wenngleich Fernsehsender versuchen, die typische Stim-
mung durch Konserven zu substituieren, zeigt sich doch, dass Fans fehlen. So ent-
fällt beispielsweise der Heimspielvorteil. Erstmalig besteht also nicht bloß anek-
dotische Evidenz hinsichtlich der Bedeutung von Fans, sondern die Situation in den
Stadien, wie sie durch die staatlichen Corona-Auflagen entstanden ist, kann als „na-
türliches Experiment“ interpretiert und entsprechend analysiert werden. Zahlrei-
che Studien untersuchen daher den Einfluss der Anhänger, indem sie Partien vor
den COVID-19-Beschränkungen mit Geisterspielen während der Pandemie ver-
gleichen. Zwar ist der sog. Heimvorteil in der empirischen Forschung seit langer
Zeit bekannt, die Bedingungen während der COVID-19-Pandemie lassen es jedoch
zu, den Einfluss der Zuschauer auf dieses Phänomen genau zu untersuchen. Der
vorliegende Beitrag bietet diesbezüglich einen Literaturüberblick und diskutiert
die Rolle der Fans als wichtiger Produktionsfaktor in der Fußballindustrie. Die
jüngsten empirischen Studien zeigen, dass sich der Heimvorteil durch die Abwe-
senheit der Zuschauer tendenziell reduziert, was meist durch die fehlende Beein-
flussung der Schiedsrichter erklärt wird.

Schlüsselwörter: Fans, Heimvorteil, Fußball, Literature Review, Home Bias, CO-
VID-19

1. Einleitende Bemerkungen

Fans werden gemeinhin als „12. Mann“ bezeichnet und sind wichtiger Bestandteil
des modernen Unterhaltungsprodukts „Profifußball“. Auch für die Spieler hat es
augenscheinlich eine Bedeutung, ob sie in der ersten oder zweiten Halbzeit auf
„die eigene Kurve“ spielen, oder auf welches Tor das entscheidende Elfmeter-
schießen in einem Pokalwettbewerb stattfindet. Aus wissenschaftlicher Perspek-
tive werden Fans als (externe) Determinante bei der Produktion sportlichen Er-
folgs angesehen.1

1
 Etwa Dietl, Hasan & Korthals, 2005; Daumann, 2019.

SCIAMUS – Sport und Management 2/2020
29

Es ist kaum zu bestreiten, dass der Fußball in hohem Maße von aktiven Zuschauern
profitiert,2 sei es durch Ticketeinnahmen oder durch die typische Stadionat-
mosphäre, die dem Produkt seine besondere Vermarktungsfähigkeit verleiht.3 Al-
lerdings geht dieser Nutzen auch mit (externen) Kosten einher – etwa Gewalt4 oder
das unerlaubte Zünden von Feuerwerkskörpern5 –, die insbesondere durch ein-
zelne Gruppierungen verursacht werden und sportliche wie politische Akteure vor
neue Herausforderungen stellen und regelmäßig von den Klubs sowie der Allge-
meinheit zu tragen sind.6 Dadurch wird das Verursacherprinzip ausgehebelt.

Die vorliegende Untersuchung konzentriert sich auf den positiven Beitrag der Fans
zur Produktion eines vermarktungsfähigen Ligaspiels im professionellen Bereich
und auf den möglichen Einfluss der Fans auf den Ausgang des Spiels. Dabei ergibt
sich der Einfluss der Fans auf das Spiel vor allem aus dem Heimvorteil,7 der auch
im professionellen Fußball erkennbar ist und sich sogar in der Regelkunde bei in-
ternationalen Wettbewerben niederschlägt (sog. „Auswärtstor“). Dieser besagt,
dass Heimmannschaften mehr als die Hälfte der Spiele gewinnen, wenn Heim- und
Auswärtsspiele in einer Saison gleichverteilt sind. Es kann also – wenngleich in un-
terschiedlichem Ausmaß – von einem entsprechenden relativen Vorteil der Heim-
mannschaften ausgegangen werden, was durch verschiedene Aspekte erklärt
wird.8 Ein Aspekt, der in der aktuellen Situation unter laborähnlichen Bedingungen
analysiert werden kann, ist der Einfluss der Fans auf verschiedene soziale und
sportliche Aspekte während eines Fußballspiels.9 Als Erklärungsansätze können
insbesondere der Einfluss des Publikums auf das Verhalten und die Entscheidun-
gen von Schiedsrichtern10 und ein zusätzlicher Motivationsschub11 für die Spieler
der Heimmannschaft angeführt werden.

Der vorliegende Beitrag nimmt sich der besonderen Rolle der Fans im Profifußball
an und diskutiert die Frage, ob Fans als eigenständiger Produktionsfaktor angese-
hen werden können. Hierzu bieten wir einen umfassenden Überblick der bisheri-
gen empirischen Studien während des Spielausfalls bzw. während der sog. „Geis-
terspiele“ in der COVID-19 Pandemie. Diese Studien zeigen, dass Fans als ganz
wesentlicher Produktionsfaktor angesehen werden können, die sogar Einfluss auf
den sportlichen Ausgang einer Partie haben können.

Der Beitrag folgt nachstehender Struktur: Zunächst wird der sozioökonomische
Rahmen der Untersuchung umrissen, indem der Begriff „Fan“ bestimmt und der

2
 Siehe beispielsweise Rudolph et al., 2017.
3
 Hierzu Woratschek, Schafmeister & Ellert, 2019.
4
 Siehe Poutvaara & Priks, 2009; Niemeier, 2015.
5
 Sog. Pyrotechnik, etwa Follert, 2019.
6
 Jüngst Mause, 2020.
7
 Siehe Courneya & Carron, 1992.
8
 Vgl. hierzu Pollard, 2008; Buraimo, Simmons & Maciaszczyk, 2012; Ponzo & Scoppa, 2018.
9
 Vgl. etwa Dilger & Vischer, 2020.
10
 Vgl. Dohmen & Sauermann, 2016.
11
 Vgl. etwa Ponzo & Scoppa, 2018.

SCIAMUS – Sport und Management 2/2020
You can also read