Atmosphere - Part 4 Atmosphere State of the Environment - Commissioner for Environmental Sustainability ...
←
→
Page content transcription
If your browser does not render page correctly, please read the page content below
Part 4
                1                              Introduction
                                               State of the Environment
                                               Atmosphere

         Atmosphere

187 |   State of the Environment Report - Victoria 2008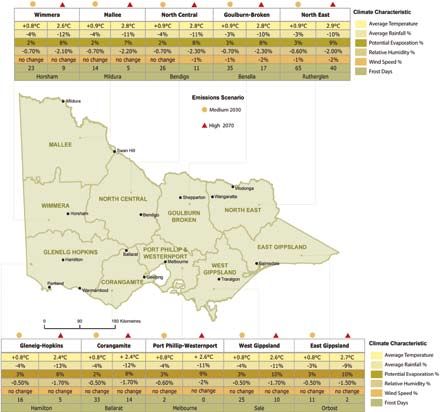
A0 Introduction

Key Findings
•V
  ictoria has warmed by 0.6°C since the 1950s; a faster rate
 of warming than the Australian average and the last ten years
 have been hotter than average in Victoria, with 2007 being the
 hottest year on record.
•S
  ince 1990, changes to both global temperature and sea level
 have tracked at the upper limit of projections, indicating that
 projections may be underestimates of likely climate change
 scenarios.
•V
  ictoria’s greenhouse emissions have increased by
 approximately 12% since 1990.
•F
  ull recovery of stratospheric ozone is possible but is highly
 dependent upon adherence of both developed and developing
 countries to international agreements. In addition, an enhanced
 greenhouse effect and future atmospheric concentration of
 nitrous oxide and methane may reverse anticipated ozone
 recovery.
•B
  y international standards, Victoria has good air quality.
 Increased frequency and severity of bushfires, and low rainfall
                                                                      4

                                                                      Atmosphere
 attributed to climate change, will produce added pressures on
 air quality. The higher temperatures may also lead to a greater
 potential for ozone formation leading to increased incidence of
 smog.                                                                             4.1
•A
  ustralia has particular vulnerabilities to climate change and
 environmental degradation, but these should not act as a
 constraint on its environmental policy responses, rather they
 increase the risk of not acting strongly and urgently to climate
 change risks.
•T
  he window of opportunity to stabilise levels of greenhouse
 gas emissions is rapidly diminishing.

                                                                    | 188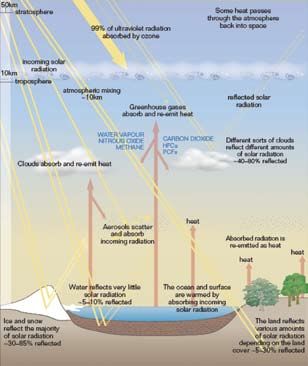
Part 4 State of the Environment
Atmosphere
Victorian atmosphere assets broad scientific acceptance that climate Adaptation to climate change as a policy
change is unequivocal this report will is necessary to cope with the change
The Earth’s atmosphere is about 800
focus on indicators of climate change. The locked into the system by the level of
kilometres thick. It protects living things
other issues reported are stratospheric greenhouse gases already emitted. This
from harmful solar radiation and ensures
ozone and air quality, both themselves situation has come about as a result
a suitable temperature range for life as
subject to the effects of climate change. of a failure by the global community to
well as providing the air that we breathe
agree on how to adequately mitigate
and providing the transport mechanism Climate change is viewed as the most
against climate change. However, if
for water molecules that fall as rain. Air critical of all environmental issues as it
global greenhouse gas emissions are not
is a mixture of oxygen, nitrogen, carbon has the potential to drive radical systemic
brought under control and subsequently
dioxide and other gases such as hydrogen change, create consequential economic
reduced, it will condemn Victorians to
and ozone. These gases are densest in turbulence, and affect people both here
dangerous climate change, including
the boundary layer at the Earth’s surface and globally. Victoria has been a leader in
further reductions in water availability,
where a very thin skin of air supports taking action on climate change. By 2010
sea level rise, migration of farming, and
life (see Figure A 0.1). The atmosphere Australia’s Carbon Pollution Reduction
also to wider global risks to trade and the
provides essential ecosystem services, Scheme will be introduced. Australia
forced migration of peoples from severely
but continued provision of those services and Victoria are now participating in
affected regions of the world.
is threatened by human activities. international movements to gain a global
agreement on reducing greenhouse gas A problem recognised in the 1980s was
A key service provided by the atmosphere
emissions and adapting to an inevitably that certain chemicals had the capacity
is moderation of the climate. Victoria’s
changed climate. This is a fast-moving to damage the ozone layer, the layer in
climate is naturally highly variable. El Niño,
area of policy, and the evolution of the atmosphere that protects the planet
La Niña and the Southern Oscillation
measures will continue well beyond the from harmful solar radiation. This was
create variable weather patterns, with the
release of this report. The commentary in the first global atmosphere problem. The
effect being more marked in the north
this report should be viewed, therefore, as breakdown of the ozone layer as a result
of the State1. Traditionally reports on the
part of a dynamic pattern of governmental, of aerosols such as chlorofluorocarbons
state of the environment have considered
industry amd community effort which has lead to an international collaboration in
the state of the climate. However, without
a long way to go. order to reduce and reverse the damage.
excluding natural variability, given the
The Montréal Protocol on Substances that
Deplete the Ozone Layer came into force
Figure A0.1 Chemical and transport processes in the atmosphere in 1989. This brought in the first effective
Source: Garnaut 2008
global ban on discharge of certain
atmospheric substances.
In addition to a global depletion, in
the 1980s a hole in the ozone layer (a
pronounced thinning, predominantly in
the lower portion of the ozone layer),
was discovered over Antarctica. At its
maximum, about the year 2000, the hole
was approximately 30 million km2, almost
four times the size of Australia, and its
depth was down to 60% of 1970s ozone
thickness. It has since stabilised at this
size, with significant year-to-year variations
largely driven by stratospheric temperature
fluctuations.
In policy terms air quality, the relative state
of a local or regional airshed, was the first
obvious issue related to the atmosphere
to prompt community reaction and policy
action. It was a switch to fossil fuels, coal
and oil, that underwrote the industrial
revolution. Unknown then, this range of
gases, particularly those involving carbon,
provided the seeds of today’s greenhouse
problem.
This was also the period when
urbanisation accelerated, as industrial
employment released individuals from a
direct relationship with and dependence
on the land. The first laissez-faire
industrial cities were the locus of the new
poor air quality, compounded after the
Second World War by the increasingly
universal adoption of the internal
combustion engine as the source of
individual mobility.
189 | State of the Environment Report - Victoria 2008
Not surprisingly a reduction in air pollution    km2) and depth (60% ozone losses since          Pressures on Victoria’s
and its direct health consequences was           the late 1970s) about the year 2000,            atmosphere
the first and most significant subject           resulting in 50% to 130% more ultraviolet-B
                                                                                                 There is now overwhelming evidence that
of modern environmental objectives.              radiation reaching the Earth’s surface. It
                                                                                                 recent rapid climate change is linked to
With this came the argument that                 has since stabilised. Major ozone losses
                                                                                                 elevated concentrations of greenhouse
most of these discharges were an                 over Melbourne from the late 1970s until
                                                                                                 gases in the atmosphere. Human activities
unpriced externalisation of wastes to the        the early 1990s have been 7% - 8% per
                                                                                                 are the main contributor to increased
environment and that the costs were borne        decade. Ultraviolet levels under clear-sky
                                                                                                 greenhouse-gas concentrations, largely
in degraded and unhealthy air.                   conditions increased by 10% per decade
                                                                                                 through the combustion of fossil fuels,
                                                 over southern Australia from the late 1970s
This section shows that motor vehicles                                                           which releases carbon dioxide and other
                                                 to the late 1990s. Since the late 1990s
and fires are significant sources of                                                             greenhouse gases.
                                                 ultraviolet levels have declined by 5%.
pollutants that lead to formation of smog.
                                                                                                 Observations and modelling of the
The Victorian EPA has led the State to an        Ozone depletion halted in the late 1990s
                                                                                                 climate system lead to the conclusion
air quality standard that by international       leaving ozone levels over Melbourne
                                                                                                 that enhanced concentrations of
standards is very good.                          relatively stable, but at a level at least
                                                                                                 greenhouse gases are the dominant
                                                 10% lower than they were in the late
Overall Condition                                                                                cause of warming during the past several
                                                 1950s. Despite longer term stabilisation,
                                                                                                 decades2. The IPCC states that “no known
Condition of the climate                         the lowest ozone level recorded over
                                                                                                 mode of internal variability leads to such
                                                 Melbourne since 1956 was seen in the
It can be argued that the single greatest
environmental, social and economic
                                                 summer of 2006/2007.
                                                                                                 widespread, near universal warming as has
                                                                                                 been observed in the past few decades”3,
                                                                                                                                                 4
challenge facing Australia and Victoria          Stratospheric ozone recovery may have           which leaves external factors, such as

                                                                                                                                                 Atmosphere
is climate change. Climate Change is             commenced in 2000, but is currently             human activities, as the most likely causes
seen as a driving force for environmental        masked by solar cycle effects. Significant      of the warming. The IPCC4 in its Fourth
change, and the topic is widely covered in       ozone recovery is expected over the next        Assessment Report in 2007 concluded                          4.1
this Report.                                     5 years. Full recovery of stratospheric         that anthropogenic greenhouse gas
                                                 ozone is possible but highly dependent          emissions are very likely (greater than
Victoria has warmed by 0.6°C since the           upon adherence of both developed and            90% probability) to have c aused most of
1950s; a faster rate of warming than the         developing countries to international           the observed increases in global average
Australian average. The last ten years           agreements. In addition, an enhanced            temperature since the mid-20th century.
have been hotter than average in Victoria,       greenhouse effect and future atmospheric
with 2007 being the hottest year on record.                                                      Whilst use of ozone depleting substances
                                                 concentration of nitrous oxide and
Victoria experienced a hot and dry period                                                        has been phased out reducing the
                                                 methane may reverse anticipated ozone
between 1997 and 2007. In parts of                                                               pressure on the ozone layer, additional
                                                 recovery.
northern Victoria this decade is the driest                                                      factors may mean that ozone recovery
since the droughts of 1938-1945 and              Condition of air                                may not occur by 2040 as previously
1895-1902. Since 1961 global average sea         The condition of Victoria’s air can be          predicted. One of the consequences
level has risen by approximately 10 cm.          considered good. However the State              of climate change is that as the lower
Williamstown has registered a sea level          Environmental Protection Policies (SEPPs)       atmosphere warms, the upper atmosphere
rise of 18 cm over the last hundred years.       made by the Victorian EPA to regulate           cools. A cooler stratosphere means more
                                                 these matters show a need for a continued       polar stratospheric clouds and more
Since 1990 carbon dioxide emissions,
                                                 high level of investment and effort in          ozone depletion. Climate change may
mean global temperature and sea level
                                                 compliance and monitoring. Levels of            delay full ozone recovery by as much
rise have tracked at the upper limit of
                                                 fine particles and ozone do not always          as 50 years5. In addition, the long-term
projections, indicating that projections
                                                 meet the objectives in Victoria’s ambient       growth of nitrous oxide in the atmosphere
may be underestimates of likely climate
                                                 air quality policy and in those instances       may cause significant ozone depletion
change scenarios.
                                                 people are exposed to adverse health            after about 2060.
Victoria’s greenhouse emissions have             impacts. Ozone in air is distinguished          The pressures on Victoria’s air quality are
increased by approximately 12% since             from ozone in the stratosphere (commonly        increasing with its growing population and
1990. In 2006, the stationary and transport      known as the ozone layer) which has the         economy. The most significant sources
energy sectors accounted for 85% of total        beneficial effect of absorbing harmful          of fine particle emissions in Victoria are
greenhouse gas emissions in Victoria.            radiation.                                      from dust storms, bushfires, industry
Condition of stratospheric ozone                 By international standards, Victoria has        and motor vehicles. Wood heaters and
                                                 good air quality which has been relatively      planned burning can also be a significant
Emission of certain chemicals such as
                                                 stable over the last decade despite             source of particles. Motor vehicles are
chlorofluorocarbons (CFCs) leads to the
                                                 increased pressures from a growing              a major source of the pollutants that
depletion of stratospheric ozone, exposing
                                                 population and economy. Bushfires and           lead to formation of smog, which can
both marine and terrestrial life to additional
                                                 dust storms resulting from a prolonged          also form downwind of bushfires. As the
harmful amounts of ultraviolet radiation.
                                                 below-average rainfall have recently            climate changes, average temperatures
Global emission of those substances
                                                 affected air quality across Victoria with air   are predicted to increase leading to an
peaked in the late 1980s to early 1990s at
                                                 quality being poor in 2003 and 2006 due         increase in dust storms and fire. Higher
2.1 million tonnes per year, and by 2005
                                                 to the impact of severe bushfires.              temperatures will also cause greater
had declined by 70% to 0.5 million tonnes.
                                                                                                 emissions of pollutants and an increase in
Worldwide ozone losses of 4% per decade          Increased frequency and severity of             the speed of the chemical reactions that
occurred from the late 1970s until the late      bushfires, and drought attributed to            lead to formation of smog.
1990s.                                           climate change, will produce added
The Antarctic ozone hole reached a               pressures on air quality. The higher
maximum area (approximately 30 million           temperatures predicted may also lead to a
                                                 greater potential for ozone formation.

                                                                                                                                               | 190
Part 4 State of the Environment
Atmosphere
Management Responses and production of ODSs in a limited The Montréal Protocol on substances
period. Due to its results it is considered that deplete the atmosphere, the
Responses to the challenge of climate
very successful. The Multilateral Fund principal global mechanism responsible
change – by governments, business and
for the Implementation of the Montréal for the decrease in global atmospheric
industry and by the wider community –
Protocol has been established to help concentrations ODSs has been highly
are currently dominating international,
developing countries in their efforts to successful in phasing out the use
national and local policy debates around
phase out ODSs. and production of ODSs in a limited
environmental sustainability. Those
period. The Multilateral Fund for the
responses are important not only to Improving air quality
Implementation of the Montréal Protocol
address the problem of climate change Response Name should be useful in assisting developing
but they are also relevant for adressing State Environment Protection Policy countries in their efforts to phase out
the associated atmospheric issues of (Ambient Air Quality) ODSs. Despite the success of these
stratospheric ozone depletion and air
Responsible Authority responses there are still some ozone
quality. The responses presented here
Victorian Environment Protection depleting substances in use in Victoria.
are the overarching tools used to address
Authority These are used for fumigation of shipping
these issues. They are considered in
containers and in the grain and strawberry
further detail in subsequent sections of Response Type runner industries.
this part of the report. Policy
The Victorian EPA, the second such
Reducing Greenhouse Emissions The Ambient Air Quality SEPP contains the organisation to be established in the
Response Name national indicators, standards, goals and world, has been working to improve
United Nations Framework Convention monitoring and reporting protocol of the Victoria’s air quality for over 35 years.
on Climate Change (UNFCCC) National Environment Protection Measure Victoria established its first statewide
for Ambient Air Quality (AAQ NEPM). policy framework for the management of
Responsible Authority Currently there are 16 EPA operated air
Commonwealth Government air quality in 1981, with the development
quality stations (12 in Melbourne, 2 in of the State Environment Protection
Response Type Geelong and 2 in the Latrobe Valley) that Policy (SEPP) (The Air Environment). The
International Agreement monitor the common air pollutants and current regulatory framework for protecting
some air toxics. Site-specific monitoring Victoria’s air environment is provided by
The UNFCCC was one of three
is also undertaken to better understand the Ambient Air Quality and Air Quality
conventions adopted at the 1992 Rio
local or sub-regional air pollution. The data Management SEPPs. These tools have
Earth Summit. The central objective of the
provides important information on whether been highly successful in guiding EPA’s
UNFCCC is to stabilise greenhouse gas
air quality objectives are being met, and monitoring and reporting on air quality.
concentrations at a level where dangerous
allows trends in air quality to be tracked. That knowledge enables EPA to work with
human interference with the climate
This information is used to guide the the community, industry and government
system is prevented.
development of Government policies and to tackle sources of pollution. However,
Upon ratification, signatory governments strategies to improve Victoria’s air quality. there are some areas where improvements
are committed to a voluntary non-binding
could potentially be made. This is likely to
aim to reduce greenhouse gases. The Evaluation of atmosphere
require action from a range of agencies
main outcome of the UNFCCC to date responses
across Government.
has been the Kyoto Protocol, negotiated Climate change is already unavoidable
and signed in 1997. Under the Protocol, due to existing levels of greenhouse
developed countries have been given gases in the atmosphere. While climate
Recommendations
the initial responsibility in tackling climate change action has traditionally focused A0.1 Encourage an Australian program
change as they are the source of most on mitigation, governments are becoming of action on climate change which
greenhouse gas emissions to date. increasingly attentive to adaptation as sees effective multilateral and bilateral
Developing countries have no immediate the reality of unavoidable climate change action and develop a strong program of
restrictions under the Convention. becomes clear. Whilst Victoria’s own state-based mitigation policy measures
Reducing Emissions of Ozone Depleting emissions on a global scale are small, including building a climate change
Substances per capita they are amongst the worst in “test” into all major policy, infrastructure
the world. This shows a real opportunity and expenditure decisions.
Response Name
for change and provides the means by
Montréal Protocol on Substances That A0.2 Continue to support CSIRO
which Victoria could become a leader in
Deplete the Ozone Layer monitoring and reporting of atmospheric
emissions reduction. Such skills would be
ozone concentrations and review
Responsible Authority transferable to other nations that might be
developments that may lead to suitable
Department of the Environment, Water, struggling with ways to reduce emissions
greenhouse neutral replacements for
Heritage and the Arts and importantly, provide an opportunity to
ozone depleting substances that are
Response type demonstrate a pathway to a low carbon
still in use.
International Treaty economy whilst maintaining economic
growth. A0.3 Continue to support the EPA in
The Montréal Protocol is the principle monitoring and reporting air quality and
mechanism responsible for the decrease actively seek solutions to managing
in global atmospheric concentrations of air quality in light of the increased
ozone depleting substances (ODS) since pressures predicted from a growing
1998. The Protocol came into force in population and climate change.
1989 and its main purpose is to protect
the ozone layer by phasing out the use
191 | State of the Environment Report - Victoria 2008
A1 Climate change
Key findings • In 2007, the IPCC declared that climate • In its 2007 report, the United Nations
change is ‘unequivocal’ and, with a Intergovernmental Panel on Climate
•G
lobal atmospheric concentrations
probability over 90%, this change is due Change (IPCC) found that carbon
of greenhouse gases have increased
to post-industrial human activity. dioxide emissions need to peak no later
markedly as a result of human activities
than 2015 and be reduced by 50-85%
since 1750 and now far exceed pre- •S
ince 1990, carbon dioxide emissions,
by 2050 (from 2000 levels) to limit
industrial values. Impacts of climate global mean temperatures and sea
global average temperature increases
change on stratospheric ozone; air levels have tracked at the upper limit of
to 2.0 - 2.4° C.
quality; land and biodiversity; inland projections, indicating that projections
waters; and coasts, estuaries and the may be underestimates of likely •T
he 2007 United Nations Framework
sea are addressed throughout this climate change scenarios. The greater Convention on Climate Change
report. the warming, the greater the risk of (UNFCCC) Bali Roadmap and IPCC
tipping into irreversible climate change. Working Group Reports indicated
•T
here are large natural year to year
Climate change feedback loops further potential greenhouse gas emissions
variations in climate. Natural climate
increase these risks. reductions by developed countries of
variability will influence actual warming
25-40% by 2020 and 80-95% by 2050
values in any single year or decade. Projections
(from 1990 levels).
The global warming influence due to •P
rojections indicate that by 2030
increasing greenhouse gases is at •A
ustralia, and Victoria, have committed
warming in Victoria is likely to
global scales and cumulative over many to reducing emissions by 60% by 2050
range from 0.6°C to 1.2°C on 1990
years. At short time scales, natural
variability can offset that warming
temperatures and by 2070 from 0.9°C
to 3.8°C. The 2030 rise is largely locked
from 2000 levels, with interim targets yet
to be announced. 4
influence and cause short term cooling.
Atmosphere
in by the current level of emissions, •E
arly global action to reduce
The long-term warming trend is with the 2070 projections dependent on greenhouse gas emissions reduces the
unequivocal. rates of global growth and measures risks associated with climate change,
•A
ustralia naturally has a highly variable put in place to reduce greenhouse gas reduces long term costs and provides 4.1
climate. Because of its geography, emissions. greater flexibility should emerging
Australia has further vulnerability to science cause mitigation responses to
• In most Victorian catchments, runoff
damage through variations induced be adjusted over time.
into waterways is projected to decrease
by climate change than most other between 5% and 45% by 2030 and •W
hile being responsible for only 1.5%
developed countries. between 5% and 50% by 2070. of total global emissions, Australia is
Observed changes the 14th largest emitter of greenhouse
•F
ire risk is forecast to increase
gases in the world. On a per capita
•V
ictoria has warmed by 0.6°C since the substantially in Victoria, with the number
scale of the top 25 emitting countries,
1950s - a faster rate of warming than of very high or extreme fire danger days
Australia is the second highest.
the Australian average. The last ten across south-eastern Australia expected
years have been hotter than average to increase by up to 25% by 2020 and • In 2006, approximately one fifth of
in Victoria, with 2007 being the hottest up to 230% by 2050. Australia’s greenhouse gas emissions
year on record. Six out of Victoria’s ten came from Victoria. Between 1990 and
•B
y 2070 drought frequency is likely to
hottest years on record have occurred 2006, Victoria’s emissions grew by
increase by between 10% and 80% in
since 1990. 12% and could increase 40% above
the southern half of the State and by
2000 levels by 2050 in the absence of
•R
ainfall during the last ten years has between 10% and 60% in the northern
effective mitigation.
been markedly lower than the long-term half.
average, with 2007 being one of the •T
he Australian Garnaut Climate Change
•M
ore frequent extreme weather events
three driest years since 1900. Review has proposed that Australia
are predicted, with increasing damage
should offer to play its full, proportionate
•S
erious rainfall deficiencies over the from flooding, high winds and coastal
part in a global agreement designed
past 11 years have reduced inflows storm surges and inundation; a current
to achieve a 450 ppm CO2-e
to storages 30–60% below long-term 1 in 100 year extreme storm surge could
concentration. However, it further
averages. Water scarcity has been occur around every 5 years by 2070.
proposes not to focus on a single
statewide in extent, exacerbated by Projected sea level rises will further
trajectory, but to have a set of options
high temperatures, and has worsened exacerbate these problems.
available during the negotiations for
over time, with flow in the Murray and Context and policy responses the international post Kyoto Protocol
Melbourne storages reaching record
•G
lobally, between 1970 and 2004, arrangements.
lows in 2006.
greenhouse gas emissions covered by •M
omentum has built rapidly in terms
•S
ince 1961 global average sea the Kyoto Protocol have increased by of public awareness and support for
level rose approximately 10 cm. 70% (24% since 1990). Government action, however, in the
Williamstown has registered a sea level
•W
ithout additional policies, global context of current global economic
rise of 18 cm over the last hundred
greenhouse gas emissions are instability and ongoing concerns about
years.
projected to increase by 25-90% by international economic competitiveness,
•V
ictoria’s greenhouse gas emissions 2030, relative to 2000. strong community support will continue
have increased by approximately 12% to be required.
since 1990.
•C
ritical decisions on Australia’s and
the world’s commitment to reduce
greenhouse gas emissions will be made
in 2009.
| 192
Part 4 State of the Environment
Atmosphere
Description The top 25 greenhouse gas emitting Scientific evidence
countries in the world together account
The climate challenge There is now overwhelming evidence that
for over 87% of global emissions. While
recent rapid climate change is linked to
Climate change confronts humanity with being responsible for only 1.5% of total
elevated concentrations of greenhouse
the possibility of catastrophic change to global emissions6, Australia is the 14th
gases in the atmosphere. Human activities
life on Earth. largest emitter of greenhouse gases in the
are the main contributor to increased
Worldwide scientific collaboration is world. On a per capita scale of the top 25
greenhouse gas concentrations, largely
presenting a range of increasingly emitting countries, Australia is the second
through the combustion of fossil fuels
disturbing scenarios. These stem from highest7. In 2006, approximately one
and land clearing, which releases carbon
a combination of key human activities, fifth of Australia’s emissions came from
dioxide and other greenhouse gases.
namely: the dramatic growth in global Victoria8, which generated over 120 million
tonnes of greenhouse gases. Between Observations and modelling of the
greenhouse gas emissions since the
1990 (the base year used for greenhouse climate system lead to the conclusion that
industrial revolution, the consumption of
emissions monitoring under the Kyoto enhanced concentrations of greenhouse
fossil fuels and the continued clearing
Protocol) and 2006, Victoria’s emissions gases are the dominant cause of warming
of forests and land for agriculture and
grew by 12%9. during the past several decades11. The
settlements. These factors, coupled
Intergovernmental Panel on Climate
with a lack of global consensus and The developed world is largely responsible
Change (IPCC) states that “no known
progress in reversing these trends, have for current global levels of greenhouse gas
mode of internal variability leads to such
turned the risk of catastrophic damage concentrations. Developing countries, in
widespread, near universal warming as has
to the economy, society and the natural particular the fast growing economies of
been observed in the past few decades”12,
environment from a possibility to a China, India, Brazil and others are seeking
which leaves external factors, such as
probability within our lifetimes. to lift the living standards of their societies
human activities, as the most likely causes
Tackling climate change throws up some and will soon become some of the largest
of the warming. The IPCC13 in its Fourth
very difficult challenges. The first is that greenhouse gas emitting countries in the
Assessment Report, 2007, concluded
people cannot immediately visualise world. Without mitigation, developing
that anthropogenic (human-induced)
it – it happens slowly, imperceptibly. The countries would account for about 90%
greenhouse gas emissions are very likely,
impacts have long lead times but strong of the emissions growth over the next
with greater than 90% probability, to have
action has to occur now if risks and their decade and beyond10. In international
caused most of the observed increases in
associated costs are to be avoided. Up negotiations, they attribute the changing
global average temperature since the mid-
front costs must be borne now to bring climate to ‘the West’ and look to the
20th century. It further describes climate
benefits and reduced costs in the future. developed world to take responsibility for
change as ‘unequivocal’.
Climate change requires us to measure its historical emissions, and to take the
lead in global emissions reduction efforts. The most recent deliberations of the
how we value the welfare of future
Developed countries, including Australia, international and Australian scientific
generations relative to our own.
have formally agreed to lead in responding communities are discussed in detail in
Global action is required, based to climate change. In reality, the world this section. They point to ever stronger
on principles of international and needs both developed and developing conclusions that greenhouse gas
intergenerational equity if all nations are countries to take urgent action on the level emissions are growing at a rate beyond
to be engaged. However the world is of greenhouse gases. that expected even three years ago, and
composed of sovereign nations which that impacts are tracking at the upper
historically pursue their own best interests. Nevertheless, the United States of America
limits of projections in the IPCC scenarios.
Achieving international agreement poses and until recently, Australia, were amongst
Understanding of feedback systems
a huge challenge for the world community. the few developed countries not to take
and thresholds in the climate system is
In conducting his Climate Change Review, climate change seriously. Powerful
still incomplete, raising the possibility of
Professor Ross Garnaut declared “There is internal interests argued and continue to
irreversible climate change and climate
a chance, just a chance that humanity will argue that the science is wrong and the
change happening faster than previously
act in time and in ways that reduce the risk threat is without foundation. These voices
expected.
of climate change to acceptable levels”. are still influential and they argue strongly
for delayed or no action. Certainly they The Australian Garnaut Climate Change
Historically, attempts at gaining seem to be heavily involved in arguing for Review Report states “We will delude
international agreements have often an ever slower response. ourselves if we think that scientific
foundered on the so-called ‘north- uncertainties are cause for delay. …
south divide’ between developed and Delaying now is not postponing a
developing nations. Over the past 150- decision. To delay is to deliberately choose
200 years, developed nations have been to avoid effective steps to reduce the risks
able to lift their societies out of poverty, of climate change to an acceptable level.”
based on the benefits of industrialisation.
A major consequence of this economic
growth, however, has been greenhouse
gas emissions polluting the Earth’s
atmosphere.
193 | State of the Environment Report - Victoria 2008
Australia’s vulnerability                         In summary, new ecosystems will                The UK Government’s Stern Report, the
                                                  replace the existing systems with major        Garnaut Climate Change Review and
Australia is particularly vulnerable both to
                                                  risks for productive agriculture and the       Australian business peak bodies have
the impacts of climate change itself and
                                                  sustainability of human settlements.           advised that the sooner action is taken to
to the responses adopted internationally
                                                  Climate change is projected to have            cut emissions, the less costly mitigation
to address its impacts. Key vulnerabilities
                                                  broad and significant environmental,           will be to economies around the world.
include:
                                                  economic and social impacts in Australia.
                                                                                                 It is clear the world is now facing risks of
• the hot, dry and naturally variable            Understanding of Australia’s particular
                                                                                                 catastrophic, irreversible climate change.
   climate becoming hotter and drier over         environmental vulnerability to climate
                                                                                                 Failure to act in time to reduce global
   much of the agricultural production            change is developing but in its infancy.
                                                                                                 greenhouse gas emissions will represent
   zones and in the large population
                                                  Key issues for Australia                       an implicit acknowledgement that this
   centres
                                                                                                 generation, particularly in developed
                                                  Australia stands to be the developed
• the fragility of Australia’s megadiverse                                                      countries, cannot afford to wear the costs
                                                  country most affected by significant
   ecosystems and unique biota whose                                                             of mitigation for the welfare of the world, its
                                                  climate change because of its hot, dry and
   evolutionary adaptation capabilities is                                                       ecosystems and future generations.
                                                  highly variable climate. Small variations in
   likely to be exceeded within the short
                                                  climate are more damaging to Australia         There has been much deliberation. Time is
   timeframes involved
                                                  than to many other developed countries.        now running out for decisive action.
•h
  igh variability of rainfall from year
                                                  On a per capita basis, Australians
 to year, with increasing competitive                                                            Objectives
 pressures on available resources due
                                                  emit more greenhouse gases to the
                                                  atmosphere than any other country in           •T
                                                                                                   o reduce Victoria’s greenhouse gas
                                                                                                                                                     4
 to population growth and increased
                                                                                                  emissions towards achieving a stable

                                                                                                                                                     Atmosphere
                                                  the world apart from the United States of
 scarcity
                                                  America. However its total contribution         global climate
•e
  xtreme drought, flooding and weather           overall amounts to just 1.5% of global         •T
                                                                                                   o reduce Victoria’s vulnerability through
 events and high risk of bushfires, all           greenhouse gas emissions.                                                                                       4.1
                                                                                                  adaptive responses
 predicted to increase with climate
                                                  Avoiding dangerous impacts of climate          •T
                                                                                                   o foster further government and
 change
                                                  change requires the world’s largest             community response to address the
• the particular sensitivity of temperate        emitters (both developed and developing         challenge of climate change in Victoria
   agriculture to climatic changes                nations) to make deep cuts to their
•d
  ependence on emissions-intensive               greenhouse gas emissions.
 coal for electricity, with many energy           The Garnaut Review Report points to
 intensive manufacturing industries in the        Australia’s strong interest in taking
 economy                                          mitigating action to lead the engagement
•h
  igh transport energy requirements due          of developing nations in an international
 both to Australia’s size and the legacy          agreement and decisive action to
 of low density urban design                      mitigate climate change. The Report
                                                  also states that Australia (and the world)
•h
  igh population growth rate and                 has squandered much of the available
 concentration of settlements and                 time over the past 15 years to mitigate
 infrastructure along coastlines, exposed         emissions and contain climate change
 to projected increase in the frequency           impacts.
 and severity of extreme weather events
• s ignificance of fossil fuels in Australia’s
   export trade and predominance of trade
   links with developing nations, especially
   in the Asia/Pacific regions
• the vulnerability of many of our nearest
   neighbours, which are low-lying, island
   states subject to significant impacts
   from sea level rise and where adaptive
   capacity is relatively low. The UN has
   predicted there could be up 150 million
   ‘climate change refugees’ across the
   world by 2050.

                                                  Photo: Jane Tovey

                                                                                                                                                   | 194
Part 4 State of the Environment
Atmosphere
A1.1 The natural and enhanced
greenhouse effect
The natural greenhouse effect reduces the There are large natural year to year Since the industrial revolution around
loss of heat by radiation from the Earth’s variations in climate. Natural climate 1750, the concentration of carbon dioxide
surface, keeping the surface of the planet variability will influence actual warming has increased by one-third, methane
warmer than it would otherwise be. This values in any single year or decade. has risen by 150% and nitrous oxide has
is due to the presence in the atmosphere The global warming influence due to grown 18%. The increases in carbon
of greenhouse gases, which absorb a increasing greenhouse gases is at global dioxide are due primarily to fossil fuel
proportion of the heat before it is lost scales and cumulative over many years. use and land use change, while those of
to space, and radiate some back to the At short time scales, natural variability methane and nitrous oxide are primarily
surface (see Figure A1.1.). can offset that warming influence and due to agriculture.
cause short term cooling. The long-term
Naturally occurring greenhouse gases Globally, between 1970 and 2004,
warming trend is unequivocal14.
keep the planet warm enough to sustain greenhouse gas emissions covered by
life. Without these gases, the planet’s The main greenhouse gases are water the Kyoto Protocol have increased by
average temperature would be about 33°C vapour, carbon dioxide, methane and 70% (24% since 1990). Without additional
colder - more like the moon. nitrous oxide. The Earth’s climate is policies, global greenhouse gas emissions
also influenced by natural cycles, such are projected to increase by 25-90% by
However, human activities, predominately
as 100,000 year glacial cycles due to 2030, relative to 200016.
the burning of fossil fuels, intensive
4&$5*0/$0-0634
wobbles in the Earth’s orbit, 11 year
agriculture and land
1"350/&
clearing, are causing
1"35580 1"355)3&& 1"35'063 1"35'*7&
The global dependence on fossil fuels
sunspot cycles and 2–7 year El Niño
greenhouse gas concentrations to rise continues to increase rapidly. The
cycles due to air-sea interactions.
above natural levels, further heating populations and resource intensities
the planet. This
is called
1.4
1.4
the enhanced
1.4 1.4 1.4
Burning of fossil fuels, some forms of of developed nations are growing and
greenhouse effect. As the concentrations agricultural activities and land clearing developing nations such as China and
of these gases in the lower atmosphere
/&653"-$0-0634 have contributed to high concentrations of India also now are emitting significant
grows, global temperatures rise, causing carbon dioxide, methane and nitrous oxide levels of greenhouse gases as they
changes to weather conditions worldwide. in the atmosphere. These anthropogenic continue their pathways of economic
The enhanced greenhouse
1.4 1.4
effect
1.4
is often
1.4
emissions are considered very likely – growth and higher living standards.
referred to as global warming or climate greater than 90% probability – to be the
change. cause of most of the observed increase
(3"1)4
in global average temperatures since the
mid-20th century15.
1.4 1.4 1.4 1.4 1.4 1.4 1.4 1.4 1.4 1.4 1.4 1.4 1.4 1.4 1.4
Figure A1.1 The Greenhouse Effect
Source: Department of Sustainability and Environment, 2006
The enhanced greenhouse effect
Some solar radiation Some of the infrared radiation passes through
is reflected by the earth the atmosphere, and some is absorbed and re-emitted
and the atmosphere in all directions by greenhousegas molecules.
The effect of this is to warm the earth’s surface
and the lower atmosphere
Solar radiation
passes through
the clear atmosphere
Most radiation is absorbed Infrared radiation
by the earth’s surface is emitted from
and warms it the earth’s surface
195 | State of the Environment Report - Victoria 2008
Box A1.1 Greenhouse gases • nitrous oxide (N2O), which occurs which involves a range of processes with
naturally in the environment, although different timescales. Around half the CO2
The main greenhouse gases generated
human activities increase its atmospheric emitted is removed on a time-scale of 30
by human activity are:
concentrations. This gas is most often years, a further 30% is removed within
• carbon dioxide (CO2), which is the most released when chemical fertilisers and a few centuries, and the remaining 20%
important anthropogenic greenhouse manure are used in agriculture. may stay in the atmosphere for thousands
gas and is the main contributor to of years. Methane’s atmospheric lifetime
Other greenhouse gases include some
human-induced climate change. is about 8.4 years and nitrous oxide’s is
manufactured gases such as sulfur
Carbon dioxide accounts for about two around 114 years17.
hexafluoride, chlorofluorocarbons (CFCs)
thirds of greenhouse gases produced
and some of their replacements. For purposes of measurement, all
by human activities. The primary
greenhouse gases are converted to a
source of the increased atmospheric Water vapour is another particularly
common unit, called CO2 equivalent
concentration of carbon dioxide since important greenhouse gas. However,
(CO2-e) and are measured in parts per
the pre-industrial period results from direct human emissions of water vapour
million (ppm). Parts per million (ppm) is
fossil fuel use, with land-use change are negligible. Rather it is the response
the ratio of the number of greenhouse
providing another significant but of water vapour to atmospheric warming
gas molecules to the total number of
smaller contribution. Photosynthesis which dictates its importance for climate
molecules of dry air.
by plants removes CO2 from the change. A warmer atmosphere holds
atmosphere. Before the industrial more water vapour, thereby increasing The best estimate of total CO2-e
revolution, CO2 concentrations were greenhouse trapping and resulting in concentration in 2005 for all long-lived 4
typically around 280 ppm. By 2005, this further warming. This positive feedback greenhouse gases is about 455 ppm
Atmosphere
had risen to almost 379 ppm. therefore acts to amplify the warming CO2-e. However, the corresponding value
initiated by increases in anthropogenic after the net effect of all anthropogenic
• methane (CH4), which is not as
greenhouse gases such as carbon forcing agents (including the effect of
abundant as CO2, but is 21 times more 4.1
dioxide and methane cooling aerosols) are taken into account
effective at trapping heat. It is released
is 375 ppm CO2-e. It is the combined
when vegetation decomposes in The greenhouse effect of these gases
effect of all the influences on radiative
oxygen-free environments (such as in occurs in the troposphere layer of the
forcing and the consequent net CO2-e
a fire or landfill), as well as from animal atmosphere where they are concentrated.
concentration that is most relevant to the
digestive processes. The lifetime of carbon dioxide in the
consideration of changes to the climate
atmosphere is difficult to quantify
system18.
4&$5*0/$0-0634
because it is continuously cycled between
1"350/& 1"35580 1"355)3&& 1"35'063 1"35'*7&
the atmosphere, ocean and biosphere,
Greenhouse gases are generated through Table A1.1 Examples of economic activities generating greenhouse gases
Source: Energy Information Administration (2005)19
a range of activities
1.4 including
1.4 1.4
agricultural
1.4 1.4
practices and industrial processes (see Carbon Dioxide Nitrous Oxide Methane
Table A1.1). /&653"-$0-0634
Energy generation Agriculture soil Coal mining
Figure A1.2 shows the long-term change management
in the atmospheric concentration of Transport Transport Landfills
carbon dioxide and1.4
methane1.4over the last
Cement manufacture Sewage treatment Waste management
1.4 1.4
1000 years, (3"1)4
based on ice core analysis
and direct atmospheric measurements, Metal production Landfills Rice cultivation
including at Cape Grim in north west (e.g. aluminium, and other agriculture
Tasmania. steel and iron) (e.g. cattle)
1.4 1.4 1.4 1.4 1.4 1.4 1.4 1.4 1.4 1.4 1.4 1.4 1.4 1.4 1.4
Figure A1.2 Atmospheric concentrations of carbon dioxide and methane over the last 1000 years (data from ice cores and Cape Grim)
Source: CSIRO 2007
2,000 450
CH4 ppb
CO2 ppm
Carbon dioxide from Carbon dioxide recorded
Antartic ice cores (left y axis) at Cape Grim(rigth y axis)
1,800
Methane from Antartic ice cores Methane recorded at Cape Grim
1,600 (left y axis) (rigth y axis)
400
1,400
1,200
1,000 350
800
CH4
600
300
400 CO2
200
0 250
1000 900 800 700 600 500 400 300 200 100 0
Years before present
| 196Part 4 State of the Environment
Atmosphere
The global growth rate in annual carbon Global climate change: A disturbing While CO2 concentrations, global mean
dioxide emissions has increased from picture temperature and sea level rise have been
1.1% per year in the 1990s to more than The most recent scientific publications tracking at the upper end of the range of
3% per year between 2000 and 200420. paint a disturbing picture for the IPCC predictions, the ability of terrestial
This is primarily due to increased fossil atmosphere and the climate. At the same and ocean sinks to remove carbon dioxide
fuel use, but also to land-use change time it is becoming apparent that CO2 from the atmosphere is decreasing,
(the main change being land clearing)21. concentrations, global mean temperature altering global carbon budgets28. These
Further, agriculture has played a major role and sea level rise have been growing at a factors, coupled with an increasing global
in the growth of nitrous oxide.22 faster rate than the highest of the range of CO2-e growth rate29, are likely to speed
possible emission scenarios considered up climate change and exacerbate the
Unlike other greenhouse gases, methane
by the IPCC in 200125 (see Figure A1.3). impacts of climate change in the future.
has stabilised in the last decade. After
Therefore, it must be borne in mind that Natural climate variability will influence
rapid growth of atmospheric methane
the projected upper limits of warming actual warming values in any single year
concentrations over the past 200 years,
are conservative. There is a significant or decade30.
the rate of growth has decreased since the
early 1990s and the level has remained possibility that warming may occur in Observations of greenhouse gas
relatively stable since 1999. The decrease excess of these values, particularly later in emissions indicate that current
in the growth rate in the 1990s was due to the century, although the likelihood of this concentrations of carbon dioxide and
a reduction in anthropogenic emissions23,i. occurrence is impossible to estimate at methane far exceed those at any time
Although anthropogenic methane this stage26. in the last 650,000 years31. Over the last
emissions have been rising again since In a paper published in Nature in 2008, century global surface temperatures
the late 1990s, this increase is being offset Rosenzweig et al noted that27 “most of rose by 0.7°C and northern hemisphere
by the drying of wetlands, caused by the observed increase in global average summers are, on average, 12.3 days
draining and climate change, leading to temperatures since the mid-twentieth longer than at the beginning of the 20th
reductions in natural methane emissions24. century is very likely to be due to the century. Glaciers have retreated, snow
The overall effect has been a stabilising of observed increase in anthropogenic cover has decreased in most regions and
methane concentrations since the turn of greenhouse gas concentrations, and Arctic sea-ice has reduced in thickness by
the century. furthermore that it is likely that there has almost 50%.
been significant anthropogenic warming Sea levels have risen by around 20 cm
over the past 50 years averaged over over the last century (see Figure A1.4)and
each continent except Antarctica, we the oceans have become more acidic32.
conclude that anthropogenic climate More recently, a trend has been observed
change is having a significant impact in relation to an increasing area of low
on physical and biological systems biological productivity in the north and
globally and in some continents”. Climate south Pacific and Atlantic oceans which
change’s effects are not something to may also indicate that other changes are
be considered only in the future, they are underway that were not entirely predicted
already happening now. or understood33.
Figure A1.3 Variations in the Earth’s surface temperature Year 1000 to Year 2100
Source: IPCC 2001
Departures in temperature in ºC (from the 1990 value)
Global
instrumental
observations, Northern Hemisphere, proxy data observations
6.0 Projections
5.5
5.0
4.5
4.0
3.5
3.0
2.5
2.0
1.5
1.0
0.5
0.0
-0.5
-1.0
0
1000 1100 1200 1300 1400 1500 1600 1700 1800 1900 2000 2100
i Possible reasons for reduction in anthropogenic emissions include: the economic crisis in some OECD countries (not USA) between 1990 and 2000; fewer emissions from the oil
and gas industry; and capture and better use of methane from landfills.
197 | State of the Environment Report - Victoria 2008IPCC projections indicate that global sea absorb more solar radiation than before, Just like marine ecosystems, land-based
level will likely rise by approximately 20 so adding to warming, which melts more ecosystems normally act as carbon sinks,
to 60 cm (relative to 1990 levels) by 2100 ice and snow, and so on35. This is known taking carbon from the atmosphere and
due to thermal expansion alone. However, as the Albedo effect. Indeed, the IPCC’s using it for growth. However, as these
in the long term, the IPCC has warned of Fourth Assessment Report in 2007 notes ecosystems heat up, their balance is
the potential sea-level rise associated with that as a result of the uncertainties of such altered. Plants become less and less
contraction of the Greenland ice sheet and climate-carbon cycle feedbacks, the upper effective at taking in carbon dioxide37,
the partial loss of polar ice sheets. This values of sea-level rise projections should while micro-organisms in the soil become
melting of ice sheets in Antarctica and not be considered upper bounds for sea- more and more effective at putting it out,
Greenland may add an extra 10 to 20 cm
4&$5*0/$0-0634
level rise. This contrasts with the IPCC causing the ecosystem as a whole to
to this, bringing the1"35580
1"350/&
total 1"355)3&&
projected sea1"35'*7&
1"35'063
projections for global mean temperature go from being a carbon sink to being a
level to somewhere between 20 cm and rises which include upper limits. carbon source.
80 cm34. Global climate models indicate
In addition, the IPCC report notes that Melting of the Arctic permafrost threatens
that mean sea level1.4
rise on the east coast
current models indicate virtually complete to release vast quantities of carbon dioxide
1.4 1.4 1.4
1.4
of Australia may be greater than the global
elimination of the Greenland ice sheet and and methane trapped in frozen vegetation.
mean sea level rise.
/&653"-$0-0634
a resulting contribution to sea-level rise of Recent research estimates that a major
Such loss of polar ice is important as about 7 metres if global average warming melt of large tracts of the permafrost in
white surfaces reflect more solar radiation were sustained for millennia in excess high latitudes of Russia, Canada, Alaska
than dark surfaces, so as1.4
global1.4
warming of 1.9 to 4.6°C. It also notes that more and Scandanavia could release billions
4
1.4 1.4
melts ice and snow, it leaves behind rapid sea-level rise on century time-scales of tonnes of greenhouse gases. Release
dark ocean or land; those surfaces then cannot be excluded. of even a fraction of the gases currently
(3"1)4
Atmosphere
trapped would dramatically accelerate
climate change38. The risk is a feedback
Figure A1.4 Global average sea level rise from 1870 to 2005
loop whereby increased greenhouse
1.4 1.4 1.4 1.4 1.4 1.4 1.4 1.4 1.4 1.4 1.4 1.4 1.4 1.4 1.4
Source: Church and White (2006); Holgate and Woodworth (2004); Leuliette et al. (2004)
gases cause temperature rises that further 4.1
melt the permafrost and release even
25
Sea level (cm)
Tide gauge observations (1870-2001) Tide gauge observations (1950-1999) more gases.
Satellite altimeter observations The IPCC has indicated sea level rise may
20 occur far faster than the models have
predicted as a result of such feedback
loops.
15 Whilst climate change is unequivocal,
major uncertainties in some impacts of
climate change remain where climatic
10 feedback loops cannot be predicted
accurately with current models. Ever
more worrisome evidence, however, is
5 being found that climate feedback loops
are more dangerous than previously
considered. Long term potential impacts
0 on global thermohaline circulation, melting
of the glacial permafrost, terrestrial uptake
of carbon, the rate of ocean acidification
-5 and the possibility of masking of climate
1870 1880 1900 1920 1940 1960 1980 2000 2010 change through anthropogenic emissions
of aerosols are all examples of abrupt
Year
changes to the climate that may cause
severe consequences to ecosystems
Trend of melting of the Greenland ice sheet and human settlements. Further, as
Source: Cooperative Institute for Research in Environmental Sciences (CIRES),University of Colorado36 noted by the IPCC, CSIRO and Bureau of
Meteorology, the upper limits of warming
projected to date tend to be conservative,
and there is a significant possibility that
warming and sea-level rise may occur in
excess of projections, particularly later in
the century39.
| 198Part 4 State of the Environment
Atmosphere
The complexity of the global climate
system, incomplete understanding of Box A1.2 Key milestones in 1995 - IPCC Second Assessment Report
the drivers of change to this system and the developing international “The balance of evidence suggests a
our capacity to project future emissions scientific consensus on discernible human influence on global
- plus the dependency of these on the sustainable development and climate.”
effectiveness of international responses - climate change 1997 - Kyoto Protocol adopted - UN
makes it profoundly difficult to accurately 1972 - The Limits to Growth: report agreement to reduce global greenhouse
predict the consequences of climate detailing consequences of world’s rapid gas emissions by an average 5% on
change on natural and human systems. population growth and use of finite 1990 levels; Australia a signatory but
The risk inherent in this uncertainty is that resources does not ratify.
predictions of the extremity and effects
1987 - Our Common Future: the 2001 - IPCC Third Assessment
of climate change may dramatically
Brundtland Report, alerted the world to Report “The Earth’s climate system
underestimate the speed and scale of
the urgency of making progress toward has demonstrably changed on both
the changes. In order to counter the risk
economic development that could be global and regional scales since the
of extreme consequences, governments
sustained without depleting natural pre-industrial era, with some of these
must respond quickly and decisively to
resources or harming the environment. changes attributable to human activities.”
climate change. Due to the complexity
and scale of changes required and the 1988 - The Intergovernmental Panel on 2005 - Kyoto Protocol comes into force.
competing interests involved this has not Climate Change (IPCC) set up by the 2007 - IPCC Fourth Assessment Report
occurred, to date. United Nations Environment Programme identifies unequivocal climate change;
(UNEP) and the World Meteorological “Most of the observed increase in global
The top 25 greenhouse emitting countries
Organization to provide periodic average temperature since the mid 20th
in the world together account for over
assessments of published information on century is very likely due to the observed
87% of global emissions. While being
climate change to decision-makers. increase in anthropogenic greenhouse
responsible for only 1.5% of total global
emissions40, Australia is the 14th largest 1989 - Montreal Protocol on Substances gas concentrations”; determined
emitter of greenhouse gases in the world. That Deplete the Ozone Layer. emissions need to peak in 2015.
On the emissions per capita scale of the 1990 - IPCC First Assessment Report. 2007 - The UNFCCC Bali Roadmap
top 25 emitting countries (see Figure establishes a two-year process
A1.5), Australia is the 2nd highest per 1992 - Earth Summit – UN Conference
to develop a binding international
capita41. In 2006, approximately one fifth on Environment and Development in Rio
agreement for the post-Kyoto period
de Janeiro.
4&$5*0/$0-0634
of these emissions came from Victoria42, (2013 onwards).
which generated over 120 million tonnes
1"350/& 1"35580 1"355)3&& 1"35'063 1"35'*7&
1994 - The United Nations Framework
of greenhouse gases. Between 1990 and 2007 - Australia ratifies the Kyoto
Convention on Climate Change
2006, Victoria’s emissions grew by 12%43. Protocol.
(UNFCCC) comes into force,
1.4 1.4 with the1.4
1.4
ultimate aim of stabilising atmospheric 2009 - Copenhagen IPCC/UNFCCC
1.4
Relative to other OECD countries,
Australia’s high emissions are mainly the greenhouse gas concentrations at meeting to finalise the post Kyoto
levels that would prevent dangerous (2013+) agreement on action to reduce
/&653"-$0-0634
result of the high emissions intensity of
energy use, rather than the high energy anthropogenic interference with the greenhouse gas emissions and the single
intensity of the economy or exceptionally climate system. most important stage in determining
high per capita income. Transport
1.4 1.4 1.4 1.4
whether the will to take action is present.
emissions are not dissimilar to those of (3"1)4
other developed countries. Australia’s
per capita agricultural emissions are
among the highest in the world, especially Figure A1.5 Per capita greenhouse gas emissions of world’s 25 highest emitting countries
1.4 1.4 1.4 1.4 1.4 1.4 1.4 1.4 1.4 1.4 1.4 1.4 1.4 1.4 1.4
because of the large numbers of sheep Source: World Bank
and cattle.
The high emissions intensity of energy 25
Per capita emissions (t CO2e)
use in Australia is mainly the result of
our reliance on coal for electricity. The
difference between Australia and other 20
countries is a recent phenomenon: the
average emissions intensity of primary
energy supply for Australia and OECD
countrieswas similar in 197144. 15
10
5
0
Spain
United States
Australia
Canada
Netherlands
Saudi Arabia
Russia
Kazakhstan
Rep of Korea
Japan
UK
South Africa
Italy
Ukraine
Poland
France
Iran
Mexico
China
Thailand
Turkey
Brazil
Indonesia
India
Germany
199 | State of the Environment Report - Victoria 2008You can also read