The climate impact of ICT: A review of estimates, trends and regulations - arXiv
←
→
Page content transcription
If your browser does not render page correctly, please read the page content below
The climate impact of ICT: A review of
estimates, trends and regulations
December 2020.

Charlotte Freitag, and Mike Berners-Lee. Small World Consulting (SWC) Ltd.
charlie, mike @sw-consulting.co.uk

Kelly Widdicks, Bran Knowles, Gordon Blair and Adrian Friday. School of Computing and
Communications, Lancaster University.
k.v.widdicks, b.h.knowles1, g.blair, a.friday @lancaster.ac.uk

Executive Summary
The aim of this report is to examine the available evidence regarding ICT’s current and
projected climate impacts to stimulate policy developments and governance in the ICT
sector.

We examine peer-reviewed studies which estimate ICT’s current share of global
greenhouse gas (GHG) emissions to be 1.8-2.8% of global GHG emissions. This
corresponds with the baseline estimates for policy making in Europe (i.e. ‘more than
2%’). We identify sources of variability in these estimates due to: 1) use of different
data sources; 2) variation in the recency of the data used; and 3) varying approaches
to boundaries of the analysis, specifically what is considered to be ‘in the scope’ of
ICT’s footprint and what elements of its carbon footprint are considered. Our findings
indicate that published estimates all systematically underestimate the carbon
footprint of ICT, possibly by as much as 25%, by failing to account for all of ICT’s
supply chains and full lifecycle (i.e. emissions scopes 1, 2 and fully inclusive 3).
Adjusting for truncation of supply chain pathways, we estimate that ICT’s share of
emissions could actually be as high as 2.1-3.9%. We also note the lack of public
availability of the data behind many of these estimates.

There are pronounced differences between available projections of ICT’s future
emissions. These projections are dependent on underlying assumptions that are
sometimes, but not always, made explicit. Key differences pertain to analysts’
answers to the following questions, which have important implications for policy:

Are energy efficiency improvements in ICT continuing? While European policy
assumes efficiency continues unabated at least through 2050, some experts warn that
efficiency improvements in processor technologies are reaching a limit (cf. Moore’s
Law) and could slow after 2025. If efficiency improvements to date have offset the
impact of rising demand, then a limit on further efficiencies threatens soaring future
emissions. Conversely, if efficiencies have been driving disproportionately greater
demand and hence growth in emissions, then a decline in efficiencies could help to
reduce emissions.

Are energy efficiencies in ICT reducing ICT’s carbon footprint? Throughout at least
seven decades of continuous efficiency gains in ICT, the GHG emissions of the sector
have risen steadily. This may suggest that efficiencies spur greater demand at a pace
that significantly undermines, if not exceeds, the efficiency savings gained.
Are ICT’s emissions likely to stabilise due to saturation? Some experts argue that
energy consumption by ICT will be capped by natural limits to the number of devices
people will want to own and the amount of time they have in a day to use them. And
yet, technological innovation, not least those resulting from major investment by
governments around the world are likely to produce novel applications for ICT that
drive additional energy demand. Note that the areas with the heaviest investment are
seldom user-mediated (i.e. machine-to-machine communication from machines that
run continuously in the background), so a saturation argument would not apply.

Is data traffic independent of ICT emissions? While data traffic is not directly
proportional to emissions, video streaming provides a clear example of a larger
historical pattern that rising data traffic peaks require additional internet infrastructure
to meet demand, which then allows further data-intensive services to exist, ultimately
leading to higher emissions. Netflix’s agreement with the EU to reduce their traffic and
ease the load on the network – allowing network provision for homeworkers during the
Covid-19 pandemic – further evidences that data traffic is not independent of ICT
infrastructure growth and its emissions.

Is ICT enabling carbon savings in other industries? The central premise of the new
European Green Deal is that ICT saves more emissions through the efficiencies it
enables in other sectors than it produces through its own energy consumption; ICT
has the huge potential to deliver savings and has shown its value for enabling activities
that would otherwise be restricted during the Covid-19 pandemic. However, ICT’s net
effect on global emissions depends on the extent to which ICT substitutes more
traditional, carbon-intensive activities rather than being offered in addition to them,
thereby increasing our global carbon footprint. Furthermore, ICT-enabled efficiency
improvements in other industries might lead to greater demand that more than offsets
any efficiency gains and therefore lead to increased emissions in the wider economy.

Will renewable energy decarbonise ICT? The ICT sector is leading the way in the shift
to more renewable energy consumption which has helped the sector reduce its
emissions. This shift is needed along with increases in renewable energy capacity as
all sectors will have to replace fossil fuel with energy from renewable sources. Yet,
renewable energy itself has a significant carbon footprint, embodied in its
infrastructure and supply chains and also for the time being, there are practical
constraints to the use of renewables. A limit to absolute energy consumption is most
likely needed in addition to higher shares of renewable energy to achieve ambitions
for carbon-neutrality of data centres, as per the European Commission’s recent
commitment for 2030.

Whatever position they take on these crucial questions, analysts agree that ICT will
not reduce its emissions without a major concerted effort involving broad
political and industrial action. Under business as usual, the most optimistic
projection sees ICT’s emissions staying stable at the current level. Yet, the global
economy needs to reduce its emissions by more than 42% by 2030, more than 72%
by 2040, and more than 91% by 2050 in order to meet the Paris Agreement goal of
staying within 1.5°C, and it remains to be seen whether the ICT sector itself must
reduce at a rate on par with the global economy or is justified in reducing at a slower
pace. This depends on the balance between the carbon savings that are enabled by

                                                                                          2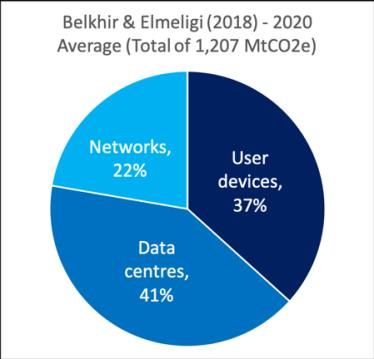
ICT and the carbon costs of ICT in enabling those savings. There are three reasons
to believe that ICT’s emissions are going to increase barring a targeted
intervention:
    • Firstly, we note that historically, ICT-enabled efficiency improvements have
      gone hand in hand with increases in energy consumption and GHG
      emissions both within the ICT sector and in the wider economy. While it
      cannot be proven that ICT efficiency gains lead to rebounds in emissions that
      outweigh any savings, there are so many circumstances in which reductions in
      inputs per unit of output lead to a net increase in inputs that this has to be a
      significant risk; and one that is often underappreciated. If this dynamic does
      apply, the only ways to harness emission savings from efficiencies may be
      through a constraint on consumption (as like Covid-19 has temporarily
      imposed), or a carbon constraint (such as a carbon tax or a cap on emissions).
    • Secondly, current studies make several important omissions surrounding
      the growth trends in ICT. Blockchain is generally excluded from calculations,
      and Internet of Things (IoT) devices are sometimes partly included but their
      effect on complementary growth in energy consumption by data centres and
      networks is not. These trends alongside Artificial Intelligence (AI) do offer
      opportunities for efficiency gains, but there is no evidence to suggest these
      create GHG savings that outweigh the additional emissions these technologies
      would cause. Moreover, while associated carbon footprints might be acceptable
      in scenarios where these technologies are applied toward realising greater
      carbon reductions in the wider economy, it is certainly not the case that the
      majority of the innovation in these trending areas is for the purposes of yielding
      carbon reductions, and so could be purely additional.
    • Thirdly, there is significant investment in developing and increasing
      uptake of Blockchain, IoT and AI. All three represent key market
      opportunities, provide a range of claimed public benefits and are further
      believed by some to enable up to 15% reductions in global emissions. While
      significant if achieved, this falls well short of the reductions needed to meet
      climate change targets. There is a risk that these technologies might also
      contribute to increases in emissions through stimulating increased carbon-
      intensive activities such as ‘Proof of Work’ algorithms and training ever more
      complex machine learning models.

In light of these considerations, it seems risky, at the very least, to assume that ICT
will, by default, assist in the attainment of climate targets.

Recently, some large technology corporations have pledged to voluntarily reduce their
carbon footprint and counteract emissions through offsets. Not all pledges are
ambitious enough to meet net zero targets by 2050, and so far, there are no
mechanisms for enforcing sector-wide compliance.

Without a global carbon constraint, we contend that a new regulatory framework
is required to introduce an ICT-specific constraint on carbon or energy
consumption – ensuring that the full impacts of ICT are considered systematically
and drawing consistent boundaries for analysis that are fully inclusive of supply chains.
This needs to be backed by the availability of objective and high-quality data reviewed
on an annual basis that can be openly and repeatedly inspected. ICT has clearly
demonstrated significant potential for year-on-year efficiency improvement and better

                                                                                       3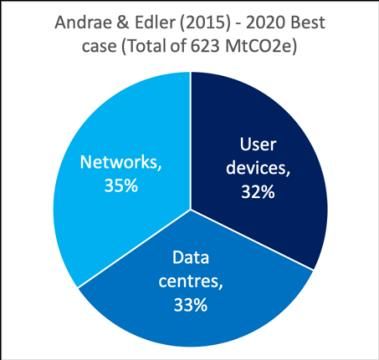
exploitation of green energy, but without a cap and inclusion of the full lifecycle of ICT,
it looks likely that carbon savings through efficiency improvements will continue to be
outpaced by rising demand through rebound effects rather than achieve net zero from
ICT efficiency gains. We contend that this should be the default assumption in
the absence of strong evidence of a change in the dynamics of efficiency and
growth, capable of causing ICT to buck its historical trend.

However, we also contend that if a global carbon constraint were introduced,
efficiencies within and enabled by ICT would be even greater enablers of
productivity and utility than they are today. A global carbon constraint is therefore
a significant opportunity for the ICT sector.

                                                                                         4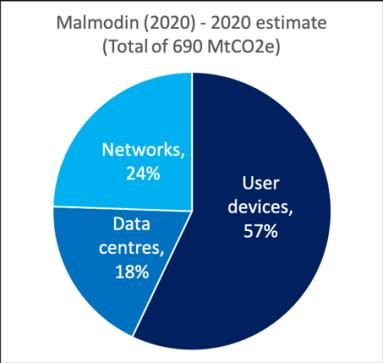
Report Contents
1. Introduction ............................................................................................................. 7
1.1 Jevons Paradox ............................................................................................................ 8
2. Estimating the Carbon Footprint of ICT ....................................................................11
2.1 ICT’s carbon footprint ................................................................................................ 11
2.2 ICT’s future carbon footprint: unpacking the studies’ assumptions .............................. 17
2.3 Summary of ICT’s carbon footprint ............................................................................. 23
3. ICT Trends: Opportunities and Threats .....................................................................26
3.1 Big Data, Data Science and AI ..................................................................................... 26
3.2 The Internet of Things ................................................................................................ 27
3.3 Blockchain and Cryptocurrencies ................................................................................ 29
3.4 Summary ................................................................................................................... 31
4. Current Policy Developments and Governance in ICT ...............................................33
4.1 European Policy and ICT ............................................................................................. 33
4.2 Self-regulation within the ICT industry........................................................................ 35
4.3 Summary ................................................................................................................... 36
5. Conclusion ..............................................................................................................38
6. Acknowledgements .................................................................................................40
References .....................................................................................................................41
Appendix ........................................................................................................................52
A Methodology ..........................................................................................................52
A.1 Definitions ................................................................................................................. 52
A.2 Abbreviations ............................................................................................................ 57
A.3 Units.......................................................................................................................... 58
A.4 Scope ........................................................................................................................ 58
A.5 Method ..................................................................................................................... 58
A.6 Limitations................................................................................................................. 60
B Estimates of ICT Emissions .......................................................................................62
B.1 Historical Estimates of ICT’s GHG footprint ................................................................. 62
B.2 Detailed Review of the Key Studies ............................................................................ 62
B.3 Drivers of change in ICT Future Emissions ................................................................... 75
B.4 Reports out of scope of the review ............................................................................. 76
C Video Streaming......................................................................................................77
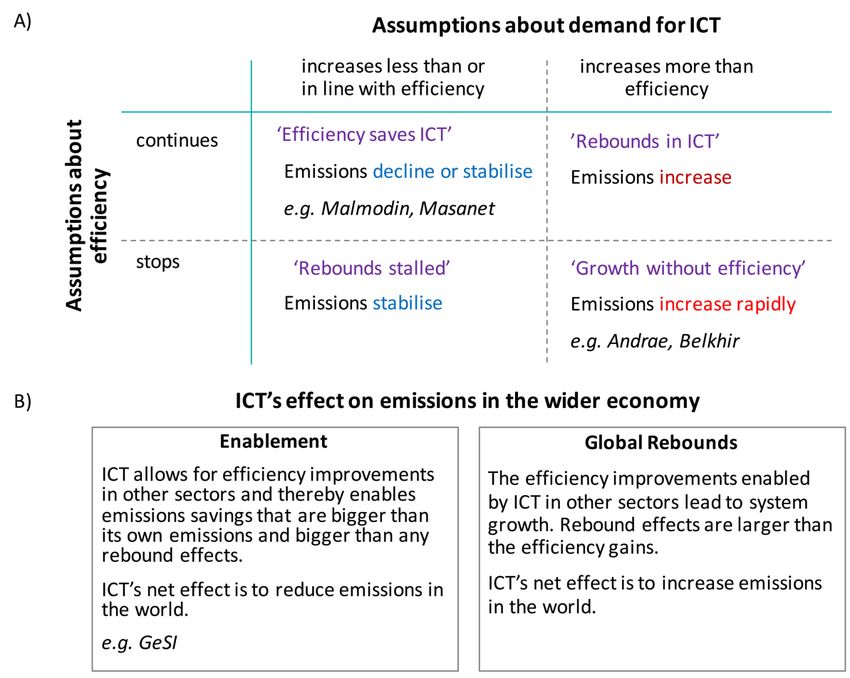
D Narratives ...............................................................................................................79
E Truncation Error ......................................................................................................80
F European Commission’s Investment in ICT ...............................................................83
F.1 Artificial Intelligence .................................................................................................. 83
F.2 Internet of Things ...................................................................................................... 83
F.3 Blockchain ................................................................................................................. 83
G Carbon Pledges .......................................................................................................84
G.1 Carbon Neutral .......................................................................................................... 84
G.2 Net Zero .................................................................................................................... 84
G.3 Carbon Negative ........................................................................................................ 85
5G.4 100% Renewable ....................................................................................................... 85
G.5 Why scope matters .................................................................................................... 86
H Renewable Energy Purchases ..................................................................................86
H.1 On-site Generation .................................................................................................... 86
H.2 PPA with Bundled REGOs ........................................................................................... 86
H.3 Unbundled REGO ....................................................................................................... 86
61. Introduction
The Information and Communication Technology (ICT) sector has seen a massive
growth in the last 70 years. With large parts of the economy not yet digitised and
emerging economies entering the market, ICT is set to grow even further over the next
decade [The Economist 2020]. At the same time, there has been an increasing
awareness of the potential environmental effects of ICT, particularly on climate change
[e.g. Kaapa 2017, Guardian Environment Network 2017, Belkhir 2018, Tarnoff 2019,
BBC iPlayer 2020].
The impact that the ICT sector has on climate change can be expressed as a carbon
footprint: that is, an estimate of the amount of greenhouse gases (GHG) released
because of a product or activity from all its lifecycle stages. This includes embodied
emissions (the GHG emissions released from the extraction of raw materials required,
the manufacturing process and transport to the business or user), use phase or
operational emissions (from energy use and maintenance) and end-of-life emissions
(emissions after disposal).
This report looks at the evidence on the climate change impacts of ICT now and in the
future, both through its own GHG emissions and through its effect on the wider society
and economy (Section 2). Central to this is the question of efficiency, and whether
efficiency gains may reduce emissions over time or if they are more than offset by
‘rebound effects’. In this context, we take a broad view of rebound effects to include
any increase in emissions due to the introduction of ICT or the efficiencies it enables
(see Section 1.1 Jevons Paradox for an example of a rebound effect). We also explore
important trends in ICT (namely: big data, data science and Artificial Intelligence (AI);
the Internet of Things (IoT); and Blockchain) that could provide both opportunities and
risks for global emissions (Section 3), as well as relevant government and industry
policies (Section 4).
In the study, we have adopted a broad definition of ICT to include all types of data
centres, networks and user devices (see Appendix A for Methodology). While there
are limitations to our study in terms of the literature review scope and the uncertainties
of carbon calculations (see Appendix A.6), we are confident we have captured the
main debates regarding this topic, and contribute to those debates through our focus
on GHG emissions. We specifically focus on GHG emissions rather than electricity
consumption as the former drives climate change and the latter does not capture
important factors surrounding ICT’s environmental impact (see Appendix A.6).
Given the significance of the topic, there are surprisingly few studies analysing the
environmental impact of ICT and they are often characterised by a lack of
interrogatability, potential for conflict of interest, a limited scope that leaves out growing
ICT trends and an underestimation of ICT’s carbon footprint because significant
proportions of total emissions are omitted. We have therefore extended our data
collection process to include consultations with the lead authors of the main studies
included in this review in order to better assess their ICT emission estimations. We
endeavoured to understand both the criticisms levelled at each study and how they
are countered. We also looked carefully at potential motivations, the quality and
transparency of data underpinning the work, and the resources that each study had at
its disposal.
7Whilst we found broad agreement on the size of ICT’s current carbon footprint, there
are a range of different views with regards to ICT’s future role in climate change – both
in terms of ICT’s own carbon footprint and its effect on the wider economy’s emissions.
We discuss the arguments and assumptions underpinning these different views and
their policy implications in the following sections.
1.1 Jevons Paradox
In 1865, William Stanley Jevons predicted that as the UK’s use of coal became more
efficient, it would make coal more attractive and thereby would increase demand for
coal rather than reduce it [Jevons 1865]. Jevons Paradox refers to a situation in which
an efficiency improvement leads to an even greater proportionate increase in total
demand, with the result that resource requirement goes up rather than down, as is
often assumed. There is evidence that Jevons Paradox applies beyond coal [e.g.
Alcott 2005, Sorrell 2009, Schaffartzik et al. 2014]. An example is the increased energy
efficiency of new forms of lighting (such as electric lighting compared to gas lighting)
which allowed lighting to be used more widely – increasing the total energy
consumption from lighting. Another demonstration is the fact that electric trains are
vastly more efficient than steam trains, let alone horses, yet the carbon footprint of
land transport has continuously risen over the time period that these technological
advances took place due to expanded use [Berners-Lee and Clark 2013].
While Jevons Paradox is linked with efficiency as the principal driver of rebound
effects, the paradox is frequently linked more broadly to a wide range of socio-
economic drivers leading to a perverse increase rather than decrease in input demand.
Macro-economic models suggest that this ‘backfiring’ or rebound effect leads to
savings being cancelled out completely on average and even adding input demand
relative to previous levels through a variety of mechanisms. 1 At the global level,
efficiency improvements in almost every aspect of life have gone hand in hand with
rising energy demand and rising emissions.
It is sometimes argued that without the efficiency improvements, demand would have
increased even further; this assumes that demand would rise independently of
efficiency. It is also argued by some [e.g. GeSI 2015; UK Energy Research Council
2007] that rebound effects are less than 100% of the efficiency savings, but this often
results from an incomplete consideration of rebound pathways, especially macro-
economic effects. To assess the full impact of rebound effects, all parts of the economy
and a longer timescale need to be considered. The only way to feasibly do this is to
analyse the combined effect of all global efficiency gains in all sectors and to track this
1 Jevons Paradox and rebound effects are explored in more detail in Berners-Lee and Clark’s book The
Burning Question (2013). Briefly, they argue that when we improve energy efficiency, the available
energy becomes more productive and therefore more valuable, leading to increased use. This is
because any energy saved bounces back as additional energy elsewhere, either because: 1) efficiency
makes the use of the resource cheaper (e.g. lighting, cloud storage of more data than with traditional
file storage), 2) the savings are spent on other activities with a carbon footprint, 3) lower resource use
leads to lower prices which increases demand for the resource elsewhere, or 4) knock-on effects in
other areas of the economy (e.g. when video conferencing enables forming relationships with people
on the other side of the world, leading to more air travel to visit them). Resource use can also be
displaced into another country (e.g. when burning of fossil fuel domestically is restricted to lower the
country’s emissions but fossil fuel is continued to be extracted for exports to other countries with fewer
environmental concerns).
8against global energy use. This analysis yields a total energy rebound averaging
102.4% over the past 50 years (i.e. the annual global growth in energy use) [Berners-
Lee and Clark 2013]. Despite the increasing utility per unit of energy, the world’s
energy use is increasing. The same holds true for emissions. Over the last 170 years,
CO2 emissions have been rising at 1.8% per year (with only temporary deviations on
either side of that trajectory) [Berners-Lee and Clark 2013] alongside the growth of
ICT, vast efficiency gains in ICT and other technological advances in other industries.
In terms of the ICT industry, it has been argued that it is through its increasing
efficiency that computational power has risen and ICT has been able to become so
important in society; the energy consumption of early computers would have been
prohibitive for the scale of expansion we have seen over the last decades
[Aebischer and Hilty 2015]. An analysis of dematerialisation by Magee and
Devezas [2017] found evidence that, in the ICT industry, efficiencies in the material
needed for a single product lead to either increasing performance or reduced prices
and that this inadvertently leads to increases in demand, resulting in an increase in
absolute material consumption. Silicon is one example as it holds a special place in
information storage, transmission and computing. Other examples of rebound effects
in ICT are provided by Gossart [2015], Galvin [2015] and Walnum and Andrae [2016].
Galvin [2015] estimates that rebound effects in ICT’s energy use could range between
115% and 161% based on eight case studies, as efficiency is more than offset by
increases in demand.
In addition to efficiencies within the ICT industry, ICT-delivered efficiencies can also
have far-reaching effects in other industries – in what we will call Global Rebounds. In
recent years, ICT has increasingly expanded into other sectors. Common examples
include video conferencing technologies or online shopping which could reduce the
need to physical travel or reading news on a smartphone. These have the potential to
both decrease and increase environmental impact. Where these new technologies
evolve to be more energy intensive than their alternatives (e.g. high-quality video
streaming), where they are used in addition rather than as a substitute (e.g. e-books
being used alongside paper books), or where they allow intensified activity or growth
in other industries because they are cheaper, more productive or more convenient
(e.g. more regular checking of news on a smartphone than with traditional newspapers
leading to increased need for news production), the impact of the economy as a whole
in terms of energy use, resource use or GHG emissions can increase [Court and
Sorrell 2020].
In a systemic review of the direct and economy-wide impact of e-materialisation (such
as e-publications, e-games, e-music etc.) on energy consumption, Court and
Sorrell [2020] found that studies systematically neglect rebound effects. Most studies
assume substitution of old technology with the new digital system where this
assumption is not always justified, leading to overestimates of energy savings.
Assumptions around the lifetime, the number of users, efficiency of user devices and
the replacement of travel lead to a wide range of predictions from 90% decreases to
2000% increases in energy consumption. They conclude that there is no conclusive
evidence suggesting significant current or future energy savings from e-
materialisation. There is another aspect to efficiency: psychological spillovers through
moral licensing where people feel that they have done their part for the environment
when increasing efficiency and then go on to have an increased environmental impact
elsewhere [Sorrell et al. 2020] - but this is out of scope for this report.
9The net effect of ICT depends on the balance of impacts it has both through its own
emissions and the effects it has on the wider economy. The economy-wide effects of
ICT are difficult to quantify, but in the absence of solid evidence, it would at the very
least be risky to assume that the Jevons Paradox and other rebound effects (e.g. time
rebounds [Börjesson Rivera et al. 2014]) do not apply to ICT’s direct and economy-
wide impact.
102. Estimating the Carbon Footprint of ICT
In this section, we provide the following:
• a broad overview of the estimates for ICT's carbon footprint before 2015;
• an in-depth analysis of three major peer-reviewed studies of ICT's own
greenhouse emissions;
• an overview of the arguments and assumptions underpinning the different
estimates for ICT’s future carbon emissions and ICT’s impact on the wider
economy;
• a summary of what this analysis means for global climate targets.
2.1 ICT’s carbon footprint
Historically, ICT emissions have grown continuously alongside global
emissions.
Several studies prior to 2015 have estimated the carbon footprint of ICT (summarised
in Figure 2.1 see also Table B.1 in Appendix B.1 for a summary). These show an
increase in ICT’s carbon footprint over time, even without these studies considering
the full life cycle emissions. This growth in ICT’s emissions has coincided with
consistent growth in our total global carbon footprint [Ritchie and Rose 2019].
Figure 2.1 Estimates of ICT’s carbon footprint from studies published before 2015. The linear best fit line shows
the increase in emissions with time, although the growth is not necessarily linear.
Scientific debate over ICT’s emissions has intensified in the last five years. We
therefore focus on research since 2015 – especially studies by three main research
groups led by Andrae [Andrae and Edler (A&E) 2015, Andrae 2019a, 2019b, 2019c],
Belkhir [Belkhir and Elmeligi (B&E) 2018] and Malmodin [Malmodin and Lundén (M&L)
112018; Malmodin in personal communication].2 We summarise the arguments here and
direct the reader to Appendix B where we analyse these studies in more depth and
provide an overview of reports deemed out of scope for this review.
2.1.1 ICT’s current carbon footprint
ICT is estimated to form ca. 1.8-2.8% of global GHG emissions in 2020
Estimates of ICT’s emissions in 2020 (see Figure 2.2) vary between 0.8 and 2.3
GtCO2e. The highest estimates (A&E ‘worst case’) put ICT's share of global GHG
emissions around 6.3%, but Andrae now believes that the A&E 'best case' scenario of
around 1.5% is more realistic for 2020 [personal communication]. B&E’s estimates are
higher at 1.9-2.3%, especially considering they omit TVs in their total estimate.
Malmodin’s estimates sit in between the others at 1.9% of global emissions. When
adjusting for differences in scope (see Table B.4 in Appendix B.2.2), these studies
point towards a footprint of 1.0-1.7 GtCO2e for ICT, TVs and other consumer
electronics in 2020; this is 1.8-2.9% of global GHG emissions. We stress that this
estimate carries some uncertainty but gives us a reasonable idea of the impact of ICT.
Across studies, roughly 23% of ICT’s total footprint is from embodied emissions, yet
the share of embodied emissions for user devices specifically is ca. 50%. This is
because, unlike networks and data centres, user devices are only used for parts of the
day and use less electricity, but are exchanged often, especially in the case of
smartphones.3
2 A&E [2015] estimate ICT’s emissions for every year 2010-2030, B&E [2018] for 2007-2040 and M&L
[2018] for 2015. Malmodin has also provided additional estimates for 2020 to us in personal
communication.
3 Electricity consumption of user devices and domestic equipment has decreased over the last 15-20
years driven by legislation and public procurement policy such as the EU ERP directive and EnergyStar
[Preist, personal communication]. However, efficiency improvements will not be able to reduce
embodied emissions drastically. While production processes are becoming more efficient, the
manufacturing footprint of smartphones is increasing because of more advanced integrated circuits,
displays and cameras [Malmodin, personal communication]. With a large share of their footprint coming
from their manufacture, extending smartphones’ lifetime is the best way to reduce their footprint. Most
studies reviewed here assume an average lifetime of 2 years, partly driven by phone contracts that
promise users the newest models [B&E]. There are some signs, though, that this might be increasing
slightly. For example, the NPD [2018] reported that in the US, the average use has increased to 32
months in 2017 up from 25 months in 2016. Legislation encouraging repair e.g. the EU Waste Electrical
and Electronic Equipment (WEEE) Directive, can help, alongside business models centering around
service rather than product provision or selling repairable products to markets in the Global South
[Preist, personal communication].
12Figure 2.2 Estimates for global ICT’s carbon footprint in a) 2015 and b) 2020. Note that for M&L’s estimates, TV
includes TV networks and other consumer electronics (Error! Reference source not found. in Appendix B.2.1),
whereas for A&E’s estimates, only TVs themselves and TV peripherals are included. B&E did not include TVs.
M&L’s original estimates for the ICT and E&M sector includes paper media which we have excluded here. A
breakdown of these estimates can be found in Table B.3 in Appendix B.2.2.
There are important differences in how analysts arrived at these estimations
There is a lack of agreement about which technologies ought to be included in
calculations of ICT's GHG emissions – particularly TV (see Appendix B.2.1). All
studies include data centres, networks and user devices as the three main
components of ICT, but there are pronounced differences of opinion regarding the
proportional impact of each. A comparison of the different proportions in 2020
estimates (excluding TV) is provided below (Figure 2.3 Proportional breakdown of
ICT’s carbon footprint, excluding TV. A&E’s Best Case is displayed because more
recent analysis by the lead author suggest that this scenario is most realistic for 2020.
Note that Malmodin’s estimate of the share of user devices is highest; this is mostly
because Malmodin’s network and data centre estimates are lower than those of the
other studies.).
13Figure 2.3 Proportional breakdown of ICT’s carbon footprint, excluding TV. A&E’s Best Case is displayed because
more recent analysis by the lead author suggest that this scenario is most realistic for 2020. Note that Malmodin’s
estimate of the share of user devices is highest; this is mostly because Malmodin’s network and data centre
estimates are lower than those of the other studies.
Regarding data centres, Belkhir himself noted that his projection of 495 MtCO2e for
data centres in 2020 is overestimated [personal communication]. Recent evidence by
Masanet et al. [2020] of 205 TWh total energy use in 2018 seems to converge with
Malmodin’s estimate of 127 MtCO2e in 2020. Assuming a global electricity mix at 0.63
kgCO2e/kWh, Masanet et al.’s estimate comes to ca. 129 MtCO2e – higher than A&E’s
best case estimate of 217 MtCO2e.
Studies systematically underestimate the carbon footprint of ICT due to
truncation error
Malmodin’s studies are the most comprehensive as they include operator activities
and overheads (e.g. offices and vehicles used by data centre and network operators),
as well as considering the full lifecycle emissions of equipment (i.e. from production,
use, to disposal) rather than just production energy (A&E) or only material extraction
and manufacturing energy (B&E).
However, A&E, B&E and M&L all follow Life Cycle Analysis (LCA) methodology which
is unable to include the infinite number of supply chain pathways of a product, thereby
incurring ‘truncation error’ in their carbon accounting. They also do not consider the
full carbon footprint of electricity used to run ICT equipment. This can be rectified by
combining LCA with Environmentally Extended Input Output (EEIO) methodologies –
taking into ICT’s scope 1, 2 and 3 emissions – and adjusting the carbon intensity factor
of electricity. When these omissions are adjusted for truncation error (see Appendix
F), the carbon footprint for ICT, including TVs and other consumer electronics, rises
to 1.2-2.2 GtCO2e (2.1-3.9% of global GHG emissions) in 2020 with ca. 30% coming
from embodied emissions and 70% from use phase emissions. We stress once more
that these are rough estimates with a significant degree of uncertainty.
2.1.2 ICT’s future carbon footprint
There is broad agreement by analysts in the field on certain key assumptions.
• The world’s carbon footprint needs to decrease to avoid climate catastrophe;
• Data traffic is continuing to grow;
• Energy demand by ICT is increasing;
• Demand for data centres and network services will increase;
14• The shift to smartphones is decreasing emissions from PCs and TVs;
• Using more renewable energy would reduce ICT emissions;
• ICT could reduce emissions in other sectors but not by default and only under
certain conditions (contrasting to GeSI’s [2015] SMARTer 2030 claims);
• ICT has the potential to increase its own emissions and facilitate rising
emissions in other sectors.
Opinions are more divided regarding future trends in emissions.
From 2015 to 2020, B&E’s and A&E’s estimates of ICT emissions have increased due
to an increase in data traffic and the number of user devices (see Figure 2.2). In
contrast, Malmodin’s estimates have decreased slightly – mostly for data centres (by
10%), due to an increased adoption of renewable energy, and networks (by 8%), due
to decreases in overheads, despite increases in their electricity consumption.
Malmodin [personal communication] argues that: GHG emissions from ICT have
stabilised for now; ICT and Entertainment and Media (E&M) sector growth is starting
to decouple from GHG emissions; and that ICT could even halve its 2020 emissions
by 2030 through renewable energy transformation and collective effort [Malmodin
2019], to 365 MtCO2e in 2030 [Malmodin, 2020]. In contrast, B&E and A&E believe
that emissions from ICT will continue to grow (see Figure 2.4). We explore the
differences of opinion between the three in more detail in Appendix B.3.
All analysts think that, theoretically, it would be possible for ICT to decrease its
emissions with broad political and industry action – but Malmodin is more optimistic
that this will happen than B&E and A&E. A recent Ericsson report [2020] based on
M&E claims that ICT’s emissions could be reduced by 80% if all its electricity came
from renewable sources.
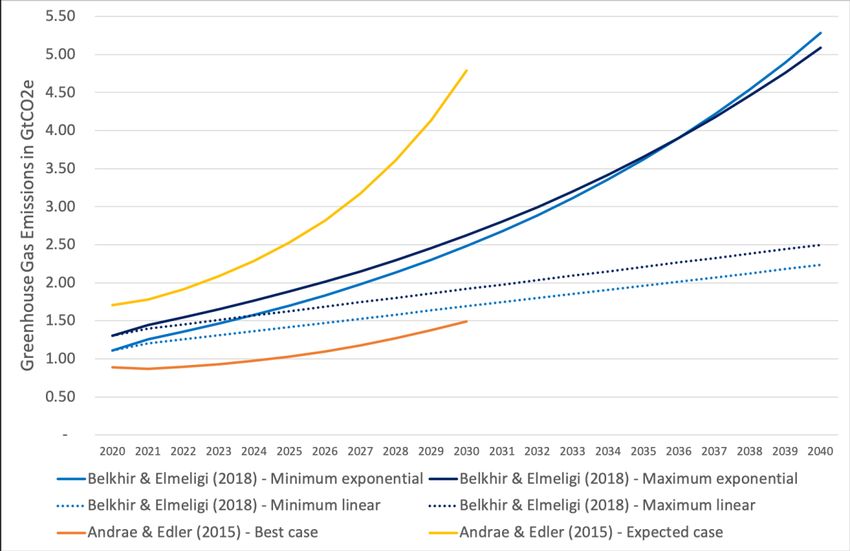
15Figure 2.4 Projections of ICT’s GHG emissions from 2020. B&E judge their exponential scenario as most realistic
while the linear growth scenario is more conservative and reflects the impact of mitigating actions between now
and 2040. M&L [2018] did not make concrete estimates beyond 2020, but Malmodin suggests ICT’s carbon
footprint in 2020 could halve by 2030 – offering a 2030 estimate of 365 MtCO2e in a recent techUK talk [Malmodin,
2020].
Differences in predictions could be due to age of data used.
The data underlying A&E’s and B&E’s work is somewhat older4 considering ICT’s fast
pace of development, meaning their projections are potentially based on historical
trends that might no longer apply, such as the assumed exponential growth of energy
consumption by data centre and networks. In contrast, M&L might better capture
recent changes in emission trends given their estimates are based on data measured
directly from industry.5 M&L also have the most inclusive scope in terms of ICT
equipment, lifecycle stages and supply chain emissions considered (see Appendix
B.2.1).
However, this access to industry data inevitably comes at the price of a lack of data
interrogatability. Part of Malmodin’s data was obtained by ICT companies under
confidentiality agreements, preventing others from reviewing the original data and the
model’s assumptions and calculations. There are also potential risks of conflicts of
interest as both authors work for network operators.6 arguably makes M&L’s paper
open to concerns that claims are less reliable due to selective reporting and
assumptions that cannot be properly assessed. We are not suggesting that they
cannot be trusted, but the lack of transparency makes independent data and analysis
4
A&E uses some data from 2011 for data centre and networks, while B&E uses data from 2008 for
data centres and from 2008-2012 for networks.
5
M&L’s estimates are based on 2015 data; Malmodin’s more recent estimates provided in personal
communication are based on data from 2018 onwards.
6
Malmodin works for Ericsson. Lundén works for Talia.
16difficult, and transparency is necessary for important policy decisions. As employees
of Huawei, A&E also have potential for conflict of interest, but their study is transparent
about their data sources, calculations and assumptions. B&E have no obvious conflict
of interest and they use only peer-reviewed and publicly available sources.
Due to the trade-off between data interrogatability and up-to-date data, it is impossible
to judge which study makes the most reliable predictions about ICT’s future emissions
based on methodology alone. It is possible, however, to examine their arguments and
the underlying assumptions in order to assess which projection is more likely.
2.2 ICT’s future carbon footprint: unpacking the studies’ assumptions
In the key studies reviewed here, there is disagreement on whether or not:
• energy efficiencies in ICT are continuing;
• energy efficiencies in ICT are reducing ICT’s carbon footprint;
• ICT’s carbon footprint will stabilise due to saturation in ICT;
• data traffic is independent of ICT emissions;
• ICT will enable emissions savings in other industries;
• renewable energy will decarbonise ICT.
These assumptions have a critical influence on what we can conclude about ICT’s role
in climate change. We therefore explore the arguments on both sides of the
assumptions next to shed some light on the most likely path of ICT’s future emissions.
In doing so, we draw on several other much-cited sources and our consultation with
key experts.
2.2.1 Are energy efficiency improvements in ICT continuing?
Yes, there is scope for energy efficiency improvements in ICT to continue
There has been a long history of ICT equipment becoming more efficient (and thus
cheaper and more productive) with time. Moore’s Law allowed the ICT industry to
exponentially increase chips’ performance, speed and reduce their power
consumption. The exponential improvements of processors has kept the exponential
growth in demand partly in check in terms of energy consumption.
While M&L acknowledge that Moore’s Law has slowed down since 2012, they note
that there is usually a time lag before the effects are felt outside of research labs –
therefore arguing that efficiencies are continuing for now. Masanet et al. [2020] argue
that there is scope for further efficiency improvements in data centres through:
improvements in server virtualisation; efficiency gains in servers, storage devices and
data centre cooling technology; and the move towards large data centres that are more
energy efficient due to efficiencies of scale and the ability to invest in AI to optimise
energy use.
For efficiency improvements in user devices, there is evidence of carbon savings from
TVs: older, more energy-intensive CRT and plasma TVs have been replaced by more
efficient LED TVs; and TV sales have dropped due to users now watching video on
laptops and smartphones (B&E, Malmodin). However, smart TVs could change this
trend if they become a popular way to access streamed media [Preist, personal
communication].
17No, energy efficiency improvements are slowing down and are not fully utilised
Efficiency improvements might be coming to an end – a view echoed by some of the
experts we have consulted (e.g. Peter Garraghan, Belkhir, Andrae). As transistors
have shrunk in size and increased in speed, they have begun to heat up; this led to
manufacturers putting a speed limit on processing in 2004. The problem now is
‘quantum entanglement’ where transistor layers become so thin that electrons jump
between them, making transistors increasingly unreliable [Waldrop 2016]. Other
avenues may exist for improving efficiencies (e.g. decreasing semiconductor use
stage power and nanophotonics [Andrae 2020]), but possibly not on the same time
scales [Simonite 2016] or with the same size of efficiency gains.
If processor efficiencies are reaching a limit, data centres’ power consumption will
likely rise as increasing demand will no longer be counterbalanced by increasing
efficiency. Despite some remaining scope for further efficiency improvements,
Masanet et al. [2020] note that there are limits to efficiency improvements and that
energy demand will not stabilise by itself – arguing that urgent policy action and
investment are needed to limit increases in energy use driven by increasing demand.
Furthermore, efficiencies in ICT do not always guarantee replacement of the older,
less efficient equipment,7 and new devices8 or user habits9 may conflict with
replacement gains.
2.2.2 Are energy efficiencies in ICT reducing ICT’s carbon footprint?
Yes, energy efficiencies in ICT can reduce ICT’s carbon footprint
Malmodin argues that so far, efficiency improvements are continuing, and data centre
emissions are expected to stay at 1% of global electricity and at the same level of
emissions as in 2015 in the next five years. Furthermore, Masanet et al. [2020]
reported that data centres’ operational energy consumption has increased only
marginally from 194 TWh in 2010 to 205 TWh in 2020 despite global data centre
compute instances increasing by 550% over the same time period – showing the
effectiveness of efficiencies in ICT. Masanet et al. [2020] also note that these efficiency
improvements would be able to offset a doubling of data centre demand relative to
2018; beyond that point, energy demand will rise rapidly. This is in line with what
Belkhir [personal communication] believes, although he is less optimistic about the
remaining scope for efficiency improvements.
No, energy efficiencies drive growth in ICT’s carbon footprint due to rebound effects
As highlighted above, ICT has seen rapid and continuous efficiency gains. Yet
increases in demand for more computations and the number of ICT-enabled devices
per person have outpaced these energy efficiency improvements, resulting in ICT’s
energy consumption, and therefore ICT’s carbon footprint, growing year-on-year. This
pattern fits with the rebound effect described by Jevons Paradox (Section 1.1)
whereby an efficiency improvement leads to an even greater proportionate increase
7
For example, the development of 5G networks while 2G, 3G and 4G networks still exist.
8
Some new ICT devices like smart watches and smart speakers are used by people in addition to
smartphones and laptops. Court and Sorrell [2020] also highlight the issue of incomplete substitution of
e-materialisation trends like e-news or e-books.
9
For example, multiple user devices in the home have led to a third of UK households watching
separate video content simultaneously in the same room once a week [Ofcom 2017] where people may
have watched content using the same TV before (see Appendix C).
18in total demand, meaning total resource requirements rise rather than decrease, as is
often assumed. While Jevons Paradox has not been proved to apply within the ICT
industry, it is risky to assume it does not apply given historical evidence of ICT
emissions consistently rising despite significant efficiencies in the sector (Section 2.1).
It would be surprising if rebound effects in ICT – and Jevons Paradox in particular –
were to end in the future without a foundational change [Hilty et al. 2011]. There is a
theoretical alternative scenario (the reverse of the Jevons Paradox rebound effect)
where stalled energy efficiency growth leads to a plateau in ICT emissions due to
prohibitive costs as increasing demand cannot be counterbalanced by efficiency
improvements any longer. There is little precedent for this in prior work.
2.2.3 Are ICT’s emissions likely to stabilise due to saturation?
Yes, the world will become saturated with ICT and this will stabilise ICT’s emissions
The studies reviewed here all agree that the number of smartphones is increasing.
According to Cisco [2020], there will be 5.7 billion mobile subscribers by 2023 – 71%
of the world population. However, within a few years, every person on earth might
have a smartphone and the total number might not further increase [Malmodin in
personal communication]. There is some evidence suggesting that the average
lifetime of smartphones is increasing too [NPD 2018], which will decrease the yearly
embodied carbon associated with people replacing their smartphones. In addition,
Malmodin argues that there is a limited time per day that people can be using their
phones, theoretically capping energy consumption. The same pattern of saturation
could be true for other ICT equipment.
No, innovation will prohibit saturation in ICT
In general, ICT companies have a strong incentive to prevent saturation from
happening as this would cut their income growth. There is economic pressure for them
to create new technologies for individuals and organisations to buy. An example of
this is the increase in IoT devices which require little person time and can operate in
the background, driving both embodied and use phase emissions from the production
of billions of IoT devices, the networks allowing them to communicate and from data
centres that analyse the IoT data (see Section 3.2). Other important trends (Section
3) such as AI analytics would also escape this natural saturation. The history of ICT
does not provide precedents for a saturation effect; it is therefore unlikely to occur
without active intervention. Furthermore, there is still scope for more ICT infrastructure
growth beyond smartphones before this innovation cycle even begins, e.g. for data
centres in the Global South [Preist, personal communication].
2.2.4 Is data traffic independent of ICT emissions?
Yes, ICT emissions are largely independent of data traffic
The amount of data traffic on the internet at a given time does not correspond with
simultaneous increases in ICT’s emissions. Instead, network operators plan capacity
for peak data traffic [Sandvine 2014], meaning emissions from ICT are fixed regardless
of the amount of data traffic until growth in peak capacity is required. In M&L’s view,
data traffic is not directly proportional to emissions due to efficiency gains and use of
renewable energy in data centres and networks that allow them to process
increasingly more data with similar emissions. M&L (reiterated in [Ericsson 2020])
believe the energy consumption of ICT is rather linked to the number of users and time
19spent using ICT because of the energy consumption of user devices and access
equipment like modems and routers, and that data traffic growth is slowing down to a
more linear than exponential growth (see Appendix B.2.5 for more details).
No, data traffic drives ICT growth and the associated emissions
A&E and B&E both agree that data traffic is a driver in ICT growth and emissions.
Growth in the internet’s infrastructure capacity allows for new data-intensive services
and applications; these offer more affordances to users, driving demand for the
services and therefore further infrastructure growth [Preist et al. 2016]. Peak data
traffic is one driver for this infrastructure growth due to increased demand for data-
intensive services; other influences include ensuring technology is always accessible
to all users [Preist, personal communication].
Video streaming is a particularly prominent driver in data traffic (see Appendix C).
Netflix have just agreed with EU regulators to reduce their traffic and ease the load on
the network, allowing network provision for homeworkers during the Covid-19
pandemic [Sweney 2020]. Belkhir [personal communication] pointed out that this
agreement between Netflix and EU regulators makes it difficult to argue that data traffic
is independent of ICT infrastructure growth and therefore that data traffic has little
effect on emissions.
2.2.5 Is ICT enabling carbon savings in other industries?
Yes, ICT is enabling carbon savings in other industries
In their report SMARTer 2030, the Global eSustainability Initiative [GeSI 2015], which
represents ICT companies, claim that ICT could save 9.1 GtCO2e in 2020 and 12.08
GtCO2e in 2030 in other industries such as health, education, buildings, agriculture,
transport and manufacturing – mostly due to better efficiency. This would allow a 20%
reduction of global CO2e emissions by 2030, holding emissions at 2015 levels and
decoupling economic growth from emissions growth. Relative to their estimate of ICTs
own emissions of 1.27 GtCO2e in 2020 and 1.25 GtCO2e in 2030, GeSI [2015] argue
that ICT is net carbon negative and that governments and businesses should invest
more into ICT. According to them, already in 2015, ICT saved 1.5 times its own
emissions. There is also a strong argument that ICT will accelerate the use of
renewable energy in the grid and hence lead to decarbonisation of the energy supply.
No, ICT drives carbon emissions in other industries due to rebound effects
The GeSI [2015] report is sponsored by several large ICT companies and there is a
lack of transparency in their analysis, raising concerns over possible conflict of
interest. So far, there is little evidence that these predictions have come true. History
has shown us that growth in the global economy and its carbon footprint has
continuously risen, even with ICT creating efficiencies in other industries. It is risky to
assume that further ICT-enabled efficiencies will suddenly start to create significant
carbon savings in the wider economy without governance and intervention. Rather, it
is more likely that ICT enables emission increases in other sectors because it enables
efficiencies, leading to growth in the very areas into which ICT delivers those efficiency
gains – including growth in industries that are already carbon-intensive [Preist,
personal communication]. By efficiencies here, it is important to note that we go
beyond just energy-specific efficiencies as described by Jevons Paradox; rather, we
take into account ICT’s emission impacts and rebound effects more widely [cf.
20Börjesson Rivera et al. 2014] and refer to any potential route for rebound ICT brings
to our society.10
While GeSI [2015] mention rebound effects, this is only in the appendix and given very
limited treatment. Their estimate of an increase of global emissions by 1.37 GtCO2e
due to rebound effects is not included in overall calculations for emission savings by
ICT and is almost certainly a serious underestimation. This is highlighted by their
example of video conferencing. GeSI [2015, p. 69] estimating that “E-Work
technologies like videoconferencing could save around 3 billion liters of fuel.” by
cutting workers’ commutes. It is difficult to quantify the exact balance of ICT-enabled
savings and increased emissions, but one clue is that while video traffic has been
expanding rapidly to the extent that it is one of the main contributors of internet traffic
[Cisco 2020], emissions from flights were simultaneously increasing (save for
pandemics) [Graver et al. 2019]. Therefore, ICT only enables efficiencies in other
industries if it completely substitutes more traditional carbon-intensive activities rather
than being offered in addition to them.
2.2.6 Will renewable energy decarbonise ICT?
Yes, renewable energy will decarbonise ICT
Whilst the exact share of renewable energy used for the ICT sector is not known, some
ICT operators generate renewable energy on-site and the ICT sector overall is a major
purchaser of renewable energy – leading the way for a global shift to this energy
source. In a recent Ericsson blogpost building on Malmodin’s work, Lövehagen [2020]
claims that ICT’s carbon footprint could be reduced up to 80% if all electricity came
from renewable energy. Renewable energy has a much lower carbon footprint than
fossil fuel energy at ca. 0.1 kgCO2e/kWh. Compared to 0.63 kgCO2e/kWh for the
global electricity mix,11 a switch to 100% renewable energy would reduce emissions
by ca. 86%.
No, renewable energy is not a silver bullet
With unlimited growth in energy demand, even the relatively small carbon footprint
from renewable energy compared to fossil fuel would add up significantly. Additionally,
there might be limits to the amount of renewable energy that can be generated with
present technology, such as the availability of silver which is used in photovoltaic
panels.12 While investments into renewable energy currently have the effect to reduce
the price of renewable energy for other sectors, as soon as there are limits to the
amount of renewable energy that can be generated, any additional energy used by
ICT will take energy away from other purposes.
There are also practical constraints on the extent that renewable energy can be used
to power ICT equipment. Even data centres that are powered by 100% renewable
10
For example, consider how ICT has made it far easier to book flights online, contributing to the growth
of the aviation industry.
11
Both figures are based on SWC’s EEIO model which draws on official data from the UK government’s
Department for Business, Energy and Industrial Strategy.
12
An average solar panel requires ca. 20g of silver [Apergis and Apergis 2019]. There are currently
2.6bn solar panels in the world generating a total of 865 TWh [IEA 2019a]. From 2019 to 2020, 135
TWh of solar energy was added. The manufacture of these requires 52,000 tons of silver. Worldwide,
27,540 tons of silver are being mined in 2020, and the amount increases by ca. 2% every year [IEA
2019a]. On this trajectory, solar panels would use 100% of global silver supplies in 2031 leaving none
for electric car batteries and other uses.
21You can also read


