Statistics Canada Quality Guidelines - Fifth Edition - October 2009
←
→
Page content transcription
If your browser does not render page correctly, please read the page content below
Catalogue no. 12-539-X

Statistics Canada
Quality Guidelines

Fifth Edition – October 2009
How to obtain more information
For information about this product or the wide range of services and data available from Statistics Canada, visit our website
at www.statcan.gc.ca, e-mail us at infostats@statcan.gc.ca, or telephone us, Monday to Friday from 8:30 a.m. to 4:30 p.m.,
at the following numbers.

Statistics Canada’s National Contact Centre
Toll-free telephone (Canada and United States):
  Inquiries line                                                            1-800-263-1136
  National telecommunications device for the hearing impaired               1-800-363-7629
  Fax line                                                                  1-877-287-4369

Local or international calls:
  Inquiries line                                                            1-613-951-8116
  Fax line                                                                  1-613-951-0581

Depository Services Program
  Inquiries line                                                            1-800-635-7943
  Fax line                                                                  1-800-565-7757

Information to access the product

This product, catalogue no. 12-539-X, is available free in electronic format. To obtain a single issue, visit our website at
www.statcan.gc.ca and select “Publications.”

Standards of service to the public

Statistics Canada is committed to serving its clients in a prompt, reliable and courteous manner. To this end, Statistics Canada
has developed standards of service that its employees observe. To obtain a copy of these service standards, please contact
Statistics Canada toll-free at 1-800-263-1136. The service standards are also published on www.statcan.gc.ca under “About us”
> “Providing services to Canadians.”
Statistics Canada

Statistics Canada
Quality Guidelines

Fifth Edition – October 2009

                    Published by authority of the Minister responsible for Statistics Canada

                    © Minister of Industry, 2009

                    All rights reserved. The content of this electronic publication may be reproduced, in whole or in
                    part, and by any means, without further permission from Statistics Canada, subject to the following
                    conditions: that it be done solely for the purposes of private study, research, criticism, review or
                    newspaper summary, and/or for non-commercial purposes; and that Statistics Canada be fully
                    acknowledged as follows: Source (or “Adapted from”, if appropriate): Statistics Canada, year of
                    publication, name of product, catalogue number, volume and issue numbers, reference period and
                    page(s). Otherwise, no part of this publication may be reproduced, stored in a retrieval system or
                    transmitted in any form, by any means—electronic, mechanical or photocopy—or for any purposes
                    without prior written permission of Licensing Services, Client Services Division, Statistics Canada,
                    Ottawa, Ontario, Canada K1A 0T6.

                    December 2009

                    Catalogue no. 12-539-X
                    ISSN 1708-6256

                    Frequency: Occasional

                    Ottawa

                    Cette publication est disponible en français.

                    Note of appreciation

                    Canada owes the success of its statistical system to a long-standing partnership between
                    Statistics Canada, the citizens of Canada, its businesses, governments and other
                    institutions. Accurate and timely statistical information could not be produced without their
                    continued cooperation and goodwill.
Preface
Canadians and their government have established Statistics Canada to have access to a trusted source
of information. Trust can only be established if the data Statistics Canada produces are consistent with the
country’s needs and representative of the world we are seeking to describe. In other words, information has
to be relevant and of high quality.
Quality is, therefore, fundamental to Statistics Canada’s mandate to produce information. There is an essential
characteristic of quality that needs to be understood: quality, defined as representativeness of the universe
we are trying to capture, will deteriorate automatically in the absence of pro-active action. This is because, as
the world around us evolves, our methods to maintain representativeness of our data must evolve as well.
In view of these realities, Statistics Canada has a long tradition of providing guidance in its survey designs
by consolidating its experiences and conclusions about what constitute “best practices” into a set of Quality
Guidelines. The first edition of Quality Guidelines appeared in 1985. Revised editions were released in 1987,
1998 and 2003. In keeping with the need to keep the guidelines evergreen, the present document has been
significantly updated from the previous edition to reflect further advances in survey methodology over the
past six years.
The guidelines presented in this document do not all apply equally to every data acquisition process. Their
applicability and importance must be carefully considered in light of the particular requirements and constraints
of individual programs. This document must, therefore, be used with professional care and judgment.
While the guidelines provided in this document are no substitute for expertise and judgment on the part of
survey design staff, the underlying concern for quality must pervade all our activities. All staff involved in
statistical activities are responsible for ensuring that quality has high priority in the design and implementation
of statistical methods and procedures under their control.
I want to thank many Statistics Canada experts who have contributed to the preparation of the Quality
Guidelines over many years. The guidance of the Methods and Standards Committee helped to make this
a better document.
Munir A. Sheikh
Chief Statistician
Quality Guidelines Statistics Canada – Catalogue no. 12-539Table of contents
Page
Introduction . ...................................................................................................................................... 6
Figure 1 Levels 1 and 2 of the Generic Statistical Business Process Model............................ 9
Survey steps . ...................................................................................................................................... 13
1. Objectives, uses and users ......................................................................................................... 14
2. Concepts, variables and classifications .................................................................................... 16
3. Coverage and frames . ................................................................................................................. 19
4. Sample design .............................................................................................................................. 23
5. Questionnaire design .................................................................................................................. 28
6. Data capture, collection and coding . ......................................................................................... 32
7. Use of administrative data .......................................................................................................... 40
8. Response and non-response ...................................................................................................... 46
9. Editing ........................................................................................................................................... 51
10. Imputation ..................................................................................................................................... 54
11. Weighting and estimation . .......................................................................................................... 59
12. Seasonal adjustment and trend-cycle estimation . ................................................................... 63
13. Benchmarking and related techniques ...................................................................................... 68
14. Data quality evaluation ................................................................................................................ 71
15. Disclosure control ........................................................................................................................ 75
16. Data dissemination and communication ................................................................................... 79
17. Data analysis and presentation .................................................................................................. 82
18. Documentation ............................................................................................................................. 87
Statistics Canada – Catalogue no. 12-539 Quality Guidelines Introduction
Statistical information is critical to the functioning of a modern democracy. Without good data, the quality of
decision-making, the allocation of billions of dollars of resources, and the ability of governments, businesses,
institutions and the general public to understand the social and economic reality of the country would be
severely impaired. A national statistical agency, such as Statistics Canada, plays an essential role in the
production and dissemination of statistical information.
The credibility of a statistical agency in fulfilling this key role rests on the following pillars: production of high
quality statistical information; cost efficiency; privacy; confidentiality; and the maintenance of a highly capable
and motivated workforce.
More specifically, the quality of the information it produces, its relevance in particular, is of fundamental
importance to a statistical agency. Unless the statistical agency is capable of producing high quality data,
both the users and the suppliers of statistical data would soon lose confidence in the statistical agency,
making its job impossible. As an introduction to the guidelines, this section presents the principles of quality
assurance at Statistics Canada within which they are applied.
Principles of quality assurance at Statistics Canada
The Agency’s management structure, policies and guidelines, consultative mechanisms, project development
and management approach, and environment have been developed to facilitate and assure effective
management of quality. The basic mechanisms for managing quality are described in Statistics Canada’s
Quality Assurance Framework (Statistics Canada, 2002c).
The framework consists of a wide variety of mechanisms and processes acting at various levels throughout
the Agency’s programs and across its organization. The effectiveness of this framework depends not on
any one mechanism or process but on the collective effect of many interdependent measures. These build
on the professional interests and motivation of the staff. They reinforce each other as means to serve client
needs. They emphasize the Agency’s objective professionalism, and reflect a concern for data quality. An
important feature of this strategy is the synergy resulting from the many players in the Agency’s programs
operating within a framework of coherent processes and consistent messages. Within the framework, the
Quality Guidelines provide an accompanying document that describes a set of best practices for all of the
“steps” of a statistical program, and is aimed at project team members who are charged with the development
and implementation of statistical programs.
Underlying all of these mechanisms, processes and practices are eight guiding principles.
Quality is relative, not absolute
A significant feature of the management of quality is the balancing of quality objectives against the constraints
of financial and human resources, the goodwill of respondents in providing source data, and competing
demands for greater quantities and detail of information. The management of quality is not the maximization
of quality at all costs, but the achievement of an appropriate balance between the quantity and quality of
information yielded by the Agency’s programs and the resources available. Within individual programs the
challenge is to make the appropriate trade-offs between the evolving needs of clients, costs, respondent
burden, and the various elements or dimensions of quality.
Statistical data are important because of the use to which they are put. It follows that the quality of statistical
data can only be judged against their relevance and how well they represent the world we seek to describe.
It also follows that it is important for the statistical agency to have a thorough understanding of the uses to
which its data are put, and to do so it must maintain ongoing relations with its user community.
Quality Guidelines Statistics Canada – Catalogue no. 12-539This principle also recognizes that achieving “perfect” quality is neither desirable nor affordable (in fact it is
rarely even possible). Data are subject to numerous sources of error, both sampling and non-sampling, and
it is the job of the statistical agency to balance factors such as accuracy, cost and burden on respondents
in developing a statistical program. Minimizing error itself is not the goal; each statistical program must be
designed within the context of what is feasible and how important the data are to users.
Statistics Canada strives to build relevance and quality into all its programs and products. The quality of its
official statistics is founded on the use of sound scientific methods adapted over time to changing client needs,
to the changing reality that the Agency aims to measure, and to the capacity or willingness of respondents
to supply reliable and timely data. The Quality Guidelines are one of the tools that will aid in building quality
into the design of each program.
Quality is multidimensional
During the past twenty years, statistical agencies have arrived at a consensus that the concept of “quality”
of statistical information is multi-dimensional. Statistics Canada defines quality in terms of six dimensions;
other statistical agencies and organizations have defined similar frameworks. While these definitions may
differ slightly, they all recognize that there is no one single measure of data quality.
At Statistics Canada, the dimensions of quality are defined as follows:
The relevance of statistical information reflects the degree to which it meets the real needs of clients. It
is concerned with whether the available information sheds light on the issues of most importance to users.
Hence, relevance is the most important dimension of quality; one could even consider it among the pillars of
a statistical agency. It is largely in the domain of users of the information; it is not something that a statistical
agency can establish by itself. Comparatively, the other dimensions of quality are much more within the
control of the statistical agency.
The accuracy of statistical information is the degree to which the information correctly describes the
phenomena it was designed to measure. It is usually characterized in terms of error in statistical estimates
and is traditionally decomposed into bias (systematic error) and variance (random error) components. It may
also be described in terms of the major sources of error that potentially cause inaccuracy (e.g., coverage,
sampling, non-response, response).
The timeliness of statistical information refers to the delay between the reference point (or the end of
the reference period) to which the information pertains, and the date on which the information becomes
available. It is typically involved in a trade-off against accuracy. The timeliness of information will influence
its relevance.
The accessibility of statistical information refers to the ease with which it can be obtained from the Agency.
This includes the ease with which the existence of information can be ascertained, as well as the suitability
of the form or medium through which the information can be accessed. The cost of the information may also
be an aspect of accessibility for some users.
The interpretability of statistical information reflects the availability of the supplementary information and
metadata necessary to interpret and utilize it appropriately. This information normally covers the underlying
concepts, variables and classifications used, the methodology of data collection and processing, and
indications of the accuracy of the statistical information.
The coherence of statistical information reflects the degree to which it can be successfully brought together
with other statistical information within a broad analytic framework and over time. The use of standard concepts,
classifications and target populations promotes coherence, as does the use of common methodology across
surveys. Coherence does not necessarily imply full numerical consistency.
Statistics Canada – Catalogue no. 12-539 Quality Guidelines These dimensions are overlapping and interrelated; in managing quality all of them must be considered. A
failure in any one dimension will result in the failure of the entire statistical program.
Every employee has a role to play in assuring quality
Through its policies, guidelines and internal communications, Statistics Canada has made it clear to its
employees that everyone has a role to play in assuring quality, from the employees working on daily production
tasks to the highest level of management. This reflects the philosophy of Deming (1982) that quality is not
something that can be “inspected into” the process, but should be built into the process to begin with. Thus
there is no one body at Statistics Canada explicitly charged with quality assurance.
As well, the human resources practices of the agency reflect the principle that quality is everyone’s business.
The recruitment, training and development programs of the Agency put considerable emphasis on technical
competencies and an understanding of what constitutes high quality data.
Balancing of the dimensions of quality is best achieved through a project team approach
Because quality is multidimensional, it follows that different dimensions tend to be the area of expertise of
different groups in the Agency. For many years, Statistics Canada has realized that the tradeoffs among the
various dimensions of quality are best achieved through a project team approach.
The management of quality at Statistics Canada occurs within a matrix management framework – project
management operating within the functional organization. The Agency is functionally organized into six
Fields. Three of these are primarily responsible for statistical programs of data production and analysis in
various subject-matter areas (e.g. social statistics, business statistics and national accounts). The other
three Fields are primarily involved in the provision of infrastructure and services to be used by the statistical
programs (e.g. methodology, informatics, collection operations, dissemination and management systems).
A typical statistical program is managed by one of the subject-matter divisions and draws heavily on the
resources of infrastructure and service areas for inputs to the program.
The use of an interdisciplinary project team approach for the design or redesign of a statistical program is
important in ensuring that quality considerations relating to all the components and steps in the program
receive appropriate attention during design, implementation and assessment. It is the responsibility of the
functional organizations to ensure that project teams are adequately staffed with people able to speak with
expertise and authority for their functional area. Subject-matter staff bring knowledge of content, client
needs, and relevance. Methodologists bring their expertise in statistical methods and data quality trade-offs,
especially with respect to accuracy, timeliness and cost. Operations experts bring experience in operational
methods, and concerns for practicality, efficiency, field staff and respondents. The system experts bring a
systems view, and knowledge of technology standards and tools.
It is within such a project team that the many decisions and trade-offs necessary to ensure an appropriate
balance between concern for quality and considerations of cost and response burden are made. Together
the team has to balance the conflicting pressures in order to develop an optimal design. The fact that each
member of the team is a part of a specialized functional organization, from which a variety of more specialized
and management resources can be called upon when warranted, helps in resolving both technical challenges
and conflicts arising in a project.
Projects are normally guided by a more senior Steering Committee that may include managers from each of
the major participating areas. This Committee, which is part of the formal approval mechanism for the design
and implementation of the program, provides overall guidance, broad budgetary and design parameters, and
helps to ensure that appropriate resources are available to the project. It also provides a forum for resolving
any issues that cannot be satisfactorily resolved within the project team.
Quality Guidelines Statistics Canada – Catalogue no. 12-539Quality must be built in at each phase of the process
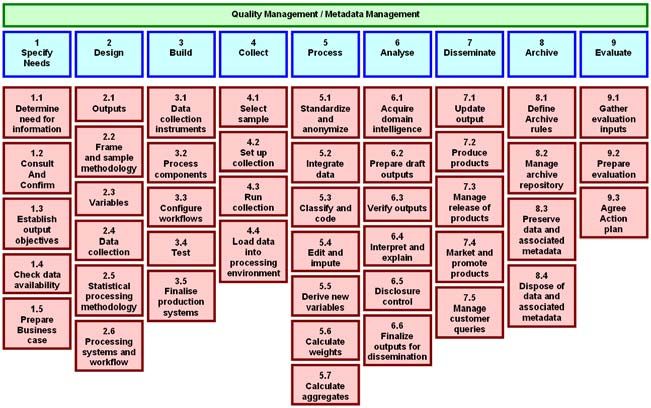
Statistical agencies have often modeled the statistical process, as an aid in managing it. The second edition
(April 1987) of Statistics’ Canada’s Quality Guidelines contained a schematic of the statistical survey process.
More recently, agencies such as Statistics New Zealand, the Australian Bureau of Statistics, Statistics
Sweden, Statistics Norway, Statistics Netherlands, and the Joint UNECE / Eurostat / OECD Work Sessions
on Statistical Metadata (METIS) have developed various drafts of a Generic Statistical Business Process
Model (GSBPM). The model developed by METIS (UNECE Secretariat 2008), which is based on that of
Statistics New Zealand but with input from several other agencies, including Statistics Canada, is shown in
Figure 1.
These various models have in common the division of the process into a number of phases or steps. While the
details of the various models vary, all contain common elements: the specification of user needs, the design
of the program, the implementation or “build” phase (specifications, systems, operations manuals, training,
etc.), the execution phase (collection, verification, etc.,) and the evaluation phase. A basic principle of quality
assurance is that it must be considered at all of these phases. If the user needs are not understood or are
incorrectly specified, then all the steps that follow will only result in data that are not relevant. Measures must
also be taken to ensure that the design is done properly; if it is not then no amount of perfect implementation
and execution will compensate. However good design is not enough; if it is not implemented or executed
correctly then the good design has gone to waste. And without proper evaluation the statistical agency will
not know whether the statistical program has met its objectives or not.
Figure 1 Levels 1 and 2 of the Generic Statistical Business Process Model
Statistics Canada – Catalogue no. 12-539 Quality Guidelines The principle that quality must be built into each phase, together with the notion that quality is multidimensional,
leads logically to the conceptualization of quality assurance management as a matrix defined by the
dimensions of quality (relevance, accuracy, etc.,) in one dimension and the phases of a survey (specification
of needs, design, implementation, execution, evaluation) in the other dimension. A comprehensive approach
to the management of quality demands that all the cells of this matrix be considered.
Quality assurance measures must be adapted to the specific program
At Statistics Canada, statistical program managers are responsible and accountable for delivering their
programs. Each statistical activity manager has the responsibility to ensure that the Agency’s concern for
quality is adequately reflected in the statistical program’s methods and procedures. It has always been
clear that the Quality Guidelines are exactly that: guidelines to assist program managers, and not rules
to be followed. It is clearly not the expectation that every program will adhere to every guideline; such a
proposition would be prohibitively expensive and unnecessary, given the variation in the importance of the
various statistical programs. Instead, statistical program mangers and the project teams that support them
are expected to make the necessary decisions.
Users must be informed of data quality so that they can judge whether the statistical information
is appropriate for their particular use
Finally, in order for the user to make informed use of the statistical information provided, he or she must be
able to assess whether the data are of sufficient quality. For some dimensions of quality, such as timeliness,
users are able to assess the quality for themselves. Other aspects, such as interpretability, coherence and
even relevance may not be as obvious. The dimension of accuracy in particular is one which users may often
have no way of assessing and must rely on the statistical agency for guidance.
Over the years the Agency has developed policies and tools to assist users. It has long had a Policy on
Informing Users of Data Quality and Methodology (PIUDQM), which prescribes minimum amounts of
information on data quality and methodology that are to be provided to users. All data are released through
The Daily and are accompanied by a link to the Integrated Meta Database (IMDB) that provides information
on concepts, definitions, data sources and methodology for each statistical program.
Concerning accuracy, the Policy also specifies that all data releases are to be accompanied by information
on three common sources of error: coverage (the difference between the target population and the frame
used to conduct the survey), non-response (the portion of the sample who did not respond), and sampling
error (a source of error when a sample rather than a census was conducted), as well as any other significant
sources of error (e.g., response errors, processing errors, errors introduced for disclosure control).
Quality must be at the forefront of all activities
Finally, unless proactive actions are taken, the quality of data should, and does, deteriorate over time. For
example, a “relevance gap” often occurs given the time it takes between the emergence of a need for data
and the ability to produce it. A gap on other quality dimensions can also manifest itself as response rates
decline over time due to changes in societal attitudes, or as systems become outdated or methodology
becomes in need of redesign.
A statistical agency must keep quality at the forefront of all its activities in order to minimize the relevance
gap and prevent a significant decrease in quality over time.
10 Quality Guidelines Statistics Canada – Catalogue no. 12-539The quality of program processes and outputs must be assessed, checked or reviewed constantly. Such
review mechanisms must be integrated into the agency’s planning and decision making processes. Statistics
Canada’s National Statistics Council and senior bilateral arrangements with key departments and agencies
(effective dialogue with stakeholders), Integrated Program Reporting (systematic assessment of statistical
outputs) and Quality Review Program (formal assessment of statistical processes) are examples of such
quality assessment or review mechanisms.
Purpose and scope of the guidelines
Section 2 of this document brings together guidelines and checklists on many issues that need to be
considered in the pursuit of quality objectives in the execution of statistical activities. Its focus is on how to
assure quality through effective and appropriate design and implementation of a statistical program from
inception through to data evaluation, documentation and dissemination. These guidelines draw on the
collective knowledge and experience of many Statistics Canada employees. It is expected that guidelines
will be useful to staff engaged in the planning and design of surveys and other statistical programs, as well
as to those who evaluate, analyze and use the outputs of these programs.
The main purpose of the Quality Guidelines is to provide a comprehensive list of guiding principles and good
practices in survey design. To better appreciate the scope of the guidelines, it is important to define its use
of the words survey and design.
The term survey is used generically to cover any activity that collects or acquires statistical data. Included
are:
• a census, which attempts to collect data from all members of a population;
• a sample survey, in which data are collected from a (usually random) sample of population
members;
• collection of data from administrative records, in which data are derived from records originally kept
for non-statistical purposes;
• a derived statistical activity, in which data are estimated, modeled, or otherwise derived from existing
statistical data sources.
The guidelines are written with censuses and sample surveys as the main focus. The quality of derived
statistical activities is, of course, largely determined by the quality of the component parts, and as such,
derived statistical activities are not the direct focus of this document.
The term design is used to cover the delineation of all aspects of a survey from the establishment of a need
for data to the production of final outputs (the microdata file, statistical series, and analysis).
The core of this document (Section 2) concentrates on quality issues as they relate to the design of
individual surveys. It is, however, important to keep in mind that the context in which each individual survey
is developed imposes constraints on its design. Each new survey, while aiming to satisfy some immediate
information needs, is also contributing information to a base of statistical data that may be used for a range
of purposes that go well beyond those identified at the time of the survey’s design. It is therefore important
to ensure that the output from each individual survey can, to the extent possible, be integrated with, and
used in conjunction with, data on related topics derived from other surveys. This implies a need to consider
and respect the statistical standards on content or subject-matter that have been put in place to achieve
coherence and harmony of data within the national statistical system. These include statistical frameworks
(such as the System of National Accounts), statistical classification systems (such as those for industry or
geography), as well as other concepts and definitions that specify the statistical variables to be measured.
The usefulness of new statistical data is enhanced to the extent that they can be utilized in conjunction with
existing data.
Statistics Canada – Catalogue no. 12-539 Quality Guidelines 11References
Brackstone, G. 1999. “Managing data quality in a statistical agency.” Survey Methodology. Vol. 25. p. 139-
149.
Deming, W.E. 1982 Quality, Productivity, and Competitive Position, Cambridge, MA: Massachusetts Institute
of Technology.
Fellegi, I. 1996. “Characteristics of an effective statistical system.” International Statistical Review. Vol. 64.
p. 165-197.
Statistics Canada. 1987 Quality Guidelines. Second Edition. Ottawa, Ontario.
Statistics Canada. 2000c. “Integrated Metadatabase – Guidelines for Authors.” Standards Division Internal
Communications Network. No date. http://stdsweb/standards/imdb/imdb-menu.htm.
Statistics Canada. 2000d. “Policy on Informing Users of Data Quality and Methodology.” Statistics Canada
Policy Manual. Section 2.3. Last updated March 4, 2009. http://icn-rci.statcan.ca/10/10c/10c_010_e.htm.
Statistics Canada. 2002c. Statistics Canada’s Quality Assurance Framework - 2002. Statistics Canada Catalogue
no. 12-586-XIE. http://method/Branch/Committees/MethodsAndStandards/QualityAssuranceFramework_
e.htm.
Statistics Canada. 2003d. Statistics Canada Policy Manual. Last updated May 27, 2009.
http://icn-rci.statcan.ca/10/10c/10c_000_e.htm.
Trewin, D. 2002. “The importance of a quality culture.” Survey Methodology. Vol. 28. p. 125-133.
UNECE Secretariat. 2008. “Generic Statistical Business Process Model: Version 3.1 – December 2008”.
Joint UNECE/Eurostat/OECD Work Session on Statistical Metadata (METIS).
12 Quality Guidelines Statistics Canada – Catalogue no. 12-539Survey steps
This section is organized in subsections that correspond to the main activities of a typical survey. The
subsections all follow the same structure, describing the Scope and purpose, Principles, Guidelines and
Quality indicators related to each activity, as defined below. The first subsection addresses the stage at which
objectives, uses and users are identified. The subsections that follow cover other survey steps roughly in the
chronological order in which they would typically take place. However, there are significant interdependencies
between some steps such as, for example, between questionnaire design and data collection and capture
operations. As well, survey steps as discussed here do not always proceed strictly sequentially. Some
activities can take place concurrently, for example, frame development, sampling plans and questionnaire
design. Other steps, such as data quality evaluation and documentation touch on most other activities and
do not take place as discrete activities on their own.
Scope and purpose
Under the heading of Scope and purpose, a description of the concepts and key terms of the main activity
or survey step are provided. The objective of the step and why it is important are stated briefly.
Principles
Principles are the broad, underlying policies, directions and approaches which govern the design of the
activity in question, with emphasis on those that relate to quality.
Guidelines
Guidelines are known good practices that have evolved in the design and implementation of statistical surveys.
Not all of these guidelines can be applied to every survey. They provide checklists to aid survey design.
Judgment is still needed in deciding how to weigh the considerations that these Guidelines suggest.
On the other hand, Statistics Canada does have policies that have a bearing on many aspects of statistical
activities in the Agency, and which may place requirements on the way particular activities are carried out.
These are documented separately in the Statistics Canada Policy Manual. Wherever a policy has a bearing
on a particular topic covered by these Guidelines, the existence and relevance of the policy is indicated.
Quality indicators
Quality measures give a direct measure of the quality of data but, in practice, they can rarely be explicitly
calculated. For example, in the case of accuracy, it is almost impossible to measure non-response bias, as
the characteristics of those who do not respond can be difficult to ascertain. Instead, certain information can
be provided to help “indicate” quality. Quality indicators usually consist of information that is a by-product
of the statistical process. They do not measure quality directly but can provide enough information to offer
valuable insight into quality. Included in this section are both quality measures, when they exist, and quality
indicators.
Information presented in this section will be useful to methodologists tasked with producing quality measures
to accompany the statistical outputs. It will also be of interest to director of program areas, survey managers
and data users, who will use the indicators to assess and compare the quality of statistical products. In
addition, this section will be of interest to the directors of program areas and production managers, as it
will provide a basis for monitoring performance in terms of the quality of the processes and products in the
program area.
Statistics Canada – Catalogue no. 12-539 Quality Guidelines 131 Objectives, uses and users
1.1 Scope and purpose
Objectives are the purposes for which information is required, stated within the context of the program,
research problem or hypotheses that gave rise to the need for information. Uses narrow down and specify
more precisely the information needs, for example, by describing what decisions may be made based on the
information collected and how such information will support these decisions. Users are the organizations,
agencies, groups or individuals expected to use the project deliverables.
The first task in planning a statistical activity is to specify the objectives. A clear statement of objectives
guides all subsequent steps and could be revised many times during the survey development. Meeting the
objectives might require mounting a new survey, redesigning an existing survey, using existing data products,
using administrative records, or a combination of these activities. The information needs as stated in the
objectives must justify any response burden that will be generated. The relevance of project deliverables to
the targeted user community must also be clearly stated.
1.2 Principles
The hypotheses to be tested, specific data requirements and use of the data, data quality expectations,
budget constraints and expected delivery dates should all be stated in the objectives. The concept, definition,
unit of analysis and the target population, which are discussed in the subsequent sections, should also be
defined at this stage. This will allow the intended as well as other potential data users to determine if and to
what extent the project deliverables meet their needs.
1.3 Guidelines
1.3.1 Planning
• Develop survey objectives and constraints in partnership with important users and stakeholders.
Establish and maintain relationships with users of information in the private and public sectors and
with the general public to enhance the relevance of the information produced and to improve the
marketing of products and services. Among important users are representatives of potential markets,
policy makers and agents who require the information for legislated use. Before major designs or
redesigns, consider conducting a feasibility study and/or pilot test. Conduct extensive and user-focused
consultation routinely so as to identify content options, survey relevancy, to determine the need for a
cross-sectional or a longitudinal survey as well as to develop public support for the program when it
reaches the data collection stage.
• Focus analysis of user needs and data requirements on finding the most cost-effective solutions for
both the short and long term in the context of statistical framework. Having the users specify their
analytical plan or proposed release tables in advance will help to more clearly define their detailed
requirements. Before embarking on the design of a new statistical activity (or redesigning an existing
one, longitudinal or cross-sectional survey), analyze currently available statistics in the area in terms
of sources, frequency, quality, timeliness, etc. Determine the best trade-off between adequacy of the
available statistics to meet the requirements of clients and the cost and time required to undertake a
new activity to produce statistics that do not already exist.
• Where explicit data quality targets exist, include them in the statement of survey objectives in terms
of measurable aspects of quality for the entire population or specific domains. Targets can be set
in terms of measures such as sampling error, coverage rates, response rates, and timeliness. With
administrative data and derived statistical activities, the data quality will be directly related to the quality
of input data sources.
14 Quality Guidelines Statistics Canada – Catalogue no. 12-539• During the planning process, clarify the operational constraints such as time frame, costs, resources
and data collection methods. Other issues such as the use of proxy responses, respondent recall and
the need to measure seasonal data variation should also be taken into account. This is conducted in
phases of increasing detail and exactitude. To start with, estimates are based on broad assumptions
of the methodology to be used. These estimates have to be more exact and detailed at each stage of
planning. They should be based on historic information when available and updated as the objectives
are reviewed.
• In determining the extent to which a survey will meet user needs, seek a reasonable trade-off between
these needs, the survey objectives and the budget, response burden and privacy considerations.
Although the Agency may have little discretion where a legal requirement is in place, in other cases it
is worthwhile to formulate alternative methodological approaches, means and modes of data collection,
frequencies, geographical detail, etc. with a view to arriving at an optimum solution. It might also be
necessary to conduct a pilot survey or feasibility study to find an optimum solution.
• Review ongoing statistical activities at regular intervals. Statistical programs need to evolve, adapt and
innovate so as to keep pace with the changing demands of the users they serve or demands of new
users. The purpose of the activity or its statement of objectives needs to be reviewed periodically to
enhance the relevance of the statistical product to user needs and constraints (budget, time frame,
resources, etc.), as they evolve or change. Sometimes the redesign overhaul of existing surveys may
be desirable to maintain the reliability of key statistical series, especially if sources of information have
changed or the way in which they are made available is reengineered or rethought.
1.4 Quality indicators
Main quality element: relevance
Describe and classify key users of project deliverables.
Describe the needs of key users and their anticipated uses of data products, in terms of analytical plans and
release tables. Address any gaps between needs and deliverables.
If changes are made to a survey program where estimates are fitted into a time series, evaluate the impact
on the time series of those changes.
References
Blanc, M., Radermacher, W. and Körner, T. 2001. “Quality and users.” International Conference on Quality
in Official Statistics 2001. Session 15.1. Stockholm, Sweden.
Brackstone, G.J. 1993. “Data relevance: keeping pace with user needs.” Journal of Official Statistics. Vol. 9,
no. 1, p. 49-56.
Statistics Canada. 2003. Survey methods and practices. Statistics Canada Catalogue no. 12-587 XPE.
Ottawa, Ontario. 396 p.
Statistics Canada – Catalogue no. 12-539 Quality Guidelines 152 Concepts, variables and classifications
2.1 Scope and purpose
Concepts are general or abstract ideas that express the social and/or economic phenomenon to be studied.
They are the subjects of inquiry and analysis that are of interest to users.
A variable consists of two components, a statistical unit and a property. A statistical unit is the unit of observation
or measurement for which data are collected or derived (e.g. persons or households in social surveys, and
enterprises or establishments in business surveys) (Statistics Canada, 2008). A property is a characteristic
or attribute of the statistical unit. Definitions of variables must be unambiguous and clearly specified in the
context of the analytical purposes for which the data are to be collected (Statistics Canada, 2004).
Classification is a systematic grouping of values that a variable can take comprising mutually exclusive
classes, covering the full set of values, often providing a hierarchial structure for aggregating data so as to
facilitate analysis and interpretation. More than one classification can be used to represent data for a given
variable (Statistics Canada, 2004).
2.2 Principles
Statistics Canada aims to ensure that the information it produces provides a consistent and coherent picture
of the Canadian economy, society and environment, and that its various datasets can be analyzed together
and in combination with information from other sources. To achieve this the Agency follows conceptual
frameworks, makes use of standard names and definitions for populations, statistical units, concepts, variables
and classifications in statistical programs and uses consistent collection and processing methods for the
production of statistical data across surveys. The Statistics Canada Policy on Standards governs how this
is to be done (Statistics Canada, 2004). Where applicable, three types of standards should be respected,
in descending order of compulsion; departmental standards, recommended standards and program specific
standards (Statistics Canada, 2004).
2.3 Guidelines
2.3.1 Using standards
• Specify concepts and variables clearly and relate them to their intended use. Emphasis should be
placed on the use of standard definitions of concepts, variables, classifications, statistical units and
populations established under the Statistics Canada Policy on Standards (Statistics Canada, 2004).
In choosing naming conventions, take into account the similarity or dissimilarity of existing standards
and usage. Use titles from existing standards only for what is defined in the standards.
• Use standard definitions to make it possible to compare data collected from different sources and to
integrate data across sources (Statistics Canada, 2004). Statistics Canada has standard classifications of
industries, products, instructional programs, occupations, financial accounting and geography (Statistics
Canada 2007a (NAICS), 2007b (NAPCS), 2000 (CIP), 2006a (NOC-S), 2006b (COA) and 2007c (SGC)
as well as of a large number of other domains used for social and economic statistics.
• In addition to Statistics Canada’s standard classifications, there are international standard classifications
produced by the United Nations Statistical Office, the International Labour Office, Eurostat, and other
international and regional agencies. The Standards Division has produced official concordances to
a number of international standard classifications. When there is a requirement to provide data to
international agencies, use official concordances when they are available.
• Use standard units of observation to facilitate the comparison of data. Classifications are usually designed
with particular units of observation in mind. For example, the North American Industry Classification
Systems (NAICS) is designed primarily for classifying establishments.
16 Quality Guidelines Statistics Canada – Catalogue no. 12-539• Be aware of derived statistical activities or statistical frameworks (e.g., the System of National Accounts)
whose definitions of concepts and variables may have a significant effect on specific data collection
activities (Statistics Canada, 1989).
• Sometimes, there is more than one way to measure a concept. The variables and classifications chosen
to measure a concept will also need to take into account factors such as the ease of obtaining the
information required, the respondent burden imposed, the collection method, the context in which the
question(s) must be asked, the processing of the data (especially editing, imputation and weighting
techniques), whether the information can be obtained from administrative records, and the costs
associated with collection and processing. Thus, the measurement approach adopted may be more or
less successful in providing the desired interpretation of the concept. A variable chosen at one point in
time may become obsolete later if new factors come into play and may therefore need to be modified
or changed. Therefore, it is important to ensure that the latest approved version of the variable is used.
Updated standards are made available on the Statistics Canada website.
• In the absence of an official standard, examine the concepts, variables and classifications being used
by related statistical programs and consult with the Standards Division when necessary.
2.3.2 Using classifications
• To maximize flexibility of use, code microdata and maintain files at the lowest possible level of the
appropriate classification. Aggregation at a higher level may be required for particular analytical purposes
or to satisfy confidentiality or data reliability constraints. Wherever possible, use the hierarchy of the
classification in terms of the classes or higher-level aggregations of the standard. If this is not possible
follow a common collapsing strategy for aggregation and document differences between the standard
and adopted levels of classifications/aggregations used. Use classifications that reflect both the most
detailed and the collapsed levels. Make clear to users how these fit into higher-level (e.g. less detailed)
classifications.
2.4 Quality indicators
Main quality elements: coherence, interpretability, relevance
Describe key statistical concepts, including the statistical measure, the population, variables, units, domains
and time reference. This information gives users an understanding of the relevance of the output to their
needs.
Provide accurate references when standard concepts, variables and classifications are adopted.
Describe, justify and if possible, measure (qualitatively if not quantitatively) any departures from standards.
This gives users an indicator of relevance, and aids interpretability.
References
Statistics Canada. 1989. A User Guide to the Canadian System of National Accounts. Statistics Canada
Catalogue no. 13-589. Ottawa, Ontario. 106 p.
Statistics Canada. 2000. Classification of Instructional Programs (CIP). Last updated December 21, 2007.
http://www.statcan.gc.ca/concepts/classification-eng.htm.
Statistics Canada. 2004. “Policy on Standards.” Statistics Canada Policy Manual. Section 2.10. Last updated
March 4, 2009.http://icn-rci.statcan.ca/10/10c/10c_014_e.htm.
Statistics Canada. 2006a. National Occupational Classification for Statistics (NOC-S). Statistics Canada
Catalogue no. 12-583-XIE. Ottawa, Ontario. 648 p.
Statistics Canada – Catalogue no. 12-539 Quality Guidelines 17Statistics Canada. 2006b. Chart of Accounts: Standard for Reporting on the Financial Position and Performance
of a Business. Last updated July 3, 2006. http://stdsweb/english/Subjects/Standard/coa-standdraft.htm.
Statistics Canada. 2007a. North American Industry Classification System - NAICS Canada, 2007. .Last
updated March 10, 2009.
http://www.statcan.gc.ca/subjects-sujets/standard-norme/naics-scian/2007/index-indexe-eng.htm.
Statistics Canada. 2007b. North American Product Classification System (NAPCS), 2007. Last updated
August 15, 2008.
http://www.statcan.gc.ca/subjects-sujets/standard-norme/napcs-scpan/napcs-scpan-eng.htm.
Statistics Canada. 2007c. Standard Geographical Classification, SGC 2006. 2 vols. Last updated August 1,
2008.
http://www.statcan.gc.ca/subjects-sujets/standard-norme/sgc-cgt/geography-geographie-eng.htm.
Statistics Canada. 2008. Industry Classification Coding System (ICCS) Version 1.4, (NAICS 2007). Statistics
Canada Catalogue no. 12F0074XCB. Ottawa, Ontario.
Statistics Canada. 2008. Standard Statistical Units. Last updated July 25, 2008.
http://www.statcan.ca/english/concepts/stat-unit-def.htm.
Statistics Canada. No date. Integrated Metadatabase (IMDB) - Guidelines for Authors. No date.
http://stdsweb/standards/imdb/imdb-menu.htm.
18 Quality Guidelines Statistics Canada – Catalogue no. 12-5393 Coverage and frames
3.1 Scope and purpose
The target population is the set of units about which information is wanted and estimates are required.
Practical considerations can dictate that a survey population be defined which excludes some units in the
target population or which is comprised of differently defined units through which the target population can
be accessed.
A frame is any list, material or device that delimits, identifies, and allows access to the elements of the survey
population. Frames are generally of two types: area frames and list frames. A list frame is a list of units in
the survey population. Area frames are usually made up of a hierarchy of geographical units which in turn
contain units in the survey population; that is, the frame units at one level can be subdivided to form the units
at the next level. All of the elements included in the frame constitute the frame population. Frames are often
much more than a simple list of units or a map with geographic units delineated. A frame usually includes
other information (e.g., identification, contact, classification, address, size, maps in case of geographical
units) to be used in carrying out the survey.
Coverage is the completeness of the information for the target population that would be derived if all of the
frame units were to be surveyed. Coverage errors are discrepancies in statistics for the target population versus
those for the frame population. These errors are a function of both the frame undercoverage (overcoverage)
of the target population and of coverage errors occurring during survey operations resulting in differences
in the survey estimate for those actually covered from those for which an estimate was required. Coverage
errors can have both spatial and time dimensions.
3.2 Principles
The survey population should be reasonably consistent with the target population in order for the survey
results to be relevant.
In turn, the survey frame should conform to the survey population. Frame coverage errors (such as missing
in scope units, included out-of-scope units, misclassified units and duplicates) can complicate the survey
process resulting in cost increases, loss of timeliness and also will diminish the accuracy (from bias and
variance points of view) of the estimates.
Frame data should be up-to-date and accurate because of their use in stratification, sample selection,
collection, follow-up, data processing, imputation, estimation, record linkage, quality assessment and analysis.
Erroneous frame data are likely to bias or diminish the reliability of the survey estimates and to increase
data collection costs.
Survey designs and operations should implement procedures to minimize coverage error and its impact.
3.3 Guidelines
3.3.1 Design
• Test possible frames at the planning stage of a survey for their suitability and quality. Assess the coverage
of the frame and of the target collection units.
• When no single frame can provide the required coverage of the target population, use a multiple frame
methodology. A multiple frame is a combination of two or more frames such as a list and area frame
or two or more list frames. Generally avoid using multiple frames unless no single existing frame is
adequate. When several frames exist, some of which are incomplete but less expensive to use and
others more complete but prohibitively expensive, consider the use of multiple frames.
Statistics Canada – Catalogue no. 12-539 Quality Guidelines 19• Consider also the use of Random Digit Dialling (RDD) for some telephone surveys, by itself or in
combination with other area or list frames.
• Sometimes no cost effective frame exists for the population of units of interest. In such situations
consider using multi stage or indirect sampling methods.
• At Statistics Canada, several lists are maintained for use as frames by its surveys. The Business Register
is available for surveys of businesses and institutions. For agricultural surveys, the Farm Register is the
usual frame. For household surveys, the Address Register, the Labour Force Survey frame (which is an
area frame), and the Census of Population geographic units are options to consider. In situations where
one of these recognized frames is not the best choice for addressing a survey’s target population, other
frames e.g. lists of immigrants or databases of importers or exporters; should be considered.
• Ensure that the frame is as up to date as possible relative to the reference period for the survey.
• Retain and store information about sampling, rotation and data collection so that coordination between
surveys can be achieved and respondent relations and response burden can be better managed. For
example, record how often each unit is selected by each survey that is using the frame.
• For statistical activities from administrative sources or for derived statistical activities, where coverage
changes may be outside the control of the immediate manager, determine and monitor coverage, and
negotiate required changes with the source manager.
• Make adjustments to the data or use supplementary data from other sources to offset coverage error
of the frame.
• Where possible, use the same frame for surveys with the same target population to improve coherence,
avoid inconsistencies, facilitate combining estimates from the surveys and to reduce costs of frame
maintenance and evaluation.
• To create geographic frame units at Statistics Canada, use the Generalized Area Delineation System
(GArDS), a partially generic auto-spatial delineation and verification system for creating the non-
overlapping contiguous geographic frame units.
• When multiple frames exist, they can be used to assess the completeness of one of the frames.
• Implement survey procedures to detect and correct coverage errors from the frame. Provide feedback
to update and maintain the frame.
• Implement training and procedures for data collection and data processing staff aimed at minimizing
coverage error (e.g. procedures to ensure accurate confirmation of lists of dwellings for sampled area
frame units).
• Design survey questionnaires and related materials so as to minimize coverage errors committed by
respondents (e.g erroneous listing on a questionnaire of persons in a dwelling, omission of in scope
locations in an establishment survey).
3.3.2 Maintenance
• To improve and/or maintain the level of quality of the frame, incorporate procedures to eliminate
duplication and to update for births, deaths, out-of-scope units and changes in characteristics.
• Incorporate frame updates in the timeliest manner possible.
• Minimize frame errors through effective training of staff, an emphasis on the importance of coverage,
and the implementation of quality assurance procedures for frame-related activities.
• For area frames, implement map checks to ensure clear and non-overlapping delineation of the
geographic areas used in the sampling design (e.g., through field checks or the use of other map
sources). When appropriate, use the information from the address register to verify field listing of
residential addresses for undercoverage or overcoverage.
20 Quality Guidelines Statistics Canada – Catalogue no. 12-539You can also read