SCCOOS CENCOOS NANOOS ATN MBON OTN - SIMON
←
→
Page content transcription
If your browser does not render page correctly, please read the page content below

U.S. WEST COAST
SCCOOS • CeNCOOS • NANOOS
ATN • MBON • OTN                                        NOVEMBER 7–9, 2018
                                                             HOTEL PARADOX
BIOLOGICAL OBSERVATIONS                              SANTA CRUZ, CALIFORNIA

WORKSHOP SUMMARY REPORT
Identifying Regional Needs and Priorities for Animal
Telemetry and Biodiversity Observations of Aquatic Species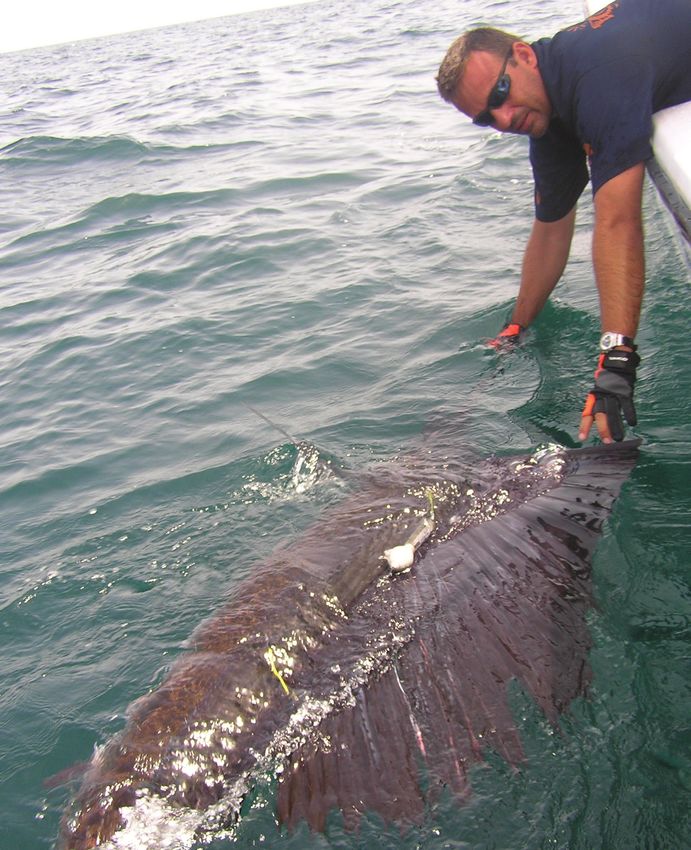
U.S. WEST COAST

     U.S. WEST COAST ATN WORKSHOP
     PLANNING COMMITTEE
     Henry Ruhl                                                        Chris Lowe
     Central and Northern California Ocean Observing System            California State University Long Beach
     Jan Newton                                                        Dan Costa
     Northwest Association of Networked Ocean Observing Systems        University of California Santa Cruz
     Clarissa Anderson                                                 Jennifer Brown
     Southern California Coastal Ocean Observing System                ECOS Consulting, Monterey Bay National Marine Sanctuary
     Alex Harper                                                       Josh London
     Central and Northern California Ocean Observing System            NOAA, AFSC, Marine Mammals Lab
     Bill Woodward                                                     Jenny Waddell
     U.S. Integrated Ocean Observing System/Animal Telemetry           NOAA, Olympic Coast, National Marine Sanctuary
     Network
                                                                       Bob Miller
     Gabrielle Canonico                                                University of California Santa Barbara
     U.S. Integrated Ocean Observing System/Marine Biodiversity
                                                                       Elliott Hazen
     Observation Network
                                                                       NOAA, SWFSC, Environmental Research Division
     Ryan Freedman
                                                                       Megan Hepner
     NOAA, Channel Islands National Marine Sanctuary
                                                                       Southern California Coastal Ocean Observing System

     Thanks to our planning committee and all who helped to make this workshop a success. Special thanks goes to our note-takers
     Callan Yanoff, Theresa Keates, Roxanne Beltran and Megan Hepner, and also to Callan Yanoff and Helen Worthington for their
     valuable assistance in preparing this report.

       Report Contents
       Workshop Outline . . . . . . . 4
       Opening Remarks . . . . . . . . 5
       Workshop Highlights . . . . . 7
       Workshop Conclusions . . 11
          Objective I . . . . . . . . . . 11
          Objective II . . . . . . . . . 14
          Objective III . . . . . . . . 20
          Objective IV . . . . . . . . 26
       Speakers . . . . . . . . . . . . . . . 30
                                                                    Cover and Inside Cover Photo: A Humpback Whale Breaching in Monte-
       Breakout Sessions . . . . . . . 46                           rey Bay National Marine Sanctuary
       Workshop Participants . . . 49                               Photo Credit: Chad King, NOAA

2 / ATN • MBON • OTN Workshop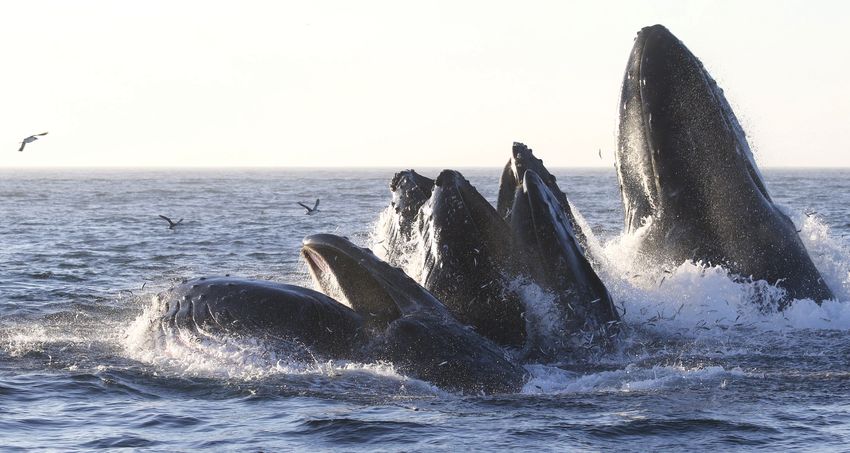
WORKSHOP REPORT

                     WORKSHOP PARTICIPANTS

A complete list of workshop participants can be found on pages 49–51.

                         WORKSHOP SPONSORS

                                                                         ATN • MBON • OTN Workshop / 3
U.S. WEST COAST

     WORKSHOP OUTLINE
     This is one in a series of U.S. regional workshops being convened to identify priority stakeholder needs for regional telemetry, bio-
     diversity, and other types of observations of aquatic species that could be served by an Animal Telemetry Network (ATN)/ Marine
     Biodiversity Observation Network (MBON)/Ocean Tracking Network (OTN) baseline network and to examine whether the type and
     extent of existing telemetry and biodiversity observing assets could adequately satisfy these requirements.
     The three U.S. IOOS West Coast Regional Associations, NANOOS (Northwest Association of Networked Ocean Observing
     Systems), CeNCOOS (Central and Northern California Ocean Observing System), and SCCOOS (Southern California Coastal
     Ocean Observing System), partnered with the U.S. ATN, the U.S. MBON, and the Canadian OTN to convene a regional stake-
     holder workshop in Santa Cruz, California on November 7–9, 2018. More than 100 participants from multiple agencies and
     organizations, including NOAA (National Oceanic and Atmospheric Administration), NASA (National Aeronautics and Space
     Administration) , the U.S. Navy, BOEM (Bureau of Ocean Energy Management), Monterey Bay Aquarium, Point Blue Conserva-
     tion Science, Consortium for Ocean Leadership, Monterey Bay Whale Watch, Ocean Science Analytics, multiple state agencies and
     universities, and more worked together over three days to address these four objectives:
     Objective I. Identify and prioritize stakeholder marine animal telemetry and biodiversity monitoring and observational needs in
     the West Coast Region.
     Objective II. Identify the existing telemetry and biodiversity observing assets and scientific capabilities in the region.
     Objective III. Document regional stakeholder specific uses of marine animal telemetry and biodiversity data.
     Objective IV. Identify infrastructure and data management challenges and opportunities that exist in the region.

     Forty-three speakers covered topics that provided perspectives from the resource management, commercial and research communities.

     BREAKOUT SESSIONS
     Two breakout sessions were created and structured along stakeholder lines (Day 1) and by relevant animal telemetry and biological
     observation application priorities (Day 2). Participants were asked to consider the following questions:
       •   What types and extent of existing assets could compose an integrated biological observations network?
       •   Who are the important organizations/institutes to engage?
       •   What is lacking or missing completely? What mechanisms can identify to fulfill these gaps?
       •   How can biological observations be improved or better served to address private sector and resource management needs?
       •   How can telemetry and biological observations be used to better address the key sector needs identified on Day 1–2?
       •   What is the value of a regional baseline network approach versus individual research efforts?
       •   What are the potential challenges to building a regional biological observations network?
       •   What actions can be taken to address those challenges?
     A summary of the breakout session discussions, as well as those in the Day 3 Plenary Session, is provided on page 46.

                                                                                                https://ioos.noaa.gov/project/atn/
                                                                                                https://ioos.noaa.gov/project/bio-data/

4 / ATN • MBON • OTN Workshop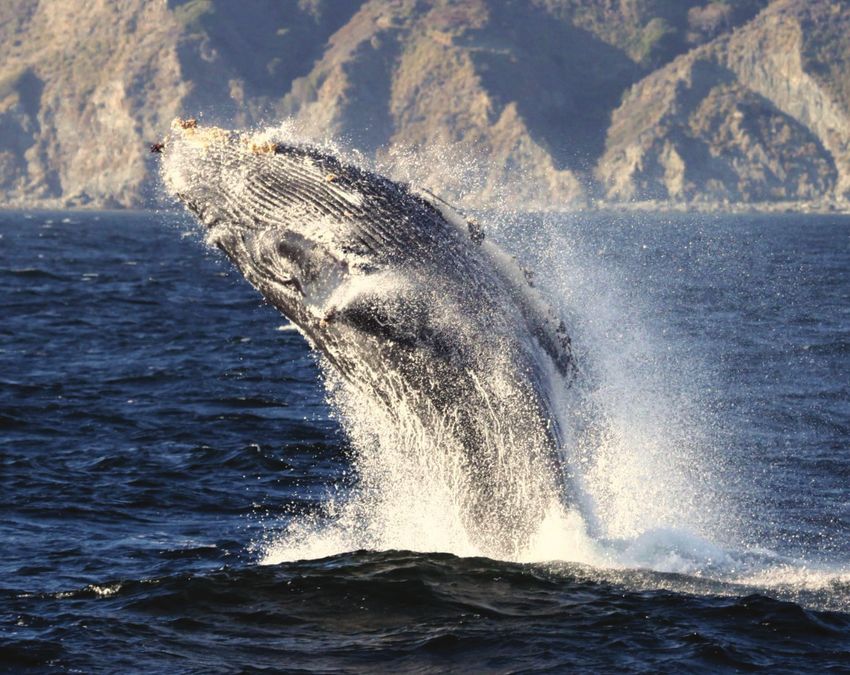
WORKSHOP REPORT

OPENING REMARKS
The ATN: Providing Unity, Stability, and Con-                     The U.S. Marine Biodiversity Observation
tinuity to the U.S. Animal Telemetry Network                      Network (U.S. MBON)
Bill Woodward, Network Coordinator, U.S. Animal Telemetry         Gabrielle Canonico, U.S. MBON Manager, U.S. IOOS Program
Network, U.S. IOOS Program Office, NOAA/NOS, Silver Spring        Office, NOAA/NOS, Silver Spring Maryland
Maryland
                                                                  MBON was borne out of the Census of Marine Life and the
A considerable amount of marine animal telemetry infra-           recognition through that process that, while huge investments
structure and expertise exists in the U.S., but it is currently   are made in ocean observing systems and biodiversity mon-
limited in its coordination and connectivity. The U.S. Animal     itoring, there is no systematic and integrated global effort to
Telemetry Network (ATN) vision is to create an alliance of        observe life in the sea that can tell us about status, trends,
collaborating partners, which enables science by assembling       and shifts over time, and further—how that impacts people.
these national capabilities into a cohesive network, complete     In the U.S., MBON is emerging as a long-term, multi-sector,
the network incrementally where needed and provide a stable,      multi-disciplinary network to observe marine life and ecosys-
unifying, long-term underlying infrastructure including a data    tem interactions.
aggregation and management capability for it.
                                                                  The network started in 2014 with three demonstration proj-
The multi-agency ATN was established in 2016 and is imple-        ects, expanding in 2019 to six projects covering the Arctic,
mented on three foundational pillars: 1) building alliances       California Current, Pacific Northwest, Gulf of Maine, and
and collaborations, 2) providing telemetry data aggregation,      South Florida. MBON priorities include making data avail-
management, display and delivery, and 3) funding high prior-      able from existing biodiversity monitoring efforts and filling
ity regional baseline animal telemetry observations. Gover-       gaps where they exist, integrating remote sensing with in situ
nance is provided by a steering group of representatives from     observations, and advancing new technologies and approach-
nine federal agencies and four non-federal institutions.          es (remote-sensing based Seascapes and other approaches,
At the heart of the ATN data management vision is a central-      acoustics, environmental DNA, still and video imagery, and
ized data assembly center (DAC), which is a community re-         machine learning)—all in the service of users and stakeholders
source where regional telemetry data are aggregated in a single   such as National Marine Sanctuaries, Integrated Ecosystem
place, and one-stop-shopping is provided for access to all U.S.   Assessment, state management agencies, federal managers, and
national animal telemetry data. The DAC both serves national      others.
stakeholder needs effectively and enables cost/time savings to    Like ATN, MBON seeks to build communities through alliances
principal investigators. Examples of current ATN community        and collaborations in the U.S. and globally, support baseline ob-
support include two regional acoustic node data managers,         servations, and advance data management and delivery.
a National Marine Fisheries Service-funded DAC data coor-
dinator, a Georgia Department of Natural Resources acoustic
receiver array, and financial support of the Argos fees for ATN
satellite tag researchers.

                                                                                                        ATN • MBON • OTN Workshop / 5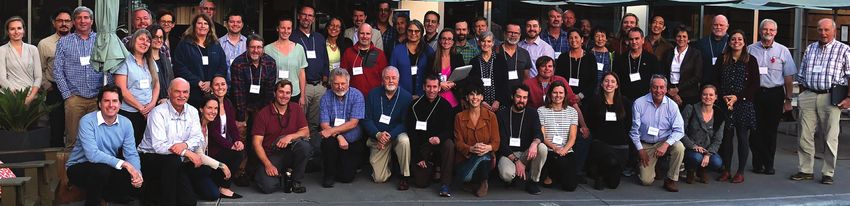
U.S. WEST COAST

     The Ocean Tracking Network: Global Infrastructure and
     Research Network for Aquatic Animal Research
     Fred Whoriskey, Executive Director, Ocean Tracking Network , Dalhousie University, Halifax, Nova Scotia, Canada
     The Ocean Tracking Network (OTN) is a collaborative, globally-linked infrastructure platform and research network originally
     formed as an International Joint Venture from the Census of Marine Life. OTN uses electronic telemetry to research animal move-
     ments and survival and their link to environmental conditions to achieve its overall goal of advancing conservation and manage-
     ment of aquatic biological resources. Headquartered in Canada the OTN includes more than 400 investigators from 20 countries
     detecting over 140 individual marine animal species.
     The OTN infrastructure includes global acoustic telemetry networks and world class glider and data teams. They are an Associate
     Data Unit of the IOC’s IODE, and a Tier 2 OBIS node. Their research projects are focused on:
      •   Managing fisheries (assigning spatially-linked quotas and monitoring endangered and highly valued species)
      •   Assessing Marine Protected Areas
      •   Understanding changing animal distributions due to climate change
      •   Performing environmental impact assessments
      •   Conducting ecosystem and fundamental science research

     OTN recently renewed funding support for infrastructure for 5 years beginning in 2018 with no obligatory sunset provision. They
     are adding additional new gliders and receivers, seeking new research funding to pair with their infrastructure (e.g., Strategic Proj-
     ect Grants; SeaMonitor; Industry/OFI, working to enable new Canada International funding), and implementing a new data node
     for MigraMar (Central, North, and South America).

     Coho on the Salmon River. Photo Credit: Northwest Indian Fisheries Commission

6 / ATN • MBON • OTN Workshop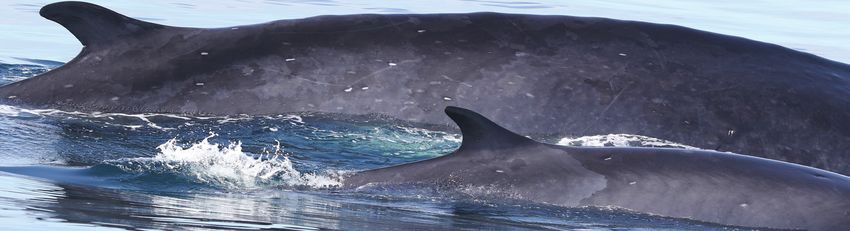
WORKSHOP REPORT

WORKSHOP HIGHLIGHTS
I. STAKEHOLDER MONITORING/
   OBSERVATIONAL NEEDS
• A time series is the cornerstone of what we do: “Today’s time series is tomorrow’s baseline.”
• Reductions in the presence of chemicals don’t define success – the responses of the fish to the reductions need to be observed in
  order to determine success.
• The Marine Mammal Protection Act (MMPA) and the Endangered Species Act (ESA) require information about distinct popu-
  lation segments, population size, stock structure, human-caused mortality, threats, and trends in abundance.
• Observations of biomass and species distribution, abundance, and diversity are needed to furnish answers to the 17 questions
  in the Sanctuaries Condition Reports on water quality, habitat, and living resources; for example, “What is the status of biodi-
  versity and how is it changing?”
• The Port of Long Beach needs higher quality telemetry/biodiversity data: they welcome assistance with telemetry solutions that
  reduce whale strikes from incoming vessels and improve marine mammal monitoring, especially during pile driving/blasting,
  as well as community partnerships to implement cost-effective, less invasive eDNA sampling methods.
• There is a need to quantify temporal trends in the biology of ecosystems for a wide array of organism types and whether any
  changes can be attributed to water quality.
• The Bureau of Ocean Energy Management (BOEM) requires observations that enable them to determine the effects of activities
  that have impact on the environment and on affected resources from U.S. Outer Continental Shelf energy and mineral resourc-
  es development.
• Observing ocean microbes is critical because they produce at least fifty percent of the oxygen in our atmosphere while re-
  moving large amounts of carbon dioxide. They also form the foundation of marine food webs, including those that support
  global ocean fisheries.
• Long-term data sets are needed of marine mammal distributions in the Monterey region describing the presence/absence of
  various species over time.

II. EXISTING OBSERVING ASSETS
University of California Santa Barbara
•   Ocean data and species archetype modeling to uncover the complex and multiscale drivers of kelp forest communities
•   Remote sensing to assess kelp forest condition, age and extent plus phytoplankton functional diversity
•   Acoustic detection of marine mammals and their foraging patterns
•   Genomics looking at microbial diversity and community structure
•   eDNA and acoustic telemetry for detection of great white sharks
•   Bottom mounted, shallow water, acoustic broadband receivers for soundscape monitoring
•   Gliders for deeper waters or targeted monitoring of cross-boundary species
•   Co-deployment/maintenance of acoustic telemetry receivers for shark detections

                                                                                                       ATN • MBON • OTN Workshop / 7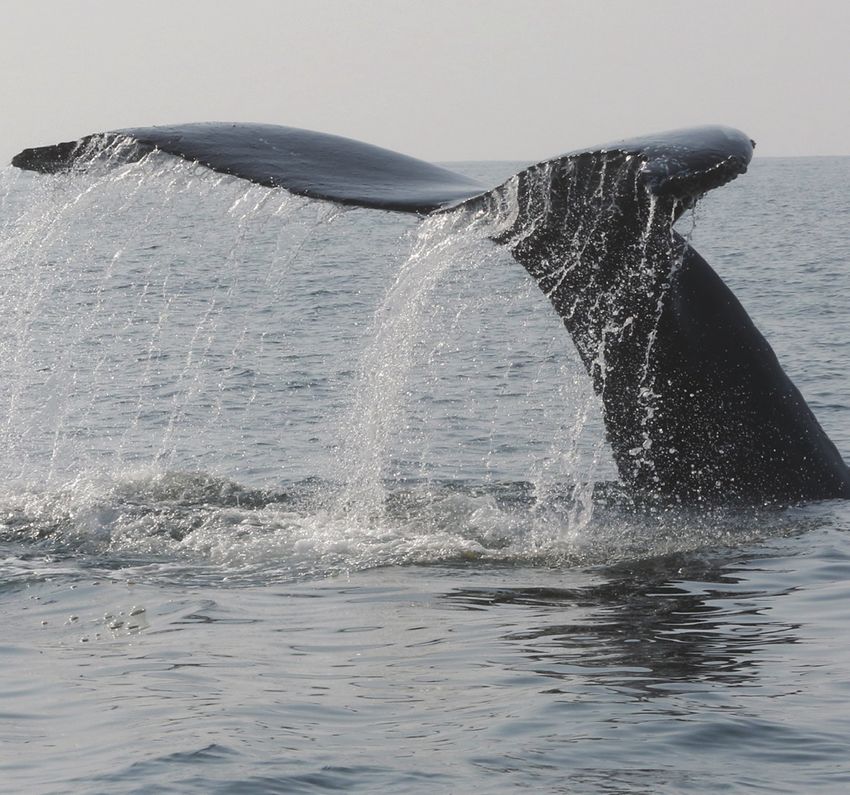
U.S. WEST COAST

     Stanford University, Hopkins Marine Station
     Goldbogen Lab
     Using commercially available CATS (Customized Animal Tracking Solutions), Goldbogen Lab employs these self-contained,
     suction-cup attached tags to collect 3D movement data and dual video at high resolution to measure the fine-scale kinematics of
     engulfment (extreme lunge-feeding strategy exhibited exclusively by rorquals) relative to the speed of the body.
     Block Lab
      • 811 archival tag releases, 403 recaptures 2002–2018, more than 84,000 days of data to determine when Eastern Pacific Ocean
        bluefin tuna go to the spawning grounds in Japan and the Philippines
      • White Shark Café: 34 satellite tags timed to pop up during a cruise to the Café
      • Sentinel tagging at Café confirming that the Café location remains unchanged for ~ 20 years
      • The combined efforts of TOPP and the Tag a Giant (TAG) Foundation today: representing more than 6,500 tag deployments
      • Acoustic tagging of bluefin tuna to estimate survivorship for International Commission for the Conservation of Atlantic Tuna
        or ICCAT spatial models: ~100 tags during 2010- 2017, Gulf of St. Lawrence, Newfoundland, Nova Scotia
      • Acoustic tagging of Pacific bluefin, salmon sharks, and white sharks for long-term monitoring: hundreds of tags; receivers at
        Tomales Pt., Pt. Reyes., Farallon Islands, Ano Nuevo Islands, Monterey Bay/Hopkins and deployed on wave gliders
      • SharkNet app: monitors detection of white sharks from real-time receivers/buoys.

     NOAA/National Marine Fisheries Service
     Southwest Fisheries Science Center - Marine Mammal and Turtle Research Division
     Marine Biodiversity
      • Cetacean Abundance and Ecosystem Assessment Surveys
         ◊ California Current - 1996, 2001, 2005, 2008, 2014, 2018, future goal ~4–5 year periodicity
         ◊ Eastern Tropical Pacific - 1986–90, 1998–2000, 2003, 2006, no future surveys planned
         ◊ Hawaiian Archipelago (partnership with Pacific Islands Fisheries Science Center) 2002, 2010, 2017, Future goal ~6-year
           periodicity
     Animal Telemetry
      • Leatherbacks: ~140 tags deployed, Monterey Bay, Indonesia, Solomon Islands
      • Loggerheads: ~25 tags deployed, Mexico, Peru, Southern California
      • Hawksbills: ~40 tags deployed, El Salvador, Nicaragua, Ecuador
      • Greens: ~50 tags deployed, Galapagos, Mexico, California
      • Killer whales, minke, humpback, gray whales, sperm, short-finned pilot, melon-headed whales, Blainvilles, Cuviers beaked
        whales, and rough-toothed dolphins: >200 spot and splash limpet tags deployed, 10 species, three ocean basins, 2009–2015

     Monterey Bay Aquarium Institute
     Time series was started at three stations (C1, M1, M2) in the Monterey Bay region in 1988, where a broad suite of biogeochemical
     measurements are collected (temperature, salinity, sigma-t, chlorophyll, chlorophyll A, oxygen). The stations are visited by ship at
     approximately three-week intervals, and moorings are maintained at two of the stations. These are part of a demonstration Marine
     Biodiversity Observation Network (MBON) project in the region.

     U.S. Navy
     The U.S. Navy has funded satellite tagging studies along the U.S. West Coast and Baja Mexico (2008–2019).

8 / ATN • MBON • OTN Workshop
WORKSHOP REPORT

Catalina Sea Ranch
Automated offshore aquaculture monitoring system, dubbed the “Ocean Internet of things,” relays observations of temperature,
salinity, pH, dissolved oxygen, and phytoplankton density in real-time via cellular technology to a cloud server for analyses by
marine scientists via the Internet.

University of California Santa Cruz
Costa Lab
Antarctica
 • Leopard seals - 22 in 2018–2019—GPS Argos location and dive behavior tags, Antarctic Peninsula
 • Weddell seals (Ross Sea)- 65 in 2010–2013—SMRU CTD, Argos location and diving behavior tags
 • Crabeater seals - 34 in 2001–2002 and 8 in 2007—Argos location tags
 • Southern elephant seals - 56 in 2005–2009—SMRU CTD and Argos location and diving behavior tags
Everywhere else
 • Northern elephant seals - 800+ tags deployed 2004–2018. A wide array of CTD, GPS, Argos location and diving behavior tags,
   as well as archival tags.
 • California sea lions - 32 females in 2003–2005, 35 females in 2005–2008. Southern California GPS, Argos location, and dive
   behavior tags. 22 males in 2005–2008. GPS and CTD tags.
 • Galapagos sea lions - 30+ females. GPS, dive behavior tags.
 • Southern sea lions - 30+ tags. Argos location and diving behavior.
Friedlaender Lab
 • Multi-sensor suction cup tags attached to baleen whales: Monterey Bay, Cape Cod, Alaska, Antarctica
 • Fisheries echosounders
 • Satellite tags: Antarctica
 • Current and future (~3 years) status of tagging/biodiversity observation program
    ◊ 15+ years in Antarctica: National Science Foundation, IWC, Southern Ocean Research Partnerships, World Wildlife Fund
    ◊ 10+ years in Stellwagen Bank National Marine Sanctuary
    ◊ 5+ years in Monterey Bay: National Science Foundation
    ◊ 8+ years Southern California Behavioral Response Studies: Office of Naval Research, LMR

                            Attaching a motion sensing suction cup tag on a blue whale off the coast of California.
                            Photo Credit: Jeremy Goldbogen

                                                                                                                      ATN • MBON • OTN Workshop / 9
U.S. WEST COAST

     III. STAKEHOLDER USE OF TELEMETRY/
     BIODIVERSITY DATA
      • Ultimately, we aim to move toward Ecosystem Based Management (EBM), for which fisheries is one of a number of issues that
        need to be managed in an integrated, holistic way, with trade-offs amongst multiple interests.
      • Long-term sustained telemetry/biodiversity observations are required to address and understand the functional and con-
        text-dependent responses of marine mammals to change and disturbances (including Navy sonar) and to understand the struc-
        ture and function of marine ecosystems.
      • California Current Integrated Ecosystem Assessment Status reports evolve yearly to include currently relevant indices: e.g.,
        biodiversity indicators from MBON and ecosystem impacts of the “blob.”
      • Current operating models for bluefin tuna want spatial data combined with genetic and microchemistry data utilized in assess-
        ing the overall catch and biomass of tunas.
      • The data collected by the Oregon State University Whale Telemetry Group in the last 30 years offers a unique global view of
        whale movements, with great potential to improve our understanding of movement ecology in space and time and to provide
        management bodies (e.g., NMFS, International Whaling Commission, etc.) and industry with data and information to improve
        conservation and management policies.
      • Ocean assessments are organized around three questions: Is it safe to swim? Is it safe to eat fish? Is the ecosystem protected?
        The biological data are used to quantify temporal trends, to assess whether any changes can be attributed to water quality, and
        to answer the three questions above.

     IV. DATA MANAGEMENT OPPORTUNITIES
     AND CHALLENGES
     Opportunities
      • Biodiversity monitoring is a critical tool in understanding baseline and abnormal conditions in pelagic environments.
      • Opportunities must continue for supporting large scale tagging projects like TOPP and associated data sharing (ATN)
        because they are necessary to make tag data useful for monitoring biodiversity and informing management.
      • To bridge the gaps between information known and unknown, the California Fisheries sees the ATN as an opportunity to
        connect them with accessible researcher data.
      • IOOS has a great opportunity to provide community leadership in biological assessments by ensuring sustained support of MBON.
      • There is an opportunity for biologging to play a significant role in studying marine biodiversity observations by providing observa-
        tions on distributions and collecting quantitative data that can be used in modeling of biomass and critical life history parameters.
     Challenges
      • “Two things to never do with a time series: 1) Start one; 2) End one.”
      • Federal permitting authorities and funding agencies need to highlight and enforce data sharing requirements before
        permits/grants for tagging are renewed.
      • While individual animal tag tracks are very useful, bigger datasets are needed that allow for derivation of species-specific home
        ranges if we are to understand habitats and their variability.
      • Because ocean biological processes are continually changing, long term sustained observations are essential in order to keep
        models and modelers in check.
      • The NOAA Fisheries Marine Aquaculture Strategic Plan FY 2016–2020 calls for “At least a 50% increase in responsible U.S.
        marine aquaculture production by the year 2020.” This will necessitate substantial increases in associated biological observa-
        tions to support the permitting requirements.

10 / ATN • MBON • OTN Workshop
WORKSHOP REPORT
WORKSHOP CONCLUSIONS
OBJECTIVE I: Identify and Prioritize Stakeholder Marine
Animal Telemetry and Biodiversity Monitoring and
Observational Needs in the West Coast Region.
THEME A: Reductions in the presence of chemicals don’t define success —the responses of the fish to the reductions need
to be observed in order to determine success.
THEME B: Processes change, and thus require long-term sustained observations to keep models and modelers in check.
THEME C: Observations are needed from animal borne sensor tags (biologging), which simultaneously sample the ocean
environment while providing detailed information on marine species.
THEME D: “Today’s time series is tomorrow’s baseline.”
THEME E: Biology and biological condition assessments are central to water quality manager interests. There is a need to
quantify temporal trends in the biology of ecosystems for a wide array of organism types and whether any changes can be
attributed to water quality.
THEME F: Long-term data sets are needed of marine mammal distributions in the Monterey region describing the pres-
ence/absence of various species over time.
THEME G: Data types needed include telemetry, phytoplankton, zooplankton, vertebrates, chemical and physical oceanography,
(marine geology).
FEDERAL AGENCIES
Bureau of Ocean Energy Management (BOEM)
BOEM requires observations that enable them to determine the effects of activities that impact the environment and on affected
resources from U.S. Outer Continental Shelf energy and mineral resources development.
NOAA/National Marine Sanctuaries
The National Marine Sanctuaries need observations of biomass and species distribution, abundance, and diversity to furnish
answers to the 17 questions in the Sanctuaries Condition Reports on water quality, habitat, and living resources, e.g., “What is the
status of biodiversity and how is it changing?”
NOAA/National Marine Fisheries Service/Southwest Fisheries Science Center
• Key observing technologies that provide the data needed to implement ecosystem-based fisheries management (EBFM) are:
◊ Observations from animal borne sensor tags (biologging), which simultaneously sample the ocean environment while pro-
viding detailed information on marine species, and
◊ Observations from autonomous ocean samplers (e.g.gliders), which can collect high-resolution, continuous water col-
umn data that can be assimilated into regional models.
• For climate vulnerability assessments, the focus is on 62 species (e.g., groundfish, CPS, HMS, salmon), and a large number of
sensitivity attributes and climate exposure factors for them.
ATN • MBON • OTN Workshop / 11U.S. WEST COAST
TRIBAL
Northwest Indian Fisheries Commission
The Northwest Indian Fisheries Commission (NWIFC) is
a natural resources management support service organiza-
tion for 20 treaty Indian tribes in western Washington. They
provide policy coordination and technical support services
for their members which includes observations of the
following species to provide data for tribal ecosystem-based
fisheries management:
• Coho salmon
• Lake Ozette sockeye salmon
• Chinook salmon/southern resident killer whales (many
Puget Sound and British Columbia stocks are threatened/
endangered)
• Pinnipeds/other marine mammals
• Whale entanglement occurrences
• Sea lion
• Sea otters
NGO Sockeye salmon. Photo Credit: Northwest Indian Fisheries Commission
The Marine Mammal Center (TMMC)
TMMC is a partner with and a contributor to the Marine Mammal Health M.A.P. (Monitoring and Analysis Platform), a web-
based tool for evaluating changes in marine mammal health by geographic location and time. Observations are needed of marine
mammal health in the wild that can be correlated with related physical, chemical, and biological environmental parameters.
Blue Point Conservation Society
The Blue Point Conservation Society’s keystone datasets seek/collect information on seabird reproduction/survival and life history
parameters. The society needs tracking observations/studies that address knowledge gaps in summer breeding season movements,
winter movements/post breeding season, whether winter conditions may be most limiting, and specific conservation needs.
O’Neil Sea Odyssey (ONSO)
The ONSO is a non-profit organization that provides a living classroom on board a 65-foot catamaran sailing the Monterey Bay
where 4th–6th grade students from schools throughout Central California receive hands-on lessons about the marine habitat and
the importance of the relationship between the living sea and the environment. ONSO would like to have access to biodiversity and
telemetry from the boat and in the plankton samples they collect.
Southern California Coastal Water Research Project Authority (public agency)
Biology and biological condition assessment are central to water quality manager interests. Chemical stressors are what is managed,
but the goal is to improve “beneficial uses,” and biological endpoints are at the core of beneficial uses. There is a need to quantify
temporal trends in the biology of ecosystems for a wide array of organism types and whether any changes can be attributed to water
quality. Reductions in the presence of chemicals don’t equal successthe responses of the fish to the reductions determine the success.
12 / ATN • MBON • OTN WorkshopWORKSHOP REPORT
COMMERCIAL/PRIVATE SECTOR
Port of Long Beach
• Physical characteristics (water quality and sediment grain size)
• Benthic infauna
• Ichthyoplankton
• Demersal fish and macroinvertebrates
• Pelagic and shallow-water fishes
• Riprap epifauna
• Kelp and macroalgae
• Eelgrass
• Birds
• Marine mammals
• Presence of non-native species
• The Port of Long Beach collects and uses their own telemetry/biodiversity data but are open to new ideas for improving:
◊ Methods for reducing whale strikes from incoming vessels
◊ Marine mammal monitoring during pile driving and blasting
◊ Community partnerships to help implement eDNA sampling methods
H.T. Harvey & Associates
• Observations that are needed are telemetry, phytoplankton, zooplankton, vertebrates, chemical and physical oceanography,
(marine geology).
• Considerations that are essential for renewable energy siting are environmental attributes, human uses, ecological attributes, and
marine spatial planning.
Monterey Bay Whale Watch
The Monterey Bay Whale Watch needs long-term data sets of marine mammal distributions in the Monterey region describing the
presence/absence of various species over time.
Pacific Coast Federation of Fishermen’s Association
The association generally has good information on catch, stock abundance, maritime weather, and spatial use patterns of big boats.
Areas where information is lacking though include: spatial use patterns of small boats, socioeconomics/ethnographics, the sea
food supply chain/imports, integrity of food supply/toxicity/trophic dynamics, gear/marine mammal interaction, climate change
impacts (i.e., anticipating winners and losers) and facilitating transitions (e.g., from one stock to another based on how predicted
to fare in future) and managing for resilience.
Catalina Sea Ranch
The Catalina Sea Ranch requires the following: real-time temperature, salinity, pH, dissolved oxygen and phytoplankton density
observations to analyze and evaluate the aquaculture farm conditions.
ATN • MBON • OTN Workshop / 13U.S. WEST COAST
OBJECTIVE II: Identify the Existing Telemetry and Biodiversity
Observing Assets and Scientific Capabilities in the Region.
FEDERAL
U.S. Navy
The U.S. Navy funded satellite tagging studies along the U.S. West Coast and Baja Mexico (2008–2019).
Name Location Date Agency/Organization Status
Steelhead trout Pacific Northwest 2019 Northwest Fisheries Science 20 proposed
Chinook salmon Center
Bull trout
Humpback whales Washington, Oregon, 2017–2018 Oregon State University 44
California
Gray whale Oregon 2012 Oregon State University 11
Blue and fin whales Southern California 2014–2017 Oregon State University 92 blue whales
32 fin whales
1 blue fin hybrid
1 Bryde’s whale
Green sea turtles San Diego Bay 2015–2016 Southwest Fisheries Science 8
Center
Beaked whales Southern California 2008–onging Marine Ecology and Telemetry 30 Cuvier’s beaked whales
Research (MarEcoTel) 14 Risso’s dolphins
8 Killer whales
2 Baird’s beaked
1 bottlenose dolphin
Sperm whales Southern California 2010–ongoing MarEcoTel 3
Fin whales Southern California 2008–ongoing MarEcoTel 62
Cuvier’s beaked Southern California 2018–2019 MarEcoTel 4 in 2018
Guadalupe fur seals Guadalupe Island, 2019 The Marine Mammal Center 35 proposed
Mexico
A pair of fin whales off Palos Verdes in Southern California.
Photo Credit: John Calambokidis, Cascadia Research (NMFS Scientific Research Permit #21678)
14 / ATN • MBON • OTN WorkshopWORKSHOP REPORT
NOAA/National Marine Fisheries Service
Southwest Fisheries Science Center/Marine Mammal and Turtle Research Division
Marine Biodiversity
• Cetacean Abundance and Ecosystem Assessment Surveys
◊ California Current - 1996, 2001, 2005, 2008, 2014, 2018, future goal ~4–5 year periodicity
◊ Eastern Tropical Pacific - 1986–90, 1998–2000, 2003, 2006, no future surveys planned
◊ Hawaiian Archipelago* - 2002, 2010, 2017, Future goal ~6-year periodicity
(*partnership with Pacific Islands Fisheries Science Center)
• Aerial Surveys
◊ Leatherback and loggerhead turtle distribution and abundance, ~2–4 year periodicity
◊ Pinniped abundance, ~3-year periodicity
◊ Coastal cetaceans, irregular
• Small Boat and Shore-Based Research
◊ Cetacean health assessment
◊ Green and leatherback turtle ecology
◊ Gray whale abundance and reproductive output
◊ Cetacean and marine turtle stranding response
Animal Telemetry
• Leatherbacks: ~140 tags deployed, Monterey Bay, Indonesia, Solomon Islands
• Loggerheads: ~25 tags deployed, Mexico, Peru Southern California
• Hawksbills: ~40 tags deployed, El Salvador, Nicaragua, Ecuador
• Greens: ~50 tags deployed, Galapagos, Mexico, California
• Killer whales, minke, humpback, gray whales, sperm, short-finned pilot, melon-headed whales Blainvilles, Cuviers beaked whales
and rough-toothed dolphins: >200 spot and splash limpet tags deployed, 10 species, three ocean basins, 2009–2015
Northwest Fisheries Science Center/Manchester Research Station/Puget Sound acoustic telemetry research (2004–Present)
• Hundreds of tags
◊ Lingcod and Pacific cod
◊ Coho salmon
◊ Harbor seals
◊ Steelhead trout
◊ Cutthroat trout
• Research applications
◊ Develop rearing and release strategies for stock enhancement
◊ Identify limiting factors for ESA-listed species
◊ Quantify predation impacts
◊ Test effectiveness of management actions
U.S. Geological Survey
Marine Biodiversity
• Aerial marine bird and mammal abundance and distribution surveys
◊ Southern California Current (1999–2002, 2017–21); Northern California Current (2011–12); future goal ~10–20 year-periodicity
• Small Boat Surveys
◊ Central California Marbled Murrelet abundance surveys: 1996–annually, ongoing
ATN • MBON • OTN Workshop / 15U.S. WEST COAST
Animal Telemetry
>1,338 tags deployed, 15 seabird species
• Cassin’s Auklet: VHF tags (N=99; 1999–2001, California Channel Islands)
• Xantus’s (Scripps’s) Murrelet: VHF tags (N=112, 2002–2003, California Channel Islands [with Humboldt State University])
• Ashy Storm-Petrel: VHF tags (N=57; 2004–2005, California Channel Islands)
• Sooty Shearwater: satellite PTTs (N=109; 2004–2009, California Current [with Moss Landing Marine Labs])
• Pink-footed Shearwater: satellite PTTs (N=42; 2006–2015), GPS tags (N=49; 2015–2017) [with Oikonos Ecosystem Knowledge];
California Current and Chile)
• Black-footed Albatross: satellite PTTs (California Current N = 8 and NW Hawaiian Islands N=7 [with Oikonos Ecosystem
Knowledge])
• Common Murre: satellite PTTs (N=58; 2011–2012, 2015–2016, California Current [with NOAA NWFSC and Oregon State University])
• Hawaiian Petrel: satellite PTTs (N=30; 2006–2008, 2013–2014, Main Hawaiian Islands)
• Newell’s Shearwater: satellite PTT (N=50; 2014–2018, Kauai [with Kauai Endangered Species Recovery Project]
• Grey-faced Petrel: satellite PTTs (N=32; 2006–2007, New Zealand [with Landcare New Zealand])
• Laysan Albatross: GPS-accelerometry tags (N=35; 2014, 2016, Main Hawaiian Islands)
• Wedge-tailed Shearwater: GPS tags, TDRs (N=368; 2013–2015, Main Hawaiian Islands)
• Red-footed Booby: GPS tags, TDRs, accelerometry (N=172; 2013–2016, Main Hawaiian Islands)
• Brown Booby: GPS tags, TDRs (N=43; 2014–2015, Main Hawaiian Islands)
• Red-tailed Tropicbird: GPS, TDRs (N=67; 2014–2016, Main Hawaiian Islands)
ACADEMIA
University of California Santa Barbara
• Ocean data and species archetype modeling to uncover the complex and multiscale drivers of kelp forest communities
• Remote sensing to assess kelp forest condition, age and extent plus phytoplankton functional diversity
• Acoustic detection of marine mammals and their foraging patterns
• Genomics looking at microbial diversity and community structure
• eDNA and acoustic telemetry for detection of great white Sharks
• Bottom mounted, shallow water, acoustic broadband receivers for soundscape monitoring
• Gliders for deeper waters or targeted monitoring of cross-boundary species
• Co-deployment/maintenance of acoustic telemetry receivers for shark detections
University of California Santa Cruz
Costa Lab
Antarctica
• Leopard seals - 22 in 2018–2019—GPS Argos location and dive behavior tags, Antarctic Peninsula
• Weddell seals (Ross Sea)- 65 in 2010–2013—SMRU CTD, Argos location and diving behavior tags
• Crabeater seals - 34 in 2001–2002 and 8 in 2007—Argos location tags
• Southern elephant seals - 56 in 2005–2009—SMRU CTD and Argos location and diving behavior tags
Everywhere else
• Northern elephant seals - 800+ tags deployed 2004–2018. A wide array of CTD, GPS, Argos location and diving behavior tags,
as well as archival tags.
• California sea lions - 32 females in 2003–2005, 35 females in 2005–2008. Southern California GPS, Argos location, and dive
behavior tags. 22 males in 2005–2008. GPS and CTD tags.
• Galapagos sea lions - 30+ females. GPS, dive behavior tags.
• Southern sea lions - 30+ tags. Argos location and diving behavior.
16 / ATN • MBON • OTN WorkshopWORKSHOP REPORT
Friedlaender Lab
• Multi-sensor suction cup tags attached to baleen whales: Monterey Bay, Cape Cod, Alaska, Antarctica
• Fisheries echosounders
• Satellite tags: Antarctica
• Current and future (~3 years) status of tagging/biodiversity observation program
◊ 15+ years in Antarctica: National Science Foundation, IWC, SORP, World Wildlife Fund
◊ 10+ years in Stellwagen Bank National Marine Sanctuary
◊ 5+ years in Monterey Bay: National Science Foundation
• 8+ years Southern California Behavioral Response Studies: Office of Naval Research, LMR
California State University Long Beach (Shark Lab)
Historically
• 20 VR2W acoustic receivers in Southern California area in gridded arrays up to 20 km2 in size with more than 2,300 acoustic
tags deployed over the last 20 years
Current
• 110+ juvenile white sharks tagged since 2006 (60 with currently active coded acoustic transmitters), 18 SPOTs (up to 8 months)
and 35 PATs (programmed deployments 40–270 days), 29 internal acoustic tags (8–10 year life), 46 external acoustic tags (1–2
year life), 3 Smart tag tracks (up to 24 hours)
• More than 70 VR2W acoustic receivers and HOBO temp loggers spread along Southern California beaches and offshore islands
with 2 VEMCO real-time acoustic receiver buoys
Oregon State University
Tagging of Pacific Predators (TOPP) – 121 tracks
• blue (104), fin (2), humpback (15)
• Block et al. (2011) Tracking apex marine predator movements in a dynamic ocean. Nature. 475:86-90. doi:10.1038/nature10082
WhaleWatch – 133 tracks
• blue (104), gray (19)
Animal Telemetry Network (ATN) – 25 tracks
• blue (21), fin (1), sperm (3)
MoveBank – 21 tracks
• blue (2), fin (8), sperm (11)
Marine Megafauna Movement Analytical Program (MMMAP) and Migratory Connectivity in the Oceans (MiCO) – 348 tracks
• blue (139), bowhead (12), fin (8), gray (19), humpback (94), NARW (15), Southern right (18), sperm (43)
Tagging Best Practices Workshops
• Multiple tagging groups, work to develop “Best Practice” protocols for tagging and tag design to minimize impacts to whales
San Jose State University
A large number of western gulls tracked from the Farallon Islands between 2013 and 2018.
ATN • MBON • OTN Workshop / 17U.S. WEST COAST
Stanford University, Hopkins Marine Station
Goldbogen Lab
The lab used commercially available CATS (Customized Animal Tracking Solutions) self-contained, suction-cup attached tags
to collect 3D movement data and dual video at high resolution to measure the fine-scale kinematics of engulfment (extreme
lunge-feeding strategy exhibited exclusively by rorquals) relative to the speed of the body.
Block Lab
• 811 Archival tag releases, 403 recaptures 2002-2018, > 84,000 days of data to determine when Eastern Pacific Ocean bluefin
tuna go to the spawning grounds in Japan and the Philippines
• White Shark Café: 34 satellite tags timed to pop-up during a cruise to the Café
• Sentinel tagging at Café confirming that the Café location remains unchanged for ~ 20 years
• The combined efforts of TOPP and the Tag a Giant (TAG) Foundation today: representing more than 6,500 tag deployments
• Acoustic tagging of bluefin tuna to estimate survivorship for ICCAT spatial models: ~100 tags during 2010–2017, Gulf of St.
Lawrence, Newfoundland, Nova Scotia
• Acoustic tagging of Pacific bluefin, salmon sharks, white sharks for long-term monitoring: hundreds of tags; receivers at
Tomales Pt., Pt. Reyes., Farallon Islands, Ano Nuevo Islands, Monterey Bay/Hopkins and deployed on wave gliders
• SharkNet app: monitors detection of white sharks from real-time receivers/buoys
NGO
Marine Ecology and Telemetry Research (MarEcoTel)
MarEcoTel is a non-profit organization of a small group of biologists whose mission is to support the conservation of marine
species and populations.
MarEcoTel - Tag Deployments 2008–2018
Species Number Tagged Mean Duration (Days)
Blue Whale 3 103.8
Fin Whale 76 35.4
Minke Whale 1 25.6
Sperm Whale 3 36.6
Baird’s Beaked Whale 2 18.9
Cuvier’s Beaked Whale 24 33.9
Killer Whale 35 43.9
Risso’sDolphin 14 11
Bottlenose Dolphin 1 59
Total 169
Current and Future Telemetry Projects
Project Region Tentative End Priority Species
Behavioral response to sonar SoCal 2020 Beaked and fin whales
Distribution and demographics SoCal Ongoing Cuvier’s beaked and fin whales
Cuvier’s in a sonar-free area Guadalupe 2020 Cuvier’s beaked whales
Island, Mexico
Killer whale surveys Washington 2019 Offshore Biggs and killer whales
outer waters
SMRT tag development Hawaii/SoCal 2019
18 / ATN • MBON • OTN WorkshopWORKSHOP REPORT
Cascadia Research Collective
Cascadia Research is a non-profit Washington State that conducts scientific research and education primarily in the fields of ma-
rine mammal and bird biology, animal behavior, ecology, and pollution ecology.
Dart-attached tags off California Coast
Species Number TDR Acoustic
Deployed
Blue 29 21 8
Fin 8 1 7
Humpback 23 23 0
Blue Point Conservation Science
Winter movements of some of the alcid family of diving seabirds have been tagged:
• Planktivores - Pelagic - 123 tagged (2015–18)
• Piscivores - Benthic - 60 tagged (2017–18)
O’Neil Sea Odyssey
An example of the data collected on their educational boat trips:
Navigation Station Data Entry Biology Station Data Entry Ecology Station Data Entry
Measurement Time: 2:54 PM Measurement Time: 2:55 PM Measurement Time: 2:52 PM
Measurement Date: 10/24/2018 Measurement Date: 10/24/2018 Measurement Date: 10/24/2018
Bearing #1: 240 Location Mile Buoy Surface Temperature: 54° Fahrenheit Otter Count: 6
Bearing #2: 270 Location Steamers Lighthouse Seawater Depth: 45 feet Seawater pH: 7.9
Bearing #3: Location Dream Inn Seawater Visibility: 3 feet
GPS latitude: 36° 56' 393'' Plankton Sample: mostly zooplankton
GPS longitude: 122° 00' 360'' Plankton Notes: diatoms, copepods,
tintinid, barnacle, crab
Weather Observation: sunny velliger, bristle worm
Wind Speed: 2 knots Seawater Color: green knots
Depth: 66 feet
COMMERCIAL/PRIVATE SECTOR
Catalina Sea Ranch
Automated offshore aquaculture monitoring system, dubbed the “Ocean Internet of things,” relays observations of temperature,
salinity, pH, dissolved oxygen, phytoplankton density in real-time via cellular technology to a cloud server for analyses by marine
scientists via the Internet.
ATN • MBON • OTN Workshop / 19U.S. WEST COAST
OBJECTIVE III: Document Regional Stakeholder Specific
Uses of Marine Animal Telemetry and Biodiversity Data.
THEME A: Marine animal telemetry/biodiversity observations provide the U.S. Navy with basic biology that supports their
National Environmental Policy Act (NEPA) preparation, Marine Mammal Protection Act (MMPA) and Endangered Species
Act (ESA) consultations, responses to critical habitat proposals, and anthropogenic effects analysis.
THEME B: Based on our observations of how animals are using the environment, we can begin to build simple habitat
models and even make projections about changes in critical habitat based on climate projects.
THEME C: Current operating models for bluefin tuna require spatial data in combination with genetic and microchemistry
data utilized in assessing the overall catch and biomass of tunas.
THEME D: The California Current Integrated Environmental Assessment Ecosystem status reports evolve yearly to include
currently relevant indices: e.g., environmental drivers of sablefish recruitment, ecosystem impacts of the “blob,” biodiversity
indicators from MBON, and spatially explicit risk analyses through dynamic ocean management studies.
THEME E: Determine the effect of habitat or landscape alteration from BOEM-regulated activities on ecological and
cultural resources.
THEME F: Long-term sustained telemetry/biodiversity observations are required to address and understand the functional
and context-dependent responses of marine mammals to change and disturbances (including U.S. Navy sonar) and to
understand the structure and function of marine ecosystems.
THEME G: Understanding the operational impact risks of the renewable energy technology: bird collisions, mammal
disruption, entanglement, effects of structure on behavior and ecology, and effects on physical environment.
FEDERAL AGENCIES
BOEM
• Determine the effect of habitat or landscape alteration from BOEM-regulated activities on ecological and cultural resources.
• Evaluate the acute and chronic effects of sound from BOEM-regulated activities on marine species and their environment.
• Determine the extent to which future ocean conditions and dynamics will amplify or mask effects of BOEM-regulated OCS
activities.
• Assess cumulative effects within the framework of environmental assessments.
Life on rocky offshore ledges at Monterey Bay National Marine Sancturary. Photo Credit: Kip Evans
20 / ATN • MBON • OTN WorkshopWORKSHOP REPORT
NOAA/National Marine Sanctuaries
The Sanctuary Condition Reports are used to inform and to dynamically update in real-time the assessment of the status and
trends of the marine sanctuary resources for the benefit of resource managers, researchers, policy makers, and educators.
U.S. Navy
The U.S. Navy marine animal telemetry/biodiversity observations assist basic biology supporting NEPA preparation, the Marine
Mammal Protection Act (MMPA) and Endangered Species Act (ESA) consultations, U.S. Navy responses to critical habitat propos-
als, and anthropogenic effects analysis.
MMPA and ESA Consultations, Critical Habitat, Basic Biology
• What is occurrence and importantly residency times within and outside of sea ranges?
• Are designated or proposed biologically important areas really important?
• Range specific monitoring supporting permit requirements and commitments
• What are overlaps between critical habitat and species movements within U.S. Navy range areas?
Anthropogenic Effects Analysis
• Does a given species respond to U.S. Navy stressors (e.g., sonar)?
• What is level of response, if any?
• What variables are most impactful in a response (e.g., behavioral state, proximity to source, etc.)?
Potential growth area for U.S. Navy
• To combine marine telemetry tracks with other environmental and impact assessment analysis.
NOAA NMFS/Southwest Fisheries Science Center (SWFSC)
The California Current Integrated Ecosystem Assessment (CCIEA), coordinated at the SWFSC, is an interdisciplinary research
effort by U.S. West Coast NOAA scientists with its own website that displays status and trends indicators (e.g., ecological integ-
rity (diversity, forage ability, biomass ratio, etc.) and large-scale oceanographic indices. CCIEA ecosystem status reports evolve
yearly to include currently relevant indices (e.g., environmental drivers of sablefish recruitment, ecosystem impacts of the
“blob,” biodiversity indicators from MBON) and spatially explicit risk analyses through dynamic ocean management studies.
Future of the CCIEA includes integration with fisheries ecosystem plans, plus automation and regular updating of time series/
reports and telemetry data, including time series of animal movement data.
Ultimately, the goal is to move toward EBM, in which fisheries is one of a number of issues that need to be managed in an integrat-
ed, holistic way, with trade-offs amongst multiple interests. As with any in situ ocean data, biologging observations can be used
both for model validation and assimilation. Because biologging/animal borne sensor tags are on actively diving animals, we can
obtain information on 3D ocean structure, often with enough vertical resolution to identify things like mixed layer depth, and with
enough temporal resolution to observe event-scale variability (e.g., the ocean and elephant-seal response to storm passage). We can
also see track fidelity among individuals and within populations—which gives a kind of “repeat hydrography” from which we can
begin to look at interannual variability.
We’ve also seen the preferred utilization of eddies and frontal features by many species. From these data, we can learn a great
deal about eddy/frontal structure and evolution, and based on the observed behaviors, we can also speculate on prey aggregation
mechanisms. Also, based on our observations of how animals use the environment, we can begin to build simple habitat models
and even make projections about changes in critical habitat based on climate projects. From biologging we are learning about the
distribution, migration, and foraging behavior of bluefin tuna, a key top predator, in relation to environmental conditions and the
forage base; we are also learning about ecosystem structure and function in relation to the environment.
ATN • MBON • OTN Workshop / 21U.S. WEST COAST
US Geological Survey
Western Ecological Research Center-Santa Cruz Field Station, Seabird Studies Program
Current studies are focused in the California Current System (CCS) and Hawaii, but telemetry data and collaborations span
the Pacific Ocean. Telemetry activities complement an ongoing series of California Current-based regional aerial seabird surveys
conducted every 15–20 years since the 1970s. This and other data have enabled studies of seabird vulnerability to ocean wind
energy infrastructure in the CCS. Also, with (CCS) data from U.S. Geological Survey, NOAA, and others, the NOAA/ National
Ocean Service/ National Centers for Coastal Ocean Science Biogeography Group is planning to produce a species-based predictive
modeling framework for seabird marine spatial planning in the region.
ACADEMIA
University of California Santa Barbara
MBON data can predict how fish biomass and abundance will change under different decommissioning scenarios of several off-
shore platforms.
University of California Santa Cruz
Costa Lab
Telemetry data are used to: i) understand the behavior of marine animals and their adaptations to life in the marine environment,
especially the movement, foraging ecology, and energetics of pinnipeds, cetaceans, and seabirds, ii) understand the population-level
consequences of anthropogenic disturbance and environmental change in marine mammals and, iii) develop science-based tools
that can be used by resource managers to support the development of realistic population risk assessments as well as effective wild-
life management and conservation strategies.
Friedlaender Lab
The focus is to understand the functional and context-dependent responses of marine mammals to change and disturbances,
including U.S. Navy sonar and understand the structure and function of marine ecosystems.
Lunge feeding. Photo Credit: John Calambokidis, Cascadia Research (NMFS Scientific Research Permit #21678)
22 / ATN • MBON • OTN WorkshopWORKSHOP REPORT
California State University Long Beach
Shark Lab
The research goals of the Shark Lab’s juvenile white shark monitoring and beach safety program include:
• Providing water safety officials with shark abundance and movement data
• Developing prediction models
• Providing public outreach – outlet data in public friendly forms
• Archiving, serving and sharing data
Oregon State University
Large endangered whale species research objectives aim to:
• Characterize:
◊ Spatial and temporal distribution of whales throughout their range
◊ Foraging behavior
◊ Ecological relationships to help explain whale movement patterns
• Identify migration routes, home ranges and core areas of use.
The data collected by the Whale Telemetry Group in the last 30 years offers a unique global view of whale movements, with great
potential to improve our understanding of movement ecology in space and time and to provide management bodies (e.g., NMFS,
International Whaling Commission, etc.) and industry with data and information to improve conservation and management policies.
San Jose State University
Use tracking and other data from western gulls to:
• Examine interannual variability in habitat use
• Efficacy of sanctuaries for spatial coverage
• Model the threats from:
◊ Continued use of urban sources
◊ Interactions with fisheries
◊ Impacts of coastal development for offshore wind farms (in partnership with USGS)
Stanford University, Hopkins Marine Station
Goldbogen Lab
The focus is on studying the physiological ecology of marine organisms, functional morphology and biomechanics, biologging kine-
matic and physiological parameters, and effects of anthropogenic activities on marine life.
Block Lab
Management models are trying to capture the biological complexity and status of Atlantic bluefin tuna populations from electronic
tags combined with genetic and microchemistry data utilized in assessing the overall catch, and biomass of tunas.
The lab’s biologging activities focus on studying behavior of fish in the wild including habitat utilization, foraging and spawning
behaviors, population biology, mortality, maturity, management and assessment, climate change, and physiology.
They are applying a game-changing technology to monitor global fishing fleets in real-time using Automatic Identification System
(AIS) data. Through a collaboration with the Global Fishing Watch, Skytruth, Google, and other academic partners, they are
analyzing these data—matching these signals with vessel census lists from fisheries management organizations around the
world to detect overfishing.
ATN • MBON • OTN Workshop / 23U.S. WEST COAST
TRIBAL
Northwest Indian Fisheries Commission (NWIFC)
A primary goal of the NWIFC is to provide data and information necessary for tribal ecological-based fishery management. This
will include habitat data categorized using the Coastal and Marine Ecological Classification Standard (CMECS) to provide a
common language for decision makers and technical experts and will ultimately be a tool to help decision makers understand the
interconnectedness of marine ecosystems and how management decisions will impact marine resources. Specific data uses include:
• Understanding whale entanglements to learn more about this so they can be proactive to avoid similar issues encountered by
New England lobster fishermen
• Understanding the life cycle of specific salmon species (coho, Lake Ozette sockeye, chinook) because of their importance to
tribal fisheries
• Studying the movement and survival of the marine mammals (sea lions, sea otters) to better understand the effects of their
predation on the tribal fisheries
NGO
Monterey Bay Aquarium Research Institute
The data collected are used to identify the biological response to climate and global change by:
• Determining the mean and fluctuating components of phytoplankton primary production, biomass, and species composition
on timescales ranging from days to decades
• Determining the physical, chemical, and biological processes responsible for the mean and fluctuating components
• Determining the time-varying biogeochemical and ecological (zooplankton, fish) fate of primary production
The Marine Mammal Center (TMMC)
Easy accessibility of this data gives the public, scientists, and resources managers the ability to detect and communicate poten-
tial public and animal health risks and to prioritize management and conservation efforts.
Blue Point Conservation Society
The Blue Point Conservation Society bird tracking data can help inform policy and management decisions related to impacts of
large vessel traffic, oil spill risks and offshore wind energy farms.
O’Neil Sea Odyssey
The O’Neil Sea Odyssey provides hands-on lessons to 4th–6th grade students from schools throughout Central California about the
marine habitat and the importance of the relationship between the living sea and the environment.
Southern California Coastal Water Research Project Authority (public agency)
Ocean assessments are organized around three questions: Is it safe to swim? Is it safe to eat fish? Is the ecosystem protected? The bio-
logical data are used to quantify temporal trends, to assess whether any changes can be attributed to water quality, and to answer
the three questions above.
24 / ATN • MBON • OTN WorkshopYou can also read