GRAINS RESEARCH UPDATE - DRIVING PROFIT THROUGH RESEARCH BREEZA NEW SOUTH WALES - GRDC
←
→
Page content transcription
If your browser does not render page correctly, please read the page content below
BREEZA
                                   NEW SOUTH WALES
                                   FRIDAY 2ND MARCH, 2018

GRAINS RESEARCH
UPDATE
DRIVING PROFIT THROUGH RESEARCH

                     grdc.com.au
GRDC Welcome

Welcome to the 2018 GRDC Grains Research Updates
Ensuring growers, advisors and industry stakeholders are informed about the latest research and
development outcomes in their quest to improve on-farm profitability is a key role of the annual
Grains Research and Development Corporation (GRDC) Updates.
As an industry we face new challenges in terms of climate variability, technology and market
conditions, so it is important for all of us to have up-to-date knowledge to make informed decisions
and drive practice change.
Last season, New South Wales and Queensland grain growers experienced everything from
moisture stress, to heat stress, frosts and waterlogged paddocks. This highlights the importance
of robust and rigorous research to help underpin profitability across a range of climatic and
environmental conditions.
It also emphasises the value of GRDC investments into regional extension to equip growers and
advisors with the information and support they need to make key farm management decisions.
For 25 years, the GRDC has been driving grains research capability and capacity with the
understanding that the future of Australian grain growers’ hinges on relevant, rigorous, innovative
research that delivers genuine profitability gains.
Despite the challenges the grains industry remains confident about the future, willing to embrace
new concepts, and keen to learn more about innovations and technology that bring cost
efficiencies, promote sustainability and grow productivity.
The GRDC Updates deliver research direct to growers, agronomists and industry. This year the
Updates will offer information from the latest research and development from short- and medium-
term investments that address on-farm priority issues from farming systems, agronomy, soils,
weeds to pests and diseases.
So I hope you enjoy the Updates and that the events provide a valuable opportunity for learning,
knowledge sharing and networking. I encourage you to use these events to interact with GRDC
staff and GRDC Northern Panel members, who are committed and passionate about your success
and the future of the northern grains industry.

Jan Edwards
GRDC Senior Regional Manager North
Breeza GRDC
                                    Grains Research Update
                                                   nd
                                    Friday March 2 , 2018
                                         AGENDA
Time       Topic                                                           Speaker(s)
9:00 AM    Welcome
           Mining and farming - can they co-exist?
9:10 AM                                                                    Angus Duddy
                                                                           (Grower & Nuffield
                                                                           scholar)
9:40 AM    The P story thus far – how much, when, how and with             Mike Bell
           what expected benefit?                                          (QAAFI)

10:10 AM   What's new in grain storage? ProFume® fumigations,              Philip Burrill
           fumigating large silos and latest trials on grain protectants   (DAF Qld)

10:45 AM   Morning tea
           Tall sorghum types in irrigation yielding 15 t/ha & IT
11:15 AM                                                                   Trevor Philp
           sorghum. What's happening, when and with what                   (Pacific Seeds)
           agronomy?

           Sorghum and maize - avoiding yield loss to heat at grain
11:35 AM                                                                   Loretta Serafin
           fill through agronomy and changing the sowing window            (NSW DPI)

11:55 AM   Sunflower agronomy - manipulating the crop for the best         Loretta Serafin
           yield and oil content outcomes. Which leaves contribute         (NSW DPI)
           the most to yield and oil?
12:20 PM   Soil water, risk management and sowing decisions on the         Daniel Rodriguez
           Liverpool Plains. Using knowledge about soil water to           (QAAFI)
           make better decisions on crop type, variety, population,
           nutrition, sowing date and row spacing in sorghum
           Lunch
12:55 PM

1:45 PM    Chickpea: temperature and other factors affect                  Andrew Verrell
           flowering, pod set and yield                                    (NSW DPI)

2:10 PM    Chickpea water use efficiency                                   Kerry McKenzie
                                                                           (DAF Qld)
2:35 PM    Setting the farm up for broadband connectivity                  Nick Gillingham
                                                                           (Keytah)
3:05 PM    Close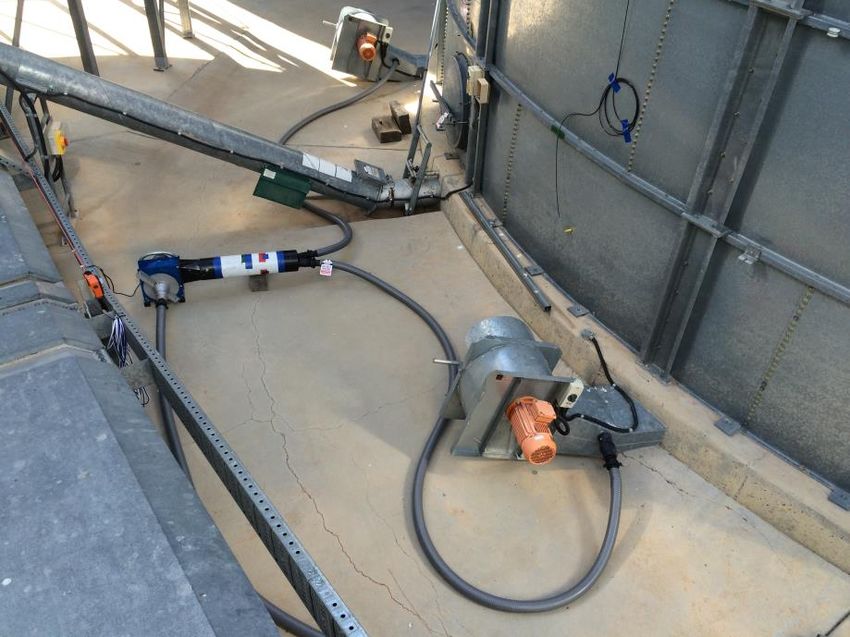
Contents

Assessing the viability of agriculture and energy’s co-existence model............................................................ 5
  Angus Duddy

The P story so far – an update on deep P research findings ............................................................................. 9
  Mike Bell, David Lester, Doug Sands, Rick Graham and Graeme Schwenke

What’s new in grain storage? – ProFume® fumigations, fumigating large silos and grain protectant update. 17
 Philip Burrill, Greg Daglish and Manoj Nayak, DAF Qld

Tall sorghum types in irrigation yielding 15 t/ha & IT sorghum. What's happening, when & with what
agronomy?..................................................................................................................................................... 28
  Trevor Philp, Pacific Seeds

Sorghum and maize – avoiding yield loss to heat at grain fill through agronomy and changing the sowing
window.......................................................................................................................................................... 29
  Loretta Serafin, Mark Hellyer, Annie Warren and Andrew Bishop, NSW DPI

Sunflower agronomy – manipulating the crop for best yield and oil content outcomes. Which leaves
contribute the most to yield and oil? ............................................................................................................. 37
  Loretta Serafin, Mark Hellyer and Neroli Graham, NSW DPI

Soil water, risk management and sowing decisions in the Liverpool Plains .................................................... 43
  Daniel Rodriguez and Peter de Voil, UQ/QAAFI

The impact of wheat residue on air temperature in the canopy and phenology of chickpea in 2017 ............. 52
  Andrew Verrell, Kathi Hertel, Brooke McAlister and Matthew Grinter

Preliminary data on phenology of Australian chickpea cultivars in the northern grain belt and prebreeding
for heat avoidance traits................................................................................................................................ 60
   Angela L. Pattison, Helen Bramle and Richard Trethowan, University of Sydney

Chickpea agronomy and water use with neutron moisture meters................................................................ 68
  Kerry McKenzie, RCN Rachaputi, Doug Sands

Connecting to our farming future .................................................................................................................. 73
  David Lamb, University of New England

Setting the farm up for broadband connectivity ............................................................................................ 76
  Nick Gillingham, Keytah
Compiled by Independent Consultants Australia Network (ICAN) Pty Ltd.
                                                      PO Box 718, Hornsby NSW 1630
                            Ph: (02) 9482 4930, Fx: (02) 9482 4931, E-mail: northernupdates@icanrural.com.au
                           Follow us on twitter @GRDCNorth or Facebook: http://www.facebook.com/icanrural
DISCLAIMER
This publication has been prepared by the Grains Research and Development Corporation, on the basis of information available at the
time of publication without any independent verification. Neither the Corporation and its editors nor any contributor to this publication
represent that the contents of this publication are accurate or complete; nor do we accept any omissions in the contents, however they
may arise. Readers who act on the information in this publication do so at their risk. The Corporation and contributors may identify
products by proprietary or trade names to help readers identify any products of any manufacturer referred to. Other products may
perform as well or better than those specifically referred to.
CAUTION: RESEARCH ON UNREGISTERED PESTICIDE USE
Any research with unregistered pesticides or unregistered products reported in this document does not constitute a recommendation for
that particular use by the authors, the authors’ organisations or the management committee. All pesticide applications must be in accord
with the currently registered label for that particular pesticide, crop, pest, use pattern and region.

  Varieties displaying this symbol beside them are protected under the Plant Breeders Rights Act 1994
® Registered trademark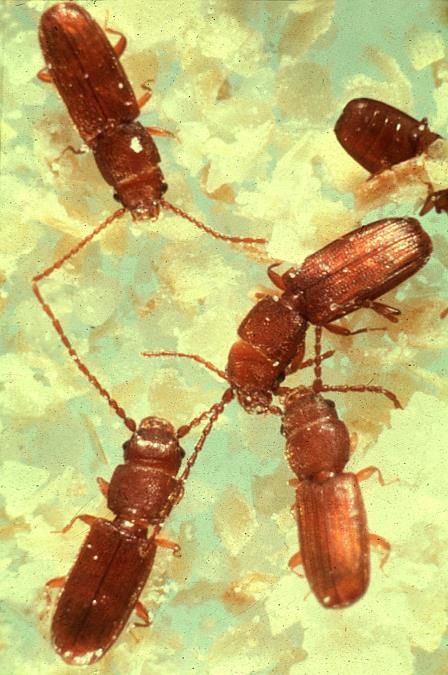
5
     Assessing the viability of agriculture and energy’s co-existence model

                                                                                                           Breeza GRDC Grains Research Update 2018
                                             Angus Duddy

Key words
agriculture, energy, co-existence model, mining

Call to action/take home messages
The study focused on key considerations and constraints in managing the impact of extractive
energy industries and agriculture co-existing in close environmental proximity to each other. The
challenge lies in managing the barriers to this co-existence including scientific, technological and
social obstacles. Lessons from the United States and Canada shed light on various ways to foster a
sustainable co-existence. These include; environmental bond legislation, extraction and reclamation
processes, and increased communication of the values and interests of different industries.
Ultimately, the goal is to initiate effective governance and adaptive management utilising a region-
specific management technique.

Introduction
There is often an uneasy co-existence of the energy and agricultural industries, particularly in highly
productive agricultural areas. The co-existence model is that resources and agricultural industries
can operate together while maintaining and even enhancing the condition of natural, social/cultural,
human and built assets in the region. This implies that all industries can be productive and profitable
without exceeding sustainable limits of physical infrastructure, social systems or the environment
(Collins, N. et al. 2013).
The challenge is to manage the various interests of different stakeholders and to overcome the
scientific, technological and social barriers to achieve a suitable co-existence model. Facing this
challenge is crucial as there is much at stake, including irreversible damage done to land and water.

Background
Prior to the recent scale back of the proposed coal mine in mid-2017, the Liverpool Plains region was
one of the concentrated areas within Australia where the co-existence between extractive industries
and agriculture was a topic of particular significance. This situation prompted this study.
Much of the argument for the development of the mines on the Liverpool Plains focused on the
potential to provide employment and financial security to the region. Proponents of the mines
argued that the mining industry and the local agricultural sector could continue to operate within
close proximity to each other. This validity of this assumption was questioned by much of the local
broadacre farming community who were concerned that the vast reserves of water held in
underground alluvial aquifers would be disrupted by mining activities. The farmers argued that this
water, a source for irrigation that sustains cropping activities and food production, provides the real
financial security of the region.
The Liverpool Plains is also well known for its extremely high-quality soils that are capable of storing
large amounts of plant available water, making the region a more reliable crop producing area than
most other parts of the cropping belt.
Initially, the proposed mining projects sought to create a symbiotic relationship between the
producer and the coal mining entities. As these projects moved through various levels of planning,
potential impacts on the local environment and water reserves became clearer. Furthermore, there
was evidence of a great lack of trust and confidence in government due process and in the
companies developing the resource.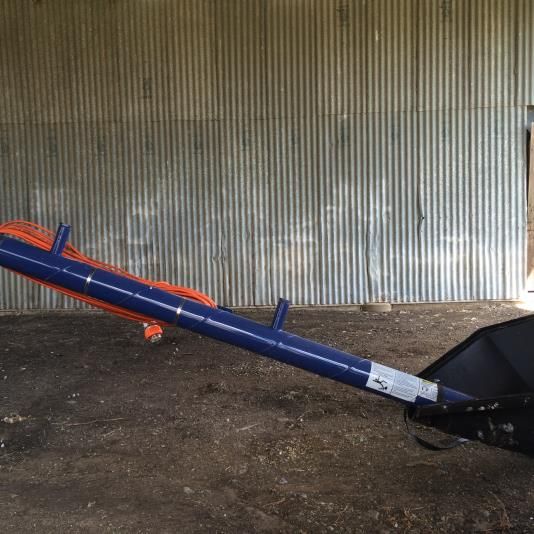
Objectives
                                          Consideration of how mining and agriculture co-exist in other parts of the world can help to shed
                                          light on the viability of an agriculture and energy co-existence model in Australia. This study has
                                          focused on the assessment of the key considerations and constraints in managing the impact of
                                          extractive energy industries and agriculture coexisting in close environmental proximity to each
                                          other.

                                          Lessons from the United States and Canada

                                          Government legislative framework in Wyoming, United States
                                          The state of Wyoming in the United States is heavily reliant on coal, oil and gas industries. Wyoming
                                          produces 39% of all of the coal mined in the U.S. The area was originally based on agriculture and is
                                          currently responsible for a large amount of high-value agricultural production including crops,
                                          livestock and poultry.
                                          The Powder River Basin Resource Council was developed to assist landholders who were directly
                                          affected by energy development in Wyoming. Wyoming and Texas are somewhat unique as some
                                          landholders held their mineral rights as part of their original homesteading tenure, and holders can
                                          negotiate with coal and oil companies for the right for surface access arrangements through state
                                          process. One issue is that through a loophole there is provision for gas companies to access land
                                          without landholder consent. As the Coal Bed Methane (CBM) industry developed, landholders felt
                                          they had lost their voice, and in some situations landholders were host to 200+ CBM wells of which
                                          they had no control over their development.
                                          Wyoming’s situation, although not isolated, is interesting, as the social values that are held by the
                                          landholders are derived from a long history associated with early homesteading. The landholder is
                                          nearly always multigenerational, with a strong intent to continue ranching into the future. Issues
                                          arise between the ranchers, the locals and the energy companies, with the ranchers becoming the
                                          target of public and mining company campaigns, that they are impeding the flow of mining royalties
                                          into the community. The contribution of coal to the state of Wyoming is in excess of US $1 billion per
                                          annum. Agriculture in Wyoming is in the situation that the support generated by the general
                                          population is proportional to its contribution to state revenue. This makes it hard for agriculture to
        6                                 compete against the energy industry.
                                          Government legislative framework does provide some regulation to this contentious relationship. In
                                          the U.S., the Surface Mining Control and Reclamation Act 1977 requires that coal mining areas be
Breeza GRDC Grains Research Update 2018

                                          restored to ‘a condition capable of supporting the uses which it was capable of supporting prior to
                                          any mining.’ This Act also requires mine operators to submit a mine reclamation plan prior to
                                          commencing extraction and also post a performance bond prior to development to ensure that
                                          funding will be available to complete this reclamation. The bond is not released to the mine operator
                                          until after the regulator has concluded that the reclamation is successful.

                                          Commercial oil production in Alberta, Canada
                                          ConocoPhillips Surmount II in Fort McMurray, Alberta is a commercial oil production site. The site
                                          has a total build value of over U.S. $10 billion and is designed to produce approximately 118,000
                                          barrels of oil per day over its 40-year production lifespan. Steam-Assisted Gravity Drainage (SAGD) is
                                          used to remove the oil from deep below the surface. SAGD is the most commonly used method to
                                          recover oil in the Athabasca Oil Sands region. Two horizontal wells are directionally drilled from a
                                          central well pad. Steam travels from a nearby plant to the wells where it heats the oil to a
                                          temperature at which it can flow by gravity into the producing well. The process of steam injection
                                          and oil production happens continuously and simultaneously. The resulting oil and condensed steam
                                          emulsion is piped from the producing well to the plant where it is separated and treated. 90% of the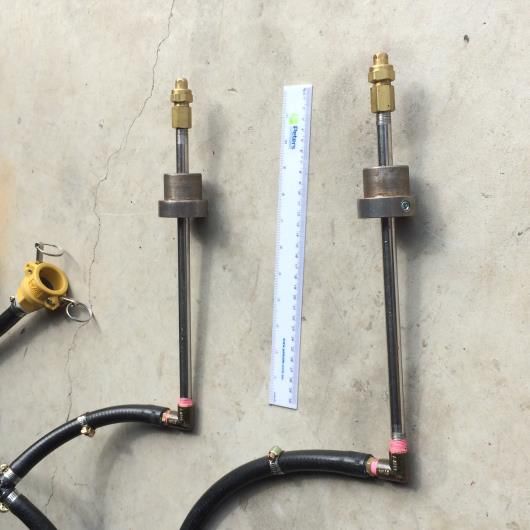
7
water is recycled. In a process which uses 2.5 barrels of water to produce one barrel of oil, a 90%

                                                                                                           Breeza GRDC Grains Research Update 2018
recycle rate is crucial to maintain environmental integrity.
ConocoPhillips has stated that it is totally committed to the complete reclamation of the nearly one
square mile of land that the project site resides on. However, there will be unavoidable impacts. The
Directorate General for Internal Polices Policy Department stated
“An unavoidable impact of shale gas and tight oil extraction is a high land occupation due to drilling
pads, parking and manoeuvring areas for trucks, equipment, gas processing and transporting
facilities as well as access roads. Major possible impacts are air emissions of pollutants, groundwater
contamination due to uncontrolled gas or fluid flows due to blowouts or spills, leaking fracturing fluid
and uncontrolled waste water discharge.”

The value of agriculture in Bluegrass County, Lexington, Kentucky, United States
In January 2013, the University of Kentucky was engaged to measure the influence of the agricultural
cluster on the Fayette County economy. The paper found that historical nature of measuring
agriculture in the county focused on production agriculture. However when the cluster was
expanded to include the agricultural inputs, food processing, transport, communications, wholesale,
retail and service industries, the real value was discovered. The findings were that one-in-nine jobs
were directly linked to agriculture (16,676 in total) and that the cluster generated US $2.4 billion in
output annually with a further $1.32 billion in additional income, profit and dividends.
The value of the industry is reflected in the Purchase of Development Rights Program. The program
helps conserve the precious Bluegrass landscape by purchasing conservation easements on 50,000
acres in the Rural Service Area to secure a critical mass of protected farmland for general agriculture,
equine and tourism industries. Essentially, a permanent agricultural land easement is created over
the associated lands on a voluntary basis, whereby the landholder forgoes their right for
development and leaves the land in agriculture for perpetuity.

Extraction and regeneration in Indiana, United States
The state of Indiana prides itself on the process of extraction and sustainable regeneration. Before
mining begins, operators must plan for the replacement of topsoil after the coal has been removed.
Details about the removal, storage, replacement and protection of the topsoil from wind and water
erosion are listed in the mine operation plan. A ‘Citizens Guide to Coal Mining and Reclamation in
Indiana’ states that topsoil is removed in a separate layer from areas to be mined and immediately
replaced or stored at approved locations. Careful handling of the topsoil and subsoil is crucial for
reclamation because this is the medium on which the success or failure of plant growth on the
reclaimed site is determined.
Anson Family Farms in Indiana produces corn, soybean, storage, turkeys and cover cropping.
Multiple acres of their farming land have been reclaimed from pillar and block and open cast mining.
The results of the reclamation were outstanding.

Recommendations
The study focused on key considerations and constraints in managing the impact of extractive
energy industries and agriculture co-existing in close environmental proximity to each other. It is
clear that there must be an understanding of the true value of the agricultural and energy resources,
as well as consideration of the societal effects.
The values that farmers hold with regards to the impact of the landscape as it changes during the
mine development are not well communicated by the landholders to extraction companies. Better
compensatory processes could be established in Australia if there was a better understanding
between landholders and miners of their perceptions of land value. Examples from overseas have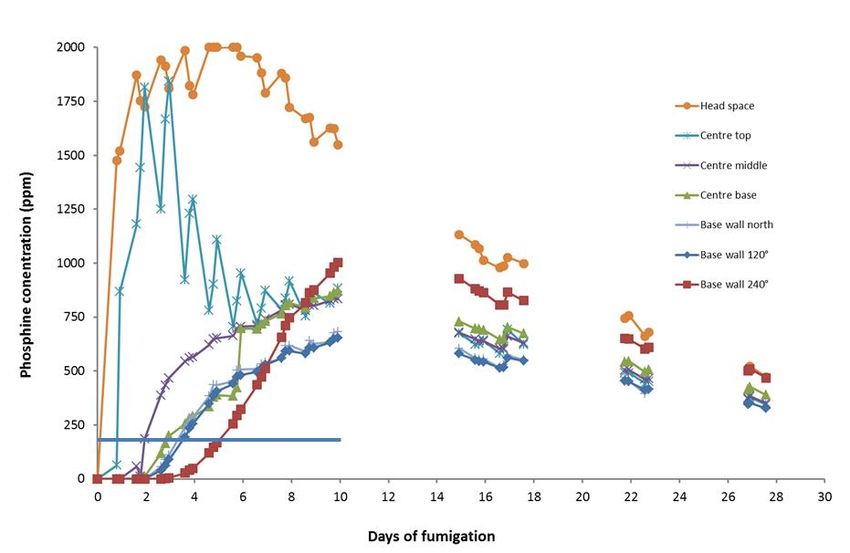
shown that community consultations and transparency in the development of projects have led to
                                          positive outcomes for all involved.
                                          Co-existence of these industries also requires a legislative framework that accounts for the
                                          environmental, economic, social and cultural values. The overarching governmental framework
                                          differs in Australia to other parts of the world. One example of this is the environmental bond policy
                                          which puts necessary economic deterrents in place for mineral and petroleum companies to
                                          instigate best practice.
                                          Environmental bonding is critical to produce positive outcomes with regards to sustainable energy
                                          extraction. It is crucial that the implications of environmental default are such that the financial
                                          viability of the operation would be jeopardised by a company’s incompetence. In conjunction,
                                          negative measurable impacts to ground and surface water sources should negate any development
                                          proposal no matter its size or economic value.

                                          Conclusion
                                          It is unchallenged that agriculture and energy industries are closely interconnected, and the choices
                                          and actions made in one domain greatly affect the other. The challenge lies in managing the barriers
                                          to this co-existence, including scientific, technological and social obstacles. Ultimately, the goal is to
                                          initiate effective governance and adaptive management utilising a region-specific management
                                          technique.
                                          The issue that underpinned all sites visited was that the sustainability of water resources is always
                                          compromised if energy extraction of any sort is undertaken close to water resources, either
                                          underground or on the surface.

                                          Acknowledgements
                                          Thank you to Nuffield Australia, the Grains Research and Development Corporation (GRDC), my
                                          family, our staff and my forever understanding wife, all Nuffield associates, co-operators and
                                          associated people and Brazil Global focus program group 2016.

                                          Contact details

        8                                 Angus Duddy
                                          929 Rossmar Park Road, Quirindi, NSW
                                          Mb: 0400 369 723
                                          Email: angusduddy@bigpond.com
Breeza GRDC Grains Research Update 2018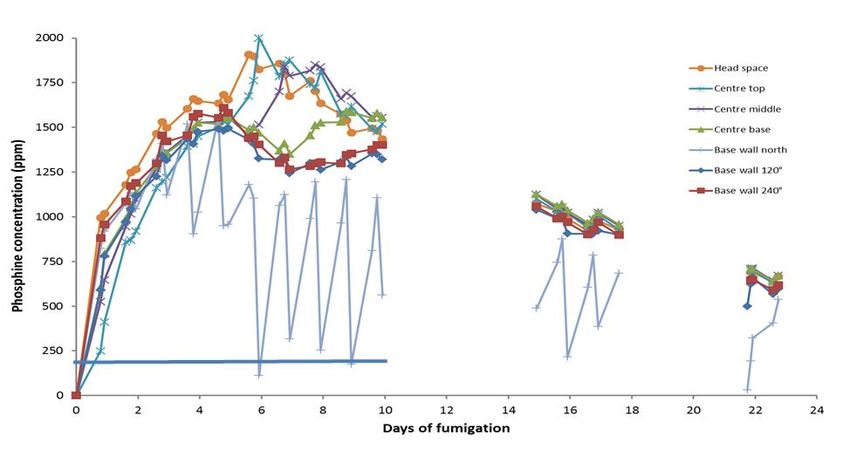
9
The P story so far – an update on deep P research findings
Breeza GRDC Grains Research Update 2018
Mike Bell1, David Lester2, Doug Sands2, Rick Graham3 and Graeme Schwenke3
1
University of Queensland
2
DAF Queensland
3
NSW DPI
Key words
phosphorus, starter P, deep P, residual value, placement strategies
GRDC codes
UQ00063, UQ00078
Call to action/take home messages
Depletion of subsoil phosphorus (P) reserves and uncertainty over the benefits of starter P use led to
a detailed examination of crop responses to P fertilisers in terms of rates, products and placement
over the last 5-6 years. Trials have been conducted at 35 locations from central NSW to CQld. While
large crop responses have been recorded at many locations, the impact of seasonal moisture
availability (on yield potential and root activity), P placement (starter v deep P, band spacing,
amount of soil disturbance), P rate, time of application and product choice will all impact on
responsiveness. Residual availability of deep P has generally been excellent, although crop response
may be limited by shortages of other nutrients (e.g. N). Data continues to be incorporated into the
Deep P calculator to provide an indication of the economic returns from P investment. To access the
Deep-P Calculator: http://www.armonline.com.au/deepp/
The trial program
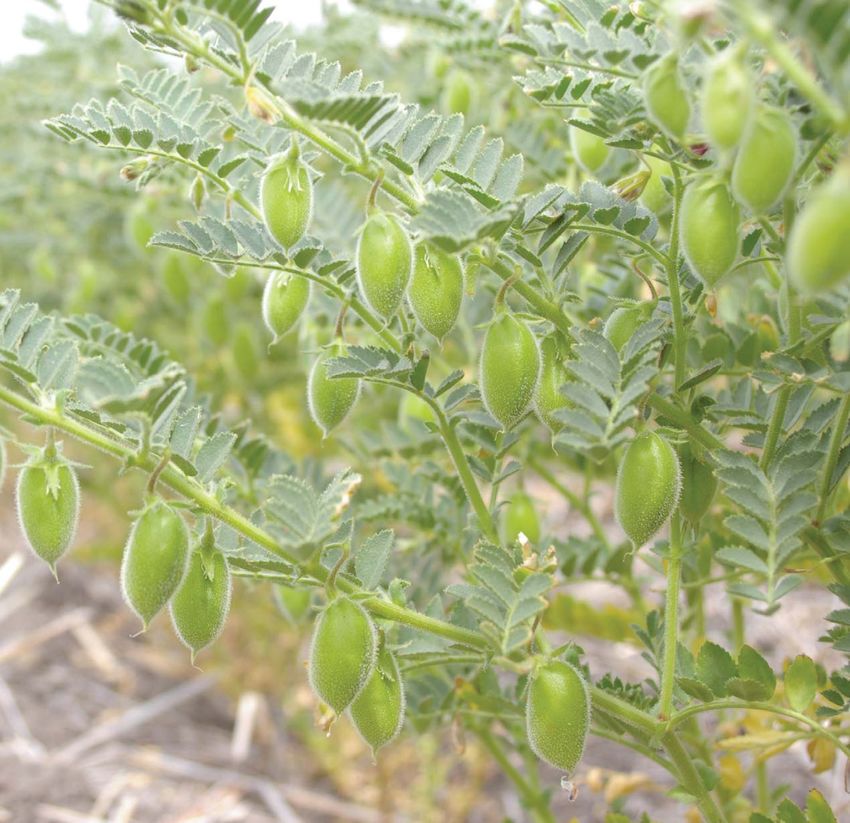
There has been a staggered establishment of sites across the region since mid 2012, with a total of
30 experiments in UQ00063 by the 2016 winter crop season at locations indicated in Fig. 1. These
trials consisted of rates of phosphorus (P) fertiliser (0 to 40 or 60 kg P/ha) applied in deep bands (at
~20cm depth), typically at band spacings of 50cm, along with an untilled Farmer Reference
treatment. All main plots were then split to annual ‘with’ or ‘without’ starter P fertiliser applications
at planting at rates ranging from 6 to 10 kg P/ha. Crop choice at each site was dependant on the crop
in the surrounding paddock (e.g. crop mix in the establishment years are shown in Table 1), and the
residual benefit of the different rates of applied P was tracked through subsequent growing seasons.
After the 2017 winter crop harvest, some sites have produced 4 or 5 crops, while some of the newer
sites were only in the first or second crop after the initial P application. An extension to UQ00063
will allow the residual value of these later sites in particular to be extended to at least 4 crop
seasons, weather permitting, while some of the earlier sites will be in their 5th to 7th crop after P
application.
At each site, efforts were made to initially address other potential nutrient limitations, identified by
soil testing, by applying a basal application of N, K, S and/or Zn as appropriate. Additional N
applications were needed to balance different N additions when the P rates were applied as MAP,
but also in response to a likely increase in crop yield potential after overcoming the P constraints.
Whilst this initial ‘top up’ ensured crop responses to applied P should be expressed, problems
emerged in later years at some responsive sites, as the higher yield potentials in the plots where P
deficiency had been overcome did not have enough N to deliver the higher yield potentials (i.e. P
responses were constrained by lack of N). While mainly relevant to grain crops and not pulses such
as chickpeas or mungbeans, this problem was often not evident until late in a growing season, or
only from observations of sub-optimal grain protein content. That meant that remedial action couldonly be taken for the next crop in the cycle, and assessment of the residual P benefit may have been
compromised in some crop seasons. An example of this is provided later in this paper.
Figure 1.
Location of the 30 P trials established from 2012-2017 under UQ00063.
The soil P tests for the 30 P trial sites in UQ00063 are shown in Table 1. Both Colwell and BSES P
were higher in the 0-10cm layer than the 10-30cm layer, and BSES P was always at higher
concentrations than Colwell P. Based on wheat critical soil test values for starter P responses, the
median values would suggest a significant proportion of sites should have been P responsive.
Similarly, we had hypothesized deep P responsive sites would have < 10 mg/kg Colwell P and11
An additional series of trials have been established since 2015 in core sites at Jandowae, Lundavra,
Breeza GRDC Grains Research Update 2018
Terry Hie Hie and Bellata under UQ00078, with these trials looking at placement strategies
(rate*band spacing interactions, liquid v granular fertilisers, form of applied P, degree of soil
disturbance/mixing, effect of co-location of different nutrients). Crop choice was again dependent
on the host farm crop rotation.
Responses to starter P
Starter fertiliser applications were made at sowing – either by the trial operators with small plot
equipment, or by the growers who turned starter fertiliser on and off in planned strip-plot designs.
Unfortunately in the latter, starter was not always turned on and off as planned, so there was some
loss of starter P contrasts at some trials. Overall, prior to the 2017 winter season (still being
processed) there have been 42 site-years with starter P contrasts, split between wheat/barley (17),
chickpeas (13) and sorghum (12), with crop responses assessed in relation to the initial pre-trial
Colwell P concentration in the 0-10cm layer. To cope with differing yields between sites and seasons,
responses were assessed on the basis of relative yield (Yield no starter/Yield with starter), with
valuesThere is a relationship that can be developed for the winter cereal crops, although it is poorly
defined due to the limited number of sites with very low Colwell P in the 0-10cm. That said, there
seemed to be no real evidence of responses to starter P for Colwell P > 15-17 mg/kg – a value
somewhat lower than the 20-23 mg/kg suggested from the recent national database analysis (R. Bell
et al. 2013). More data is needed to better define this relationship.
Despite some quite significant responses to starter P in chickpea (up to 20% yield increases), there is
no clear relationship to Colwell P in the 0-10cm layer – possibly because the variable sowing depths
between sites and seasons may mean the 0-10cm layer is not always relevant to the developing crop
(i.e. it may have been planted below 10 cm!). The data for sorghum shows almost no response to
starter P at all, even when Colwell P in the top 10cm layer is very low. The one site where a
significant response was recorded was south of Emerald in 2015.
We had intended to undertake separate analyses to look at starter P responses in the presence or
absence of moderate-high rates of deep P, to gain some understanding as to whether ameliorating
low subsoil P could eliminate the need for starter P – an effective diversion of the current P inputs in
the cropping system from smaller annual starter P applications to occasional larger deep P
applications. However, given the limited responses to starter P across all crops this has so far been
inconclusive.
Responses to deep P
Deep P applications were made using either mono-calcium phosphate (TSP), or more commonly
mono ammonium phosphate (MAP) with equilibration of the N inputs for the different rates using
urea. The responses to deep P (Figure 3) have been assessed relative to the nil P treatments that
received tillage and background nutrient inputs, so any yield increases are directly attributable to P
addition only. Comparisons between the deep P treatments and the ‘As is – Farmer Reference’
condition were also made, with the relative performance of the deep P treatments generally greater
than when benchmarked against the nil P, but responses in these instances could be due to soil
disturbance, other background nutrients or the deep P input. There were 19 winter cereal and 19
chickpea site years of data, and 17 for sorghum, prior to the 2017 winter season.
As indicated in Figure 3 below, all crops responded to deep P when subsoil P (in the 10-30cm layer)
was low. There are a range of responses to deep P for any given soil P concentration, which were
12 due to a combination of other yield constraints (e.g. a lack of water!) or an ability to access P from
relatively enriched topsoil layers (i.e. wet years). As an example, ignoring the red point which
represented a trial with low N, failing to apply deep P resulted in yield penalties of 10-25% for a
Breeza GRDC Grains Research Update 2018
Colwell P of 2 mg/kg. It is difficult to make more definitive conclusions from the data at this stage
(e.g. which species is the most responsive to deep P applications?), because the crops were grown
on different sites, in different seasons with differing access to topsoil P, and with different deep P
sources in some cases. For example, for sites where subsoil Colwell P was13
Breeza GRDC Grains Research Update 2018
Figure 3. Response to deep P application in winter cereals, chickpea and sorghum crops grown in the
UQ00063 trials. Points indicate the relative yield of the plots with starter fertiliser but no deep P,
compared to those where starter P and deep P was applied, and represent both fresh and residual P
responses. Points in the upper LHS of the curve (red and green squares) are where deep P was
applied too close to the planting date, or where the site was N limited.
If we used the lower (more responsive) boundary of the trial data combined for all crop types
(dashed line in Fig. 3) as an indicator of the potential crop responses to deep P in favourable
seasons, this analysis would suggest that 90% of maximum yield potential (the value normally used
to define a critical soil test concentration) will be achieved when Colwell P in the 10-30cm layer is
~10 mg P/kg. This agrees quite well with the original predictions at the beginning of this project in
2012.
Optimum application rates and residual value of applied P
To explore these effects we use case studies from 2 sites – one at Dysart (deep applied in Aug 2013,
crop 4 harvested in 2017 winter) and the other at Wondalli (deep P applied in May 2013 and crop 4
harvested in 2017). Both sites were responsive to deep P, and responses are still evident in the 4th
crop after application.
It is difficult to tell whether the P response is diminishing over time, or whether the rate required to
reach P-unlimited yields is changing, due to other variables like seasonal conditions and N
availability. In the first 3 crop years of sorghum, 20 kg P/ha was enough to reach maximum yields,
but the P response was increasing all the way to the top rate (40 kg P/ha) in the chickpea crop in
season 4. While this would suggest that the residual benefits of the lower P rates were diminishing
by the 4th crop, this ignores the fact that yields of sorghum (crop 3, and to a lesser extent 2) were
constrained by N availability, so the full potential P response may not have been able to be
expressed. When a legume crop (chickpea) was grown in season 4, low N was less likely to be
limiting crop performance, and the P response was very strong (and very profitable!). Further site-
years with higher N inputs will help explore this response. However, to date the combination of
tillage and deep P has produced an additional 700 kg/ha of sorghum in crop 1, 550 kg/ha of sorghum
in crop 2, 450 kg/ha sorghum in year 3 and >850 kg/ha of chickpeas in year 4.Figure 4. Grain yields at deep P sites at Dysart and Wondalli for the first 4 crop seasons after deep P
application in 2013. Deep P was applied as MAP at rates ranging from 0 to 40 (Dysart) or 60
(Wondalli) kg P/ha, and each site had an unripped Farmer Reference (local practice) treatment as a
benchmark.
There was no evidence of N limitations at Wondalli, although this site did lose its chickpea crop in
season 3 due to the wet conditions in 2016. At this site, yields increased with increasing P rate up to
60 kg P/ha in the initial sorghum and subsequent wheat crops. However, while there were significant
P responses in the 2017 wheat crop, there was no yield increase to rates >20 kg P/ha. The very dry
seasonal conditions and water-limited yields in this season may have limited any response to higher
P rates, so again, further site-years are needed to determine how long the residual effects last. To
date, the combination of tillage and deep P has produced an additional 880 kg/ha of sorghum in crop
1, 650 kg/ha of wheat in crop 2 and 400 kg/ha of wheat in year 4.
When do I re-apply?
As more growers and advisors start deploying deep P strategies in their fields, this question is asked
more frequently. Unfortunately there are no easy answers, other than the use of test strips with
accurate yield monitoring. The amount of time and effort to effectively sample the subsoil layer to
account for residual fertiliser bands, and assess the P bioavailability, would suggest soil sampling will
not be the answer. Even a budgeting approach will not provide reasonable estimates. This is
because, experimentally, we are unable to identify whether additional P uptake or removal by the
14 crop accurately reflects fertiliser P recovery, as most crops are capable of proliferating roots in a P
band and so can preferentially take P from the band while sparing P from the surrounding soil. We
do not have any tracers that we can put into a P band to indicate fertiliser P recovery over a series of
Breeza GRDC Grains Research Update 2018
crop seasons, although Phil Moody and the group at DSITI are evaluating some options in the lab at
present.
We are currently in year 1 of a 3 year extension to UQ00063 where we will continue to monitor a
number of the more recently established sites as well as some of the longer term ones, and that may
provide better estimates of the likely length of residual P benefits.
Products, placement strategies, timing
This remains an area of active research in both Qld and NSW under the co-funded UQ00078 GRDC
project. Research has so far showed that
There seems to be no advantage to be gained by using liquid v granular forms of MAP, as has
been reported on the calcareous soils of the Eyre Peninsula in South Australia, and recent results
from the NSWDPI site near Bellata have suggested the liquid MAP was actually inferior to the
granular product.
Studies have not been able to demonstrate an interaction between P rate and P band spacing
(i.e. in band concentration), so the important thing is to get enough P into the subsoil layers in a15
way that is practical but maximizes the chances of crop P recovery. Current recommendations
Breeza GRDC Grains Research Update 2018
for band spacings of 40-50cm therefore remain valid.
To date, there has been no evidence of benefits of co-locating P and Zn in deep P bands, as there
were suggestions that improved P uptake may limit Zn acquisition – possibly through a less
extensive mycorrhizal network. However these effects have only been observed in sorghum
crops in UQ00063, and as yet the specific P-Zn trial sites have not hosted a sorghum crop.
The question of type of P fertiliser (MAP or TSP in particular) is currently the subject of trials
sown in 2017 winter in NSW and in 2017/18 summer in Qld, and will also form a component of
research conducted by a new postdoctoral appointment at UQ commencing in early 2018.
Trials have also shown that there are no obvious negative impacts of combining MAP and KCl in
deep bands in sites where both P and K are limiting, and that in this case, the root proliferation
associated with the P band will encourage root activity and K uptake. Again, further work on the
interaction between these products at different in-band concentrations and in different soil
types will be undertaken by the UQ postdoctoral appointment from early 2018.
Finally, trials are in the process of being established in Qld to explore the impact of amount of
soil disturbance/mixing and the volume of soil enriched with P and K fertilisers on crop nutrient
uptake. This will involve comparing discs, tynes and strip tilling units for their efficacy in making
P available to the crop, and help to provide better guidance on the type of fertiliser rig required.
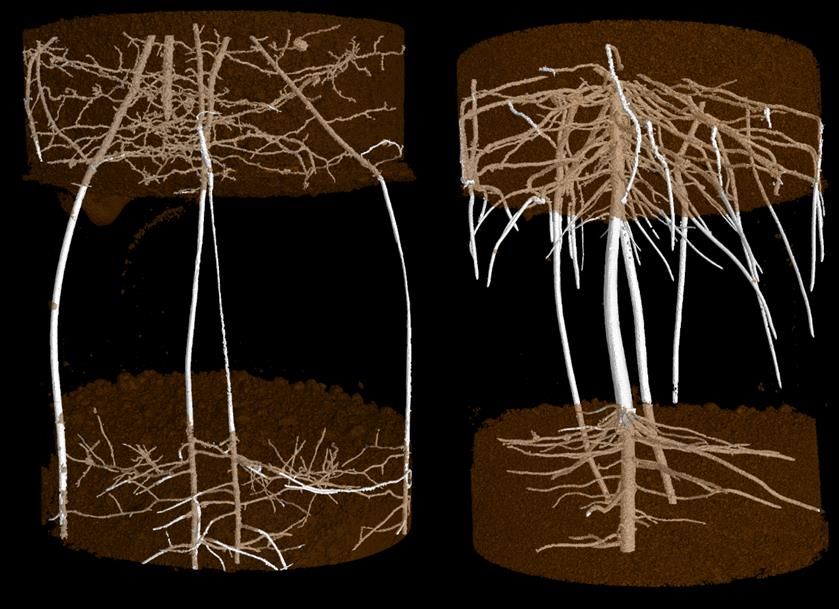
A particularly interesting observation from this authors recent study tour to Europe and the UK
has been the impact of voids/large pores on root branching and proliferation. This is illustrated
in X-ray CT images produced in the University of Nottingham for maize and wheat (Fig. 5). Their
results suggest that if the deep placement operation leaves large voids around the fertiliser
bands and/or there is insufficient time and rain to allow profile reconsolidation, the chances of
achieving the vigorous root proliferation needed to get good fertiliser uptake may not occur.
Conclusions
Research to better understand the effects of low subsoil P, agronomic strategies to overcome these
limitations and the implications for fertiliser P management across northern cropping systems has
come a long way. Rudimentary but functional diagnostic indicators of when to use starter and deep
P fertilisers are becoming available, guidelines for effective application methods to address P
limitations are developing, and economic assessments of the profitability of deep banding in a
cropping system are showing strong returns in low P fields. Factors that limit deep P response
include the availability of other nutrients (particularly N) and a lack of plant available water, both of
which can restrict the achievement of higher yield potentials. The quantum of deep P response is
also affected by seasonal conditions that impact on root activity in different parts of the soil profile,
so obtaining benefits under some seasonal conditions will remain somewhat problematic. This risk is
countered by the excellent residual value of deep P that is being documented in field trials, allowing
the benefits of applications to occur across a rotational sequence rather than solely in the year of
application.Figure 5. Impact of soil voids/air gaps on localized root branching in maize (left) and wheat (right).
Image supplied by Prof Malcolm Bennett, University of Nottingham, and is reproduced from Morris
et al (2017) Shaping Root Architecture. Current Biology, 27, R919–R930.
Acknowledgements
The extensive field research program undertaken as part of these projects is made possible by the
significant contributions of growers through both trial cooperation and the support of the GRDC, the
author would like to thank them for their continued support. The authors also gratefully
acknowledge the efforts of the many QDAF and NSW DPI technical staff involved in conducting these
16 research trials.
References
Breeza GRDC Grains Research Update 2018
Bell, R., Reuter, D., Scott, B., Sparrow, L., Strong, W., Chen, W., (2013), Soil phosphorus-crop
response calibration relationships and criteria for winter cereal crops grown in Australia, Crop and
Pasture Science: an international journal for crop and pasture science, 64, 5, pages 480 - 498.
Contact details
Prof Mike Bell
University of Queensland
Building 8117A, Gatton Campus, 4343
Ph: 07 5460 1140
Email: m.bell4@uq.edu.au17
What’s new in grain storage? – ProFume® fumigations, fumigating large silos
Breeza GRDC Grains Research Update 2018
and grain protectant update
Philip Burrill, Greg Daglish and Manoj Nayak, DAF Qld
Key words
grain fumigation, ProFume®, sulfuryl fluoride, storage pest control, large silo fumigation, fumigation
recirculation, grain protectant insecticides
GRDC codes
PRB00001, PBCRC3036, PBCRC3150
Call to action/take home messages
ProFume® (sulfuryl fluoride gas) applied by licenced fumigators to control storage pests in cereal
grains, is valuable when rotated with phosphine fumigations to manage insect pest resistance.
ProFume trials show that longer fumigation times of 7-10 days are required to control the full
life cycle of storage pest insects when grain temperatures are below 25°C.
In larger silos (150 – 2000 t) recirculating fumigation gases within the sealed silo using a small
fan, helps ensures rapid, uniform distribution of phosphine, or ProFume (sulfuryl fluoride gas).
Without recirculation during fumigation, it can take 2-5 days before the fumigant gas reaches all
areas in a large silo, resulting in significant volumes of grain and insect pests being exposed to
low amounts of gas.
Seek good advice prior to applying any grain protectant treatment. Set up grain protectant spray
application equipment to achieve good coverage and the correct dose rate.
Key storage management tools
Fumigations and strategic use of grain protectant insecticides are only two of the five key tools used
to maintain grain quality and achieve reliable pest control results. Combined, they form the
foundation of successful grain storage. Successful grain storage is crucial to a producer building a
reputation as a reliable supplier of quality grain. Key aspects of successful grain storage are:
1. Aeration: correctly designed and managed, it provides cool grain temperatures and uniform
grain moisture conditions. Aeration reduces problems with moulds and insect pests in
storage, plus maintains grain quality attributes such as germination, pulse seed colour, oil
quality and flour quality.
2. Hygiene: a good standard of storage facility hygiene is crucial in keeping background pest
numbers to a minimum and reducing the risk of grain contamination.
3. Monitoring: monthly checking of grain in storage for insect pests (sieving / trapping) as well
as checking grain quality and temperature. Keep a monthly storage record to record these
details, including any grain treatments applied.
4. Fumigation: in Australia we now only have gases (fumigation) to deal with insect pest
infestations in stored grain. To achieve effective fumigations the storage/silo must be
sealable – gas-tight (AS2628) to hold the gas concentration for the required time.
5. Grain protectants: used on specific parcels of grain like planting seed held on farm, or bulk
grain where potential grain buyers have agreed to its use, grain protectant sprays provide
another line of defence against storage pests.ProFume use in Australia
ProFume (sulfuryl fluoride gas) has only been available for use in Australia for a relatively short time
(10 years). Phosphine fumigation products have been used to control grain pests for well over 50
years.
Initially registered and sold in Australia by Dow AgroSciences™, ProFume is now manufactured and
supplied by Douglas Products™ based in America. A-Gas Rural® based in South Australia has the
importing and distribution rights for ProFume. They also provide specialist product and safety
training to licenced fumigators, allowing them to purchase and undertake ProFume fumigations.
One of the main drivers for use of ProFume is the continued development of phosphine resistance in
storage pests over the past 30 plus years in Australia. Thankfully, for most grain producers, the
current levels of phosphine resistance for most storage pest species still allows for complete control
when fumigating in correctly sealed, gas-tight silos and when used as specified on the product label.
About 10 years ago one of the flat grain beetle species, known as the rusty grain beetle (Cryptolestes
ferrugineus) developed a very high level of phosphine resistance at a number of eastern Australian
sites. To control infestations of strongly resistant rusty grain beetles, most bulk handlers and a
number of farm storage sites have been able to utilise ProFume.
18
Breeza GRDC Grains Research Update 2018
Figure 1. Flat grain beetles, Cryptolestes spp.
When should I consider using ProFume?
Phosphine fumigation failure. If live flat grain beetles (Cryptolestes spp) are found in grain
after a well mananaged fumigation, consider using a ProFume fumigation.
Fumigation resistance management. As for most Ag chemical use, aim for a rotation of
products and active ingrediants to combat pests. If phosphine fumigations are often used for
pest control at your grain storage facilities, consider a plan to use ProFume® every third year
in rotation with phosphine.19
Breeza GRDC Grains Research Update 2018
Figure 2. ProFume
Key features of ProFume
ProFume active ingredient is 998 g/kg sulfuryl fluoride. Each gas cylinder holds 56.7 kg.
Only licenced fumigators with ProFume training can purchase and apply ProFume.
Registered for use on cereal grains, NOT pulses or oilseeds.
Requires a gas-tight (sealable silo) storage to hold the specified gas concentrations for the
required time.
Bulk grain treatment costs range from approx. $2-4/t excluding GST, depending on tonnage and
travel.
The ‘eggs’ of storage pests are usually the hardest life cycle stage to kill with ProFume. Longer
fumigation times are required.
Cooler grain temperatures below 25°C, typical for aerated grain, also require longer fumigation
times.
Fumigation time and grain temperature have the largest impact on successful pest control
results with ProFume(see Figure 3).Figure 3. ProFume gas concentrations and time required at 25 and 30°C for complete control of the
rust-red flour beetle (TC), rusty grain beetle (CF), lesser grain borer (RD) and rice weevil (SO)
(Red dotted line is the 1500 CT limit for grain application)
Achieving reliable results and practical steps for ProFume fumigation
Use only in gas-tight silos and storages. Pressure test silo, repair any leakage points.
Avoid last minute, rushed ‘short’ fumigations. Longer fumigation times in a well-sealed storage
provide effective pest control to all life cycle stages including the egg stage.
Grain at temperatures below 25°C, fumigation times of 7-10 days would be recommended for
effective pest control (see Figure 3).
ProFume (sulfuryl fluoride) is a ‘heavy’ gas. Its’ vapour density = 3.7 (air = 1). ProFume gas is
typically applied into the top headspace of a silo. Discuss placement of a sealable fitting at the
20 top of your silo with your licenced fumigator in preparation for fumigation.
Recent field trials suggest that due to ProFume vapour density, there may be significant benefits
Breeza GRDC Grains Research Update 2018
to using recirculation during fumigation. This can reduce the tendency for this ‘heavy gas’ to fall
and sit at much higher concentrations at the bottom of the silo or storage, leaving insects at the
top exposed to much lower concentrations during fumigation.
Follow all safety requirements as outlined by the licenced fumigator, including leaving
fumigation warning signs and safety tape barriers in place. Aeration fans if fitted on storages
simplify the venting requirements following fumigation. After venting and prior to grain
movement, fumigators will test gas safety levels and ‘clear’ the grain. Keep copies of fumigation
documentation.
Fumigation of larger silos (150 - 2000 t or greater)
The first step – ensure “gas-tight storage”
To control live insect pests in grain the only registered products in Australia are now a range of
gases. Most often various phosphine fumigation products, and sometimes sulfuryl fluoride gas
(ProFume). The controlled atmosphere method is also effective, using either carbon dioxide or
nitrogen gas, but is mostly used for pest control in organic grains.21
For any fumigation to be effective at controlling storage pests, the insects need to be exposed to a
Breeza GRDC Grains Research Update 2018
given gas concentration “C“, for a specified length of time “T”. If this “C x T” exposure requirement
is not met during the fumigation, it is common to see survival of various insect life cycle stages. With
these fumigation failures, live insect pests quickly appear in the grain within days or weeks.
This is why it is critical for Australian grain producers who store grain for more than a month, to have
at least two or more sealable, gas-tight storages that meet the Australian silo sealing standard
(AS2628).
A storage that is not gas-tight does not allow the fumigation “C x T” exposure level to be reached in
all parts of a silo, large or small. Achieving reliable pest control results is not possible with gas
leakage and air dilution. As well as not killing the pests, selection and development of resistant
insect populations is the additional negative outcome of poor fumigation attempts.
To achieve effective fumigations, silos must be pressure tested to check they are sealed – gas-tight.
This ensures they hold high gas concentrations for the required time to kill pests.
Checking a large silo is ready for fumigation – useful equipment for pressure testing
Portable leaf blower, or small aeration fan, used to add air to silo for pressure tests. High
volume, low pressure air is required. Standard air compressors are generally not suited to this
task.
50 mm poly fitting, including a 50 mm shut-off value, fitted into external section of silo aeration
ducting. Using this port to blow air into silo.
Plastic tube manometer, or better, a digital manometer (e.g. Extech HD 755 Differential pressure
manometer 0 – 0.5 psi). Aiming to measure within the range of 0-4 inches water gauge (w.g.) (0-
1000 Pa).
Spray bottle containing water & detergent, to check for leaks. Often you can hear or feel air
leaks from large silos during the pressure test.
Pressure test – methods
New silos should be pressure tested by the silo supplier or manufacturer when completed on site.
They should pass the Australian standard test (AS2628) to show they are sealable to a standard to
allow for effective fumigations.
Sealable silos should then be pressure tested at least once a year to check for suitability for
fumigations. Ideally pressure test when a silo is full of grain. This places grain pressure on all silo
surfaces and outlets, which is the condition the silo is in when you are fumigating.
Pressure tests should not be conducted in the heat of the day, when the sun is heating the silo’s
external steel surfaces and warming / expanding the air inside the silo. The pressure test results
under these conditions are meaningless. Ideally test in the early morning before the silo is being
warmed. A windy day is also difficult, as silo surfaces are pushed around. Hook up the digital
manometer, or plastic tube manometer to the silo when the silo is fully sealed. This will quickly show
if pressures inside the silo are stable. If stable, a reliable pressure test can be conducted to test the
silo seal quality and for any leakage points.
For small silos the pressure tests can be carried out by using a short burst (5 – 15 seconds) from the
small aeration fan fitted to the silo. For larger silos a portable leaf blower to push air into the silo via
a fitted 50 mm port can be used to initially pressurise the silo for a test. The pressure decay (250-
125 Pa) can be checked using one of three options - the silo’s oil bath relief valves, a length of 20
mm clear plastic tube in a “U” shape with water in it (manometer), or a digital manometer
connected to the silo. See GRDC Fact Sheet: “Pressure testing sealable silos”.
http://storedgrain.com.au/pressure-testing/Common leakage points for large sealable silos
Silo roof vents not sealing – maintenance or design problems.
Silo grain fill point at top of silo not sealing – damaged rubber seals on lid, or sealing plate.
Grain outload auger at base of silo – leaking seal plate.
Bottom silo access manhole into silo - damaged seals, or poor design.
Sealing plate covers for the aeration fan’s intake, often poor design.
External aeration fan ducting, or the aeration fan itself not well sealed.
For all cone based silos, weight of grain in the silo can break the seal of the bottom outlet –
poor design.
Fumigation recirculation – why is it important for fumigation of larger silos > 150 t
During fumigation, phosphine gas is typically liberated over 5-6 days from tablets or blankets that
have been placed in the silo. This gas however only moves slowly, taking about 24 hours to travel 6m
through grain.
If you are fumigating a medium to large silo (150 – 2000 t) the gas may take 2-5 days to reach all
parts of the silo. In large silo fumigations this may result in some grain, at the furthest distance from
tablets, only getting 6 days of phosphine gas instead of the required 10 days or longer exposure
period. Six days is not enough time to kill all the life cycle stages of the pests.
One example of a typical phosphine fumigation required to kill all pests, is a minimum of 200 ppm
phosphine gas concentration for at least 10 days. See horizontal blue line in Figure 4 below.
22
Breeza GRDC Grains Research Update 2018
Figure 4. Phosphine gas concentrations at 7 points in a silo during fumigation of 1420 t of wheat.
Phosphine blankets were placed in the silo headspace with no recirculation. It took as long as 5 days
for all grain at the silo base to reached at least 200 ppm gas concentration.23
Breeza GRDC Grains Research Update 2018
Figure 5. Phosphine gas concentations in a silo (1420 t wheat) where a small fan was used to draw
gas from blankets in the silo headspace and pump it into the silo base via aeration ducts for the first
5 days of fumigation. Gas concentration in all areas of the silo reached over 800 ppm within the first
24 hrs.
Figure 6. A small fan (F370 – 0.37 kW) used during the first 5 days of fumigation to recirculate
phosphine to give rapid uniform gas distribution in 1423 t wheat. See Figure 5.
Options for fumigation recirculation
For all fumigation recirculation systems, the sealable silo needs to be gas – tight so there is
no gas leakage during the fumigation. In Figure 4, “Base wall north” shows the impact of a
leak at the silo manhole, causing large daily fluctuations in gas concentrations.
Phosphine blankets or tablets can be placed in the ‘silo headspace’ along with a small fan
connected to the headspace via 90 mm pipe plumbing coming down the silo wall from theroof. Phosphine gas is drawn from the headspace and pumped into the base of the silo via
both aeration ducts (see Figure 5).
For ground level application of tablets or blankets, a sealable ‘phosphine box’ can be
plumbed into this system, either a moveable box, or mounted permanently on each silo.
Using a fan to force the phosphine gas movement around in silos during fumigation is
generally recommended, rather than relying on a passive ‘thermosiphon’ approach. For
medium and large silo fumigations, 150 t or greater, or silos storing smaller grain sizes (e.g.
millets, canola, lentils etc.) that reduces air movement, fan force recirculation rather than
thermosiphon is advised. Fan forced recirculation may also assist where the grain type (e.g.
oilseeds) typically absorbs higher amounts of phosphine during fumigation.
Equipment for fumigation recirculation
Sealable silo - gas tight, that passes a pressure test.
Plumbing pipes (90 – 100 mm) from silo roof to ground level. Use quality pipe, fittings and
seals that will ensure many years of safe, gas- tight fumigations.
Small fan (e.g. Downfield F370 - 0.37 kW) to recirculate air. In most case this fan size will be
suitable for both small & large silos. In trials (Fig. 4 & 5) this fan size provided a complete silo
air change every 12 hours for the full silo holding 1420 t of wheat.
Fittings for fan intake and outlet. Flexible hoses (50 – 100mm) couplings and gate valves.
Fumigation recirculation - operations
Pressure test the silo to check for leaks.
Follow all label directions and place tablets / blankets in the ‘headspace’ or ‘phosphine box’.
Run small recirculation fan for first 5 days of fumigation. Leave silo sealed for remaining days
of fumigation exposure period as label requires (e.g. 7, 10, 20 days).
Notes
24 There are benefits to using the silo ‘headspace’ to locate the blankets or tablets. The large surface
area of grain in the headspace provides safe, large easy access for liberated gas to penetrate and
diffuse into the grain.
Breeza GRDC Grains Research Update 2018
Licenced fumigators commonly choose to use ‘gas’ formulations of phosphine to undertake
fumigations in large silos and other storage types, rather than using the solid phosphine
formulations of blankets or tablets. An example is Cytec’s ECO2FUME® containing 20g/kg phosphine
in carbon dioxide handled in 31 kg liquefied gas cylinders. While applying the full dose of phosphine
gas on day one into a storage has benefits, in many cases the use of a recirculation systems is
valuable to provide rapid, uniform gas concentration distribution throughout the storage.
Warning
Always seek advice from a suitably qualified professional before fitting fumigation recirculation
systems to silos / storages. Some systems that are currently sold are not recommended because of
unsafe design features. Phosphine is not only a toxic gas, but can be flammable and explosive if
restricted in a small area, or used in a manner that causes gas concentrations to rise quickly to high
levels. Follow label directions and seek advice.You can also read