FRESHWATER USE BY U.S. POWER PLANTS - ELECTRICITY'S THIRST FOR A PRECIOUS RESOURCE
←
→
Page content transcription
If your browser does not render page correctly, please read the page content below
Freshwater Use by U.S. Power Plants
Electricit y’s Thirst for a Precious Resource

A Report of the Energy and Water in a Warming World Initiative

Freshwater Use by U.S. Power Plants
Electricit y’s Thirst for a Precious Resource

                       Kristen Averyt
                       Jeremy Fisher
                       Annette Huber-Lee
                       Aurana Lewis
                       Jordan Macknick
                       Nadia Madden
                       John Rogers
                       Stacy Tellinghuisen

                       EW3 Scientific Advisory Committee
                       Peter Frumhoff
                       George Hornberger
                       Robert Jackson
                       Robin Newmark
                       Jonathan Overpeck
                       Brad Udall
                       Michael Webber

                       A Report of the
                       Energy and Water in a Warming World Initiative

                       November 2011
ii   Energy and Water in a Warming World Initiative

     Citation:

     Averyt, K., J. Fisher, A. Huber-Lee, A. Lewis, J. Macknick, N. Madden, J. Rogers, and S. Tellinghuisen.
     2011. Freshwater use by U.S. power plants: Electricity’s thirst for a precious resource. A report of the
     Energy and Water in a Warming World initiative. Cambridge, MA: Union of Concerned Scientists.
     November.

     © 2011 Union of Concerned Scientists
     All rights reserved

     The Union of Concerned Scientists (UCS) is the leading science-based nonprofit
     working for a healthy environment and a safer world. For more information about UCS,
     visit our website at www.ucsusa.org.

     This report is available on the UCS website (www.ucsusa.org/publications)
     or may be obtained from:

     UCS Publications
     2 Brattle Square
     Cambridge, MA 02238-9105

     Or, email pubs@ucsusa.org or call (617) 547-5552.

     cover photos
     Top: iStockphoto.com /AVTG; bottom, left to right: Longview News-Journal/Kevin Green,
     Ecologypress.com, BrightSource Energy, Flickr/Andy Shapiro

     Title page photo : Flickr/David Joyce
Freshwater Use by U.S. Power Plants: Electricity’s Thirst for a Precious Resource   iii

About EW3
Energy and Water in a Warming World (EW3) is a collaborative effort between
the Union of Concerned Scientists (UCS) and a team of independent experts to build
and synthesize policy-relevant research on the water demands of energy production
in the context of climate variability and change. The initiative includes core research
collaborations intended to raise the national profile of the water demands of energy,
along with policy-relevant energy development scenarios and regional perspectives.

The material presented in this report is based on the research of the EW3 Baseline
Assessment Team, listed below. The work discussed here is also presented in more technical
detail in forthcoming scientific papers. For supporting materials (glossary, methodology
appendix, and graphical appendix), go to www.ucsusa.org/electricity-water-use.

E W 3 Ba s e li n e A ss e ssm e n t Te a m
    Kristen Averyt (research lead), University of Colorado–Boulder,
          NOAA Western Water Assessment, Boulder, CO
    Jeremy Fisher, Synapse Energy Economics, Cambridge, MA
    Annette Huber-Lee, Tufts University, Medford, MA
    Aurana Lewis, Duke University, Durham, NC
    Jordan Macknick, National Renewable Energy Laboratory, Golden, CO
    Nadia Madden, Union of Concerned Scientists, Cambridge, MA
    John Rogers, Union of Concerned Scientists, Cambridge, MA
    Stacy Tellinghuisen, Western Resource Advocates, Boulder, CO

EW3 oversight and guidance is provided by a multidisciplinary scientific advisory
committee composed of senior scientists and subject matter experts:
E W 3 S ci e n t i fi c Adv i s o ry Co m m i t t ee
    Peter Frumhoff (chair), Union of Concerned Scientists, Cambridge, MA
    George Hornberger, Vanderbilt University, Nashville, TN
    Robert Jackson, Duke University, Durham, NC
    Robin Newmark, National Renewable Energy Laboratory, Golden, CO
    Jonathan Overpeck, University of Arizona, Tucson, AZ
    Brad Udall, University of Colorado–Boulder, NOAA Western Water Assessment, Boulder, CO
    Michael Webber, University of Texas, Austin, TX

E W 3 Pr oj ec t M anag e r s
    Erika Spanger-Siegfried, Union of Concerned Scientists, Cambridge, MA
    John Rogers, Union of Concerned Scientists, Cambridge, MA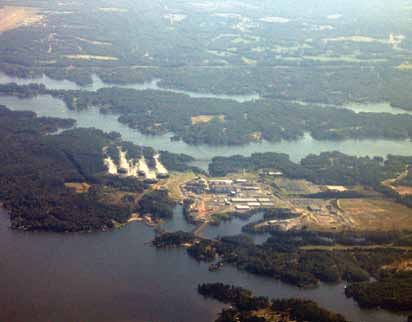
iv   Energy and Water in a Warming World Initiative

     Contents

       iii   About EW3                                            Chapter 4
                                                             25   Under Pressure: Stress on Water Systems
       iv    Contents                                        25   Stress: Water Supply and Demand
                                                             29   Stress on Ecosystems
        v    Figures, Tables, and Text Boxes
                                                             30   Water Stress and Power Plant Reliability
                                                             31   What Climate Change Brings
       vi    Acknowledgments
                                                             32   How Power Plant Water Use Might Change
        1    Executive Summary                               33   The Texas Case: Are We Prepared for the Future?

             Chapter 1                                            Chapter 5

        6    The Water and Power Standoff: An Introduction   35   Toward a Water-Smart Energy Future

        8    How Power Plants Use Water
                                                             39   References
             Chapter 2
                                                             47   Appendices
      12     Electricity’s Water Profile
      13     Water Intensity                                      Energy and Water in a Warming World
      14     Cooling Technologies across the Country              Baseline Team
      15     Where Does All This Water Come From?            48   EW3 Baseline Assessment Team
      17     Considering Freshwater Use by Fuel              49   EW3 Scientific Advisory Committee

             Chapter 3                                       52   About UCS
      19     Gaps and Errors in Information on Power Plant
             Water Use
      19     What’s Going on Here?
      22     Other Reporting Problems
      23     Why Accurate Information Matters
      24     Changes Coming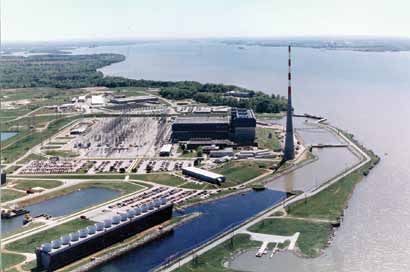
Freshwater Use by U.S. Power Plants: Electricity’s Thirst for a Precious Resource   v

Figures, Tables, and Text Boxes

Figures
  9      Figure 1. How Power Plants Use Water
 13      Figure 2. Water Use by Fuel and Cooling Technology
 14      Figure 3. Power Plant Water Withdrawals: East versus West
 15      Figure 4. Freshwater Use for Electricity Generation
 16      Figure 5. Sources of Water Used by Power Plants
 17      Figure 6. Variations in Water-Use Intensity across the Fleet
 20      Figure 7. Reported versus Calculated Power Plant Water Use: Discrepancies across the Country
 21      Figure 8. Water Withdrawals by Power Plants That Reported No Water Use
 26      Figure 9. Water-Supply Stress across the United States
 27      Figure 10. Where Power Plants Drive Water-Supply Stress
 29      Figure 11. Fish in Hot Water
 32      Figure 12. A Dry Future
 33      Figure 13. Power Companies, Freshwater, and Carbon

Tables
 20      Table 1.   Reported versus Calculated Power Plant Water Use, by Fuel

Text Boxes
 10      Box 1. The Energy and Water in a Warming World Approach
 18      Box 2. Alternative Water Sources: No Perfect Solutions
 26      Box 3. Stress on the Chattahoochee
 28      Box 4. Water Stress, Availability, and Legal Rights
 34      Box 5. Climate Change: Challenging the Carbon-Water Balancing Act
vi   Energy and Water in a Warming World Initiative

     Acknowledgments

     This report is the product of active collaboration and contributions from people with
     diverse expertise related to energy, water, and climate change.

     For technical contributions to the EW3 analysis, we thank Ge Sun, Peter Caldwell,
     Steve McNulty, and Erika Cohen (U.S. Forest Service–Southern Research Station);
     Shazia Davis and KC Hallett (National Renewable Energy Laboratory); and Emily
     Briley and Seth Sheldon (Civil Society Institute).

     For thoughtful comments on review drafts of this report, we thank Heather Cooley
     (Pacific Institute), Vlad Dorjets (U.S. Energy Information Administration), Kirstin
     Dow (University of South Carolina), Guido Franco (California Energy Commission),
     Mike Hightower (Sandia National Laboratories), Tom Iseman (Western Governors’
     Association), Carly Jerla (U.S. Interior Department’s Bureau of Reclamation), Joe
     O’Hagan (California Energy Commission), Todd Rasmussen (University of Georgia),
     Benjamin Sovacool (University of Vermont), Vince Tidwell (Sandia National
     Laboratories), and Tom Wilbanks (Oak Ridge National Laboratory).

     For extraordinary compositional, editorial, and graphical support, we are deeply
     indebted to Jim Downing, Tyler Kemp-Benedict, and Sandra Hackman.

     We also appreciate the assistance and input of Angela Anderson, David Brown, Alberta
     Carpenter, Steve Clemmer, Nancy Cole, Ethan Davis, Scott Gossett, Garvin Heath,
     Shane Jordan, Doug Kenney, Simcha Levental, Dave Lochbaum, Jeffrey Logan, Jeff
     Lukas, Lisa Nurnberger, Megan Rising, Suzanne Shaw, Linda Stitzer, and Ellen Vancko.

     And we are indebted to the trailblazers who have promoted an understanding of the
     energy-water-climate connections—colleagues who have broken important scientific
     ground and helped define problems and potential solutions. We are also grateful to
     those working to address these challenges from national and state perspectives, and
     at the level of individual rivers and watersheds.

     The production of this report was made possible through the generous support of
     The Kresge Foundation, Roger and Vicki Sant, the Wallace Research Foundation, and
     the Emily Hall Tremaine Foundation.

     NOTE: An employee of the Alliance for Sustainable Energy, LLC (Alliance), the operator of the National Renewable Energy
     Laboratory (NREL) for the U.S. Department of Energy (DOE), has contributed to this report. The views and opinions expressed
     herein do not necessarily state or reflect those of Alliance, NREL, the DOE, or the U.S. government. Furthermore, Alliance,
     NREL, the DOE, and the U.S. government make no warranty, express or implied, and assume no liability or responsibility for
     the accuracy, completeness, or usefulness of any information disclosed herein. Reference herein to any product, process, or
     service by trade name, trademark, manufacturer, or otherwise does not constitute or imply its endorsement, recommenda-
     tion, or favoring by Alliance, NREL, the DOE, or the U.S. government.
Freshwater Use by U.S. Power Plants: Electricity’s Thirst for a Precious Resource                  1

Executive Summary

T
        ake the average amount of water flowing over
        Niagara Falls in a minute. Now triple it. That’s
        almost how much water power plants in the United
States take in for cooling each minute, on average.
     In 2005, the nation’s thermoelectric power plants—
which boil water to create steam, which in turn drives
turbines to produce electricity—withdrew as much wa-
ter as farms did, and more than four times as much as

                                                                                                                             Flickr/Williams_Jt
all U.S. residents. That means lighting rooms, powering
computers and TVs, and running appliances requires
more water, on average, than the total amount we use
in our homes—washing dishes and clothes, showering,
flushing toilets, and watering lawns and gardens.
     This tremendous volume of water has to come from            •   A 2006 heat wave forced nuclear plants in the
somewhere. Across the country, water demand from                     Midwest to reduce their output when customers
power plants is combining with pressure from grow-                   needed power most. At the Prairie Island plant in
ing populations and other needs and straining water                  Minnesota, for example, the high temperature of
resources—especially during droughts and heat waves:                 the Mississippi River forced the plant to cut elec-
                                                                     tricity generation by more than half.
•   The 2011 drought in Texas created tension among
    farmers, cities, and power plants across the state.          •   In the arid Southwest, power plants have been con-
    At least one plant had to cut its output, and some               tributing to the depletion of aquifers, in some cases
    plants had to pipe in water from new sources. The                without even reporting their water use.
    state power authority warned that several thousand           •   On New York’s Hudson River, the cooling wa-
    megawatts of electrical capacity might go offline if             ter intakes of the Indian Point nuclear plant kill
    the drought persists into 2012.                                  millions of fish annually, including endangered
                                                                     shortnose sturgeon. This hazard to aquatic life now
•   As drought hit the Southeast in 2007, water provid-
                                                                     threatens the plant as well. Because operators have
    ers from Atlanta to Raleigh urged residents to cut
                                                                     not built a new cooling system to protect fish, state
    their water use. Power plants felt the heat as well. In
                                                                     regulators have not yet approved the licenses the
    North Carolina, customers faced blackouts as water
                                                                     operators need to keep the plant’s two reactors run-
    woes forced Duke Energy to cut output at its G.G.
                                                                     ning past 2013 and 2015.
    Allen and Riverbend coal plants on the Catawba
    River. Meanwhile the utility was scrambling to               •   Proposed power plants have also taken hits over wa-
    keep the water intake system for its McGuire                     ter needs. Local concerns about water use have scut-
    nuclear plant underwater. In Alabama, the Browns                 tled planned facilities in Arizona, Idaho, Virginia,
    Ferry nuclear plant had to drastically cut its output            and elsewhere. Developers of proposed water-cooled
    (as it has in three of the last five years) to avoid             concentrating solar plants in California and Nevada
    exceeding the temperature limit on discharge water               have run into opposition, driving them toward dry
    and killing fish in the Tennessee River.                         cooling instead.
2                       Energy and Water in a Warming World Initiative

                                                                                                                                                     Flickr/David Joyce
                        This report—the first on power plant water use and
                        related water stress from the Energy and Water in a
                        Warming World initiative—is the first systematic as-
                        sessment of both the effects of power plant cooling on
                        water resources across the United States and the quality            While our analysis focuses on the effects of water
                        of information available to help public- and private-sec-      use by power plants today, we also consider how condi-
                        tor decision makers make water-smart energy choices.           tions are likely to change in the future. In the short run,
                             Our analysis starts by profiling the water use char-      our choices for what kind of power plants we build can
                        acteristics of virtually every electricity generator in the    contribute to freshwater-supply stress (by consigning an
                        United States. Then, applying new analytical approach-         imbalanced share of the available water to power plant
                        es, we conservatively estimate the water use of those          use) and can affect water quality (by increasing water
                        generators in 2008, looking across the range of fuels,         temperatures to levels that harm local ecosystems, for
                        power plant technologies, and cooling systems. We then         example). Over a longer time frame, those choices can
                        use those results to assess the stress that power plant        fuel climate change, which in turn may also affect water
                        water use placed on water systems across the country.          quantity (through drought and other extreme weather
                        We also compare our results with those reported by             events) and quality (by raising the temperature of lakes,
                        power plant operators to the U.S. Energy Information           streams, and rivers). Population growth and rising
                        Administration (EIA) for 2008.                                 demand for water also promise to worsen water stress in
                             We examine both the withdrawal and consumption            many regions of the country already under stress from
                        of freshwater. Withdrawal is the total amount of water a       power plant use and other uses.
                        power plant takes in from a source such as a river, lake, or        Our findings on the water profile of power plants
                        aquifer, some of which is returned. Consumption is the         in 2008 show that:
                        amount lost to evaporation during the cooling process.         •   Power plants are thirsty. Every day in 2008, on
                             Withdrawal is important for several reasons. Water            average, water-cooled thermoelectric power plants
                        intake systems can trap fish and other aquatic wildlife.           in the United States withdrew 60 billion to 170 bil-
                        Water withdrawn for cooling but not consumed returns               lion gallons (180,000 to 530,000 acre-feet) of
                        to the environment at a higher temperature, potentially            freshwater from rivers, lakes, streams, and aquifers,
                        harming fish and other wildlife. And when power plants             and consumed 2.8 billion to 5.9 billion gallons
                        tap groundwater for cooling, they can deplete aquifers             (8,600 to 18,100 acre-feet) of that water. Our
                        critical for meeting many different needs. Consumption             nation’s large coal fleet alone was responsible for
                        is important because it too reduces the amount of                  67 percent of those withdrawals, and 65 percent of
                        water available for other uses, including sustaining               that consumption.
                        ecosystems.
                                                                                       •   Where that water comes from is important.
                                                                                           In the Southwest, where surface water is rela-
                                                                                           tively scarce, power plants withdrew an average
                                                                                           of 125 million to 190 million gallons (380 to
                                                                                           590 acre-feet) of groundwater daily, tapping many
                                                                                           aquifers already suffering from overdraft. By
                                                                                           contrast, power plants east of the Mississippi relied
                                                                                           overwhelmingly on surface water.
                                                                                       •   East is not west: water intensity varies regionally.
    Flickr/Killercorn

                                                                                           Power plant owners can reduce their water inten-
                                                                                           sity—the amount of water plants use per unit of
Freshwater Use by U.S. Power Plants: Electricity’s Thirst for a Precious Resource 3
electricity generated. Plants in the East generally
withdrew more water for each unit of electricity
produced than plants in the West, because most have
not been fitted with recirculating, dry cooling, or
hybrid cooling technologies. Freshwater withdrawal
intensity was 41 to 55 times greater in Virginia,
North Carolina, Michigan, and Missouri than in
Utah, Nevada, and California. Freshwater consump-
tion intensity was similar in those sets of states.
Wikimedia Commons/Civilengtiger
• Low-carbon electricity technologies are not
necessarily low-water. On average in 2008, plants
in the U.S. nuclear fleet withdrew nearly eight
times more freshwater than natural gas plants per
unit of electricity generated, and 11 percent more
than coal plants. The water intensity of renewable
energy technologies varies. Some concentrating
solar power plants consume more water per unit of
electricity than the average coal plant, while wind
farms use essentially no water. from more than 350 power plants across the coun-
try exceeded 90°F. Some 14 states prohibit such
Water supply is said to be stressed in watersheds when discharges, which can harm fish and other wildlife.
demand for water—by power plants, agriculture, and
municipalities, for example—exceeds a critical thresh- • The mix of power plants in the nation’s fleet
old of the available supply provided by local sources, matters. The power plant portfolios of U.S. com-
typically surface and groundwater. Water quality can be panies have widely varying water-use and carbon
similarly stressed when, for example, water users raise emissions profiles. Utilities with lower-water plants
temperatures or discharge pollutants. Our findings on place less stress on local water sources. Utilities with
the impact of power plant cooling on water stress in carbon-intensive power plants contribute to long-
2008 show that: term water stress by exacerbating climate change.
• Power plants across the country contribute to Collisions and near-misses between energy and
water-supply stress. Based on our analysis, in 2008, water needs point to the importance of accurate, up-to-
400 out of 2,106 watersheds across the country were date information on power plant water demand. Our
experiencing water-supply stress. Power plants, by analysis reveals, however, a number of gaps and appar-
tapping this overstretched resource for cooling pur- ent inaccuracies in federal data reported for 2008. As
poses, contributed to water-supply stress in one-fifth a result, analyses based on that information would have
of those. We focused on 25 watersheds in 17 states in overlooked regions facing water stress. We found:
which power plants were the primary driver of water-
• Gaps add up. Power plants that did not report
supply stress based on our analysis. Several states
their water use to the EIA accounted for 28 to
including North Carolina, South Carolina, Missouri,
30 percent of freshwater withdrawals by the
and Michigan had more than one of those water-
electricity sector, and at least 24 to 31 percent of
sheds, including the Catawba and Seneca Rivers.
freshwater consumption by the sector, according
• High-temperature water discharges are com- to our calculations. Gaps in the 2008 information
mon. Peak summer temperatures for return flows included all water use by nuclear power plants.4 Energy and Water in a Warming World Initiative
However, providing better information is only the
first critical step. Decision makers must then put that
information—coupled with sound analyses of water
stress—to work in curbing electricity’s thirst, especially
in water-stressed regions. Our analysis provides a strong
initial basis for making water-smart energy choices.
Here are some ways to do so:
• Get it right the first time. Developing new
resources for meeting electricity demand provides
a critical opportunity for reducing water risks
for both power plant operators and other users.
Flickr/cm195902
Utilities and other power plant developers would
be well advised to prioritize low-water or no-water
cooling options, particularly in regions of current
and projected high water stress.
• Discrepancies are widespread. Reported fresh-
water use by power plants across the country fell Some developers are already making such choices.
outside the bounds suggested by our analysis, For example, the project developer’s choice of dry
including plants in 22 states for withdrawal, and cooling for the 370-megawatt Ivanpah concentrat-
38 states for consumption. The discrepancies were ing solar power (CSP) project under construc-
especially large in the Lower Colorado River and tion in California’s Mojave Desert means that the
Southeast-Gulf regions, where plant operators facility will consume 90 percent less water per unit
reported consumption five times greater—and of electricity than typical wet-cooled CSP plants.
withdrawals 30 percent less—than median water- Other developers and utilities are reducing the risk
use values would suggest. of energy-water collisions by choosing technologies
that use essentially no water, such as wind and solar
• Discrepancies stemmed from a range of causes. photovoltaics, and by investing in energy efficiency.
Some power plant operators are exempt from
reporting their water use based on plant size or • Retool existing plants. Owners and operators of
technology. Many operators appeared to report existing power plants with substantial effects on the
peak rates of water use rather than the requested supply or quality of water in water-stressed regions
annual average rate, leading to overestimates. Other could consider retrofitting to low-water cool-
operators reported zero water use. ing. When the 1,250-megawatt Plant Yates near
Newnan, GA, added cooling towers in 2007, it cut
• Good analysis requires good information. Using water withdrawals by 93 percent.
the available data masks existing water stress.
Even greater reductions in freshwater use are some-
Several of the 25 watersheds identified did not show
times essential. In much of the Southwest, even low
up when we analyzed EIA-compiled information.
water withdrawals can spell trouble, particularly
Averting energy-water collisions requires that power when they come from diminishing aquifers. Water
plant operators regularly report accurate information on consumption, too, can pose problems. Power produc-
their water use to the EIA and state agencies. The EIA ers in highly water-constrained settings can make
has been working to improve such reporting, to better water-smart choices—as Xcel Energy, which operates
meet the needs of public- and private-sector decision the 1,080-megawatt Harrington Station in Amarillo,
makers. The agency may therefore remedy many of the TX, did in 2006, when it switched to treated waste-
problems we identified with the 2008 data shortly. water to meet the plant’s cooling needs.Freshwater Use by U.S. Power Plants: Electricity’s Thirst for a Precious Resource 5
• Set strong guidelines for power plant water use. operating for years. Our nation’s precious freshwa-
Public officials can draw on good information on ter resources will face ever more stress from growing
electricity’s thirst to help owners of existing and populations, a changing climate, and other trends over
proposed power plants avert energy-water collisions. the next several decades. The typically high cost of
Public utility commissions, which oversee the plans retrofitting power plants means that decisions on the
of utilities and specific plant proposals, can encour- water impact of today’s plants should consider the risks
age or require investments that curb adverse effects they pose to freshwater resources and energy reliability
on water supply or quality, particularly in areas of throughout their expected lifetime.
current or projected water stress. The next report from the Energy and Water in a
Legislators also have a stake in averting energy-water Warming World initiative will take up this challenge by
collisions. The Colorado legislature’s 2010 decision exploring how energy choices affect the resilience of our
to retire more than 900 megawatts of coal plants in energy sector in the face of both periodic drought and
favor of natural gas, energy efficiency, and renewable long-term changes in water availability. Zooming in on
energy will reduce water consumption by a volume key regions of the country will yield a more robust un-
roughly equivalent to that used by 50,000 people. derstanding of how the energy technologies we choose
to power tomorrow’s world would affect water resources.
• Engage diverse stakeholders. Mayors securing Decisions made today about which power plants
water supplies for their cities, anglers concerned to build, which to retire, and which energy or cool-
with sport and commercial fishing, water resource ing technologies to deploy and develop matter greatly.
managers at all levels, and others all have a stake in Understanding how these choices affect water use
averting energy-water collisions. Full public access and water stress will help ensure that the dependence
to information on water use by existing and pro- of power plants on water does not compromise that
posed power plants will enable these and other local resource, the plants themselves, or the energy we rely on
stakeholders to become informed about the benefits them to provide.
of water-smart energy choices.
• Reduce power plant carbon emissions. Because
human-caused climate change is worsening water
stress across much of the United States, water-smart
energy choices should include investing in resources
that are also low-carbon. The new cooling towers
for the coal-burning Plant Yates reduce its impact
on water stress but not its carbon emissions.
The coal-burning generators at Harrington Station
in Amarillo, although relying on treated wastewa-
ter, still emit prodigious quantities of carbon. Of
course, not all low-carbon options are water-smart.
Some, such as wind power and energy efficiency, are
inherently low-water. Others, such as the proposed
Stephen Baird
carbon capture and storage for coal plants, are not,
and could worsen energy-water collisions if used in
regions with water stress.
Averting energy-water collisions means taking a long
view. Power plants are designed to last for decades,
and much of our existing infrastructure will continue6 Energy and Water in a Warming World Initiative
Chapter 1
The Water and Power Standoff: An Introduction
A
s of late summer 2011, Texas had suffered the The Texas case is hardly the first example of hot
driest 10 months since record keeping began weather and scarce water driving power systems to
in 1895 (LCRA 2011). Some rivers, such as the the brink of failure. In August 2007, as a triple-digit
Brazos, actually dried up (ClimateWatch 2011). The dry heat wave compounded months of drought on North
weather came with brutal heat: seven cities recorded at Carolina’s Catawba River, the thirst of the region’s
least 80 days above 100°F (Dolce and Erdman 2011). seven major power plants became incompatible with
With air conditioners straining to keep up, the state’s what the river had to give. That month, as demand for
demand for electricity shattered records as well, topping electricity hit an all-time high, Duke Energy had to
68,000 megawatts in early August (ERCOT 2011). cut power generation at its G.G. Allen and Riverbend
An energy-water collision wasn’t far behind. One coal-fired plants, as the temperature of discharged cool-
plant had to curtail nighttime operations because the ing water exceeded limits set to protect fish in the river.
drought had reduced the amount of cool water avail- Blackouts rippled through the area (Beshears 2007). A
able to bring down the temperature of water discharged month later, Duke was rushing to modify a water intake
from the plant (O’Grady 2011; Sounder 2011). In East pipe on its 2,200-megawatt McGuire Nuclear Station
Texas, other plant owners had to bring in water from so it could stay within reach of the dropping water level
other rivers so they could continue to operate and meet in Lake Norman (Kirkpatrick 2007a; 2007b).
demand for electricity. If the drought were to persist More regions may experience what happened in
into the following year, operators of the electricity grid Texas in 2011 and in North Carolina in 2007, given the
warned, power cuts on the scale of thousands of mega- nation’s trajectory on a number of fronts. Population
watts are possible (O’Grady 2011). growth is worsening competition among residents,
power companies, and others needing water (Hojjati
and Battles 2005). Rising global water and air tem-
Longview News-Journal/Kevin Green
peratures are disrupting rainfall patterns, curbing the
amount of water available in some regions (National
Research Council 2010; USGCRP 2009). Hotter
weather is also pushing up summertime power demand,
as air conditioning loads weigh heavier on the grid
(Wilbanks et al. 2008). Compounding the problem,
warmer air and water make power plants operate less
efficiently, and cooling them requires even more water
(NETL 2002). And as fossil-fueled power plants are
Drought, heat, and high power demand make for an energy-
water collision: Amid the Texas drought of 2011, the shores
of Martin Creek Lake—the primary source of cooling water
for the Luminant plant pictured here—receded to precari-
ously low levels. To keep the plant operating, Luminant had to
import water from the Sabine River. If the drought persists into
2012, operators of the electricity grid have warned that power
cuts on the scale of thousands of megawatts are possible.Freshwater Use by U.S. Power Plants: Electricity’s Thirst for a Precious Resource 7
forced to run longer and harder, they release even more based on reporting by power plant operators—has
of the climate-warming emissions that are driving up contained gaps and apparent inaccuracies.4 In 2008, for
air and water temperatures and altering water resources example, more than 100 water-cooled coal and natural
(USGCRP 2009). gas power plants reported to the government that they
Choices about the future mix of plants used to gen- produced millions of megawatt-hours of electricity yet
erate electricity can ease the tension between water and used no water at all. At the same time, dozens of plant
energy. Renewable energy technologies such as wind operators overreport their water use by a large margin.
turbines and photovoltaic panels use little or no water And the nation’s fleet of nuclear power plants has been
and emit no carbon pollution in producing electricity.1 exempt from reporting to the EIA the water they use
Even fossil-fueled technologies provide opportunities since 2002.
to reduce water demand while also addressing carbon This report—produced by the Energy and Water
emissions. Natural gas combined-cycle plants have in a Warming World initiative (EW3)—helps fill in
lower carbon emissions than coal plants, for example, many of these missing pieces. Our analysis provides a
and, because of greater efficiencies, produce less waste comprehensive accounting of how much water power
heat. Novel cooling technologies, such as dry cooling plants withdraw and consume, and the source of all that
and hybrid systems, can also reduce pressure on water water. The report also highlights the biggest discrepan-
systems. cies in federal data, and shows
Much is at stake. If power why inaccurate information
companies have trouble find- Choices about the mix of is problematic. We also show
ing enough water to cool their plants used to generate where water use by power plants
power plants, blackouts can force appears to be exacerbating water
them to purchase electricity from electricity can ease the stress today—and point to what
other sources, which can raise tension between energy the future of power plant water
customers’ utility bills. Rising
2
use might hold.
water temperatures imperil fish
and water, or exacerbate it. The EIA has announced
and other aquatic species (Hester that it intends to address many
and Doyle 2011). Struggles among power plants, cities, of the information gaps on water use by power plants
and farms over limited water resources can be costly, can (EIA 2011a; 2011b). However, lasting improvements
force residents to cut water use, and can shortchange the will require sustained funding for the agency, as well
environment. 3
as a consistent commitment to closing those gaps.
To make energy-water choices wisely, good infor- While the federal fix is pending, our analysis shows
mation about the problem is essential: how much water that collecting good data is just one step in addressing
power plants use, where they get that water, and how the energy-water collision. We must act on that knowl-
that use affects water resources. However, the most edge to avoid a future in which problems like those in
complete, publicly available set of data—that compiled Texas in 2011 and on the Catawba River in 2007 are
by the U.S. Energy Information Administration (EIA), commonplace.
1 As noted below, however, low-carbon technologies do not always mean lower water use. Some renewable technologies, such as concentrating solar power, can
consume as much water as coal-fired or nuclear plants.
2 This occurred with the Browns Ferry nuclear plant. See Chapter 4.
3 An example is the allocation of water rights by the Lower Colorado River Administration (LCRA) near Austin, TX. The LCRA provides water to 65 municipalities in Texas
while deciding how much flow the river needs to maintain a healthy ecology. This “ecological flow” is among the first to be cut during a drought. That flow, along with
residential use, sustains severe cuts before power plant operators and other commercial entities must cut their water use (LCRA 2011; 2010).
4 The EIA’s annual data are, however, “the only federally collected, national data available on water use and cooling technologies at individual power plants” (GAO 2009).8 Energy and Water in a Warming World Initiative
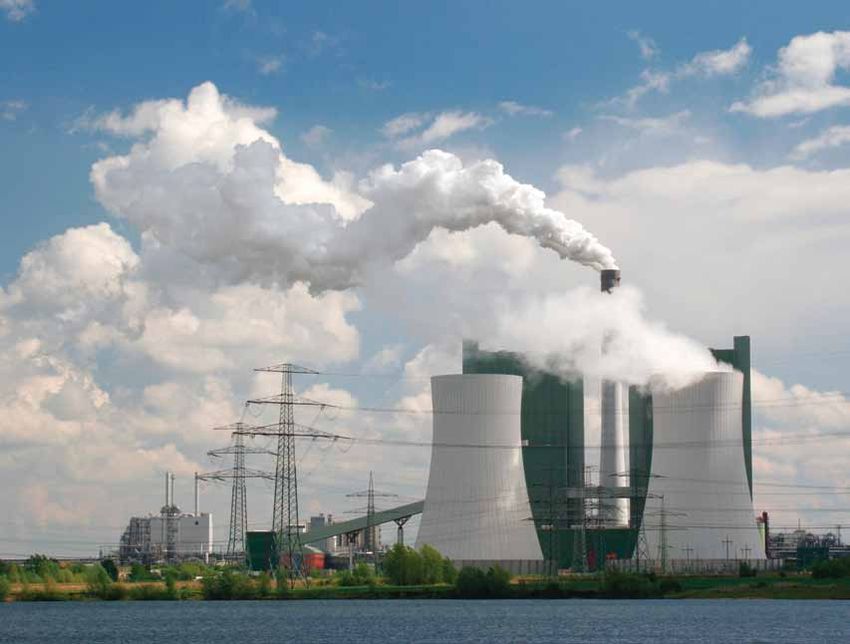
How Power Plants Use Water
Thermoelectric power plants—which boil water to cre-
ate steam, which in turn drives turbines—produce some
90 percent of the electricity used in the United States.
EPA
These power plants use a variety of energy sources to
boil the water—mainly coal, natural gas, and nuclear Power plant water use depends on cooling technologies:
fission, but also wood waste (biomass), the sun’s rays “Once-through” cooling systems, like that of the coal-fired
(concentrating solar power), and the heat energy of the Brayton Point Power station in Somerset, MA, withdraw
earth (geothermal power). much more water than “recirculating” cooling systems, but
consume less. Owners of Brayton Point are building cooling
After the steam passes through a turbine, it must be
towers to switch from once-through cooling to recirculating,
cooled so that it condenses and the water can be reused. which will cut the plant’s water draw from Mt. Hope Bay by
This steam-cooling step accounts for virtually all the 90 percent (Dominion 2011).
water used in most power plants, given that the steam
itself circulates in a closed system (Figure 1).5
How much water a power plant uses depends main- Many cooling systems—once-through or recirculat-
ly on which of three basic cooling technologies it uses. ing—circulate cooling water through on-site reservoirs
“Once-through” systems—which, as the name implies, called cooling ponds, which also lose water to evaporation.
use cooling water once before discharging it—withdraw This report tracks power plant water use in two ways:
much more water from sources such as lakes or rivers withdrawal and consumption. A plant’s withdrawal is the
than other types of cooling systems. amount it takes from a river, lake, ocean, groundwater
“Recirculating” cooling systems take in a fraction aquifer, or municipal water system. After use, this water
of the water that once-through systems do. However, either evaporates or is drained back to the source. The
recirculating systems can consume twice as much water amount lost to evaporation is a plant’s water consumption.
as once-through systems, or even more, because the Withdrawal volumes are important for a variety of
former evaporate much of the cooling water to condense reasons. For instance:
the steam. • For plants that draw water from a surface source
Dry-cooled systems, which blow air across steam- such as a river or lake, withdrawal volumes influ-
carrying pipes to cool them, use almost no water. Most ence the number of fish and other aquatic species
dry-cooled facilities in 2008 were natural gas plants.6 sucked into intake structures or the plant’s cooling
However, dry-cooled plants become considerably less system, or affected by warmer water returned by
efficient when ambient air temperatures are high. the plant.
Both recirculating and dry-cooling systems require
more energy than once-through systems. Because of • For plants that draw cooling water from an aquifer,
that energy penalty, and efficiency losses at high ambi- withdrawal volumes determine how much strain
ent air temperatures, some power plants rely on hybrid the plants place on groundwater resources.
cooling systems. These systems—some combination of • In many states, water rights are often defined in
the aforementioned technologies—operate in dry-cool- terms of a withdrawal rate or a volume associated
ing mode much of the time, but switch to wet-cooling with a given water use.
mode during hot weather (Barker 2007; DOE 2006).
Consumption volumes matter because water that evapo-
rates is not available for other uses. Whether withdrawal
or consumption is of greater concern in a given locale
5 For more information on how different energy systems operate, see UCS 2011a.
depends largely on local circumstances.
6 Other such plants were fueled wtih biomass, coal, and oil. In addition, some
natural gas facilities use combustion turbines, which produce electricity from
In Chapter 2, we calculate the scale and geographic
exhaust gases rather than steam, and therefore do not require cooling. distribution of water use by power plants based on theFreshwater Use by U.S. Power Plants: Electricity’s Thirst for a Precious Resource 9
Figure 1. How Power Plants Use Water
Most U.S. power plants create steam to drive the turbines
that generate electricity. After the steam passes through a
turbine, it is cooled, condensed, and reused. Steam cooling
accounts for virtually all the water that most power plants
use, which they often draw from rivers, lakes, or aquifers.
How much water a power plant uses depends on which cool-
ing technology it uses. Once-through cooling systems (A) generator
evaporation
withdraw large amounts of water, but return most of it—at a
higher temperature—to the source. Recirculating systems (B) high-
pressure
low-
pressure cooling tower
cool
take in much less water, but can consume twice as much of it steam steam
cooling
water
or more, because they evaporate much of the water to con-
dense the steam. turbine
Inset adapted from GAO 2009. boiler
ambient
air
warm
cooling
boiler water water
heat source condenser
B
recirculating
cooling
B
once-through
cooling
A
type of fuel and cooling systems they use. In Chapter 3, regions where power plants may contribute substantially
we compare our findings with federally compiled figures to that stress. (For more information on our method-
on power plant water use, and examine the causes of ology, see Box 1, p. 10, and Appendix A.) Finally, in
any gaps and discrepancies. Chapter 5 we suggest steps decision makers can take
In Chapter 4, we assess the stress that power plants to better understand and minimize the impact of the
place on water systems across the country, highlighting electricity sector on our water resources.10 Energy and Water in a Warming World Initiative
Box 1. The Energy and Water To evaluate water stress created by each power plant, we calculat-
in a Warming World Approach ed the Water Supply Stress Index (WaSSI) (Sun et al. 2008) for each
of the 2,106 watersheds (or sub-basins) in the lower 48 states.9 The
This report presents two types of information on water use by
WaSSI is the average annual volume of water demand divided
the thermoelectric power sector: reported and calculated.
by the average annual supply.10 The higher a basin’s WaSSI, the
Reported information is published by the EIA, based on data
greater its water stress. In basins with a WaSSI exceeding 1.0,
on water withdrawal and consumption submitted by power
demand exceeds supply: so users are importing water from
plant operators for 2008. Because many operators—including
other basins to meet demand,11 or withdrawing more surface
those of the nation’s entire nuclear fleet—did not report that
water and groundwater than natural processes are replacing.
information to the EIA, the reported figures contained large
We calculated the WaSSI for each watershed both with
gaps.7 The information that power producers did submit also
and without power plant water use. Mapping the difference
included a number of errors. Some plant owners, for instance,
between the two allowed us to identify regions where power
reported that their annual water consumption was greater than
plants appear to contribute substantially to water stress.12
their annual withdrawals.
A forthcoming companion EW3 report will assess the water
To address the shortcomings of the 2008 reporting system,
implications of future energy scenarios in key regions of the
we calculated water use by electricity producers. To do so, we:
country, and this report includes a snapshot from that report.
• Used federal records and other sources to identify the fuel Using an EIA base case for growth in electricity demand, we
type, cooling technology, source of cooling water, and pow- modeled the mix of power plants in each of 134 electricity
er output of each of the 1,748 water-cooled power plants in regions (“power control areas”) in the continental United States
the United States in 2008. (Power plants may include one or through 2036, given current policies that help determine what
more generators—turbines that turn physical energy into types of power plants producers may build. We then applied
electrical energy.) the most appropriate NREL values to estimate water withdraw-
als and consumption in 2036, and compared those with 2008
• Calculated water use for each plant, based on the amount
water use in the sector.13
of water typically withdrawn and consumed per unit of
electricity produced by a plant with a certain type of fuel
and cooling system, according to the National Renewable What Our Analysis Does Not Cover
Energy Laboratory (NREL) (Macknick et al. 2011). NREL Our analysis does not consider other ways electricity produc-
provides minimum, median, and maximum values for each tion affects water resources, including:
type of plant. Multiplying the NREL values by the plant’s
reported electricity production for the year yields a range of Hydropower. Hydroelectricity entails an obvious link between
calculated figures for its water use. The NREL values are the energy and water. However, quantifying water withdrawal and
most current published figures relating power production consumption for hydropower facilities is less clear-cut than for
to water use, so we have a high degree of confidence that thermoelectric power plants. A dam may generate power as it re-
our calculations represent the best available information on leases water for downstream users and ecosystems, for example.
8
water use by the power sector. Such facilities could be seen as not “withdrawing” any water.Freshwater Use by U.S. Power Plants: Electricity’s Thirst for a Precious Resource 11
Reservoirs used for hydropower increase the rate at which almost 2,000 miles of Appalachian headwater streams—some of
water is lost to evaporation. For instance, Lake Mead—the the most biologically diverse streams in the country (EPA 2010).
reservoir created by Hoover Dam—loses roughly 325 billion gal- Producing uranium fuel for nuclear power plants can affect
lons (1 million acre-feet) to evaporation each year (Westernburg, water supplies as well. Uranium mining has contaminated sur-
DeMeo, and Tanko 2006). However, many reservoirs, including face or groundwater in at least 14 states (WISE 2011). Processing
Lake Mead, provide benefits beyond hydropower, such as water and enriching uranium for use in nuclear power plants also
supply, tourism, and recreation. In those cases, hydropower requires water.
could be seen as only partly responsible for evaporative losses. Natural gas power plants are usually much less water-inten-
sive than coal or nuclear plants. However, the growing use of
Fuel extraction and refining. This report focuses on the direct hydraulic fracturing, or “hydrofracking,” to extract natural gas
withdrawal and consumption of water by thermoelectric power has been linked with aquifer declines (Hanson and Lewis 2010)
plants. However, many other pieces of the energy puzzle also and water pollution (Urbina 2011; Lustgarten 2009; PDEP 2009;
affect water systems. For example, U.S. coal mining uses 70 mil- OGAP 2005). The U.S. Environmental Protection Agency (EPA) is
lion to 260 million gallons (215 to 800 acre-feet) of water each day studying the effects of hydraulic fracturing on drinking water
(DOE 2006). What’s more, mountaintop removal mining has buried resources (EPA 2011a).14
7 In 2008, the EIA required reports only from operators of power plants that used organic fuel (coal, natural gas, biomass, and oil) and produced more than 100 mega-
watts of electricity (EIA 2008a; 2008b). For our purposes, we broke each plant down to the generator scale, based on 2008 information on power plant design and
operations submitted to the EIA on forms 860 and 923, respectively (EIA 2008a; 2008b). We also collected location data from information reported by plant owners to
the EIA and compiled by the Civil Society Institute, and used Google Earth to correct the reported data. We also collected data on CO2 emissions as reported to the U.S.
Environmental Protection Agency by a subset of plants. More details on the collection and quality-control aspects of this effort are in Appendix A.
8 Because NREL figures reflect all water used in geothermal facilities—and such water “may come from geothermal fluids, with little to no impact on local freshwater
sources” (Macknick et al 2011)—we used another source to determine freshwater use by geothermal facilities (Clark et al. 2011).
9 A sub-basin, or “cataloging unit”—“a geographic area representing part or all of a surface drainage basin, a combination of drainage basins, or a distinct hydrologic fea-
ture”—is the smallest unit in the U.S. Geological Survey system (USGS 2011).
10 For each sub-basin, we calculated water supply as the average sum of a) surface water supply (five-year average 2003–2007); b) groundwater supply, based on 2005 rates
of withdrawal (Kenny et al. 2009); and c) return flows from major water users, including cities and agriculture in 2005 (Kenny et al. 2009), and power plants (2008, our analysis).
We calculated water demand as withdrawals by the seven major users (commercial, domestic, industrial, irrigation, livestock, and mining in 2005 (Kenny et al. 2009) along with
thermoelectric power plants in 2008. For more information, see Appendix A.
11 This is the case, for instance, in the many basins in California that receive water from the Colorado River or the Sacramento-San Joaquin Delta via canals and pipelines,
and in parts of Arizona served by the Central Arizona Project.
12 WaSSI measures water stress based on quantity, not quality. An assessment of the effect of power plants on water quality—such as the temperature of lakes, streams,
or rivers—could reveal more basins where plants are stressing water resources.
13 The forthcoming report will include the full results of our forward-looking analysis, as well as a detailed description of our methodology.
14 For more information on water use for electricity generation beyond direct power plant cooling, see DOE 2006 or UCS 2011b.12 Energy and Water in a Warming World Initiative
Chapter 2
Electricity’s Water Profile
KEY FINDINGS
• Power plants are thirsty. Every day in 2008, on
average, water-cooled thermoelectric power plants
in the United States withdrew 60 billion to 170 bil-
lion gallons (180,000 to 530,000 acre-feet) of
freshwater from rivers, lakes, streams, and aquifers,
and consumed 2.8 billion to 5.9 billion gallons
Flickr/Siemens
(8,600 to 18,100 acre-feet) of that water.15 Our
nation’s large coal fleet alone was responsible for
67 percent of those withdrawals, and 65 percent of
that consumption.
Low-carbon electricity is not always low-water: Renewable
• Where that water comes from is important. power plants have a wide range of water intensities. Wind
In the Southwest, where surface water is rela- turbines and photovoltaic panels use essentially no water.
tively scarce, power plants withdrew an average However, when geothermal, biomass, and some types of
concentrating solar power plants rely on recirculating cool-
of 125 million to 190 million gallons (380 to
ing systems, they can have water intensities in the range of
590 acre-feet) of groundwater daily, tapping many nuclear or coal plants.
aquifers already suffering from overdraft. By
contrast, power plants east of the Mississippi relied
the U.S. nuclear fleet withdrew nearly eight times
overwhelmingly on surface water.
more freshwater than natural gas plants per unit
• East is not west: water intensity varies regionally. of electricity generated, and 11 percent more than
Power plant owners can reduce their water inten- coal plants. The water intensity of renewable energy
sity—the amount of water plants use per unit of technologies varies. Some concentrating solar power
electricity generated. Plants in the East generally plants consume more water per unit of electricity
withdrew more water for each unit of electricity than the average coal plant, while wind farms use
produced than plants in the West, because most have essentially no water.
not been fitted with recirculating, dry cooling, or hy-
Every day in 2008, on average, water-cooled thermoelec-
brid cooling technologies. Freshwater withdrawal in-
tric power plants in the United States withdrew 60 bil-
tensity was 41 to 55 times greater in Virginia, North
lion to 170 billion gallons (180,000 to 530,000 acre-feet)
Carolina, Michigan, and Missouri than in Utah,
of freshwater from rivers, lakes, streams, and aquifers,
Nevada, and California.16 Freshwater consumption
and consumed 2.8 billion to 5.9 billion gallons (8,600
intensity was similar in those sets of states.
to 18,100 acre-feet) of that water. The water withdrawn
• Low-carbon electricity technologies are not nec- was enough to supply 60 to 170 cities the size of New
essarily low-water. On average in 2008, plants in York (NYCDEP 2009).
15 For purposes of this analysis, “freshwater” encompasses all non-ocean sources, except where otherwise noted.
16 The first four states had among the highest freshwater withdrawal intensities; the latter, among the lowest (see Figure 4).Freshwater Use by U.S. Power Plants: Electricity’s Thirst for a Precious Resource 13
Withdrawals once-through cooling pond recirculating dry-cooled Consumption
(gallons/ (gallons/
MWh) MWh)
Nuclear
60,000 1,200
Coal
50,000 1,000
40,000 800 Biopower
30,000 600 Natural gas
20,000 400
Solar
10,000 200
Wind
0 0
urb s
ine
ed gas
cl e
ed as
cl e
ed gas
cl e
ear
al
r
al
ear
ear
al
r
h
gh
ic
nd
we
we
n t ga
ug
lta
Co
Co
Co
g
rou
Wi
-cy
-cy
-cy
Water Water
cl
cl
cl
po
po
l
bin ural
bin ural
bin ural
tro
vo
stio ra
median
Nu
Nu
Nu
Withdrawals Consumption
Pt
Bio
Bio
bu Natu
oto
P
com at
com Nat
com Nat
CS
CS
N
Ph
com
Figure 2. Water Use by Fuel and Cooling Technology Source: Macknick
et al. 2011.
Water withdrawals per megawatt-hour (MWh) can range from almost zero for a solar photovoltaic, wind,
Note: Ranges reflect
or dry-cooled natural gas plant, to hundreds of gallons for an efficient plant using recirculating cooling, minimum and maximum
to tens of thousands of gallons for a nuclear or coal plant using once-through cooling. Water consumption water-use values for
selected technologies
per MWh can similarly range from almost zero for solar, wind, or gas plants using dry cooling to around
from NREL. Horizontal
1,000 gallons for coal, oil, or concentrating solar power (CSP) with recirculating cooling. How much water a lines within rectangles
specific plant uses reflects its efficiency and age, and how much the plant is used, along with local humid- indicate median values.
ity, air temperature, and water temperature.
This chapter presents detailed findings about where
that astonishing amount of water comes from, how the U.S. power plants withdrew enough
power sector’s water use varies across the country, and freshwater each day in 2008 to supply
which fuel types are associated with the heaviest water
use. Most of our analysis focuses on freshwater, as that 60 to 170 cities the size of New York.
limited resource is critical to our health, our economy,
and our ecosystems.17
According to NREL researchers, for each type of
Water Intensity cooling technology, nuclear fission is, on average, the most
The water demand of power plants varies widely. A water-intensive of the most commonly used fuels, followed
nuclear power plant with once-through cooling, for by coal and natural gas (Figure 2) (Macknick et al. 2011).
instance, withdraws 25,000 to 60,000 gallons of water Renewable power plants have a wide range of water
for each megawatt-hour of electricity it produces, but intensities: low-carbon electricity is not always low-water.
consumes 100 to 400 gallons (Macknick et al. 2011). A Wind turbines—the most widely deployed renewable
nuclear plant with recirculating cooling water, on the electricity technology in the United States, aside from hy-
other hand, withdraws 800 to 2,600 gallons per mega- dropower—use essentially no water. The same is true of
watt-hour but consumes 600 to 800 gallons—roughly photovoltaic panels. On the other hand, when they rely
half the amount withdrawn (Macknick et al. 2011). on recirculating cooling systems, geothermal, biomass,
17 Using seawater to cool power plants can also have negative effects, however, because intake pipes and warm water discharges can affect sea life.14 Energy and Water in a Warming World Initiative Cooling Technologies
Once-through
Cooling pond
Recirculating
Dry-cooled
Withdrawal
(millions of gallons/year)Freshwater Use by U.S. Power Plants: Electricity’s Thirst for a Precious Resource 15
Withdrawal
(gallons/KWh)16 Energy and Water in a Warming World Initiative
Alaska
Pacific
Northwest Souris-Red-Rainy Great Lakes New
England
Missouri
Withdrawal
Upper
Surface water Mississippi
Ohio
Ocean
Groundwater Great Upper
Withdrawal Basin Colorado
California
Mixed sources
Surface water Mid-
Hawaii Wastewater Arkansas-White-Red Atlantic
Ocean Lower
Municipal Colorado Tennessee
Groundwater Rio South
Unknown freshwater Grande Atlantic-
Lower Gulf
Mixed sources Mississippi
Wastewater
Municipal
Texas-Gulf
Unknown freshwater
National
National Alaska
Pacific
Northwest Souris-Red-Rainy
Great Lakes New
England
Consumption Missouri
Upper
Surface water Mississippi
Ohio
Groundwater
Ocean Great Upper
Consumption Basin Colorado
California
Wastewater Mid-
Surface water Atlantic
Hawaii Municipal Arkansas-White-Red
Groundwater Lower
Unknown freshwater Colorado Tennessee
Ocean Rio
Mixed sources Grande South
Lower Atlantic-
Wastewater Mississippi Gulf
Municipal
Unknown freshwater
Mixed sources Texas-Gulf
National
Figure 5. Sources of Water Used by Power Plants
In 2008, power plants withdrew 84 percent of their cooling water from rivers and lakes. The balance came mainly from the ocean
in coastal regions. Most water that power plants consumed similarly came from surface sources. However, in some regions—
National
notably the arid Southwest—cooling water came from a broader array of sources, including groundwater and wastewater.You can also read