2018 Offshore Wind Technologies Market Report
←
→
Page content transcription
If your browser does not render page correctly, please read the page content below
2018 Offshore Wind Technologies Market Report
NOTICE

This report is being disseminated by the U.S. Department of Energy (DOE). As such, this
document was prepared in compliance with Section 515 of the Treasury and General Government
Appropriations Act for fiscal year 2001 (public law 106-554) and information quality
guidelines issued by DOE. Though this report does not constitute “influential” information, as
that term is defined in DOE’s information quality guidelines or the Office of Management and
Budget’s Information Quality Bulletin for Peer Review, the study was reviewed both internally
and externally prior to publication. For purposes of external review, the study benefited from the
advice and comments of nine energy industry stakeholders, U.S. Government employees, and
national laboratory staff.
This report was prepared as an account of work sponsored by an agency of the United States
government. Neither the United States government nor any agency thereof, nor any of their
employees, makes any warranty, express or implied, or assumes any legal liability or
responsibility for the accuracy, completeness, or usefulness of any information, apparatus,
product, or process disclosed, or represents that its use would not infringe privately owned rights.
Reference herein to any specific commercial product, process, or service by trade name,
trademark, manufacturer, or otherwise does not necessarily constitute or imply its endorsement,
recommendation, or favoring by the United States government or any agency thereof. The views
and opinions of authors expressed herein do not necessarily state or reflect those of the United
States government or any agency thereof.
Available electronically at SciTech Connect http:/www.osti.gov/scitech

Available for a processing fee to U.S. Department of Energy and its
contractors, in paper, from:
U.S. Department of Energy
Office of Scientific and Technical Information
P.O. Box 62
Oak Ridge, TN 37831-0062
OSTI http://www.osti.gov Phone:
865.576.8401
Fax: 865.576.5728
Email: reports@osti.gov
Available for sale to the public, in paper, from:
U.S. Department of Commerce National
Technical Information Service 5301
Shawnee Road
Alexandria, VA 22312 NTIS
http://www.ntis.gov
Phone: 800.553.6847 or 703.605.6000
Fax: 703.605.6900
Email: orders@ntis.gov

                       ii | 2018 Offshore Wind Technologies Market Report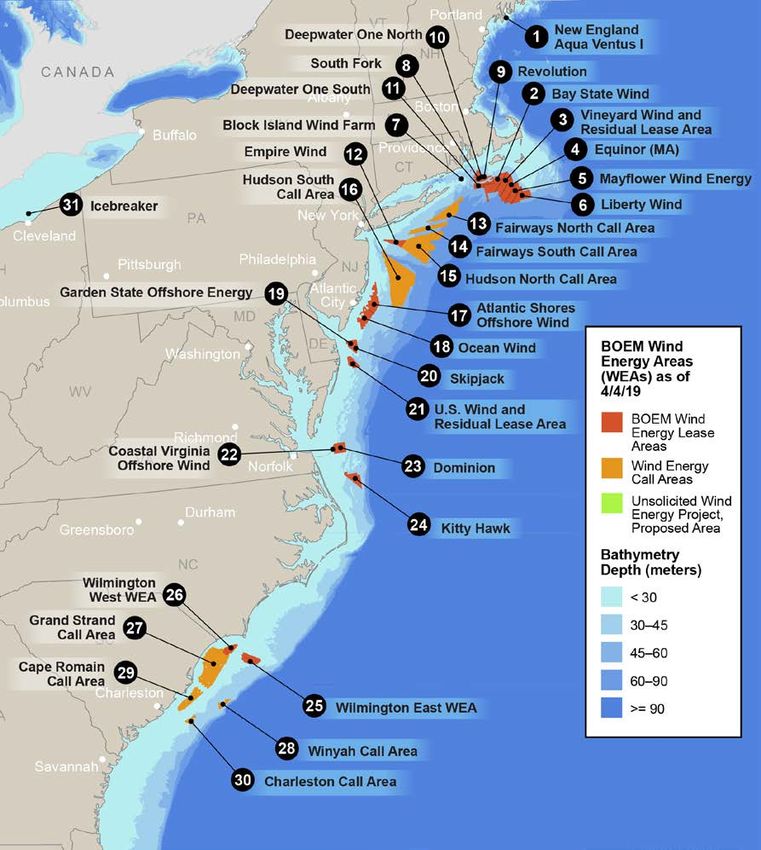
2018 Offshore Wind Technologies Market Report
                                                                    Primary Authors
                                          Walter Musial, National Renewable Energy Laboratory

                                          Philipp Beiter, National Renewable Energy Laboratory

                                                     Paul Spitsen, U.S. Department of Energy

                                        Jake Nunemaker, National Renewable Energy Laboratory
                                       Vahan Gevorgian, National Renewable Energy Laboratory

List of Figures .................................................................................................................................................... iv
List of Tables ...................................................................................................................................................... vi
Acknowledgments ........................................................................................................................................... vii
Nomenclature or List of Acronyms............................................................................................................... viii
Executive Summary .......................................................................................................................................... ix
   U.S. Offshore Wind Energy Market−Key Findings .............................................................................. ix
   Global Offshore Wind Energy Market−Key Findings ......................................................................... xii
   Offshore Wind Energy Technology Trends−Key Findings.................................................................. xii
   Offshore Wind Energy Cost and Price Trends−Key Findings ............................................................. xv
   Future Outlook .................................................................................................................................... xvi
1     Introduction .................................................................................................................................................. 1
      1.1 Approach and Method .................................................................................................................... 2
      1.2 Report Structure.............................................................................................................................. 4
2     U.S. Offshore Wind Market Assessment.................................................................................................. 5
      2.1 U.S. Offshore Wind Industry Overview ......................................................................................... 5
      2.2 U.S. Offshore Wind Market Potential and Project Pipeline Assessment ....................................... 5
      2.3 Regulatory Activity ...................................................................................................................... 14
      2.4 U.S. Offshore Wind Project Offtake and Policy Assessment ....................................................... 17
      2.5 U.S. Infrastructure Trends ............................................................................................................ 20
      2.6 Other Regional Developments...................................................................................................... 21
3     Overview of Global Offshore Wind Development ................................................................................ 23
      3.1 Global Offshore Wind Market ...................................................................................................... 23
      3.2 Offshore Wind Market Projections............................................................................................... 28
      3.3 Floating Offshore Wind Market Trends ....................................................................................... 32
4     Offshore Wind Technology Trends ......................................................................................................... 36
      4.1 Siting Trends for Global Offshore Wind Projects ........................................................................ 36

                                       iii | 2018 Offshore Wind Technologies Market Report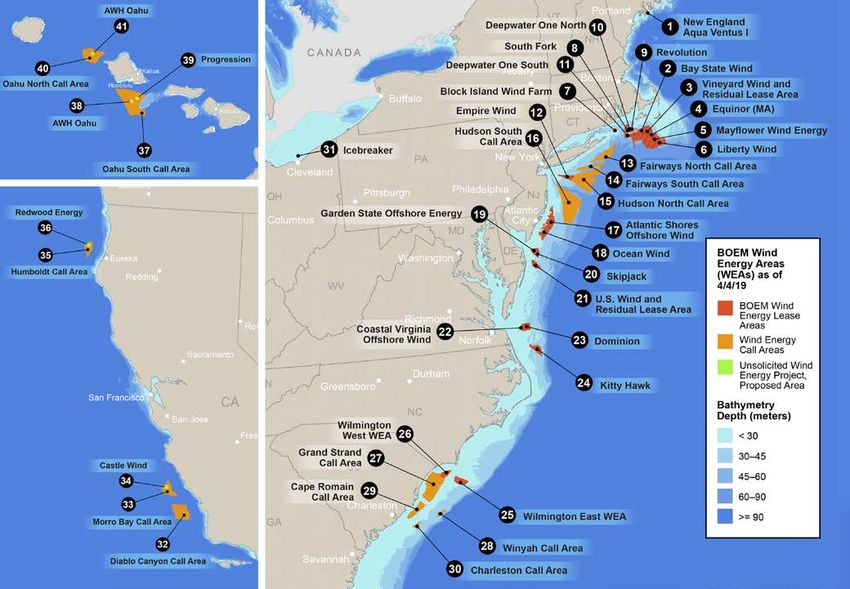
4.2     Offshore Wind Turbines ............................................................................................................... 39
      4.3     Fixed-Bottom Substructures ......................................................................................................... 42
      4.4     Electrical and Power System Technology .................................................................................... 43
      4.5     Floating Technology Trends ......................................................................................................... 47
5     Cost and Pricing Trends .......................................................................................................................... 52
      5.1 Fixed-Bottom Pricing Trends ....................................................................................................... 52
      5.2 Fixed-Bottom Offshore Wind Cost Trends .................................................................................. 57
      5.3 Floating Cost Trends .................................................................................................................... 64
Primary Database Sources ............................................................................................................................ 66
References ....................................................................................................................................................... 66

List of Figures
Figure ES-1. Locations of U.S. offshore wind pipeline activity and Call Areas as of March 2019. Map
    provided by NREL ........................................................................................................................................ x
Figure ES-2. U.S offshore wind market forecasts for annual additions (left axis) and cumulative
    capacity (right axis) through 2030 ......................................................................................................... xi
Figure ES-3. A 6-MW floating wind turbine in Equinor’s 30-MW array near Peterhead, Scotland.
    Photo from Walt Musial, NREL ................................................................................................................ xiv
Figure ES-4. Adjusted strike prices from European offshore wind auctions .......................................... xv
Figure 1. Percentages of U.S offshore wind pipeline (25,824 MW) by classification category .............6
Figure 2. U.S. project pipeline classification by state................................................................................... 7
Figure 3. U.S. project pipeline by state ........................................................................................................... 8
Figure 4. Locations of U.S. Atlantic Coast offshore wind pipeline activity and Call Areas as of March
    2019. Map provided by NREL ................................................................................................................... 9
Figure 5. Locations of U.S. West Coast offshore wind pipeline activity and Call Areas as of March
    2019. Map provided by NREL ................................................................................................................ 10
Figure 6. Locations of Hawaiian offshore wind pipeline activity and Call Areas as of March 2019.
    Map provided by NREL ............................................................................................................................. 11
Figure 7. U.S offshore wind market forecasts (annual additions–left axis) (cumulative capacity
    through 2030–right axis) ........................................................................................................................ 13
Figure 8. U.S. offshore wind lease sale prices to date by year ................................................................ 15
Figure 9. Global offshore wind in 2018 (annual installed capacity–left axis) (cumulative capacity–
    right axis) ................................................................................................................................................... 23
Figure 10. Installed offshore wind capacity by country in 2018 ............................................................. 24
Figure 11. Cumulative offshore wind installed capacity by country ....................................................... 24

                                       iv | 2018 Offshore Wind Technologies Market Report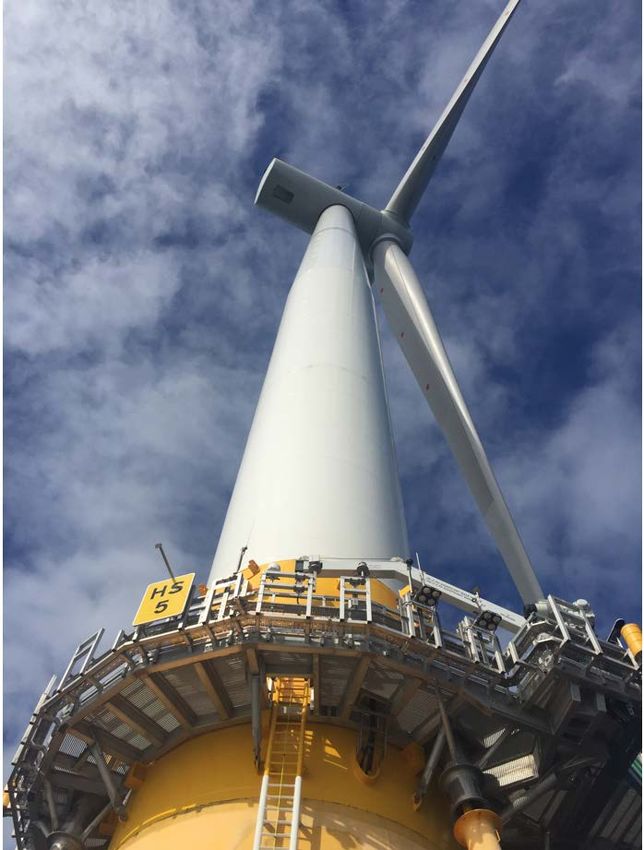
Figure 12. Cumulative installed offshore wind capacity by country over time ..................................... 25
Figure 13. Offshore wind capacity under construction by country as of 2018 ..................................... 29
Figure 14. Developer-announced offshore wind capacity through 2024 for projects with financial
    close ........................................................................................................................................................... 30
Figure 15. Estimated 2024 cumulative offshore wind capacity by country based on a developer-
    announced COD (shaded areas represent forecasted deployments) .............................................. 30
Figure 16. Total global pipeline by status ................................................................................................... 31
Figure 17. Medium-term wind capacity forecasts by country through 2030 ........................................ 32
Figure 18. Global floating offshore wind pipeline...................................................................................... 33
Figure 19. Fixed-bottom offshore wind project depths and distance to shore ..................................... 36
Figure 20. Project distance from shore trend to 2024 ............................................................................. 38
Figure 21. Project depth trend to 2024 ...................................................................................................... 38
Figure 22. Offshore wind turbine rating, hub height, and rotor diameter.............................................. 39
Figure 23. Average commercial offshore wind turbine rating compared to prototype deployment by
    year ............................................................................................................................................................. 41
Figure 24. Offshore wind turbine manufacturers by market share for 2018 (left) and future (right)42
Figure 25. Offshore wind substructure technology trends in 2018 ........................................................ 43
Figure 26. Number of turbines energized by supplier in 2018. Chart courtesy of WindEurope 2019 . 44
Figure 27. Share of energized export cables by supplier in 2018. Chart courtesy of WindEurope 2019
    .................................................................................................................................................................... 45
Figure 28. Near-shore offshore wind power plant operating with the land-based BESS. Illustration by
    NREL .......................................................................................................................................................... 46
Figure 29. Capacity-weighted average of floating substructure selection for the global pipeline ..... 48
Figure 30. A 6-MW floating wind turbine in Equinor’s 30-MW array near Peterhead, Scotland,
    supported by a spar buoy floating platform. Photo courtesy of Walt Musial, NREL ....................... 49
Figure 31. Second-generation floating wind concepts of alternative hybrid substructures. Images
    courtesy of Stiesdal Offshore Technologies (left) and SBM Offshore (right) ........................................ 49
Figure 32. Adjusted strike prices from U.S. and European offshore wind auctions. Reprinted from
    Beiter et al. (2019) ..................................................................................................................................... 52
Figure 33. Global LCOE estimates for fixed-bottom offshore wind ......................................................... 57
Figure 34. Capital expenditures of global offshore wind projects by commercial operation date and
    project capacity ........................................................................................................................................ 58
Figure 35. Turbine CapEx trend estimates.................................................................................................. 60
Figure 36. Global LCOE estimates for floating technology....................................................................... 64

                                        v | 2018 Offshore Wind Technologies Market Report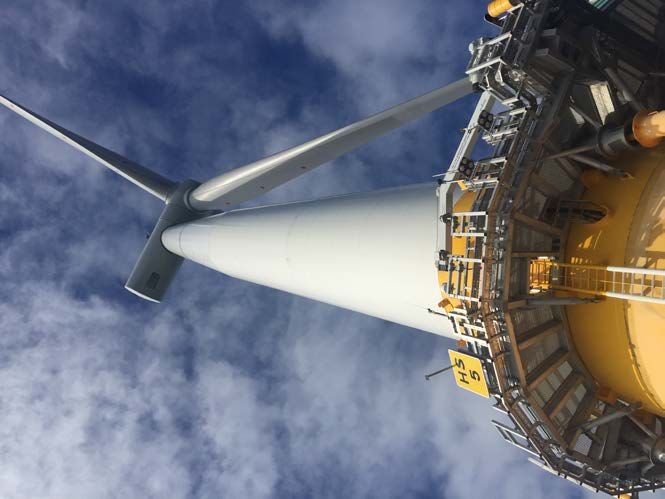
List of Tables
Table 1. Offshore Wind Project Pipeline Classification Criteria..................................................................4
Table 2. U.S. Offshore Wind Pipeline Capacity for Five Categories............................................................6
Table 3. 2018 U.S. Offshore Wind Pipeline ................................................................................................ 12
Table 4. BOEM’s Massachusetts Offshore Wind Auction Results from December 2018 ................... 14
Table 5. 2018 BOEM Offshore Wind Call Areas ......................................................................................... 15
Table 6. U.S. Offshore Wind Offtake Agreements as of June 10, 2019 ................................................. 17
Table 7. Current U.S. Offshore Wind State Policies and Activity as of June 10, 2019......................... 18
Table 8. Ports with Recent Investments for the U.S. Offshore Wind Industry ....................................... 20
Table 9. European Projects Installed and Grid Connected in 2018 ........................................................ 26
Table 10. Asian Projects Installed and Grid Connected in 2018 ............................................................ 27
Table 11. Current Floating Offshore Wind Projects in Pipeline ............................................................... 33
Table 12. Vineyard Wind LLC/EDC PPA Contract Terms .......................................................................... 54
Table 13. Offshore Wind Auctions During 2018 ........................................................................................ 56
Table 14. Typical Financing Conditions for European Offshore Wind Projects ..................................... 61
Table 15. ITC Phase-Down Rate Schedule .................................................................................................. 63

                                 vi | 2018 Offshore Wind Technologies Market Report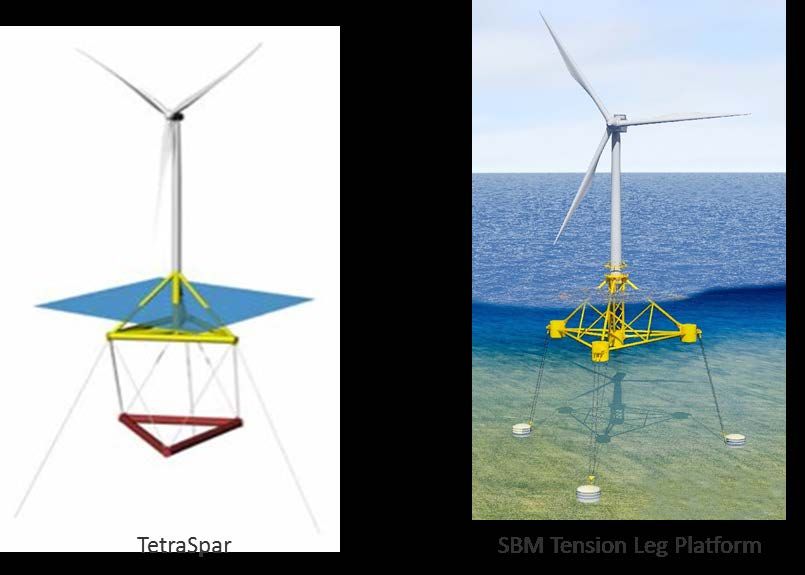
Acknowledgments
This work was supported by the U.S. Department of Energy (DOE) under Contract No. DE-AC36-08GO28308
with the National Renewable Energy Laboratory (NREL). Funding for the work was provided by the DOE
Office of Energy Efficiency and Renewable Energy Wind Energy Technologies Office. The report was
reviewed by a diverse group of offshore wind industry stakeholders including four developers, three wind
turbine manufacturers, two state government representatives, one nongovernmental organization, seven
internal Office of Energy Efficiency and Renewable Energy staff, three NREL management staff, four
consultants, and three regulators. The authors would like to extend thanks to Patrick Gilman and Gary Norton
(contractor) from the DOE Wind Energy Technologies Office for supporting this research. Thanks also to
Valerie Reed, Liz Hartman, Rich Tusing, Dan Beals, and Alana Duerr of the DOE Wind Energy Technologies
Office for their support and strategic guidance.

The authors would like to thank the following reviewers and contributors from NREL including Brian Smith,
Paul Veers, and Eric Lantz (NREL).

This report covers a wide range of industry projects, policies, and past reports that the authors have
documented with extensive support from a diverse group of peer reviewers. These experts and stakeholders
include Tom Harries (Bloomberg New Energy Finance), Darryl Francois and Stephen Boutwell (Bureau of
Ocean Energy Management), James Glennie (Danish Trade Council/Embassy), Stephanie McClellan
(Delaware Special Initiative on Offshore Wind and Renewable Consulting Group and Renewables Consulting
Group), Knut Aanstad (Equinor), Albert Fisas (GE), Nils Bolgen (Massachusetts Clean Energy Center), Jason
Folsom (MHI/Vestas), Nathanael Greene (National Resources Defense Council), Anne Marie McShea (New
Jersey Board of Public Utilities), Gavin Smart (ORE Catapult), Kris Ohleth (Ørsted), Aaron Smith and Loris
Canizares (Principle Power Inc.), and Fergus Costello and Soeren Daugaard (Siemens Gamesa).

Editing was provided by Sheri Anstedt (NREL) and graphics and cover design were created by John Frenzl
(NREL). Additional communications and coordination were provided by Alex Lemke (NREL), Kiki Carpenter
(NREL), Tiffany Byrne (NREL), and Carol Laurie (NREL).

                         vii | 2018 Offshore Wind Technologies Market Report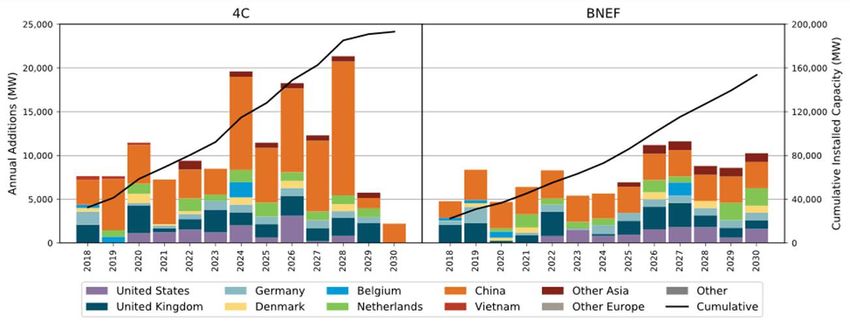
Nomenclature or List of Acronyms
AC                        alternating current
BESS                      battery energy storage system
BNEF                      Bloomberg New Energy Finance
BOEM                      Bureau of Ocean Energy Management
BPU                       Board of Public Utilities
CapEx                     capital expenditures
CIP                       Copenhagen Infrastructure Partners
COD                       commercial operation date
DOE                       U.S. Department of Energy
EDF                       Électricité de France Renouvelables
EDPR                      Energias de Portugal Renováeis
EnBW                      Energie Baden-Württemberg AG
GW                        gigawatt
HVDC                      high-voltage direct current
IEC                       International Electrotechnical Commission
IRENA                     International Renewable Energy Agency
ITC                       investment tax credit
kV                        kilovolt
km                        kilometer
LEEDCo                    Lake Erie Energy Development Corporation
Berkeley Lab              Lawrence Berkeley National Laboratory
LCOE                      levelized cost of energy
m                         meter
MW                        megawatt
MWh                       megawatt-hour
nm                        nautical mile
NOAA                      National Oceanic and Atmospheric Administration
NREL                      National Renewable Energy Laboratory
NYSERDA                   New York State Energy Research and Development Authority
O&M                       operation and maintenance
OEM                       original equipment manufacturer
OpEx                      operational expenditures
OREC                      offshore renewable energy certificate
OWDB                      offshore wind database
PPI                       Principle Power Inc.
PPA                       power purchase agreement
REC                       renewable energy certificate
RPS                       renewables portfolio standard
s                         second
SIOW                      Special Initiative on Offshore Wind
TBD                       to be determined
WEA                       wind energy area

               viii | 2018 Offshore Wind Technologies Market Report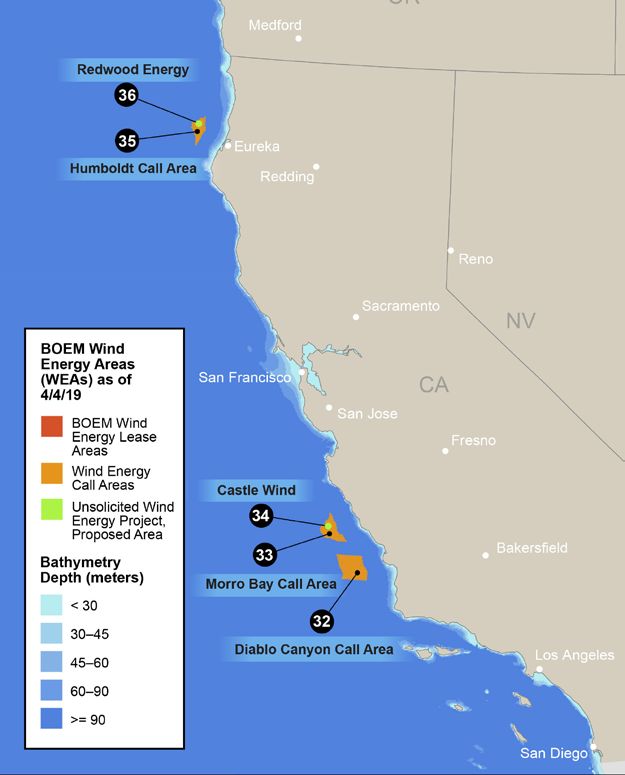
Executive Summary
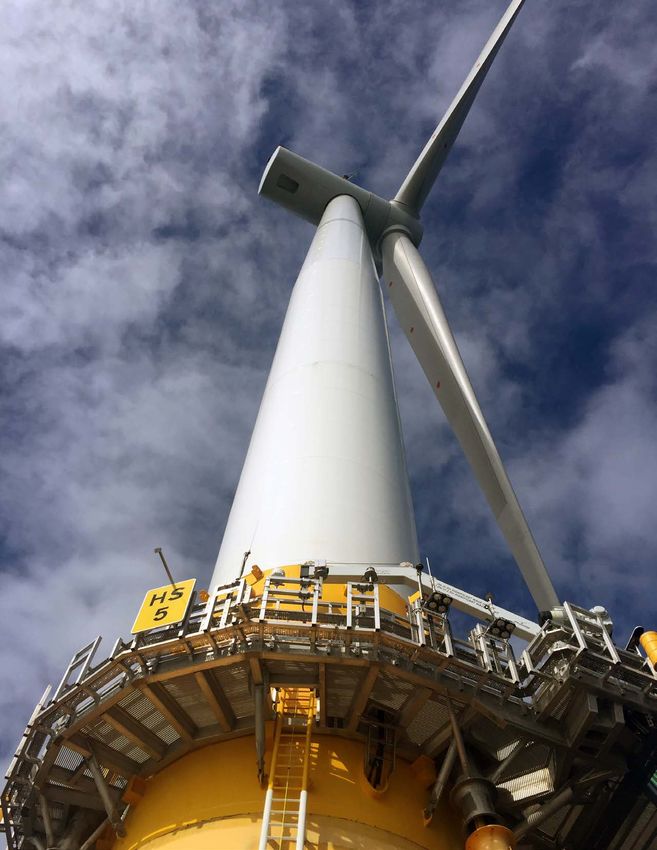
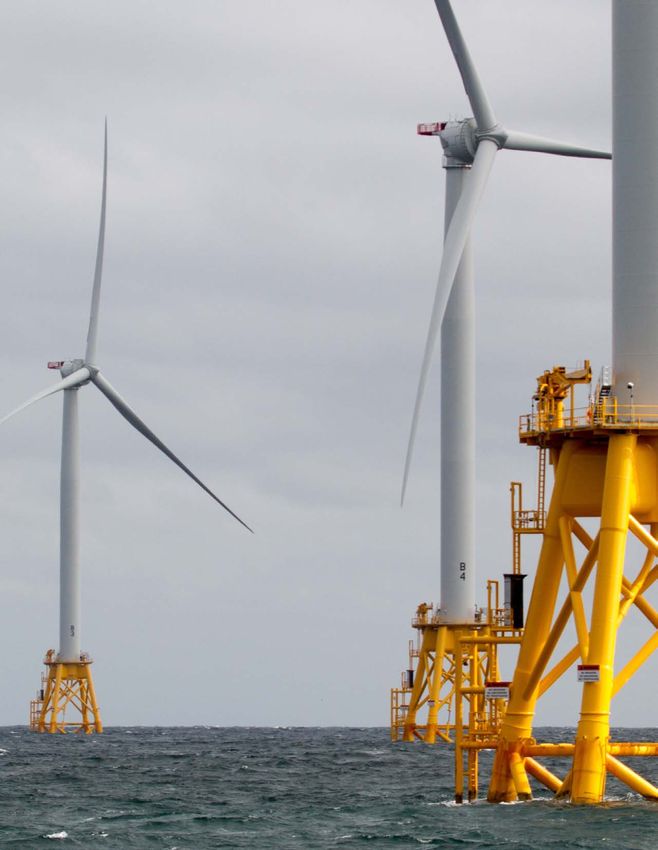
Offshore wind energy is a rapidly growing global industry that creates electricity from wind turbines installed
in coastal waters on either rigid or floating substructures anchored to the seabed or lake bottom. The 2018
Offshore Wind Technologies Market Report was developed by the National Renewable Energy Laboratory
(NREL) with support from the U.S. Department of Energy (DOE) and is intended to provide offshore wind
policymakers, regulators, developers, researchers, engineers, financiers, supply chain participants, and other
stakeholders with up-to-date quantitative information about the offshore wind market, technology, and cost
trends in the United States and worldwide. This report provides detailed information on the domestic offshore
wind industry to contextualize the U.S. market and help policymakers, researchers, and the general public
understand technical and market barriers and opportunities. Globally, the scope of the report covers the status
of the 176 operating offshore wind projects through December 31, 2018, and provides the status of, and
analysis on, a broader global pipeline of 838 projects in various stages of development. 1 To provide the most
up-to-date discussion of this dynamically evolving industry, this report also tracks the most significant
domestic developments and events from January 1, 2018, through March 31, 2019. The following is a
summary of the key offshore wind market findings.
U.S. Offshore Wind Energy Market−Key Findings
The U.S. offshore wind energy project development and operational pipeline 2 grew to a potential
generating capacity of 25,824 megawatts (MW), with 21,225 MW under exclusive site control. 3 The
overall size of the U.S. offshore wind pipeline grew from 25,464 MW to 25,824 MW in 2018—about 1.4%
growth. The 25,824 MW that make up the U.S. offshore wind project development and operating pipeline
comprise one operating project (Block Island Wind Farm), eight projects that have reached the permitting
phase with either a construction and operations plan or a viable offtake mechanism for sale of electricity, 15
commercial lease areas in federal waters with exclusive site control, two unleased wind energy areas, and five
projects (all Pacific-based) that have submitted unsolicited applications to the Bureau of Ocean Energy
Management (BOEM), 4 the government agency that regulates energy development in federal waters. The
pipeline has three projects located in state waters, including the operating Block Island Wind Farm, the Aqua
Ventus I floating-wind project in Maine, and the Lake Erie Energy Development Corporation Icebreaker Wind
project on Lake Erie. In addition, there is one BOEM research lease in Virginia federal waters.
Offshore wind project development and regulatory activities span multiple U.S. regions. Historic
development and regulatory activities were concentrated in the North Atlantic region from Virginia northward.
New offshore wind activities have been initiated in the Pacific, Great Lakes, and South Atlantic regions as
well. In the past, there have been project proposals and leasing activity in the Gulf of Mexico that have been
limited to Texas state waters, but in 2018 offshore wind development and regulatory activity in this region was
inactive. Figure ES-1 shows a map of offshore wind pipeline activity as of March 31, 2019, as well as BOEM
Call Areas, for the entire United States.
1 Note that the 2016 Offshore Wind Technologies Market Report covered operating projects through June 30, 2017, with a focus on developments in 2016
and the first half of 2017 (Musial et al. 2017).
2 The project development and operational pipeline, commonly referred to as “the pipeline,” is represented by the database that the National Renewable
Energy Laboratory uses to monitor the progress of the commercial offshore wind industry. It includes sites under development as well as operating
projects. In the United States, the pipeline does not include Call Areas because their boundaries are not fixed. Unleased wind energy areas in the United
States are included because they have a defined area.
3 Federal law requires the Bureau of Ocean Energy Management to conduct a fair public auction for offshore wind sites in which there is interest from
more than one developer (i.e., “competitive interest”). A developer cannot proceed until they have been awarded exclusive rights to the site through the
competitive auction process.
4
A lease area is a parcel of ocean area that is auctioned to prospective developers. Wind energy areas can comprise one or more lease areas. A Call Area is
a precursor to a wind energy area.
ix | 2018 Offshore Wind Technologies Market Report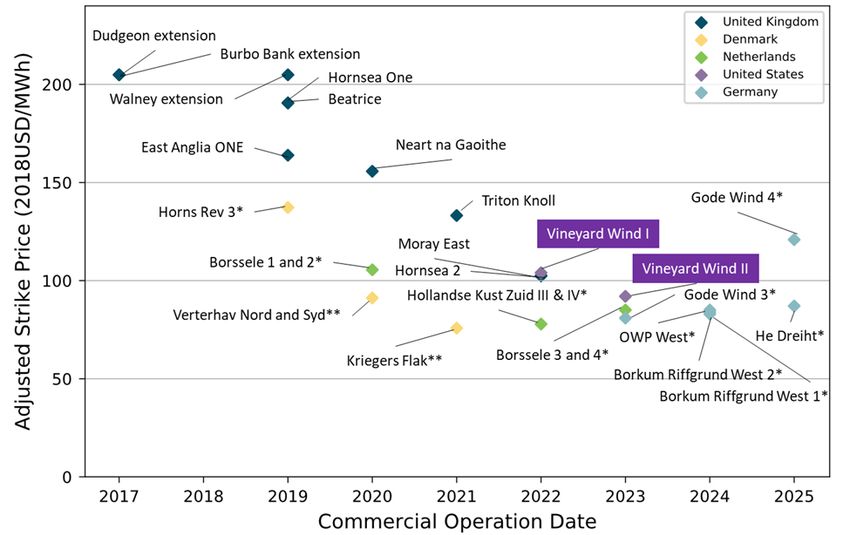
State-level policy commitments accelerated, driving increased market interest. At the end of 2017, U.S.
offshore state wind procurement policies totaled over 5,300 MW targeted for deployment by 2030. By early
2019, the sum of official state offshore wind capacity commitments increased to 19,968 MW by 2035. In 2018,
new commitments were added in Massachusetts (additional 1,600 MW authorized by 2035), New York (6,600
MW added by 2035), and New Jersey (2,400 MW added by 2030), while Connecticut and Rhode Island both
agreed to purchase power from Ørsted’s 600-MW Revolution project. In 2019, new policy commitments were
enacted in Connecticut (2,000 MW) and Maryland (1,200 MW). In some states without offshore-wind-specific
targets, like California and Hawaii, 100% renewables portfolio standards and carbon reduction policies are
driving these markets, which are progressing toward the creation of new offshore wind lease areas.

 Figure ES-1. Locations of U.S. offshore wind pipeline activity and Call Areas as of March 2019. Map provided by NREL

Increased U.S. market interest spurred strong competition at offshore wind lease auctions. BOEM
auctioned a total of 1,573 square kilometers (km2), an area about half the size of Rhode Island, in three
adjacent offshore wind lease areas off Massachusetts in December 2018. Each winner (Equinor, Mayflower
Wind, and Vineyard Wind) submitted a bid of $135 million, more than tripling the previous lease area sale
price record for a single lease area of $42 million in 2016 for the New York lease area submitted by Equinor.
Higher offshore wind lease sale prices indicate 1) increased confidence in future market growth driven by state
policies, 2) confidence in the regulatory and financial institutions to support offshore wind project
development in the nascent U.S. market, 3) continued cost reductions, and 4) heightened demand for offshore
wind in the northeastern United States.

                            x | 2018 Offshore Wind Technologies Market Report
Several U.S. projects advanced in the development process. U.S. offshore wind market progress was more
evident from the advancement of major projects in the pipeline in 2018 than the capacity growth of the
pipeline. Most notably, the commercial-scale Vineyard Wind project and Ørsted’s Revolution project
negotiated electricity sale offtake agreements with major electric distribution companies and utilities and took
major steps in permitting at both the state and federal level. Overall, in the United States, four projects have
submitted construction and operations plans, nine projects have had site assessment plans approved, and six
have signed power offtake agreements. Vineyard Wind and South Fork are the most advanced commercial-
scale U.S. projects, having both obtained a power purchase agreement (PPA) and completed state permits and
site surveys, with a construction and operations plan under review by BOEM. Vineyard Wind reports a
commercial operation date of 2022 for their Phase 1 facility, consisting of the first 400 MW.
Industry forecasts suggest U.S. offshore wind capacity could grow from 11 to 16 gigawatts (GW) by
2030. Figure ES-2 shows three industry forecasts for offshore wind deployment in the United States for the
period extending to the year 2030. These estimates were developed by Bloomberg New Energy Finance
(BNEF 2018a), 4C Offshore (2018), and University of Delaware’s Special Initiative on Offshore Wind (SIOW
2019),5 respectively. Together, they illustrate the degree of possible market growth as well as the potential
variability associated with future deployment.
Figure ES-2. U.S offshore wind market forecasts for annual additions (left axis) and cumulative capacity (right axis)
through 2030
Offtake prices for the first commercial-scale offshore wind project in Massachusetts were lower than
expected. On July 31, 2018, Massachusetts electric distribution companies and Vineyard Wind LLC
negotiated a PPA for delivery of offshore-wind-generated electricity at a first-year price of $74/megawatt-hour
(MWh) (2022$) for Phase 1 (400 MW) and $65/MWh (2023$) for Phase 2 (400 MW). An NREL study
showed that these PPA prices may not accurately reflect the true cost of the project at face value because other
revenue sources, such as the investment tax credit, are not accounted for (Beiter et al. [2019]; see Section 5).
Nevertheless, this price was lower than expected given the presumed risks associated with building the first
U.S. commercial project with an immature U.S. supply chain. Vineyard Wind’s apparent ability to access
relatively low-cost financing and take advantage of the waning federal investment tax credit helped them set a
competitive benchmark for the U.S. offshore wind industry. The Vineyard Wind PPA price provides a
reference point for commercial-scale offshore wind generation in the United States that falls within the price
5
Please note University of Delaware’s SIOW forecast is based on the expected date a state selects to procure offshore wind capacity. A 3-year time lag is
assumed from the time the procurement occurs until the project becomes fully operational.
xi | 2018 Offshore Wind Technologies Market Reportrange of European offshore wind projects scheduled to begin commercial operations in the early- to mid-
2020s. Additional commercial price points are anticipated in New York and New Jersey in 2019.
Attention to offshore wind in California increased in 2018. California passed Senate Bill 100, The 100
Percent Clean Energy Act of 2018, making it the largest state to establish a 100% electric renewable energy
goal, and setting a carbon-free target year of 2045. Amid continued negotiations with the U.S. Department of
Defense, on October 18, 2018, BOEM published a Call for Information and Nominations and received 14
nominations from companies interested in commercial wind energy leases within three proposed Call Areas off
central and northern California. All together, these three Call Areas total approximately 2,784 km2 (687,823
acres), which could support an offshore-wind-generating capacity for nascent floating wind technology of up
to 8.4 GW.
New national technical research consortium was launched to spur innovation. DOE has committed $20.5
million to the New York State Energy Research and Development Authority to form a National Offshore Wind
R&D Consortium. The New York State Energy Research and Development Authority agreed to match the
DOE contribution and launched a funding organization to make research and development awards on
prioritized topics that will support developers in achieving their near-term deployment and cost targets. The
first solicitation was released on March 29, 2019, and the first awards are expected in 2019.
Global Offshore Wind Energy Market−Key Findings
Globally, industry installed a record 5,652 MW of offshore wind capacity in 2018. Annual capacity
additions increased by more than 50% relative to 2017. The increase in global generating capacity can be
attributed to increased deployment in China, with 2,652 MW of new capacity, followed by 2,120 MW
commissioned in the United Kingdom, 835 MW in Germany, 28 MW in Denmark, and about 17 MW divided
among the rest of the world. By the end of 2018, cumulative global offshore wind installed capacity grew to
22,592 MW from 176 operating projects. Projections indicate 2019 global capacity additions will be even
higher based on projects currently under construction. As of December 31, 2018, the global pipeline for
offshore wind development capacity was about 272,000 MW.
The pace of European auctions slowed in the second half of 2018, but forecasts show sustained industry
growth. European auction strike prices 6 in 2018 validated earlier cost reduction trends (see Section 5) but the
number of auctions decreased, with only three occurring in the first two quarters of 2018. Adjusted strike
prices 7 for these auctions ranged from $74/MWh to $79/MWh for commercial-scale projects. The slowdown
can be partially attributed to the depletion of viable grid connections in the German markets (Foxwell 2018a).
However, long-term forecasts indicate that this trend may be temporary as global offshore wind capacity is
projected to reach between 154 and 193 GW by 2030, with more than 50% coming from Europe (and another
major fraction coming from China).
Offshore Wind Energy Technology Trends−Key Findings
Industry is seeking accelerated cost reductions through larger turbines with rated capacities of 10 MW
and beyond. Through technology innovation, turbine original equipment manufacturers have been able to
limit the rise in turbine cost ($/kilowatt) and manage the increase in mass (kilogram/kilowatt) to allow turbine
growth to continue upward to at least 12 MW, if not 15 MW, in the next decade. There are no indications that
6 The strike price for an offshore wind project from an auction is usually the lowest bid price at which the offering can be sold. It usually covers a specific
contract term for which that strike price will be paid for the energy produced. The offeror of that strike price is awarded the rights to develop a particular
parcel under predetermined conditions set in the tender offer that may vary by country or market. It should not be confused with levelized cost of energy,
which may be calculated using different financing and cost assumptions.
7 The strike prices were adjusted to enable comparisons among projects in different countries to consider a range of possible subsidies and benefits that are
available to some projects, such as the cost of the electrical grid connections.
xii | 2018 Offshore Wind Technologies Market Reportturbine growth is slowing or has reached a limit for offshore wind. Although the market has experienced a
steady upgrade of turbine drivetrain nameplate generating capacity, turbine rotor diameters have grown more
slowly. The Vestas V174-9.5 is currently the largest machine in the commercial market (Richard 2019).
However, the next generation of turbines promises larger rotors and lower specific power ratings 8 suited for
U.S. offshore markets in the next few years. Specific examples of next-generation turbines include Siemens
Gamesa SG 10.0–193DD turbine announced in January 2019, which is planned by Siemens Gamesa to be
market ready by 2022, and the GE Haliade-X 12-MW turbine, which should arrive on the market by 2021
(Siemens 2019; GE 2018b).
Adoption of 66-kV(kilovolt) array cables is increasing to lower electrical infrastructure costs. As the
rated power capacity of offshore wind turbines continues to grow, project developers and operators are
increasing their use of 66-kV array cable technology instead of the conventional 33-kV systems to connect
individual turbines within an array. In 2018, three projects incorporated 66-kV array cables versus only one in
2017. Operation at a higher voltage offers important life cycle cost-efficiency benefits, such as the possibility
of reducing the number of offshore substations, decreasing the overall length of installed cables, and
minimizing electric losses. During 2018, the 66-kV technology was demonstrated by Nexans in three pilot
wind power plant projects: the Blyth Offshore Demonstrator (United Kingdom), Nissum Bredning Vind
(Denmark), and Aberdeen Bay (United Kingdom).
The floating wind energy project pipeline is growing, with multiple floating pilot projects advancing.
The global pipeline for floating offshore wind energy reached 4,888 MW in 2018. The pipeline comprises 38
announced projects, including 46 MW of operating projects. The floating offshore wind energy industry is well
into a second-generation, multiturbine, precommercial pilot phase. There are 14 projects representing
approximately 200 MW that are currently under construction, having achieved either financial close or
regulatory approval. These projects are distributed over nine countries. Figure ES-3 shows a turbine in
Equinor’s 30-MW floating array off the coast of Peterhead, Scotland—the world’s first commercial floating
wind energy project—which is now operating into its second year.
8 Specific power is the ratio of the nameplate rating of the turbine divided by the rotor’s swept area and is given in Watts per meter squared.
xiii | 2018 Offshore Wind Technologies Market ReportFigure ES-3. A 6-MW floating wind turbine in Equinor’s 30-MW array near Peterhead, Scotland.
Photo from Walt Musial, NREL
xiv | 2018 Offshore Wind Technologies Market ReportSemisubmersible substructures dominate the market for floating support structures, but new hybrid
platform technologies are being introduced that could compete in future projects. Semisubmersibles,
which use buoyancy and the water plane area to achieve stability, make up 94% of floating projects on a
capacity-weighted average because they are inherently a stable buoyant floating substructure with low draft
that allows for in-port or nearshore assembly. Several new hybrid technologies (platforms that combine the
characteristics of spars, tension-leg platforms and semisubmersibles) are being introduced this year that may
rival these substructures. Stiesdal Offshore Technologies’s TetraSpar and the SBM tension leg platform are
highlighted in Section 4 and may be deployed as early as 2019.
Offshore Wind Energy Cost and Price Trends−Key Findings
Offshore wind auction strike prices in 2018 validate current cost reduction trends. Prices from European
offshore wind auctions and PPAs in 2018 help validate the previously documented trends indicating prices
dropping from approximately $200/MWh for projects beginning operation between 2017 and 2019 to
approximately $75/MWh for projects beginning operation between 2024 and 2025. In the United States,
Vineyard Wind LLC signed two PPAs with Massachusetts electric distribution companies in July 2018 for a
combined 800 MW of offshore wind capacity expected to become operational in 2022 and 2023, respectively.
After adjusting for contract type, transmission, policy, and access to external revenue, the Vineyard Wind
project has an all-in price of $98/MWh. The Vineyard Wind price point indicates that U.S. projects may not be
subject to a large price premium because of nascent U.S. market structures or a limited domestic supply chain.
Figure ES-4 indicates the adjusted Vineyard Wind PPA prices are competitive with European offshore wind
prices.
Figure ES-4. Adjusted strike prices from European offshore wind auctions
Sources: 4C Offshore (2018, 2019) and Beiter et al. 2019
Notes: *Grid and development costs added; **Grid costs added and contract length adjusted
xv | 2018 Offshore Wind Technologies Market ReportFuture Outlook
Offshore wind market projections show accelerated growth in the next decade, with cumulative capacity
ranging from 154 to 193 GW by 2030, and long-range predictions of over 500 GW by 2050 (BNEF 2018a; 4C
Offshore 2018; International Renewable Energy Agency 2018). In this context, offshore wind is still at an
early stage with respect to the maturity of the technology, supply chain, and infrastructure. The pace of
progress and development of the global supply chain is likely to be strongly influenced in the near term by the
growth in turbine generating capacity, rising toward 15 MW. Although larger turbines improve project costs in
the long run, they may also delay industry maturity. It may take several years for the corresponding industrial
facilities and infrastructure needed for fabrication, installation, and maintenance to stabilize at ever-increasing
turbine scales. This upscaling issue is likely to persist not only in the United States but globally as well.
In the United States, individual states may continue to push for greater commitments for offshore wind, but
further declines in offshore wind offtake prices are far from certain in the near term. Offshore wind projects,
such as Vineyard Wind, will be able to take advantage of the expiring investment tax credit (see Section
5.1.1.), which will enable low prices (on par with Europe) for the first commercial solicitation in
Massachusetts. However, as the investment tax credit expires in 2020, projects will have to make up the
difference by raising prices or lowering costs. This may increase the urgency to implement near-term solutions
to manage costs, such as developing U.S.-flagged Jones-Act-compliant vessels or accelerating the growth and
maturity of the domestic manufacturing supply chain (see Section 4).
If demand for offshore wind energy continues to increase in states along the U.S. Atlantic and Pacific coasts,
as it did in 2018, state policy commitments that are now almost 20 GW could exceed the capacity of the
available sites. Presently, there is just over 21 GW of capacity in BOEM lease areas where developers have
been granted exclusive site control. Additional state policy commitments may create possible site shortages in
some regions, which could trigger the development of more lease areas.
xvi | 2018 Offshore Wind Technologies Market Report1 Introduction
Offshore wind energy is a rapidly growing global industry that creates electricity from large wind turbines
installed in coastal waters on either rigid or floating substructures anchored to the seabed or lake bottom. The
2018 Offshore Wind Technologies Market Report was developed by the National Renewable Energy
Laboratory (NREL) for the U.S. Department of Energy (DOE) to provide offshore wind policymakers,
regulators, developers, researchers, engineers, financiers, and supply chain participants with up-to-date
quantitative information about the offshore wind market, technology, and cost trends in the United States and
worldwide. This report includes detailed information on the domestic offshore wind industry to provide
context to help navigate technical and market barriers and opportunities. It also covers the status of the 176
operating offshore wind projects in the global fleet through December 31, 2018, and provides the status and
analysis on a broader global pipeline of 838 projects at varying stages of development. In addition, this report
provides a deeper assessment of domestic developments and events through March 31, 2019, for this
dynamically evolving industry.
This report includes data, obtained from a wide variety of sources about offshore wind projects that are both
operating and under development, to offer current and forward-looking perspectives. It is a companion to the
2018 Wind Technologies Market Report and 2018 Distributed Wind Market Report funded by DOE and
written by the Lawrence Berkeley National Laboratory (Berkeley Lab) (Wiser et al. 2019) and Pacific
Northwest National Laboratory (Orrell et al. 2019), respectively. The reports cover the status of utility-scale
and distributed, land-based wind energy located primarily in the United States, and provide quantitative,
independent data for use by the wind industry and its various stakeholders.
Global offshore wind deployment in 2018 set a new record for a single year (5,652 megawatts [MW]), and
optimism for the future is high, with long-term industry projections of over 150 gigawatts (GW) by 2030 and
over 500 GW by 2050 (Bloomberg New Energy Finance [BNEF] 2018b; 4C Offshore 2018; International
Renewable Energy Agency [IRENA] 2018). However, 2018 was somewhat unusual by historical standards as
the Chinese market saw its largest deployment ever, with over 2,600 MW of new installations. Offshore wind
in Europe installed 2,994 MW, representing about 50% of the new installed capacity.
The offshore wind market in the United States evolved rapidly in 2018 because of a series of positive global
and domestic market growth indicators. After bids for a few offshore wind projects in Europe reinforced
developers’ confidence of zero-subsidy projects in some markets, the United States also saw low-price signals
from its first commercial project. In 2018, the U.S. market logged the first competitive bid for an 800-MW
commercial wind power plant—Vineyard Wind—in Massachusetts, which seemed to indicate that European
market prices can be achieved in the northeastern United States for projects commissioned as early as 2022.
The possibility of achieving European offshore wind price levels in U.S. waters coincided with a new wave of
state policy support for offshore wind, which originally began in 2016, but increased in late 2018 through the
present day. Several new states made offshore wind commitments in 2018, whereas several of the already-
committed states aggressively increased their commitments (McClellan 2019). In addition, market optimism
likely helped drive lease area auction prices to record highs, as observed in the Massachusetts wind energy
area (WEA) lease sales in December 2018 ($135 million per lease area), which were each three times higher
than the previous winning lease area bid in New York just 2 years earlier. These record-high prices may
indicate a heightened demand for new WEAs as well as an increase in the financial caliber of the bidders, as
new members of well-capitalized oil companies and utilities try to establish themselves as offshore wind
developers in the emerging U.S. market. All told, the U.S. market developments in 2018 appear to be laying
the groundwork for the formation of a new multibillion-dollar offshore wind industry that is likely to bear fruit
in the next 5 to 10 years (BNEF 2018a; 4C Offshore 2018; McClellan 2019).
The data and information in this report provide insight into the domestic and global market status, technology
trends, and costs, and are key inputs to the annual Cost of Wind Energy Review report, which provides an
1 | 2018 Offshore Wind Technologies Market Reportupdated summary of the cost of land-based and offshore wind energy in the United States to support DOE’s
programmatic reporting on the cost of wind energy (Stehly et al. 2017, 2018).
1.1 Approach and Method
1.1.1 NREL Offshore Wind Database
The 2018 Offshore Wind Technologies Market Report uses NREL’s internal offshore wind database (OWDB),
which contains information on more than 1,700 offshore wind projects located in 49 countries and totaling
approximately 623,329 MW of announced project capacity (both active and dormant). The database includes
both fully operational projects dating back to 1990 and anticipated future projects that may or may not have
announced their commercial operation date (COD). The OWDB contains information on project characteristics
(e.g., water depth, wind speed, distance to shore), economic attributes (e.g., project- and component-level costs
and performance), and technical specifications (e.g., component sizes and masses). The database also contains
information on installation and transport vessels, as well as ports used to support the construction and
maintenance of offshore wind projects.
The OWDB is built from internal research using a wide variety of data sources including peer-reviewed
literature, press releases, industry news reports, manufacturer specification sheets, subscription-based industry
databases, and global offshore wind project announcements. Unless stated otherwise, the data analysis in this
report—both globally and domestically—is derived by NREL from the OWDB and reflects the best judgment
of the authors and industry subject matter experts that were consulted. To ensure accuracy, NREL verified the
OWDB against the following sources:
• The 4C Offshore Wind Database
• The Bureau of Ocean Energy Management (BOEM)
• The WindEurope Annual Market Update
• BNEF’s Renewable Energy Project Database
• The University of Delaware’s Special Initiative on Offshore Wind (SIOW).
Although the data were validated and harmonized with these other sources, minor differences in their
definitions and methodology may cause the data in this report to vary from data reported in other published
reports. For example, the method for counting annual capacity additions often varies among different sources,
because of terms such as “installed” or “operational,” and “first power” or “commercial operation date” are
defined differently. NREL considers a project to be commercially operational when all turbines are fully
operational and transmitting power to a land-based electricity grid (see Table 1). Data may also vary in quality
and are subject to high levels of uncertainty, especially data for future projects that are subject to change based
on developer and regulatory requirements. Despite annual variability and potential future project-level
uncertainty, longer-term trends reported elsewhere are consistent with long-term market trends in NREL’s
OWDB.
Cost and pricing data in the OWDB span a lengthy time period and are reported in different currencies. To
analyze these data, all information in this report were normalized into 2018 U.S. dollars (USD) by:
• Converting costs and prices to USD, using the exchange rate for the year in which the latest data were
reported (United States Treasury Bureau of Fiscal Service 2019)
• Inflating the values, which are in nominal USD after the exchange rate conversion, to 2018 USD using
the U.S. Consumer Price Index (United States Department of Labor Bureau of Statistics 2019).
2 | 2018 Offshore Wind Technologies Market Report1.1.2 Classification of Project Status
The “pipeline” is an offshore wind project development and operating project tracking process, which provides
the ability to follow the status of a project from early-stage planning through decommissioning. The primary
tracking method is aligned with the regulatory process. All offshore wind projects must navigate through the
regulatory process that formally begins when a regulator initiates a leasing process to offer developers the
opportunity to bid for site control through a competitive lease auction 9 or when an unsolicited project
application is formally submitted. In parallel with the regulatory process is the developer’s efforts to
characterize the economic viability of the project and its capability for long-term energy production to obtain
financing. The parallel regulatory and financing pathways have several dependencies, but information about
the regulatory path is more easily accessed in the public domain and is therefore the primary method used to
track projects in this report. Therefore, the “pipeline” is defined as the set of all offshore wind projects,
beginning with those that have formally entered the regulatory leasing process to bid for site control and
development rights through projects that have been decommissioned. If known, information on a project’s
offtake mechanisms and financial close is specifically reported as well. 10
Offshore wind projects remain in the pipeline from early-stage planning through the operating and
decommissioning phases. In the early stages of a project, the exact project footprints and capacities are not
always known, but NREL assumes that all lease areas will eventually be fully developed with an array density
of 3 MW/square kilometer (km2). This is a common metric for computing the available wind resource over an
area but is not meant to be restrictive (Musial et al. 2013, 2016). Some developers may want higher array
densities for their lease areas, or conversely, could decide or be required to leave areas undeveloped for various
reasons. The pipeline is adjusted when these decisions are publicly announced.
Table 1 describes the system used in this report for classifying and tracking the development of offshore wind
projects and that has been used in past DOE-sponsored offshore wind market reports (Smith, Stehly, and
Musial 2015; Musial et al. 2017; Beiter et al. 2018). Note that the criteria used in Table 1 also apply to the
global project classification, but some differences may not allow for direct comparisons, especially during the
earlier stages of planning. This disconnect is mainly because some countries have different methods of
establishing “site control.”
9 Appliesto U.S. projects on the Outer Continental Shelf but varies internationally and in state waters.
10The “pipeline” is often measured by the quantity of policy commitments made by states. These figures are tracked separately in Section 2.4.2 and offer a
good metric for comparison.
3 | 2018 Offshore Wind Technologies Market ReportTable 1. Offshore Wind Project Pipeline Classification Criteria
Step Phase Name Start Criteria End Criteria
Ends when a developer obtains control of a site (e.g.,
Starts when a developer or regulatory agency through competitive auction or a determination of no
1 Planning competitive interest in an unsolicited lease area [United
initiates the formal site control process
States only])
Ends when the developer files major permit applications
Begins when a developer obtains site control (e.g., (e.g., a construction and operations plan for projects in the
2 Site Control
a lease or other contract) United States) or obtains an offtake agreement
Starts when the developer files major permit
Permitting =
applications (e.g., construction and operations plan Ends when regulatory entities authorize the project to
3 Site Control + proceed with construction and certify its offtake agreement
or obtains an offtake agreement for electricity
Offtake Pathway
production)
Ends when sponsor announces a “financial investment
Starts when a project receives regulatory approval decision” and has signed contracts for construction work
4 Approved
for construction activities and its offtake agreement packages
Begins when sponsor announces a financial
5 Financial Close investment decision and has signed contracts for Ends when project begins major construction work
major construction work packages
Ends when all turbines have been installed and the project
6 Under Construction Starts when offshore construction is initiated 11 is connected to and generating power for a land-based
electrical grid
Commences when all turbines are installed and Ends when the project has begun a formal process to
7 Operating transmitting power to the grid; COD marks the decommission and stops feeding power to the grid
official transition from construction to operation
Starts when the project has begun the formal Ends when the site has been fully restored and lease
8 Decommissioned process to decommission and stops transmitting payments are no longer being made
power to the grid
Starts if a sponsor stops development activities,
9 On Hold/Cancelled discontinues lease payments, or abandons a Ends when a sponsor restarts project development activity
prospective site
1.2 Report Structure
The remainder of the report is divided into four sections:
• Section 2 summarizes the status of the offshore wind industry in the United States, providing in-depth
coverage on the project development pipeline, regulatory activity, offtake mechanisms, infrastructure
trends, and regional developments.
• Section 3 provides an overview of the global offshore wind market. Operational and proposed future
projects are tracked by country, status, commercial operation date, and capacity. Developments on
international floating offshore wind projects are also covered in detail.
• Section 4 describes offshore wind siting and technology trends focusing on turbine technologies, turbine
manufacturers, project performance, fixed-bottom substructures, electrical power, export systems, and
floating technologies.
• Section 5 provides insight into global and domestic offshore wind prices, capital and operational costs,
and financing trends for both fixed-bottom and floating technologies. This section also compares
historical and forecasted future prices between the European and U.S. offshore wind markets.
11 Note that some developers may elect to start construction at an onshore landing area to secure certain subsidies or tax incentives.
4 | 2018 Offshore Wind Technologies Market ReportYou can also read