Asia Pacific: An oasis of calm amidst global political instability - Q1 2017 Asia Pacific Property Digest - JLL

Page created by Craig Jackson
 
CONTINUE READING
Asia Pacific: An oasis of calm amidst global political instability - Q1 2017 Asia Pacific Property Digest - JLL
Asia Pacific Property Digest
Q1 2017

Asia Pacific: An oasis of calm
amidst global political instability
Asia Pacific: An oasis of calm amidst global political instability - Q1 2017 Asia Pacific Property Digest - JLL
13
                                               Office

                                                                       35
                                               14   Hong Kong

4
                                               15   Beijing
                                               16   Shanghai
                                               17   Shenzhen
                                               18   Taipei
                                               19   Tokyo
                                               20   Osaka
                                               21
                                               22
                                                    Seoul
                                                    Singapore          Retail
Feature                                        23
                                               24
                                                    Bangkok
                                                    Jakarta
                                                                       36
                                                                       37
                                                                            Hong Kong
                                                                            Beijing

Articles                                       25
                                               26
                                               27
                                                    Kuala Lumpur
                                                    Manila
                                                    Ho Chi Minh City
                                                                       38
                                                                       39
                                                                       40
                                                                            Shanghai
                                                                            Shenzhen
                                                                            Tokyo
04   Asia Pacific Economy and Property
                                               28   Delhi              41   Seoul
     Market
                                               29   Mumbai             42   Singapore
08   A growing appetite for foreign F&B
     in China                                  30   Bangalore          43   Bangkok
09   Is it the end for Japan’s retail rally?   31   Sydney             44   Jakarta
10   Cold storage in a heated logistics        32   Melbourne          45   Delhi
     market?                                   33   Brisbane           46   Sydney
11   Is Singapore residential warming up?      34   Auckland           47   Melbourne
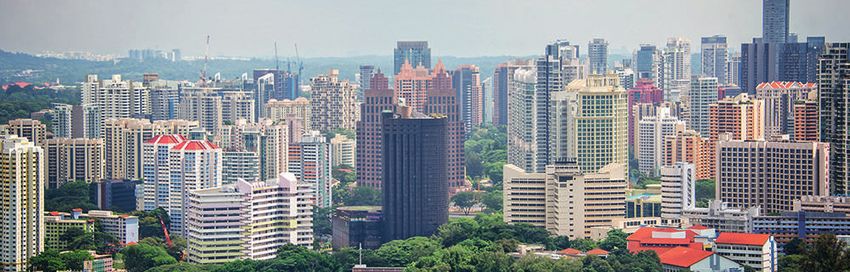
Asia Pacific: An oasis of calm amidst global political instability - Q1 2017 Asia Pacific Property Digest - JLL
Editor's Note
I’m pleased to share our latest Asia Pacific Property Digest in an exciting new format that’s part of our
brand launch.
We started the year on a positive note with investment volumes of USD 25 billion, up 1% from 1Q
2016. The International Monetary Fund’s April forecast projects economic growth for Asia Pacific at
above 5% from 2017 to 2018.
The region continues to be stable, with describing it as an oasis of calm following Brexit, a new US
president and upcoming elections in two of Europe’s largest economies, France and Germany.
You can view this report online at http://www.jllapsites.com/research/appd-online/.
I hope you enjoy reading this report and as always, we welcome your feedback on our reports and
service.

                     Thanks,
                     Dr Megan Walters
                     Head of Research – Asia Pacific

49                                   59                                  67
Residential Industrial                                                    Hotel
50   Hong Kong                                                            68    Hong Kong
51   Beijing                        60    Hong Kong                       69    Beijing
52   Shanghai                       61    Beijing                         70    Shanghai
53   Singapore                      62    Shanghai                        71    Tokyo
54   Bangkok                        63    Tokyo                           72    Singapore
55   Jakarta                        64    Singapore                       73    Bangkok
56   Sydney                         65    Sydney                          74    Jakarta
57   Melbourne                      66    Melbourne                       75    Sydney
Asia Pacific: An oasis of calm amidst global political instability - Q1 2017 Asia Pacific Property Digest - JLL
4 – Features

               ASIA PACIFIC ECONOMY

               Signs of improvement in the region
               The stream of positive economic news that started last summer persisted into 2017, with many indicators signalling
               a broadening global recovery. Strengthening market sentiment along with renewed optimism about the economic
               outlook helped bolster financial markets, including US markets reaching new record highs. These positive economic
               developments have shifted expectations upwards, with the region’s two largest economies – China and Japan – as
               beneficiaries of positively revised growth forecasts, and indicating a possible resynchronisation in the global cycle.

               Trade dynamics improve                           consumer confidence, low unemployment            Strong growth track
                                                                and rising disposable income in emerging         After a turbulent 2016, global output
               A widening recovery in demand is another
                                                                markets are underpinning solid household         is expected to pick up with Asia Pacific
               promising sign that trade is gaining
                                                                demand. Retail sales growth in China grew        leading the way. A broadening global
               a firmer footing. Many Asian markets
                                                                at a robust pace of 10.7% y-o-y in April, with   recovery in tandem with domestic policy
               recorded positive growth in exports
                                                                online shopping remaining a key driver           support have buoyed recent strong results
               recently including Korea, which shrugged
                                                                of growth. In advanced economies, retail         and lifted growth prospects for many
               off political tension with its largest trading
                                                                spending has been less rosy as economic          major economies. In this region, domestic
               partner to rise for a sixth straight month in
                                                                uncertainty weighed on consumer                  demand will continue to underpin healthy
               April, and Japan, which posted its biggest
                                                                sentiment. However, there have been              growth, while gaining momentum in the
               gain in more than two years in March. Trade
                                                                positive signs recently with some markets        global economy should catalyse better
               data out of China also showed resilience in
                                                                returning to growth including Hong Kong,         performances for the region’s exporters and
               2017 with both imports and exports rising
                                                                which recorded its first rise (3.1% y-o-y) in    producers. The outlook remains cautiously
               in April. This is consistent with the broader
                                                                over two years in March.                         optimistic with existing global political
               data observed so far, which includes
               expanding manufacturing activity.                                                                 risks arising from growing protectionist
                                                                Rates remain low                                 policies.
               Consumer spending trends                         The US Fed hiked rates again in March and
                                                                there are expectations for further rises this
               varied                                           year; however, most central banks in the
               Consumer spending remains a catalyst             region have not followed suit and domestic
               for growth in many markets as a healthy          factors rather than the Fed’s actions are
               labour market flows through to wage              likely to remain the main determinants of
               gains. Nonetheless, the performance              monetary policy in the short to medium
               remains mixed across Asia Pacific. Buoyant       term.
Asia Pacific: An oasis of calm amidst global political instability - Q1 2017 Asia Pacific Property Digest - JLL
5 – Features
Table 1: Outlook for Major Economies

                              Real GDP Growth (%)
         Country                                                                               2017 Outlook
                                2016      2017F

            China                6.7        6.6     Growth supported by infrastructure spending and buoyant consumption.

                                                    Business investment and robust growth in exports to underlie modest rise. Government policy to
            Japan                1.0        1.4
                                                    remain supportive.

                                                    Demonetisation concerns diminish. Consumption to lead recovery with backing from spending on
            India                7.5        7.2
                                                    infrastructure.

                                                    Weak domestic demand to offset strength from exports. Softer construction activity and subdued
            South Korea          2.8        2.5
                                                    private consumption.

                                                    Improving external demand and increased production capacity to bolster exports, but domestic
            Australia            2.5        2.8
                                                    demand to remain subdued.

            Indonesia            5.0        5.1     Consumer spending and infrastructure investment to remain key drivers.

                                                    Uneven growth and with the pick-up driven by externally focused sectors. Fiscal stimulus to support
            Singapore            2.0        2.7
                                                    investment.

                                                    Improving global demand to support trade, while a resilient labour market underpins healthy do-
            Hong Kong            1.9        2.2
                                                    mestic demand.

Source: Oxford Economics, May 2017

ASIA PACIFIC PROPERTY MARKET

A steady start to the year
The commercial real estate market in Asia Pacific began the year on steady ground as both leasing and investment
transactional volumes held relatively firm from a year earlier. The trend of divergence in occupier markets persisted with
several recording buoyant conditions. On the investment front, real estate’s attractive yield profile in a low interest rate
environment is helping sustain investor interest and five of the top 15 most active cities globally for investment volumes
were in the Asia Pacific region. Interestingly, China remained the largest source of outbound capital globally for the hotel
sector in 1Q despite tight capital controls.

Supply and demand office dynamics                   Less new office supply across Asia                  submarket. Vacancy remained below 5% in
neutral across most markets                         Pacific                                             markets such as Bengaluru, Beijing, Hong
                                                                                                        Kong and Tokyo. Meanwhile, Shanghai
Overall leasing activity in the region was          Around half of all Asia Pacific markets
                                                                                                        saw the largest jump in vacancy, rising
relatively stable, down slightly by 4% y-o-y        saw new completions in 1Q; however, the
                                                                                                        by 4 percentage points on huge supply
in 1Q17 but with a varied performance               total volume of supply dipped by 19%
                                                                                                        additions.
across the region. At the city-level, Delhi         y-o-y. Shanghai received a large volume of
remained the regional leader with leasing           supply in both the CBD and Decentralised            Robust office rental growth in a few
volumes at 220,000 sqm but healthy levels           markets, and accounted for nearly 60%               key markets
of activity were also recorded in Melbourne,        of the total volume of new completions,
Manila and Tokyo. In terms of industry              with smaller supply volumes completed               In aggregate, rents increased 1.0% q-o-q
drivers, financial and tech firms were the          in Beijing and Guangzhou. One new                   and 3.1% y-o-y. Sydney continued to record
most active.                                        building was completed in Tokyo with a              the strongest quarterly and annual growth,
                                                    relatively low pre-commitment rate while a          a result of persistent demand for prime
Similarly, 1Q net absorption fell slightly by       Singapore project scheduled for 1Q delayed          office space and declining vacancy. The
3% y-o-y, mostly evident in the India Tier          completion.                                         rental decline accelerated in Jakarta, but
1 markets and Tokyo as supply additions                                                                 held steady in Singapore as commitment
dropped off. However, Melbourne recorded            Vacancy rates continued to decline in many          rates at upcoming supply improved. Perth
strong quarterly net absorption with broad-         Asia Pacific markets. Mumbai saw one of             returned to positive rental growth (on a
based demand, while traditional financial           the largest quarterly falls with vacancy            prime net effective basis).
institutions (e.g. banks) drove activity in         down around 1 percentage point and
China’s Tier 1 markets.                             with the biggest drop recorded in the BKC
Asia Pacific: An oasis of calm amidst global political instability - Q1 2017 Asia Pacific Property Digest - JLL
F&B leading the way                              rang in at USD 25.3 billion, up 1% on the                                         Chinese buyers were quieter in the region.
6 – Features

                                                                same quarter a year ago, but down 43%                                             Offshore investors’ activity in Australia
               F&B operators and kids’ brands were
                                                                on the previous quarter. The shortfall was                                        remained vibrant as cross-border buyers
               still the main demand drivers in China’s
                                                                largely confined to Australia and Hong                                            continued to outpace cross-border sellers.
               Tier 1 cities, while in Hong Kong the
                                                                Kong, due to a shortage of product. Japan
               primary sources of demand were local                                                                                               Capital value growth outpaces rents
                                                                and Singapore were regional standouts.
               and international F&B brands along with                                                                                            again
                                                                The office sector accounted for roughly half
               mid-tier retailers. The performance of retail
                                                                of total transaction volumes regionally,                                          In the office sector, Asia Pacific quarterly
               sales in Singapore continued to be patchy
                                                                while retail and industrial each accounted                                        capital value growth moved higher by 1.8%
               and occupier demand was weak with many
                                                                for 15-20% and the rest mainly comprising                                         in aggregate in 1Q17. Sound fundamentals
               tenants still looking for early termination.
                                                                of hotel assets.                                                                  and rent growth supported robust capital
               Retailer performance in Sydney continued
               to vary across categories, with strong                                                                                             value increases in Sydney (+6.4% q-o-q)
                                                                Cross-border investors remained active                                            and Melbourne (+4.6%). Price benchmarks
               competition in the apparel category              in 1Q, accounting for around one-third of
               resulting in discounting and bankruptcies.                                                                                         indicate that Hong Kong capital values
                                                                total transaction volumes. Inter-regional                                         reached new highs, while growth in
                                                                purchaser activity dominated intra-
               Demand drivers of logistics sector               regional in the quarter, and accounted
                                                                                                                                                  Shanghai was in line with rents. The
               consistent with recent periods                   for about 67% of cross-border purchaser
                                                                                                                                                  pace of decline picked up pace in Jakarta
                                                                                                                                                  while ample liquidity saw the decline in
               Strong demand from e-commerce retailers          activity. International funds continued to                                        Singapore ease.
               and third-party logistics companies              acquire core assets in Japan, Korea and
               continues in several Asia Pacific markets,       Shanghai. Asian investors were active but
               including Tokyo and Sydney. Against
               mixed trade data in Hong Kong, most 3PLs
               as well as retailers who were previously
               active in expansion adopted a wait-and-see       Figure 2: Office Rental & Capital Value Changes, Yearly % Changes, 1Q17
               attitude with leasing largely centred on
               renewals. Take-up of business park space in                   30
               Singapore focused on existing and recently                    25
               completed premises given the lack of new
               completions during the quarter, while                         20

               demand for logistics premises remained                        15
               relatively subdued. Demand continued to                       10
                                                               y-o-y %

               be robust in Sydney with limited available
                                                                              5
               options for immediate use, and quarterly
               take-up was supported by several large                         0
               scale ‘design and construct projects’ and                     –5
               speculative facilities getting leased up.
                                                                        –10

               China tightens residential policy                        –15
               measures while Singapore loosens
                                                                                      ey

                                                                                                    ne

                                                                                                                ng

                                                                                                                         ila

                                                                                                                                  o

                                                                                                                                            i

                                                                                                                                                       ai

                                                                                                                                                                    k

                                                                                                                                                                            ng

                                                                                                                                                                                        l

                                                                                                                                                                                                    e

                                                                                                                                                                                                            rta
                                                                                                                                           ba

                                                                                                                                                                                        ou
                                                                                                                                                                 ko

                                                                                                                                                                                                    or
                                                                                                                                 ky

                                                                                                                                                    gh
                                                                                                                      an
                                                                                      dn

                                                                                                  ur

                                                                                                              Ko

                                                                                                                                                                           iji

                                                                                                                                                                                                           ka
                                                                                                                                       um

                                                                                                                                                                                   Se

                                                                                                                                                                                                ap
                                                                                                                               To

                                                                                                                                                               ng

                                                                                                                                                                           Be
                                                                                                                                                   an
                                                                                               bo

                                                                                                                     M
                                                                                  Sy

                                                                                                                                                                                                         Ja
                                                                                                           ng

                                                                                                                                                                                              ng
                                                                                                                                                               Ba
                                                                                                                                       M

                                                                                                                                                  Sh
                                                                                             el

               Additional policy restrictions were
                                                                                                         Ho

                                                                                                                                                                                             Si
                                                                                            M

               introduced in many cities in China during                                   Rental Values             Capital Values
               the quarter, including refined definitions
               for first- and second-time home buyers,          Figures relate to the major submarket in each put a period after city
               and higher down payments. The tight              Source: JLL (Real Estate Intelligence Service), 1Q17
               policy stance on home purchases and
               new launches continued to impact sales
               volumes in China’s Tier 1 markets. In
               Singapore, the government moved in the
               opposite direction by slightly relaxing          Figure 3: Direct Commercial Real Estate Investment 2008–1Q17
               cooling measures in March. Market
                                                                             140
               sentiment improved further in the city-
               state with sales volumes in the prime                         120
               areas slightly above levels from a year
               earlier despite a lack of new launches.                       100
               Despite the stamp duty in Hong Kong
                                                               USD Billion

                                                                              80
               being raised to 15% in November and
               growing expectations that interest rates                       60
               will rise, sales activity gathered pace as                                                                                                                                                1Q 2017
               more developers launched units for sale.                       40                                                                                                                         $25.3 bill
                                                                                                                                                                                                         1% y-o-y
               Many wealthy first-time buyers purchased
               multiple units on one sales agreement in                       20

               order to avoid the stamp duty; however,
                                                                                  0
               this loophole was closed in mid-April.
                                                                                           2008          2009        2010       2011       2012         2013        2014         2015        2016        1Q17

               Capital continues to chase real estate                                       Japan                     China            Australia               Singapore            Hong Kong
                                                                                            South Korea               Other
               Investment volumes across Asia Pacific
               commercial real estate markets started the
               year at the same pace as a year ago. 1Q17        Figures refer to transactions over USD 5 million in office, retail, hotels and industrial.
               final transaction volumes in Asia Pacific        Source: JLL (Real Estate Intelligence Service), 1Q17
Asia Pacific: An oasis of calm amidst global political instability - Q1 2017 Asia Pacific Property Digest - JLL
7 – Features
Figure 4: Rental Property Clocks, 1Q17

 Grade A Office                                                                                    Prime Retail
                                      Beijing                                                                                          Beijing
                   Hong Kong                                                                                                Auckland
                                                               Shanghai
                  Auckland
                   Tokyo                                             Jakarta
                                                                       Kuala Lumpur                   Bangkok, Tokyo^,
                                                                                                            Wellington

      Sydney
                           Growth                    Rents                                            Kuala Lumpur               Growth                 Rents
     Manila                Slowing                   Falling                                                                     Slowing                Falling
Guangzhou,                                                                                                 Manila,
 Melbourne                                                                                                 Jakarta
      Osaka,                                                                    Seoul,                                                                                         Hong Kong^
  Wellington                Rents                   Decline                     Singapore,                                        Rents                Decline
                                                                                Adelaide                  Shanghai
     Bangkok
                            Rising                  Slowing                                                                       Rising               Slowing                 Singapore

       Canberra                                                                                               Mumbai
        Bengaluru
      Ho Chi Minh City                                                                                                   Delhi
                                                                 Hanoi                                                Bengaluru
                  Delhi, Chennai                          Brisbane                                                Chennai, Melbourne*,
                             Mumbai             Taipei                                                                                             SE Queensland*
                                                                                                                              Sydney*
                                  Perth                                                                                                            Guangzhou

                                                                                                      *Regional
Note: Clock positions for the office sector relate to the main submarket in each city.                ^High Street Shops/Multi-level High Street

 Prime Residential                                                                                 Industrial

                                                 Jakarta                                                                                           Hong Kong
                                                                                                                             Tokyo
                                                                                                              Beijing, Auckland

                                                                                                              Shanghai
                                                                                                          Wellington
                            Growth                       Rents                 Kuala Lumpur                                      Growth                  Rents
   Guangzhou,
       Manila               Slowing                      Falling                                                                 Slowing                 Falling
                                                                                                            Manila
      Beijing,
     Bangkok                 Rents                   Decline                                                                      Rents                Decline                 Singapore
                             Rising                  Slowing                                                                      Rising               Slowing                 (Logistics)

                                                                                                                Sydney
                                                                            Hong Kong
                                                                         Singapore*

                                                                                                                                                              Brisbane
                                 Shanghai                                                                                            Melbourne     Singapore (Business Park)

 *Luxurious
                                                                                                      *Logistics (Hong Kong, Shanghai, Beijing, Greater Tokyo)

Source: JLL (Real Estate Intelligence Service), 1Q17

2017 office leasing volumes to hold up
Lingering uncertainty surrounding the                                      About the Author
economic and political backdrop leads to                                   Dr Megan Walters joined JLL in 2010 and in October 2016 was
the expectation that gross leasing volumes                                 appointed as Head of Research – Asia Pacific. In this role, Megan
should be relatively in line with 2016,                                    leads a team of 160 professional researchers in the region, which
and with a varied performance amongst                                      forms part of a network of over 400 researchers in 65 countries
markets expected to continue. However,                                     around the globe.
there have been encouraging signs in 2017
that activity is improving in many areas.
Asia Pacific: An oasis of calm amidst global political instability - Q1 2017 Asia Pacific Property Digest - JLL
8 – Features

               A growing appetite for foreign F&B in China
               While Chinese food is the first love of          In our new whitepaper Foreign F&B               • Regional bias within China is strong
               most Chinese consumers, much of China’s          Expansion in China, we explore the                among most foreign chains, which tend
               middle class has also embraced foreign           recent store openings of 32 well-known            to flock to South China.
               cuisine. This has helped foreign food            international F&B brands in China,              • Most brands have an established
               and beverage (F&B) chains find success           identifying patterns in the market as well as     presence in East China, but their
               in the country, backed by their novelty,         the lessons that can be learned from these        demographics indicate that there is still
               quality, competitive prices, and air of          retailers. Our key insights include:              room in the market for them to further
               sophistication.                                                                                    expand in this wealthy region.
                                                                • China’s strong consumer sector makes
               Sensing opportunity, foreign restaurants           F&B one of the country’s most active          Given that capturing even a small slice
               have expanded aggressively across the              areas of growth.                              of the pie translates into huge absolute
               country, and many are now fixtures at                                                            volumes, many foreign F&B retailers view
                                                                • While expansion continues along the
               urban malls, department stores, and                                                              the China market with understandable
                                                                  coastal areas and Tier 1 cities, foreign
               shopping streets in China.                                                                       enthusiasm. Yet the road to successfully
                                                                  F&B retailers are now more active
                                                                                                                taking advantage of the China opportunity
                                                                  in lower-tier cities, despite the risks
               This begs the question: is there a pattern                                                       is a difficult one, as some restaurant chains
                                                                  associated with entering these less
               to the kind of roll-out strategies unleashed                                                     have discovered too late.
                                                                  wealthy provincial capitals.
               by foreign F&B brands in China? If so, what
                                                                • Smaller café-format shops selling             F&B retailers have several critical questions
               lessons do they hold for others looking
                                                                  coffee, tea, and ice cream are a highly       to address before plunging ahead,
               to deepen or establish a presence in the
                                                                  active category, expanding quickly at 30      including: “How fast can I build out and
               country over the coming years?
                                                                  percent y-o-y in 2015.                        where?” The results of our study offer
               In answering these questions, we partnered                                                       direction on this and more. Download our
               with retail data collection specialist                                                           report here.
               LocalGravity, which catalogues the location
               of retail stores across every city in China on
               a regular basis.

                                                                About the Author
                                                                Steven McCord is Head of Research, North China and Head of Retail
                                                                Research, Asia. He regularly monitors major commercial real estate
                                                                trends in China and trends in the shopping centre industry across
                                                                Asia. He has been with the firm for over ten years.
9 – Features
Is it the end for Japan’s retail rally?
In Japan, the days of rapidly rising luxury    2. More diverse shopping habits are             4. Threats posed by the rise of
goods consumption – particularly from             forming among younger generations.              e-commerce are limited in the luxury
Chinese tourists – is now over. Tighter           While department store sales in the             goods market. Direct service plays
mainland Chinese customs controls, aimed          country hit a 36 year-low in 2016 – in          an important role in luxury goods
at thwarting those who shop abroad for            part due to the warmer climate                  shopping, and this shows no signs of
resale at home, have made it harder for           impacting fashion sales and slowing             fading anytime soon. Physical stores
Chinese tourists to purchase large amounts        demand for duty-free from visitors –            remain important for certain areas of
while abroad since last year.                     there was a noticeable uptick in                the retail sector. Meanwhile, fast fashion
                                                  cosmetic sales. In contrast with the            outlets often generate high foot traffic
As Chinese visitors spend less, the prime         respective 6 per cent y-o-y declines in         for malls, while suburban shopping
retail sector in Japan is also facing             women’s fashion and luxury sales,               centres – packed with food and
flattening domestic consumption.                  cosmetics sales grew 10 per cent y-o-y,         entertainment options – serve shoppers
Meanwhile, record-high commercial                 across both domestic and foreign                with needs that cannot be met online.
land prices and rents in retail hotspots          shoppers. This is a bright spot on the       5. Japan remains a popular regional
are creating additional stress for both           horizon, suggesting that department             shopping destination. In 2016, the
landlords and retailers.                          stores are commanding interest from             number of tourists to Japan rose 22
                                                  younger generations, which helps                per cent y-o-y. Relaxed visa rules make
Yet, we remain optimistic about the future
                                                  ease ongoing concerns that they have            visiting Japan easy for many tourists
of the retail sector in Japan:
                                                  become overly dependent on an older,            from nearby countries such as China
1. The local wealth effect has enabled            wealthy consumer base.                          and Thailand. Further, as political
   international luxury retailer sales to      3. Major prime retail hotspots continue to         tensions between Seoul and Beijing
   grow at healthy rates. Select foreign          thrive. With a growing collection of fast       remain high, nearby markets like Tokyo
   brands are recording a surge in sales,         fashion retailers, an enviable maze of          could benefit from a boost in Chinese
   and in some cases, Japan sales are             flagships, department stores, and street-       travellers looking to spend elsewhere in
   outperforming global sales averages.           side retail stores, the world-famous            the region.
   The strong performance of international        Ginza shopping district maintains huge
   brands in the market indicates that local      crowds that drive annual retail sales for
   spending power – underpinned by rising         the area that tops out at hundreds of
   stock prices, if slower than the past –        billions of yen.
   remains steadfast.

                                               About the Author
                                               Naoko Iwanaga is a Research Manager based in Tokyo, Japan. In
                                               her current role, she authors market commentary and analysis
                                               for various JLL publications and media releases. Naoko also
                                               regularly contributes to consulting projects on behalf of clients and
                                               investors.
10 – Features

                Cold storage in a heated logistics market?
                Traditionally considered a niche category of    specialised nature of cold storage assets                          escalations are generally set higher than
                industrial assets and often overlooked, cold    encourages tenants to commit to longer                             market. For example, at a major industrial
                storage assets are now highly sought-after.     lease terms (typically 15–20 years).                               estate in Sydney’s Outer Central West, a
                Last year was a record-setting year for the                                                                        speculatively constructed warehouse,
                industrial real estate sector in Australia.     We have tracked over AUD 1.86 billion                              leased to an online grocery retailer,
                Record transaction volumes were recorded        (USD 1.27 billion) of cold storage                                 achieved a 40 per cent rent premium in
                for the third year in a row in 2016, with       transactions nationally since 2007. The                            comparison to a standard distribution
                sales transactions volumes totalling            ten largest sale transactions showed an                            warehouse of similar size located next
                AUD 7.909 billion (USD 5.279 billion)           average lease expiry (WALE), weighted by                           door, in the same estate. This is despite the
                nationally. Cold storage sales volumes have     income, of 14 years. High-quality tenants,                         9,500 sqm warehouse/office facility being
                also grown in recent years.                     such as Coles, Woolworths, Metcash                                 generically designed, then fitted out for
                                                                and Inghams were involved in all 10                                refrigerated warehousing accommodation.
                We identify two major reasons for this:         transactions.
                                                                                                                                   Investors seeking prime industrial property
                Positive top-down fundamentals                  The specialised machinery and associated                           should consider cold storage/refrigerated
                Food and beverage export and import             software required to run cold storage                              assets. Given that investors find it
                growth over the past three years has been       assets typically involve higher fit-out                            increasingly difficult to replace secure
                well above the 20-year average (Figure          and maintenance costs than traditional                             income streams, these assets are also likely
                1). In 2016, food and beverage exports          warehouses. In order to compensate for                             to continue to be highly sought after.
                totalled AUD 26.1 billion (USD 20.0 billion)    higher initial capital outlay, rents and
                while imports totalled AUD 17.0 billion
                (USD 13.0 billion). Growth in the value of     Figure 1: Australian Imports and Export Volumes: Food and Beverage
                cross-border trade has been supported                         30,000                                                                                          $1.20
                by the depreciation of the AUD and recent
                                                                              25,000                                                                                          $1.00
                free-trade agreements.
                                                               AUD millions

                                                                              20,000                                                                                          $0.80
                The expansion of cross-border trade is
                                                                              15,000                                                                                          $0.60
                evident in our recent industrial take-up
                                                                              10,000                                                                                          $0.40
                figures. Owner-occupiers and tenants such
                as PFD Food Services, Hello Fresh, Martin                      5,000                                                                                          $0.20
                Brower, Rand and Newcold (a new entrant                           0                                                                                           $0.00
                to Australia) have all taken up new cold-
                                                                                     88
                                                                                     89
                                                                                     90
                                                                                     91
                                                                                     92
                                                                                     93
                                                                                     94
                                                                                     95
                                                                                     96
                                                                                     97
                                                                                     98
                                                                                     99
                                                                                     00
                                                                                     01
                                                                                     02
                                                                                     03
                                                                                     04
                                                                                     05
                                                                                     06
                                                                                     07
                                                                                     08
                                                                                     09
                                                                                     10
                                                                                     11
                                                                                     12
                                                                                     13
                                                                                     14
                                                                                     15
                                                                                     16
                                                                                   19
                                                                                   19
                                                                                   19
                                                                                   19
                                                                                   19
                                                                                   19
                                                                                   19
                                                                                   19
                                                                                   19
                                                                                   19
                                                                                   19
                                                                                   19
                                                                                   20
                                                                                   20
                                                                                   20
                                                                                   20
                                                                                   20
                                                                                   20
                                                                                   20
                                                                                   20
                                                                                   20
                                                                                   20
                                                                                   20
                                                                                   20
                                                                                   20
                                                                                   20
                                                                                   20
                                                                                   20
                                                                                   20

                storage warehouse space in Australia. In
                                                                                       Imports: Food and Beverage   Exports:Food and Beverage      AUD/USD (December) (RHS)
                Sydney, where residential developers are
                displacing industrial tenants from sub-
                markets such as South Sydney and the
                Inner West, a lack of smaller
                accommodation options will see growth in        About the Author
                demand for secondary assets or a ‘flight-to-    Keith Lee is a Research Analyst based in Sydney. He works in the
                quality’ to high-end facilities.                market research team, with a focus on Sydney and Melbourne
                                                                industrial markets. In his current role, Keith services the broader
                Increased tenant retention and                  Australian REIS clientele but has recently been involved in more
                premium to market rents
                                                                client-specific research projects. Keith’s focus is to improve the
                In an environment where institutional           quality of the national industrial offering with regards to the
                landlords compete fiercely, owners have         industrial data methodologies, analysis and reporting.
                sought new measures to retain tenants. The
11 – Features
Is Singapore residential warming up?
Between 2010 and 2013, the Singapore            The second relaxation was to the TDSR,         15 per cent and payable for the transfer of
government implemented a series of              which was lifted for mortgage equity           equity interest in a property holding entity
measures to cool the residential property       withdrawal loans with loan-to-value ratios     instead of just the 0.2 per cent stamp duty
market, including the Seller’s Stamp Duty       of 50 per cent and below to enable some        for share transactions. This would prevent
(SSD), Additional Buyer’s Stamp Duty            owners, especially those in their retirement   developers under pressure from Qualifying
(ABSD), reduction of borrowing limits and       years, to borrow against the value of their    Certificate extension charges and ABSD
Total Debt Servicing Ratio (TDSR). The          properties to obtain additional cash.          remission claw-back from disposing of
effect of the cooling measures was a two-                                                      unsold stock through the transfer of equity
thirds fall in sales volumes between 2010       While the adjustments to the SSD and TDSR      interest with minimal penalty.
and 2014 while prices eased by a moderate       by themselves may not have a significant
11.6 per cent from 3Q13 to 1Q17.                impact on the market, it is the signal that    The ACD for sale is at a flat rate of 12 per
                                                they are sending that is expected to have      cent if the interest is transferred within
Previous appeals by the industry to relax       a positive impact. The policy relaxation is    three years, making it more punitive than
the cooling measures had been                   likely to be seen as the beginning of the      SSD for individual sellers. The effect of the
unsuccessful, so it came as a surprise that     unwinding of cooling measures and this         ACD is that bulk purchases by investors
on 10 March 2017, the authorities               is expected to lead more buyers back to        could be at wider discounts.
announced tweaks to the cooling                 the market. Buyers would perceive the
measures.                                       market as bottoming and be hopeful of a        The long-awaited easing of cooling
                                                price recovery. Transaction volumes which      measures has finally begun but the
The first relaxation was to the SSD, with the   have been increasing in the last two years,    adjustments of the other measures are
holding period being reduced to three years     are likely to pick up further and we expect    likely to be cautious and gradual, with the
and the rates to between four and 12 per        some upside to prices.                         authorities sizing up the impact of each
cent. Prior to this, SSD had been payable                                                      adjustment before moving on to the next.
by those who purchased a residential            Another announcement was the Additional        For now, there is ‘candlelight at the end of
property and sold it within four years, at      Conveyance Duties (ACD) for purchase           the tunnel’, possibly leading to a revival in
rates of between four and 16 per cent of the    which is identical to the buyer’s stamp        the Singapore residential market.
purchase price.                                 duty of up to three per cent and ABSD of

                                                About the Author
                                                Ong Teck Hui is a National Director, Research & Consultancy, based
                                                in Singapore. His research work focuses more on the Singapore
                                                residential sector, which he comments on regularly in response to
                                                the media. He also engages clients, investors, developers and other
                                                industry professionals in providing advisory service.
Office
Hong Kong
                               “Tenant decentralisation
                               quickens as Central rents
                               close in on record highs.”
14 – Office

                                       Denis Ma, Head of Research,                                                                                     sq ft per month,                  Stage in Cycle
                                                                                                               Rental Growth Y-O-Y
                                               Hong Kong
                                                                                                                     9.1%
                                                                                                                                                     net effective on NLA                Growth
                                                                                                                                                      HKD 114.6                          Slowing

               Financial Indices
                                                                                                           Cost-saving relocation requirements underpin leasing
                             140
                                                                                                           •     Leasing activity remained relatively subdued against a tight vacancy
                             130
                                                                                                                 environment and the Chinese New Year holidays, with the number of new
                                                                                                                 lettings decreasing about 7% q-o-q in 1Q17. Driven by cost-saving relocation
                             120                                                                                 requirements from foreign legal and financial services firms, net absorption
                                                                                                                 amounted to 166,500 sq ft.
              Index

                             110
                                                                                                           •     In Central, leasing demand was largely supported by tenants seeking cost-
                             100                                                                                 effective options in the submarket’s fringe areas (i.e. Sheung Wan and
                                                                                                                 Admiralty) and the ongoing expansion of PRC tenants, with the occupier market
                             90                                                                                  growing 53,500 sq ft after two quarters of contraction.
                             80                                                                            Government tenders first commercial site in Central in 20 years
                              4Q12           4Q13            4Q14    4Q15          4Q16     4Q17
                                                                                                           •     Three commercial/hotel sites in Central, Kai Tak, and Cheung Sha Wan area
                                        Rental Value Index           Capital Value Index
                                                                                                                 were put up for sale via tender in March, with closing dates in May. The Murray
               Arrows indicate 12-month outlook                                                                  Road Carpark (IL 9051), which has a site area of 31,000 sq ft and a maximum
               Index base: 4Q12 =100
               Financial Indicators are for Central.
                                                                                                                 buildable GFA of 465,000 sq ft will be the first government site sold in Central in
               Source: JLL                                                                                       20 years.
                                                                                                           •     The government’s 2017/18 Land Sale Programme included three commercial/
               Physical Indicators                                                                               hotel sites, which could potentially yield about 1.9 million sq ft of commercial
                                                                                                                 and office floor space, about a third of the 5.9 million sq ft delivered from the
                              300                                                           6                    eight sites included in the 2016/17 Land Sale Programme.
                              250                                                           5
                                                                                                           Rents in Central closing in on historic highs
                              200                                                           4
                                                                                                           •     Led by growth in Grade A1 office buildings, rents in Central advanced 2.0%
              Thousand sqm

                              150                                                           3                    q-o-q, reaching a level within 2% of the pre-GFC record high set in 2008. In
                                                                                                 Percent

                                                                                                                 contrast, rents in Kowloon East remained under pressure from subdued pre-
                              100                                                           2
                                                                                                                 leasing activity and high vacancy in a handful of buildings.
                               50                                                           1
                                                                                                           •     Investment volumes were down 34% q-o-q in 1Q17. Capital values continued to
                                   0                                                        0                    climb higher with strata-titled properties fetching new record highs across the
                              –50                                                           –1                   market.
                                        12       13          14     15        16      17F

                                         Take-Up (net)                      Completions                    Outlook: Capital values to maintain growth momentum
                                         Future Supply                      Vacancy Rate                   •     With PRC demand showing no signs of abating and vacancy remaining below
                                                                                                                 2%, we have upgraded our rental forecast for Central to grow in the range of
               For 2012 to 2016, take-up, completions and vacancy rates are year-end                             5–10% in 2017.
               annual. For 2017, take-up, completions and vacancy rate are as at 1Q17,
               while future supply is for 2Q17 to 4Q17.                                                    •     Sustained investor demand coupled with record high prices and strong
               Physical Indicators are for the overall market.                                                   government land sales results should buoy the investment market over the
               Source: JLL
                                                                                                                 coming 12 months, and we remain optimistic for capital values to grow in the
                                                                                                                 range of 0–5% in 2017.

                                                                                                           Note: Hong Kong Office refers to Hong Kong’s overall Grade A office market.
Beijing
                                                                                                            “The CBD starts to shift
                                                                                                          towards a tenant’s market,
                                                                                                           as rents fall and landlords
                                                                                                             give more incentives.”

                                                                                                                                                                                     15 – Office
                                              sqm per month,              Stage in Cycle
    Rental Growth Y-O-Y                                                                                    Steven McCord, Head of Research,
          –2.3%
                                             net effective on GFA          Rents                                     North China
                                                RMB 382                    Stable

                                                                                            Financial Indices
Finance Street demand remains strong despite high rents
                                                                                                          120
•     Despite extremely high rents in Finance Street, the submarket continued to
      receive strong interest in the quarter.
•     Enquiries from securities firms dominated, as these firms look to tap into                          110

      capital from homebuyers who are locked out of the restrictive housing market.

                                                                                           Index
Two projects for lease enter the market                                                                   100

•     Tianrun Fortune Centre (48,000 sqm) was completed in East Chang’an. A
      domestic telecom giant and foreign insurance brokerage relocated and led an                          90
      80% commitment rate at the project, which reached 50% physical occupancy
      by end-1Q17.
                                                                                                           80
•     Sinotrans Building B (74,000 sqm) in the Olympic Area received the green light                        4Q12         4Q13            4Q14    4Q15         4Q16     4Q17

      to start leasing in the quarter, and the project reached 5% physical occupancy                                Rental Value Index           Capital Value Index
      by end-1Q17.
                                                                                            Arrows indicate 12-month outlook
                                                                                            Index base: 4Q12 =100
CBD rents decline slightly for second straight quarter                                      Financial Indicators are for the CBD.
                                                                                            Source: JLL
•     CBD landlords continued to be flexible on rents and increased leasing
      incentives, as they competed to secure reputable tenants in advance of
      incoming new supply. Other submarkets were stable.                                    Physical Indicators
•     No major Grade A investment deals were closed in the quarter. Yields showed
                                                                                                           700                                                         7
      further compression as capital outflow restrictions encouraged more domestic
      investors to consider opportunities in Beijing.                                                      600                                                         6

                                                                                                           500                                                         5
Outlook: CBD rents to remain under pressure
                                                                                           Thousand sqm

                                                                                                           400                                                         4
•     Strategic landlords should set the pace and lead a step-wise rental decline in
                                                                                                                                                                           Percent

      the CBD, as the mature submarket receives a large and steady stream of new                           300                                                         3
      supply from 2Q17.                                                                                    200                                                         2
•     The increasingly competitive market should reward landlords with well-                               100                                                         1
      planned leasing strategies. The huge amount of future supply provides tenants
                                                                                                                0                                                      0
      with more options and drives the shift towards a tenant’s market. Market-                                     12       13          14     15      16       17F
      informed landlords who make strategic adjustments to be more attractive to
                                                                                                                     Take-Up (net)                   Completions
      tenants are likely to benefit from strong leasing performance.
                                                                                                                     Future Supply                   Vacancy Rate

                                                                                            For 2012 to 2016, take-up, completions and vacancy rates are year-end
                                                                                            annual. For 2017, take-up, completions and vacancy rate are as at 1Q17,
                                                                                            while future supply is for 2Q17 to 4Q17.
                                                                                            Physical Indicators are for the overall market.
                                                                                            Source: JLL

Note: Beijing Office refers to Beijing’s overall Grade A office market.
Shanghai
                                  “Emerging CBDs are
                                becoming increasingly
                               attractive to both tenants
16 – Office

                                     and investors.”                                                                                                                                            Stage in Cycle
                                                                                                               Rental Growth Y-O-Y                      sqm per day,
                                       Daniel Yao, Director - Research,
                                                  Shanghai                                                          –0.8%
                                                                                                                                                     net effective on GFA                        Rents
                                                                                                                                                       RMB 10.5                                  Falling

               Financial Indices
                                                                                                           Net absorption in Decentralised market outshines the CBD
                             130
                                                                                                           •     Leasing demand remained stable in 1Q. In the Pudong CBD, newly completed
                                                                                                                 projects captured upgrade and expansion demand. Legal, financial services,
                             120                                                                                 and technology, media and telecommunications sectors drove leasing demand
                                                                                                                 in the Puxi CBD. However, demand in the Puxi CBD faced competition from the
                             110                                                                                 rapidly growing decentralised market.
              Index

                                                                                                           •     The decentralised market saw strong leasing activity and recorded net take-
                             100
                                                                                                                 up of over 120,000 sqm. Notable deals included PepsiCo’s 8,000 sqm lease in
                                                                                                                 Gopher Center and Metlife’s 3,500 sqm lease in Landmark Center.
                              90

                                                                                                           New wave of supply enters the market
                              80
                               4Q12           4Q13            4Q14    4Q15         4Q16     4Q17
                                                                                                           •     Four projects with a total GFA of 528,600 sqm reached completion in the CBD,
                                                                                                                 including the 632 metre skyscraper Shanghai Tower. In the decentralised
                                         Rental Value Index           Capital Value Index
                                                                                                                 market, seven projects with a total GFA of 442,000 sqm entered the market.
               Arrows indicate 12-month outlook
               Index base: 4Q12 =100                                                                       •     Vacancy increased in both the CBD and the decentralised markets as the
               Financial Indicators are for the CBD.                                                             large volume of new supply will take time to be absorbed. Vacancy rose 3.0
               Souce: JLL
                                                                                                                 percentage points q-o-q to 12.1% in the Pudong CBD, while Puxi CBD vacancy
                                                                                                                 rose 6.1 percentage points to 14.0%. In the decentralised market, vacancy
               Physical Indicators                                                                               increased 4.5 percentage points q-o-q to 22.5%.

                             1,000                                                          15             Emerging CBDs outperform
                                                                                                           •     CBD rents remained flat as a large amount of supply entered the market and
                              800                                                           12                   landlords were conservative on rents amidst increased competition. In the
                                                                                                                 decentralised market, rents grew moderately by 1.0% q-o-q, led by emerging
              Thousand sqm

                              600                                                           9                    CBDs such as the Railway Station and North Bund clusters.
                                                                                                 Percent

                              400                                                           6
                                                                                                           •     The investment market continued to be active. A state-owned enterprise
                                                                                                                 purchased an office tower with a GFA of about 20,500 sqm at Poly Greenland
                              200                                                           3                    Plaza. There also was a revival in activity by foreign investors, as BlackRock and
                                                                                                                 Ascendas acquired Grade B office buildings in Putuo and Huangpu.
                                   0                                                        0
                                         12       13          14     15      16       17F                  Outlook: Large supply to put pressure on rental performance
                                          Take-Up (net)                   Completions                      •     Both the CBD and decentralised markets will see a large volume of supply in
                                          Future Supply                   Vacancy Rate                           2017, and vacancy is expected to rise in the near term. While expansion and
                                                                                                                 upgrade demand should help absorb new space, supply pressures are expected
               For 2012 to 2016, take-up, completions and vacancy rates are year-end                             to impact rent performance in the near term.
               annual. For 2017, take-up, completions and vacancy rate are as at 1Q17,
               while future supply is for 2Q17 to 4Q17.                                                    •     A positive rental outlook over the mid to long term should continue to entice
               Physical Indicators are for the overall market.                                                   investors to acquire office assets in Shanghai. As assets for sale in the CBD
               Source: JLL
                                                                                                                 become scarce, more investors are likely to look to the rapidly developing
                                                                                                                 decentralised market for opportunities.
                                                                                                           Note: Shanghai Office refers to Shanghai’s overall Grade A office market, consisting of Pudong, Puxi and
                                                                                                           decentralised areas.
Shenzhen
                                                                                                             “Strong end user demand
                                                                                                             amid limited availability of
                                                                                                                en bloc assets in the
                                                                                                                     CBD area.”

                                                                                                                                                                                        17 – Office
                                             sqm per month,                 Stage in Cycle
    Rental Growth Y-O-Y                                                                                        Tom Liu, Head of Capital Markets,
         –2.4%
                                               net on GFA                    Rents                                       South China
                                             RMB 289                         Stable

                                                                                              Financial Indices
Expansion demand driven by finance companies
                                                                                                            150
•     Leasing demand continued on an upward trend, supported by enquiries from
      finance and high-tech companies. In Futian, we observed active expansion                              140
      from banks, securities firms and fund companies. However, some insurance
                                                                                                            130
      companies slowed down their expansions due to stricter supervision by the
      China Insurance Regulatory Commission.                                                                120

                                                                                             Index
•     Real estate companies from outside of Shenzhen were more active than                                  110
      in previous quarters. With more projects being launched, new set-up and
                                                                                                            100
      expansion demand increased.
                                                                                                             90
Completions top 400,000 sqm for third consecutive quarter
                                                                                                             80
•     In 1Q17, there were five new completions located in Futian and Nanshan                                  4Q12         4Q13            4Q14    4Q15         4Q16     4Q17
      submarkets. These new buildings pushed total Grade A office stock in Shenzhen
                                                                                                                      Rental Value Index           Capital Value Index
      to 5.6 million sqm.
                                                                                              Arrows indicate 12-month outlook
•     The vacancy rate in most existing Grade A office building remain unchanged in           Index base: 4Q12 =100
      the quarter. However, there was a large amount of vacant space in some new              Financial Indicators are for Futian.
                                                                                              Source: JLL
      completions due to limited pre-leasing activity by landlords. As a result, the
      overall vacancy rate rose 3.0 percentage points to 15%.
                                                                                              Physical Indicators
Rents remain broadly stable
•     Rents were generally stable as steady occupancy in most mature buildings                              1,600                                                        16
      helped counter rental pressures from new supply and landlords of select older                         1,400                                                        14
      buildings lowering rents in a bid to boost occupancy. Several landlords of high                       1,200                                                        12
      quality buildings raised rents.
                                                                                             Thousand sqm

                                                                                                            1,000                                                        10
•     In 1Q17, there were investment inquiries from insurance and high-tech
                                                                                                                                                                              Percent
                                                                                                             800                                                         8
      companies for bulk strata-titled purchases and en bloc assets. A lack of
                                                                                                             600                                                         6
      investment options in the core area saw some investors considering options in
      prime projects in emerging submarkets or lower grade options on the edge of                            400                                                         4

      the core area.                                                                                         200                                                         2

                                                                                                                  0                                                      0
Outlook: Healthy economic outlook attracting domestic capital                                                         12       13          14     15      16       17F
•     About 1 million sqm of new supply will come on-stream in the next 12 months,                                     Take-Up (net)                   Completions
      with most new projects located in Futian and half of which will be headquarter                                   Future Supply                   Vacancy Rate
      buildings. Although overall leasing demand is likely to remain steady, new
      supply will likely drive up the overall vacancy rate.                                   For 2012 to 2016, take-up, completions and vacancy rates are year-end
                                                                                              annual. For 2017, take-up, completions and vacancy rate are as at 1Q17,
•     Domestic investors are expected to continue to look for opportunities in                while future supply is for 2Q17 to 4Q17.
      Shenzhen, attracted by its healthy fundamentals and solid outlook. Self-use             Physical Indicators are for the overall market.
                                                                                              Source: JLL
      requirements are likely to be the primary driver of investment activity.

Note: Shenzhen Office refers to Shenzhen’s overall Grade A office market.
Taipei
                               “Occupiers and investors
                                 remain observant.”
18 – Office

                                   Jamie Chang, Head of Research,
                                             Taiwan                                                                                                     ping per month,          Stage in Cycle
                                                                                                             Rental Growth Y-O-Y
                                                                                                                                                           net on GFA             Rents
                                                                                                                    0.3%                               NTD 3,109                  Stable
               Financial Indices
                                                                                                         Relocations support demand
                             140
                                                                                                         •     Most new leases in the quarter were commitments to small-to-mid sized units
                                                                                                               which began negotiations last year. In 1Q17, net take-up reached 3,100 ping and
                             130
                                                                                                               was primarily driven by occupiers from finance, tech and medical industries.
                             120
                                                                                                         •     Office buildings with affordable rents in the city fringe continued to attract
                                                                                                               corporate occupiers. Continual demand pushed the vacancy rate down by
              Index

                             110
                                                                                                               0.9 percentage points to 3.1%. We saw demand mainly driven by financial
                             100                                                                               institutions establishing back offices and tech firms setting up operations.

                             90                                                                          No new supply
                                                                                                         •     There was no new supply entering the market in the quarter.
                             80
                              4Q12          4Q13            4Q14    4Q15         4Q16     4Q17           •     The overall Grade A market vacancy rate declined by 0.5 percentage points to
                                       Rental Value Index           Capital Value Index                        8.6%. Nonetheless, many tenants remained on the side-lines awaiting higher
                                                                                                               quality space. Leasing activity was concentrated in Xinyi and pepherial areas of
               Arrows indicate 12-month outlook
               Index base: 4Q12 =100                                                                           the CBD. However, leasing activity slowed in Dunhua North and South.
               Financial Indicators are for Xinyi.
               Source: JLL                                                                               Landlord offer better deals
                                                                                                         •     Overall rents remained stable at NTD 2,644 per ping per month as landlords
               Physical Indicators                                                                             remained hesitant to raise rents amid a seasonal lull in leasing activity and
                                                                                                               prolonged negotiation processes.
                              250                                                         15
                                                                                                         •     Investment volumes declined 6.8% y-o-y to NTD 8.4 billion in 1Q17, with
                              200                                                         12
                                                                                                               uncertainty surrounding political, economic and monetary policies weighing on
                                                                                                               investor sentiment.
              Thousand sqm

                              150                                                         9
                                                                                                         Outlook: Occupiers and investors remain cautious
                                                                                               Percent

                              100                                                         6
                                                                                                         •     Leasing demand is likely to continue to be driven by finance, IT and high-tech
                                                                                                               industries. Several biotech and medical firms have enquired about expansion
                               50                                                         3                    opportunities within the Grade A office market. However, with businesses
                                                                                                               expected to remain cautious, leasing activity should remain centred on small-
                                   0                                                      0                    to mid-sized units.
                                       12       13          14     15      16       17F
                                                                                                         •     Retailers entering Taiwan and corporates seeking self-occupied properties
                                        Take-Up (net)                   Completions
                                                                                                               may help shore up demand in the office market. This coupled with developers
                                        Future Supply                   Vacancy Rate
                                                                                                               actively looking for land parcels suggests some heightened confidence in the
               For 2012 to 2016, take-up, completions and vacancy rates are year-end                           market.
               annual. For 2017, take-up, completions and vacancy rate are as at 1Q17,
               while future supply is for 2Q17 to 4Q17.
               Physical Indicators are for the overall market.
               Source: JLL

                                                                                                         Note: Taipei Office refers to Taipei’s overall Grade A office market.
Tokyo
                                                                                                           “Rental growth slows as
                                                                                                           vacancy rises, while the
                                                                                                            investment market is
                                                                                                          characterised by a lack of

                                                                                                                                                                                     19 – Office
    Rental Growth Y-O-Y
                                             tsubo per month,       Stage in Cycle                            product for sale.”
                                               gross on NLA         Growth
           2.2%                            JPY 36,439                                                          Takeshi Akagi, Head of Research,
                                                                    Slowing                                                Japan

                                                                                           Financial Indices
Tenants are looking to future supply to fill space requirements
                                                                                                         170
•     The labour market tightened further in February with the unemployment rate
      decreasing to 2.8%, while the jobs-to-applicant ratio rose to 1.43. In the March                   160

      Tankan Survey, sentiment among large manufacturers and non-manufacturers                           150
      improved relative to the previous survey.                                                          140

•     Despite demand for new setups and expansion, negative net absorption                               130

                                                                                          Index
      was recorded in 1Q17 as space was vacated in Akasaka/Roppongi and Ebisu                            120
      submarkets. Finance and insurance, professional services and manufacturing                         110
      firms were the most active occupier categories. With a large supply pipeline,                      100
      occupiers are adopting a longer-term perspective in their decision making and
                                                                                                          90
      many are pre-committing to upcoming supply. Around 40% of the space due to
                                                                                                          80
      come online this year has been committed while a healthy amount (50%) of the                         4Q12         4Q13            4Q14    4Q15         4Q16     4Q17
      2018 supply has also been pre-leased.
                                                                                                                   Rental Value Index           Capital Value Index

Vacancy rises above 2%                                                                     Arrows indicate 12-month outlook
•     Otemachi Park Building (60,000 sqm) was completed in the quarter and with a          Index base: 4Q12 =100
                                                                                           Source: JLL
      commitment rate of about 60%. Anchor tenants included PwC and Citi Group.
      New projects added to the development pipeline included Kojimahci 5-chome
      Project (NLA 19,000 sqm) and Marunouchi 1-2 Tower Building (NLA 64,000 sqm).
                                                                                           Physical Indicators
•     The vacancy rate stood at 2.7% at end-1Q17, increasing 80 bps q-o-q and 40 bps
      y-o-y. The rise was attributed to new supply in Otemachi/Marunouchi and                             600                                                         6
      higher vacancy in submarkets such as Akasaka/Roppongi and Ebisu.                                    500                                                         5

Capital values maintain growth trend                                                                      400                                                         4
                                                                                          Thousand sqm

•     Rents rose for the twentieth consecutive quarter in 1Q17 and growth was largely                     300                                                         3
                                                                                                                                                                           Percent

      driven by Otemachi/Marunouchi and Toranomon submarkets.
                                                                                                          200                                                         2
•     Capital values increased 2.2% q-o-q and 3.4% y-o-y. This marked the twentieth                       100                                                         1
      straight quarter of growth and the second successive quarter of acceleration. A
      notable sales transaction in the quarter was Japan Prime Realty’s acquisition of                         0                                                      0

      a stake in Tokyo Square Garden for JPY 18.4 billion (NOI cap rate of 3.1%).                        –100                                                         –1
                                                                                                                   12       13          14     15      16       17F
Outlook: Rent and capital value growth to moderate                                                                 Take-Up (net)                    Completions
•     The Japanese economy is expected to recover moderately in 2017, with Oxford                                  Future Supply                    Vacancy Rate
      Economics projecting real GDP growth of 1.4%.
                                                                                           For 2012 to 2016, take-up, completions and vacancy rates are year-end
•     Healthy demand alongside moderate supply in 2017 should see vacancy remain           annual. For 2017, take-up, completions and vacancy rate are as at 1Q17,
                                                                                           while future supply is for 2Q17 to 4Q17.
      below 3%. Nonetheless, the trend of modest rental growth is expected to persist      Source: JLL
      as occupiers are mindful of the large supply pipeline due in 2018. With cap rates
      at or near record lows, there is likely little room for further compression and
      capital values are expected to grow in line with rents.

Note: Tokyo Office refers to Tokyo’s 5 Kus Grade A office market.
Osaka
                              “Vacancy decreases amid
                                  robust demand;
                               while investor appetite
20 – Office

                                  remains strong.”
                                                                                                                                                                                   Stage in Cycle
                                   Takeshi Akagi, Head of Research,                                                Rental Growth Y-O-Y                     tsubo per month,
                                               Japan                                                                     5.9%
                                                                                                                                                             gross on NLA           Rents
                                                                                                                                                          JPY 17,710                Rising
               Financial Indices
                                                                                                               Healthy demand from various sectors
                             180
                                                                                                               •     The labour market in Greater Osaka continued to tighten with the
                             170                                                                                     unemployment rate dipping 10 bps m-o-m to 2.8% in January, slightly
                             160                                                                                     outperforming the national average. At the same time, the jobs-to-applicant
                             150                                                                                     ratio rose to 1.34. According to the March Tankan Survey, sentiment indexes for
                             140
                                                                                                                     both large manufacturers and non-manufacturers improved.
              Index

                             130                                                                               •     Upgrade and expansion demand from wholesale and retail trade, as well as
                             120                                                                                     information and communications industries were the main contributors to
                             110
                                                                                                                     net absorption in the quarter, which totalled 10,000 sqm. Positive take-up
                                                                                                                     by these industries helped offset a major relocation by an information and
                             100
                                                                                                                     communication firm to its new headquarters building which completed in
                             90
                              4Q12          4Q13            4Q14        4Q15         4Q16          4Q17
                                                                                                                     Osaka Business Park.
                                       Rental Value Index               Capital Value Index                    Vacancy decreases to 3.3% amid solid demand
               Arrows indicate 12-month outlook                                                                •     No new supply entered the Grade A office market in Osaka in 1Q17.
               Index base: 4Q12 =100
               Source: JLL                                                                                     •     The vacancy rate stood at 3.3% at end-1Q17, decreasing 60 bps q-o-q and 120
                                                                                                                     bps y-o-y. Amid a healthy level of demand and no new supply, submarkets
                                                                                                                     including Umeda, Dojima and Midosuji saw vacancy decrease. Meanwhile,
               Physical Indicators                                                                                   Nakanoshima recorded an increase in vacancy due to a relocation following the
                                                                                                                     completion of a redevelopment.
                              180                                                              12
                                                                                                               Rent growth slows while capital value growth picks up
                              150                                                              10
                                                                                                               •     Rents in the Grade A office market in Osaka averaged JPY 17,710 per tsubo
                              120                                                              8                     per month at end-1Q17, increasing 1.3% q-o-q and 5.9% y-o-y. This was the
              Thousand sqm

                                                                                                                     eleventh consecutive quarter of rising rents and growth was driven by Umeda
                                                                                                     Percent

                               90                                                              6                     and Midosuji submarkets.
                               60                                                              4               •     Capital values increased 4.9% q-o-q and 14.0% y-o-y, reflecting rental growth
                                                                                                                     as well as cap rate compression. This was the fourteenth consecutive quarter
                               30                                                              2
                                                                                                                     of growth. A notable investment transaction in in the quarter involved MCUBS
                                   0                                                           0                     MidCity disposing of Midosuji MID for JPY 9 billion.
                                       12       13          14     15          16        17F

                                        Take-Up (net)                      Completions                         Outlook: Rents and capital values to grow moderately in 2017
                                        Future Supply                      Vacancy Rate                        •     The Greater Osaka economy is expected to grow moderately in 2017, with
                                                                                                                     Oxford Economics projecting real GDP to rise 0.9%. Nevertheless, global
               For 2012 to 2016, take-up, completions and vacancy rates are year-end                                 economic uncertainty presents a risk to the outlook.
               annual. For 2017, take-up, completions and vacancy rate are as at 1Q17,
               while future supply is for 2Q17 to 4Q17.
               Source: JLL                                                                                     •     Vacancy is projected to remain below 5% in 2017 despite the expected
                                                                                                                     completion of a new building - the first since early 2015, and this should support
                                                                                                                     further rental growth. In the investment market, investor interest should remain
                                                                                                                     strong as investors look outside of Tokyo for opportunities. However, the scope
                                                                                                                     for further cap rate compression is likely to be limited.
                                                                                                               Note: Osaka Office refers to Osaka’s 2 Kus Grade A office market.
Seoul
                                                                                                         “Moderate tenant demand
                                                                                                          and a lack of new supply
                                                                                                          boosts occupancy rates.”

                                                                                                                                                                                           21 – Office
                                                                   Stage in Cycle                              Yongmin Lee, Head of Research,
    Rental Growth Y-O-Y                      pyung per month,
                                                                                                                          Korea
         –3.5%
                                            net effective on GFA    Rents
                                          KRW 93,560                Falling
                                                                                           Financial Indices
Leasing activity focused on the CBD
                                                                                                         130
•     Overall net absorption was recorded at 15,000 pyung and was led by the CBD
      where a technology division of KB Card leased 4,300 pyung at Tower 8, and                          125
      pharmaceutical company MSD (2,400 pyung) relocated to Seoul Square from                            120
      the Mapo sub-district.
                                                                                                         115
•     The Gangnam market was also active, with Samsung’s Enterprise Resource

                                                                                          Index
                                                                                                         110
      Planning team taking up 2,800 pyung at Samsung Secho Town, Medidata Korea
      leasing 700 pyung at Gangnam Finance Center and Analog Device occupying                            105

      540 pyung at Posco Center.                                                                         100

Lotte World Tower completes in Jamsil                                                                    95

                                                                                                         90
•     Aided by positive absorption and a lack of Grade A supply, overall vacancy                          4Q12          4Q13            4Q14        4Q15         4Q16          4Q17
      declined 100 bps q-o-q to 10.8%.
                                                                                                                   Rental Value Index               Capital Value Index
•     Outside of our Grade A basket, SK D&D completed refurbishment of Susong
                                                                                           Arrows indicate 12-month outlook
      Square in the CBD and the landmark Lotte World Tower completed in Jamsil.            Index base: 4Q12 =100
      The office portion of the 123 floor tower is 56.2% committed, predominantly by       Financial Indicators for the CBD.
                                                                                           Source: JLL
      affiliates of Lotte.

Rents decline in the CBD and Yeouido
                                                                                           Physical Indicators
•     Overall rents declined 0.8% q-o-q reflecting the subdued occupier market and
      competition between CBD and Yeouido landlords to lease several large vacant                         500                                                              15
      units.
                                                                                                          400                                                              12
•     Investment volumes softened to KRW 757 billion following record deal volumes
      in 4Q16. Concluded transactions were dominated by Samsung affiliates which
                                                                                          Thousand sqm

                                                                                                          300                                                              9     Percent
      disposed of three office buildings: Samsung Fire & Marine Insurance’s Euljiro
      HQ, Samsung Life’s Taepyeongro Building in the CBD and Metro Tower in                               200                                                              6
      Gangnam.
                                                                                                          100                                                              3
Outlook: Robust investment despite soft leasing demand
•     Net absorption may swing into negative territory as local conglomerates depart                           0                                                           0
      leased buildings for owner-occupied stock. Sluggish tenant demand may result                                 12       13          14     15          16        17F

      in further pressure on rent incentives, although Gangnam looks likely to                                      Take-Up (net)                      Completions
      outperform given the lack of expected departures from the district as well as the                             Future Supply                      Vacancy Rate

      comparably low vacancy rate of the district.
•     In contrast to the leasing market, the investment market is expected to remain       For 2012 to 2016, take-up, completions and vacancy rates are year-end
                                                                                           annual. For 2017, take-up, completions and vacancy rate are as at 1Q17,
      robust aided by significant domestic and international liquidity, although rising    while future supply is for 2Q17 to 4Q17.
      interest rates may provide some headwinds over the medium term.                      Physical Indicators are for the overall market.
                                                                                           Source: JLL

Note: Seoul Office refers to Seoul’s Grade A office market.
Singapore
                               “Pressure on rents easing
                               on the back of improved
                                pre-commitments and
22 – Office

                                  short-term tapering
                                                                                                                                                                                                    Stage in Cycle
                                      of supply.”                                                                  Rental Growth Y-O-Y                     sq ft per month,

                               Tay Huey Ying, Head of Research,                                                         –6.8%
                                                                                                                                                        gross effective on NLA                       Rents
                                          Singapore
                                                                                                                                                            SGD 8.44                                 Falling
               Financial Indices
                                                                                                               CBD take-up remains positive on the back of attractive rents
                             130
                                                                                                               •     Net take-up in 1Q17 improved slightly from 4Q16 on the back of more
                             125                                                                                     affordable rents and leasing incentives. The increase in net absorption was also
                             120
                                                                                                                     due to tenants moving into Guoco Tower, with the physical occupancy rate of
                                                                                                                     the building increasing at a moderate pace.
                             115
                                                                                                               •     Similar to previous quarters, overall CBD leasing activity was mixed and came
              Index

                             110
                                                                                                                     from the business services, finance and insurance, and technology sectors. A
                             95                                                                                      major bank renewed its lease, and if this renewal is excluded, approximately
                             90                                                                                      half of the deals overseen by JLL were for expansion and/or relocation.
                             85
                                                                                                               Near-term supply expected to peak in 2Q17
                             80
                              4Q12          4Q13            4Q14        4Q15         4Q16          4Q17
                                                                                                               •     Guoco Tower (0.9 million sq ft) was completed in 3Q16 and the building is
                                                                                                                     almost fully committed as of 1Q17. No major en bloc supply was completed in
                                       Rental Value Index               Capital Value Index
                                                                                                                     the CBD in 1Q17.
               Arrows indicate 12-month outlook
               Index base: 4Q12 =100                                                                           •     A total of 2.2 million sq ft of prime office space in the CBD will be completed
               Financial Indicators are for the CBD.                                                                 by end-2Q17 – Marina One’s completion was delayed from 1Q17, while UIC
               Source: JLL
                                                                                                                     building is expected to come on stream in 2Q17. Both buildings have achieved
                                                                                                                     healthy pre-commitment rates.
               Physical Indicators
                                                                                                               Decline in rents slowed as the leasing market briefly stabilises
                              250                                                              10              •     Overall CBD rents declined at a pace that is similar to the modest correction
                                                                                                                     of the preceding quarter, an indication that rents may be finding support from
                              200                                                              8                     occupiers. Furthermore, the healthy pre-commitments in Marina One and UIC
                                                                                                                     Building have partially assuaged landlords’ anxiety over maintaining
              Thousand sqm

                              150                                                              6                     occupancy.
                                                                                                     Percent

                              100                                                              4               •     Institutional investors continued to be active in the office market and the
                                                                                                                     increase in interest rates did not dampen the long-term market view held by
                               50                                                              2                     many investors. The availability of capital provided support to the market and
                                                                                                                     countered any drastic correction in capital values.
                                   0                                                           0
                                       12       13          14     15          16        17F                   Outlook: 2017 leasing market could perform better than 2016
                                        Take-Up (net)                      Completions                         •     Supply pressure on CBD rents is easing as upcoming buildings achieved healthy
                                        Future Supply                      Vacancy Rate                              pre-commitments before their completion. The upgrade in the 2017 GDP
                                                                                                                     forecast by most private economists could lift business sentiment and drive
               For 2012 to 2016, take-up, completions and vacancy rates are year-end                                 further activity within the office market.
               annual. For 2017, take-up, completions and vacancy rate are as at 1Q17,
               while future supply is for 2Q17 to 4Q17.
               Physical Indicators are for the CBD.                                                            •     While office rents are expected to continue to trend down in the next few
               Source: JLL                                                                                           quarters, the pace of correction is likely to stay moderate as space in the newer
                                                                                                                     buildings is taken up and new supply starts to taper.

                                                                                                               Note: Singapore Office refers to Singapore’s CBD Grade A office market in Marina Bay, Raffles Place, Shenton
                                                                                                               Way and Marina Centre.
You can also read