CONVERGENCE PROGRAMME OF HUNGARY - GOVERNMENT OF HUNGARY 2017-2021
←
→
Page content transcription
If your browser does not render page correctly, please read the page content below

GOVERNMENT OF HUNGARY

CONVERGENCE PROGRAMME
     OF HUNGARY
      2017-2021

        April 2017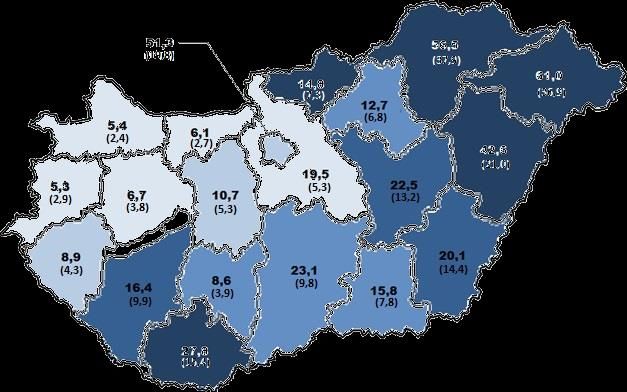
Convergence Programme of Hungary, 2017–2021 April 2017
Convergence Programme of Hungary, 2017–2021                                                                                                            April 2017

Contents

1.           ECONOMIC POLICY OBJECTIVES.................................................................................................................5
2.           MACROECONOMIC DEVELOPMENTS AND FORECAST .....................................................................................7
     2.1      INTERNATIONAL ENVIRONMENT ...............................................................................................................7
     2.2      COMPONENTS OF GROWTH ....................................................................................................................9
             External economy ..........................................................................................................................14
             Investment......................................................................................................................................17
             Consumption ..................................................................................................................................23
     2.3      LABOUR MARKET ................................................................................................................................25
     2.4      INFLATION ........................................................................................................................................31
     2.5      CYCLICAL POSITION .............................................................................................................................32
     2.6      EXTERNAL BALANCE ............................................................................................................................34
     2.7      ASSESSMENT OF THE ECONOMIC OUTCOMES OF GOVERNMENT MEASURES ....................................................35
     2.8      MONETARY AND EXCHANGE RATE POLICY ................................................................................................37
     2.9      FINANCIAL SECTOR ..............................................................................................................................39
3.           GENERAL GOVERNMENT DEFICIT AND DEBT...............................................................................................44
     3.1      FISCAL POLICY OBJECTIVES ....................................................................................................................44
     3.2      THE 2016 BUDGETARY OUTCOME .........................................................................................................45
     3.3      THE 2017 BUDGET .............................................................................................................................46
     3.4      THE 2018 BUDGET .............................................................................................................................48
     3.5      BUDGETARY DEVELOPMENTS FROM 2019 TO 2021 ..................................................................................51
     3.6      STRUCTURAL BALANCE .........................................................................................................................52
     3.7      A GENERAL GOVERNMENT DEBT ............................................................................................................53
4.           SENSITIVITY ANALYSIS...........................................................................................................................60
5.           LONG-TERM SUSTAINABILITY OF PUBLIC FINANCES......................................................................................62
6.           QUALITY OF PUBLIC FINANCES ................................................................................................................65
     6.1      STRUCTURE AND EFFICIENCY OF THE EXPENDITURE OF PUBLIC FINANCES.........................................................65
     6.2      A STRUCTURE AND EFFICIENCY OF REVENUES ...........................................................................................68
7.           INSTITUTIONAL FEATURES OF PUBLIC FINANCES ..........................................................................................73
     7.1      BUDGETARY FRAMEWORK ....................................................................................................................73
     7.2      PUBLIC FINANCE STATISTICAL GOVERNANCE .............................................................................................73
TABLES ...........................................................................................................................................................75
Convergence Programme of Hungary, 2017–2021 April 2017
Convergence Programme of Hungary, 2017–2021                                                            April 2017

1. ECONOMIC POLICY OBJECTIVES

The excessive deficit procedure launched for
Hungary in 2004 was abrogated in June 2013, and in     The external and internal balance indicators remain
spring 2016 the European Commission assessed that      favourable. As a result of the disciplined fiscal policy,
there were no longer macroeconomic imbalances in       the general government deficit was 1.8% of GDP in
the economy. These developments contributed to         2016, whereas the debt-to-GDP ratio decreased to
the establishment of an economic environment           74.1%, contributing to the moderation of the
which enables an economic growth exceeding 4%.         country’s external vulnerability. The 5-year CDS
At the same time, this means that the Hungarian        spread – which presents the default risk of the
GDP growth is well above the average level of the      country – decreased from around 300 basis points in
European Union throughout the whole time horizon       2013 below 120 basis points in April 2017. The
of the convergence programme. As for the               credit rating agencies, one after the other, improved
upcoming period, the rapid convergence of the          Hungary’s rating. During 2016 each of the three big
country is ensured while keeping the general           credit rating agencies improved the rating of
government deficit under 3% of GDP permanently.        Hungary to investment grade; as a result, the
                                                       Hungarian Debt Management Agency is able to raise
The Hungarian economy was brought on a balanced        funds from a wider range of investors, thus
and dynamic growth path. As a result of the            contributing to the stability of debt financing. Due to
proactive and growth-supporting economic policy,       the targeted measures the share of public debt
the GDP grew by 4% in 2014, 3.1% in 2015 and 2% in     denominated in foreign currency decreased, as well
2016. In the last three years, the GDP growth –        as the debt held by non-residents. All these
regarding the production side – was driven by          significantly contributed to the moderation of the
industrial production (in particular manufacturing)    economy’s vulnerability.
and services; whereas regarding the expenditure
side, household consumption and exports were the       The number of employees – due to the favourable
engines of growth. It is a particularly favourable     turnaround on the labour market – increased to
development that – despite the significant decrease    near 4.4 million as compared to the 3.7 million seen
of EU transfers – the Hungarian economy was able       in 2010. Following a consecutive decrease of 56
to perform better than the EU average last year. The   months (on an annual basis), the unemployment
Hungarian economic growth can be considered            rate decreased to 4.5% in Q1 2017. After 2010,
sustainable with a balanced structure, since the       nearly 400 thousand – previously inactive – persons
majority of the sectors of the economy positively      returned to the labour market and started to look
contribute to growth which is not driven by            for a job actively. This means a 10% increase
unjustified borrowing.                                 approximately, while the European average did not
                                                       reach 2%, and we saw a similarly low growth in our
The growth-supporting fiscal policy still takes into   neighbouring countries as well. As a result, the
account the importance of a more rapid decrease of     activity rate increased to a level exceeding 70% and
the debt ratio in an environment described by global   converged to the EU average that now is only 2.8
ultra-low interest rates and buoyant economic          percentage points higher. In order to strengthen the
growth. Hungary – with only one exception –met its     positive labour market developments, as well as to
medium-term budgetary objective in the last 5 years    improve the job-creation and labour force retention
(since 2012); moreover, this is also true for the 5-   capabilities of the Hungarian economy and to
year average. In addition, Hungary is one of the few   ensure the competitiveness of the country, we can
Member States within the European Union where          regard the wage agreement entered with the
public debt has been continuously declining since      employers’ organisations and trade unions in
2011.                                                  November as one of the most important economic

                                                                                                              5
Convergence Programme of Hungary, 2017–2021 April 2017
policy developments in the last year. This agreement allocated amounts will significantly strengthen the
contributes to the expansion of the domestic labour investment performance in the period of 2017-2019.
market supply, as well as to the increase in workers’
willingness. The Hungarian economic policy has arrived to an
important milestone in 2017. Though the sound
The six-year wage agreement is expected to result in a budgetary management and the decrease of the debt
significant wage convergence by which the country will ratio will continue, in parallel with mobilising the
perform the convergence of Hungarian wages at an increasingly scarce reserves of the labour market the
optimal pace. The increase of wages will not lead to the Government’s tools to stimulate economic growth
deterioration of the general government deficit. The also include the more efficient use of economic
agreement includes the raise of the minimum wage and resources, as well as the enhanced improvement of
guaranteed wage minimum for 2017 and 2018 and productivity and competitiveness. Besides the
along with these (significantly decrease) the significant improvement of the productivity of the Hungarian
decrease of the employers’ tax burden, the reaching of a labour force, it is of the same importance to ensure
single-digit corporate tax rate, as well as the decrease of that the increase of wage level will take place
the employers’ social security contributions in the period proportionately with the improvement of
after 2018 (depending on the real wage growth). These productivity. Simultaneously with this, shifting the
all represent meaningful support for the economic structure of growth towards innovation-led business
developments of the upcoming years, and bring the activities with a higher added value is a headline
Hungarian economy on a more dynamic growth path. target as well. Improving the quality of growth is a
priority also from the aspect of competitiveness.
Along with the improvement of wages, the
Government announced an ambitious home creation In order to continuously assess the realisation of
programme. Besides supporting social policy economic policy objectives on a system-level the
objectives, it also boosts the economy. The National Competitiveness Council was founded by the
programme includes the reduction of the VAT rate on Government. By establishing the foundation for the
the sale of new apartments from 27% to 5%, support structural reforms and improving the social
in the form of a tax reimbursement for families acceptance of such reforms, this body actively
building a home on their own and the introduction of contributes to the improvement of productivity and –
the Family Housing Subsidy Scheme (non-refundable through the substantial decrease of bureaucratic
support and the related loan with supported burdens – the business environment. The members of
interests). In addition to these measures, the the Council were invited by the Minister for National
reduction of the value added tax on certain basic Economy from among recognised representatives of
foodstuffs, restaurant services and internet will also the business sphere, economic organisations,
boost the purchasing power which – along with the educational and scientific institutes.
measures supporting the sustainment of the
mentioned labour market trends and those Overall, following the successful crisis management
supporting families – will contribute further to a rise period, the macroeconomic stability of the Hungarian
in household consumption. economy was restored, and the subsequent growth-
supporting economic policy measures set the
The economic policy places an emphasis not only on economy on a stable growth path, brought down the
improving the dynamics of household investments, deficit-to-GDP ratio under 3%, fostered the reaching
but on supporting corporate investments as well. On of a record level of employment and reduced the
the one hand, the corporate tax rate cut to 9% is one burdens on the households. In the following period,
of the lowest rates in international comparison. On one of the Government’s main goals will be to
the other hand, the accelerated payments of the EU improve the competitiveness of the country by
funds of the new multiannual financial framework efficient measures which – besides stimulating the
serves the strengthening of the business climate in economy – will contribute to the further decrease in
Hungary. Due to the typical pre-financing the the public debt.
6Convergence Programme of Hungary, 2017–2021 April 2017
2. MACROECONOMIC DEVELOPMENTS AND FORECAST
2.1 INTERNATIONAL ENVIRONMENT
After almost a decade since the outbreak of the The economic growth of the US remained below the
financial crises, the North Atlantic economies are preliminary expectations with a moderate annual
increasingly leaving behind its adverse cyclical effects. growth of 1.6% only. Nevertheless, the economy
However the year of 2016 meant a bottom in the gained momentum in Q3: the labour market
world economy as the lowest growth was seen developments now indicate the approaching of full
worldwide since the crisis, not only in the GDP, but employment, the business cycle stepped into mature
also in the international trade. The following factors phase, also affecting wage and price inflation. As a
contributed to the slowdown: low raw material prices, result of these, the Fed raised the key interest rate in
risks related to the Chinese growth, referendum on December 2016 and this March, thus the phasing out
the EU membership of the United Kingdom, and the of previous loose monetary conditions continued.
uncertain outcome of the presidential election in the Looking forward, further growth may be fuelled by
US. These effects were reflected in the decreasing the tax cut announced by the new US administration,
confidence indices (Chart 2.1), as well as in the as well as further fiscal loosening steps. These
weaker H1 GDP figures both in the developed measures due to the expanded foreign trade relations
economies and on the emerging markets. However, of the US could result in the growth of demand not
the economic growth in the developed economies only in the US, but throughout the world as well.
gained momentum in the second half of the year, and Nevertheless, US trade policy, a potential
– due to the increase in raw material prices – the protectionist turnaround of which would pull back the
previously pressured situation of the raw material dynamics of world trade, poses a downside risk.
exporting economies could also ease; these resulted
in strengthening GDP growth in a number of In line with the expectations, the European Union
countries. Due to the unfolding favourable presented a GDP growth of 1.9% in 2016; the
developments, the outlook for this year improved economic performance remained stable despite the
significantly, and even if global growth is surrounded uncertainty that was primarily generated by Brexit.
by risks, the international environment will possibly Owing to the rapidly increasing employment rate,
show a better overall picture in the upcoming period exceeded its pre-crisis level in the last year, and
according to the expectations. wages, consumption became the engine of growth,
Chart 2.1.: European economic sentiment whereas the expansion of investments remained
indicators subdued. In addition, the growth in the euro area was
120 (index, balances) 2 supported by the loose monetary policy of the ECB
110 1
and by low raw material prices, while the exports’
dynamics decelerated in parallel with the more
100 0
moderate expansion of the world trade. The
90 -1 slowdown in the foreign markets was noticeable in
the case of Germany as well, since the exports
80 -2
increased by only 2.5% following the pace of 4-5% in
70 -3 the previous years. However, despite these
developments, the economic growth of our largest
60 -4
2008 2009 2010 2011 2012 2013 2014 2015 2016 2017 export partner has been accelerated as compared
Ifo (German) ESI (EU) Euro area BCI
with 2015, fuelled by the persistent expansion of
domestic demand.
Source: Cesifo, European Commission
7Convergence Programme of Hungary, 2017–2021 April 2017
As for the next few years, the overall picture is more its growth. In the second half of the last year,
favourable. According to the forecast of the European uncertainty was eased by the economic policy
Commission, substantial growth is expected in all measures implemented by the Chinese government
Member States over the forecast horizon for the first with whom the decision-makers aimed at mitigating
time since the crisis (Chart 2.2). The continuing the sharp decline in private investments. Nonetheless,
positive labour market developments create a solid this may further raise the already high level of
base for stable expansion of consumption, even along corporate indebtedness, thus finally leading to an
with a slowly accelerating inflation. The increase of expanded shadow bank system and the increase of
investments continues, and will be further supported financial vulnerability. In Russia the recovery is
by the gradual acceleration of projects implemented anticipated to continue, thus economic growth can
under the European Investment Plan. The positive return in 2017 and 2018, due to the increase in
global outlook may boost the foreign trade of the EU domestic demand and the expected expansion of
as well. In addition, in parallel with the favourable exports.
developments of economic performance, the budget
balances of the Member States also improve which Overall, the growth of the global economy is expected
may enable the implementation of further to boost this year, which is also reflected in the values
government investments and structural reforms that of forward-looking business indices hitting multiyear
raise the growth potential of these economies. peaks at the beginning of the year. The majority of the
However, the economic policy directions emerging in countries returned again back to the growth path by
the aftermath of the elections held in numerous the end of the last year, and raw material prices have
Member States this year and the exit process of the also been on the rise, primarily since the conclusion of
United Kingdom involve uncertainty. the OPEC agreement of November 2016. The
forecasts for growth of this year and the next year
Chart 2.2.: GDP growth in the main regions may be positively affected by the fiscal loosening
(per cent)
planned in larger economies, mainly in the US.
8 Furthermore, expansion is also expected on the
7 emerging markets, supported by the gradual increase
6 of raw material prices, the predicted recovery of
5 larger emerging economies, as well as the higher
demand from developed economies.
4
3
In recent years the growth-supporting monetary
2 policy tools gradually ran out; while by the
1 improvement of the cyclical processes and the return
0 of inflation the gradual phasing out of loose
USA Euro area Germany China conditions has already started in many countries. At
2014 2015 2016 2017 the same time, fiscal policy has come into view again,
Source: Eurostat, European Commission, IMF providing substantial room for manoeuvre to give
The emerging markets show mixed picture, but in further stimulus for growth. For this reason, the role
general their growth is more fragile. Within this of fiscal measures within economic policy is expected
group, due to the structural change taking place in the to become more appreciated also internationally in
Chinese economy – a market of key importance from the upcoming period.
the aspect of Hungary’s external trade –, numerous
question marks still remain about the sustainability of
8Convergence Programme of Hungary, 2017–2021 April 2017
2.2 COMPONENTS OF GROWTH
The economic policy measures of the first years after the GDP growth (overall, by 1.6 percentage points) –
2010 focused on the restoration of the country’s including, for example, the trading and tourist
financial stability. As a result of these measures, since activities –; which is mainly explained by the
2013 the Hungarian economy has been growing again outstanding real wage dynamics. Out of the
in a stable way. The Hungarian gross domestic production sectors, agriculture – with its double-digit,
product expanded by 4% in 2014, 3.1% in 2015 and nearly 17% expansion – also contributed greatly to
2% in 2016. When assessing the growth developments the performance of the economy. However, industrial
of the last year, it should be noted that in 2015 the EU output grew at a slower pace (by 0.8%) as compared
funds available in the EU programming period 2007- with 2015 due to the lower capacity expansion of the
2013 and of that starting from 2014 could be used as sector and the weak external demand; at the same
well, whereas in 2016 only the funds of the new cycle time, the construction sector – resulting from the
were available. Despite of this, it can be stated that cyclical nature of EU funds – held back GDP growth by
the Hungarian economy performed above the EU 0.6 percentage points.
average in 2016, even though the absorption of the
EU funds was more moderate than previously seen. On the demand side, the favourable labour market
Therefore, Hungary continued converging in the last and inflation trends resulted in a substantial increase
three years, exceeding the growth of the majority of of consumption (by around 5%), which is highest rate
EU member states (Chart 2.3). since 2003. In parallel with the developments of
construction, however, investments declined at a
It is also a good sign that the structure of growth is similar extent in the last year. The net export
balanced and sustainable. This is due to the fact that explained nearly one-third of the growth, originating
most of the sectors contributed positively to the from, inter alia, transportation and the outstanding
strengthening performance of the economy, and the performance of service centres operating in Hungary.
growth was not fuelled by imbalances. This is well
illustrated by the fact that the external trade surplus On the forecast horizon several factors affect the
reached a record high level in the last year, and – due growth outlook of Hungary. Beside the strong
to the disciplined fiscal policy – the general fundamentals of the Hungarian economy, the
government deficit (1.8% of the GDP) remained at a expected, persistently high growth rates are also
low level. supported by the Government’s economic policy
measures.
Analysing the GDP growth from production side, we
can conclude that services contributed primarily to
Chart 2.3: Changes of GDP in the EU between 2013 and 2016
50 44,1 (per cent)
40
30 22,2 Egyéb**
20 14,4 12,3
10,4 10,3 10,0 10,0 9,4 8,6 8,1 8,0
7,7 7,2 6,9 5,9 5,9 5,7 5,3
10 4,6 4,5 4,1 3,9 3,1 3,1 3,0
1,8 1,0 0,1
0
Estonia
Malta
Romania
Italy
Bulgaria
Slovakia
Germany
Cyprus
Hungary
Lithuania
Finland
Poland
Austria
Sweden
Netherlands
Denmark
France
Ireland
Luxembourg
Czech Republic
Spain
United Kingdom
Latvia
Belgium
Croatia
Portugal
Slovenia
EU-28
Greece
Source: Eurostat, MfNE calculation
9Convergence Programme of Hungary, 2017–2021 April 2017
One of the most important pillars of the growth- are still lagging behind their level of 2008. As for the
supporting economic policy measures is the 6-year latter, precautionary motives could play a significant
wage agreement concluded at the Permanent role, making the households postpone their
Consultation Forum of the Private Sector and the consumption (as far as it was possible). In the
Government, due to which additional income is forthcoming period, the easing of such motives – and
generated for the economic agents in the form of thus the decrease of savings – is expected to happen,
wage increases, social contribution tax and corporate which also supports growth acceleration (Box 5).
income tax cuts; these factors support the domestic
demand, the increase of employment and export Chart 2.4: Economic growth since the crisis
(Q3 2008 = 100%)
capacities, as well as the competitiveness of the
180
Hungarian economy (Box 1). Regarding the corporate
income tax cut, it is important to note that the
measure may stimulate the generation of capital- and
140
technology-intensive, high value added investments.
Beside the wage agreement, there is a wide range of 100
fiscal incentives which stimulate the demand, e.g. the
support of dwelling constructions (Family Housing
Subsidy Programme, 5% VAT rate for dwelling 60
construction). The upswing of the housing market and 2008 2009 2010 2011 2012 2013 2014 2015 2016
its economic impact is well reflected in the number of GDP growth Investments
dwelling permits issued in 2016, rising by two and a Consumption (durable) Consumption (other)
Export in goods Export in services
half times. The enhanced utilization of EU funds also
Source: HCSO, Eurostat, MfNE calculation
supports growth acceleration. In 2016 EU funds of
more than HUF 1,700 billion were paid to the Overall, substantial growth acceleration is expected: a
beneficiaries under the budgetary framework for GDP growth of 4.1% and 4.3% are estimated for this
2014-2020; at the same time, this year’s payment is and for the following year, respectively, which is
planned to reach HUF 2,200-2,700 billion. In addition, expected to remain above 3.5% in the consecutive
it is important to note that a larger share of the years, as well (Chart 2.5). Partly due to the
transfers paid in the last year are advance payments, Government’s economic policy measures, it becomes
thus the stimulating impacts of these projects mainly possible to speed up, thus the growth potential of the
applies for this year’s and the following years’ Hungarian economy improves significantly,
macroeconomic developments. contributing to a faster catching up of the country to
the developed Western European states.
Beside the Government’s economic policy measures,
the expanding export capacities of the country, Chart 2.5: GDP growth: demand side
(percentage point)
resulting from a number of already announced
investment projects implemented by large companies, 6 4,3
5 4,1
also support the acceleration of the Hungarian 3,8 3,7
4 2,0 3,6
economy. Furthermore, the stronger dynamics of 3
export is also supported by the favourable economic 2
1
outlook of our main external markets.
0
-1
-2
Finally, we can conclude that although GDP and
2016 2017 2018 2019 2020 2021
consumption recently reached the pre-crisis levels,
Fact data Forecast
there is still room for recovery, which supports further
acceleration (Chart 2.4). Investments and durable Net export Final consumption
consumer goods (within the category of consumption) Gross capital formation GDP
Source: MfNE calculation, HCSO
10Convergence Programme of Hungary, 2017–2021 April 2017
Box 1: Strengthening the competitiveness of Hungarian economy
Theories concerning international trade and international competitiveness focused on price-based
competitiveness in the first times. This also contributed to the chosen policy attitude of Central European
economies – supported by the unanimous advice from international organisations – after the regime change, i.e.
the improvement of their price and cost competitiveness in the first place, enhancing capital inflows. However,
these inflows utilized cheap labour force of the region and in many cases introduced technologies that proved to
be of low profitability at that time in the home country of foreign investors due to high Western labour costs.
Though these capital investments also contributed to the integration of the region’s economies into international
trade and their convergence, cheap labour force meant inadequate incentive for the introduction of modern,
capital-intensive technologies.
This is of crucial importance, since nowadays other dimensions of competitiveness have become increasingly
dominant: production processes capable of creating high added value, as well as innovation and technological
development giving the base for such processes. These aspects are not new at all: almost a century ago,
Schumpeter argued that innovation is not just simply the accumulation of capital, but also means the increase in
capital productivity. He described innovation process and its permanent change with the well-known term
“creative destruction”, by which he meant the establishment of new, more productive companies and the
changes they cause, thus catalysing economic growth. In the field of competitiveness, Miklós Káldor observed in
1978 that economies presenting the most dynamic economic growth also witness a rapid increase of labour
costs. Consequently, the message of the “Káldor-paradox” can be summed up as follows: keeping prices and
costs low in itself does not clearly result in a competitive advantage or faster economic growth.
Changes in real GDP and unit labour cost between 2004 and 2015 in the EU member countries
(y-o-y, percent)
8
Average annual growth of unit labour cost
6
between 2004-2015
4
(per cent)
Hungary
2
0
-2
-2 -1 0 1 2 3 4 5
Average annual GDP-growth between 2004-2015
(per cent)
Source: Eurostat
In accordance with the above, the Government pays special attention to the reinforcement of growth potential
of the Hungarian economy and the sustainment of its long-term competitiveness. In order to achieve these, the
Government also takes policy measures beyond the narrow category of macroeconomic (fiscal, monetary)
policies. To ensure an institutionalised professional forum for dialogue on developments of competitiveness and
the initiatives aiming to improve competitiveness, and also in line with the recommendations on national
productivity boards approved by the Council of the European Union (only binding for the Member States of the
euro area), the Government – with its Gov. Decree no. 1538/2016 (X.13.) – decided on setting up of the National
Competitiveness Council. This consultative board – including recognised professionals from the business and
11Convergence Programme of Hungary, 2017–2021 April 2017
scientific world – does not only comment on the initiatives relevant from the aspect of Hungary’s economic
competitiveness, but also makes proposals for governmental interventions aiming to improve it. The opinion,
positions and proposals of the National Competitiveness Council are presented to the Government by the
Minister for National Economy through the Economic Cabinet. The institutional conditions and staff of analysts
required for the efficient operation of the Council are provided by the Ministry for National Economy.
International experience shows that national competitiveness boards – by assessing structural conditions of
economic growth, developments of productivity and various aspects of competitiveness on system-level and by
making policy proposals based on these – are able to efficiently facilitate the provision of basis for policies and
structural reforms improving competitiveness and also the development and social acceptance of these policies.
The recognition of this fact led to the issue of the Council’s above recommendation as well.
During its first three sessions, the National Competitiveness Council reviewed the factors basically determining
the competitiveness of the Hungarian economy. Furthermore, beyond the long-term, system-level interventions
aiming to improve the competitiveness comprehensively – such as the problems arising from the lack of qualified
labour force or the challenges of digitalisation –, the Council identified several possibilities for intervention which
enable the improvement of business environment even in the short run according to the findings of Doing
Business survey conducted by the World Bank, in particular in the fields of company formation, construction
permits and taxation, as well as corporate insolvency.
Following the detailed analysis of intervention possibilities for affecting business environment, two proposals
were presented to the Parliament in the fields of facilitating the licensing of investments and the simplification of
company formation: on the one hand, in connection with the reduction of time required for connecting to
electricity network and the automation of registering for local tax on the other. Measures aiming to facilitate the
licensing of investments also include the simplification of procedures related to settlement planning and
connection to gas and water networks. In addition, in order to reduce cash in circulation, the Council formulated
proposals for the introduction of a social account, as an encouragement of electronic payment of public utility
bills and the completion of the companies’ tax returns by the NTCA.
Beside the above, the conclusion of 6-year wage agreement focusing on the modern factors of competitiveness –
initiated by the Hungarian Government – is also crucial. As a result of the wage increases coupled with the
moderation of wage costs, it is increasingly worth to work; furthermore, the higher remuneration for work may
encourage employers to improve their productivity and to shift to a production structure with higher added
value. It is a particularly favourable development that taxes on labour become more competitive in the region
due to the social contribution tax cut. From the aspect of labour force, it is the “efficiency wages” theory that
sums up how increases of real wages result in stronger efforts and more efficient work performance on the
individual’s level, and that it can also improve the health condition of employees, hence the latter has positive
repercussions on the employers’ productivity. As a result of higher real wages, not only employees become more
motivated, but also employers to improve their productivity and to renew the way how they organise and
perform work in practice. In addition, higher wages raise activity, facilitate the companies’ search for labour
force, and also reduce costs resulting from the fluctuation thereof. With the improvement of income situation,
conflicts between employers and employees may further ease.
The government supports improvement of productivity and the enhancement of competitiveness by cutting
corporate tax rate to 9% as well, which is the lowest tax rate in the EU. According to researches, the effective
corporate tax burdens negatively correlate with the long-term economic growth, since they pull back
investments, capital-intensive FDI inflow (representing high technology level) and – last but not least –
entrepreneurial activity. Consequently, the corporate tax cut encourages the renewal of companies, as well as
motivates them to become more efficient and productive; these may result in the noticeable increase in
productivity on macroeconomic level.
12Convergence Programme of Hungary, 2017–2021 April 2017
Tax wedge in the OECD countries Corporate income tax rates in the OECD countries
(2016, percent) (2016, percent)
Chile 7,0
PIT
New Zealand 17,9 Switzerland 8,5
Employee SSC
Mexico 20,1 Hungary (2017) 9,0
Employer SSC c
Switzerland 21,8 Ireland 12,5
Israel 22,1 Latvia 15,0
Korea 22,2 Canada 15,0
Ireland 27,1 Germany 15,8
Australia 28,6 Slovenia 17,0
United Kingdom 30,8 Poland 19,0
Canada 31,4 Hungary (2016) 19,0
United States 31,7 Czech Republic 19,0
Japan 32,4 United Kingdom 20,0
Iceland 34,0 Turkey 20,0
Poland Iceland 20,0
35,8
Finland 20,0
OECD - Average 36,0
Estonia 20,0
Norway 36,2
Sweden 22,0
Denmark 36,5
Slovak Republic 22,0
Netherlands 37,5
Korea 22,0
Turkey 38,1
Denmark 22,0
Luxembourg 38,4
Luxembourg 22,5
Estonia 38,9
Japan 23,4
Spain 39,5
Chile 24,0
Greece 40,2
Spain 25,0
Hungary* 41,2
c Norway 25,0
Portugal 41,5 Netherlands 25,0
Slovak Republic 41,5 Israel 25,0
Slovenia 42,7 Austria 25,0
Sweden 42,8 Italy 27,5
Czech Republic 43,0 Portugal 28,0
Finland 43,8 New Zealand 28,0
Austria 47,1 Greece 29,0
Italy 47,8 Mexico 30,0
France 48,1 Australia 30,0
Hungary (2016) 48,2 Belgium 33,0
Germany 49,4 France 34,4
Belgium 54,0 United States 35,0
0 10 20 30 40 50 60 70 0 10 20 30 40
* Representing the tax wedge as a result of 6-year wage agreement . Source: OECD, MfNE calculations
The 6-year wage agreement entered on the initiative by the Government is an economic policy milestone which
breaks with previous price- and cost-based competitiveness approach that, after a while, hindered convergence;
instead, the agreement encourages technology-based competitiveness. Therefore, through improving
productivity – as a factor basically affecting potential growth in the long run – it also permanently strengthens the
growth capability of the Hungarian economy.
13Convergence Programme of Hungary, 2017–2021 April 2017
External economy
In parallel with the slowdown of world trade – similarly as of trade, thus the surplus hit a record high level in the
to the economies of the European Union – the dynamics last year by reaching nearly EUR 10 billion (Chart 2.6). As
of the Hungarian foreign trade remained moderate in an overall result, foreign trade contributed positively to
2016 as compared to the pace of expansion in the the GDP growth.
previous years. Last year the volume of exports increased
by 5.8%, whereas the volume of imports rose by 5.7% on
Chart 2.6.: Hungarian balance of
an annual basis; in the meantime, the structure of foreign external trade in goods
trade remained balanced. (between 1995-2016, million EUR & per cent )
10 000 20
The exports of services continued its rapid expansion (at 7 500 15
a rate exceeding 7%); however, the dynamics of exports 5 000 10
of goods decreased to a 5.3% growth. In the case of
2 500 5
services, a significant expansion can be seen in the fields
of transportation, tourism and business services. Beside 0 0
the effect of the high base, the slowdown of the increase -2 500 -5
in exports of goods took place due to the fact that
-5 000 -10
industry could not repeat its outstanding performance 1995 2000 2005 2010 2015
presented in the two preceding years. This is related to
Balance of external trade in goods
the heavy slowdown of the production of domestic Balance in percent of GDP (r.a.)
Source: HCSO
vehicle manufacturers, which was caused partly by the
reorganisation of production required for the
modernisation of the models manufactured in Hungary. Looking forward, the expansion of foreign trade is
In addition, the dynamics of exports was also hindered forecasted to be more dynamic as compared to the last
by the Russian embargo both directly and indirectly year. The growth of exports is driven by the somewhat
through the production chain. Nevertheless, according more moderate , but stable increase in the stock of orders
to the commodity statistics, the EUR value of the exports in manufacturing, which may be also supported by the
of goods – except for the fuels – increased in every main world trade that is expected to accelerate from this year.
product group as compared with 2015 – overall, by The favourable signs of the improving international
2.9%. Within the group of products with higher weight, business environment could be already experienced in
the most dynamic expansion of exports developed as the development of the domestic and foreign confidence
follows: power-generating machinery and equipment indices since the beginning of the year, reflecting the
(+7.9%), general industrial machinery and equipment optimism of market participants (Chart 2.7). As compared
(+4.8%) and electrical machinery and appliances (+3.7%). with last year’s dynamics, industry is expected to grow at
a more favourable rate, which will also reflect in the
As for the imports, the overall rate of expansion was expansion of exports (Chart 2.8). Furthermore, the
similar to that of exports; however, the 6.2% dynamics previously announced and implemented investments
of the imports of goods exceeded that of the services. strengthen the companies’ export activity as well. This is
The rise in incomes – due to the favourable labour also supported by the corporate tax rate cut, which may
market developments – resulted in the increase in encourage the companies to implement further
households’ consumption; this is also reflected in the investments aiming at expanding their export capacities in
18.4% expansion of tourist activities. Beyond this, the the coming years.
export suppliers’ needs ensured the basis for the
buoyant imports.
The surplus of the external trade in goods continuously
grew which was also supported by the improving terms
14Convergence Programme of Hungary, 2017–2021 April 2017
Chart 2.7.: German business climate, the Irinyi Plan and the Supplier Development
Hungarian export of goods and Programme – which support the industrial production
manufacturing export sales with higher added value, the networking and the
30 (balances, y-o-y volume, per cent)
introduction of modern technologies (e.g. industry
15 4.0) –, as well as the Digital Success Program
supporting the improvement of the small and
0
medium-sized enterprises’ (SMEs) competitiveness.
-15 Furthermore, a significant part of the EU funds is
-30
dedicated to economic development, for instance
many sources support – amongst others – the
-45 companies’ R&D&I activity and their entry to the
2008 2009 2010 2011 2012 2013 2014 2015 2016 2017
international market (Box 2).
CESifo German business climate
Manufacturing export sales (3-month rolling averages)
Export of goods (3-month rolling averages)
Source: CESifo, HCSO Chart 2.8.: Hungarian exports'
developments
In the upcoming period, the increase of imports will
(y-o-y, per cent)
be highly driven by the accelerating absorption of EU 15
transfers which entails increasing import content of 10
domestic demand. In addition, due to the import
5
demand of the supplier networks and the accelerating
domestic use, i.e. the expanding consumption of 0
households and the investments of companies, the -5
imports may grow at a rate exceeding that of the
-10
exports. As a result of these, the contribution of
-15
external trade to the GDP growth may shift to the
2008 2010 2012 2014 2016 2018 2020
negative range over the forecast horizon.
Export markets Export performance Exports
Source: European Commission, HCSO, MNE calculations
In the mid-run, domestic export activity may be
further fostered by the economic development
programmes announced by the Government, such as
15Convergence Programme of Hungary, 2017–2021 April 2017
Box 2: Growth-supporting fiscal policy as a tool for breaking out of low growth trap after the crisis
Following the financial crisis of 2008, growth of global GDP and world trade significantly slowed down. Output of
economies in the world have grown by 3% in the recent years, lagging behind the 4% average of the two decades prior
to the crisis, whereas the volume of world trade expanded by only 2% annually in the last two years. While in the
1990s and 2000s the volume of international trade of goods and services grew 2-2.5 times faster than global GDP,
whereas the expansion of trade in the last two years fell short of the growth rate of the GDP. Several factors
contributed to international trade losing momentum: the shift of East Asian economies to domestic consumption, the
run-out of reserves hiding in international trade integration, the changing trends of manufacturing industrial
production (e.g. declining import of semi-finished products as compared to manufacturing industrial export) and a
number of further effects (for example financial volatility, the Russian embargo, Brexit and the spread of protectionist
trade policy).
Development of world trade and global GDP
(y-o-y, percent)
13
8
3
1980-2008: 2,3
2012-2018: -0,3
-3
Average of growth differences
-8
(percentage points)
-13
1980 1983 1986 1989 1992 1995 1998 2001 2004 2007 2010 2013 2016f
World trade Global GDP
Source: OECD Economic Oultook Database
Being the driving force of integration, world trade can support growth and productivity. However, external demand
lost momentum currently, thus the economies – including Hungary – cannot rely on the dynamic expansion of foreign
markets. Therefore, in this situation, “domestic engines of growth” become increasingly important.
Regarding crisis management, the growth-constraining effect of fiscal austerity measures became the subject of
international debate. Recently, it has become increasingly accepted that fiscal policies should focus on
supporting long-term, balanced growth. This requires the review of budget structures by countries. Productive
investments financed from government sources may catalyse investment activity of the private sector, which
may, in the long-term, result in the expansion of the production capacities of the economy. Furthermore, the
increase in potential GDP may entail the expansion of tax revenues as well. Such growth-friendly fiscal measures
include infrastructural measures, green infrastructure, R&D, healthcare and educational developments, as well as
labour market programmes. In order to break out from the low growth trap, beside developments implemented
by the government, a long-term positive effect may be ensured through the tax reform. Regarding the revenue
side, the shift from the personal income tax and the corporate tax to the taxes on consumption has a positive
effect on growth. The cut of the personal income tax, the social security contributions and the corporate tax has
a positive effect on the GDP both in the short-term and the long-term.
It can be stated that the Hungarian economic policy – far before the above, emerging consensus – implemented
a stabilisation during which it could avoid the excessive restraining of domestic demand through the sharing of
16Convergence Programme of Hungary, 2017–2021 April 2017
burdens, thus prevented a self-generating process hindering growth. Besides keeping government deficit well
below 3% and the debt ratio on a declining path, this turnaround made it available for the Government to take a
number of measures that serve the economic and social enrichment of Hungary. As a result, for example,
personal income tax rate was cut to 15%, family tax and social security contribution allowances were introduced,
the Family Housing Subsidy was made available, a number of career models ensure now a calculable income
path, and these measures enhance the keeping of labour force, the expansion of employment and positively
affect demographic developments as well. Looking forward, social contribution tax will be reduced from 27% to
11.5% and tax on company profits was cut to 9% uniformly as a result of the 6-year wage agreement as well. On
the expenditure side, a number of growth-stimulating investments were launched, such as the Modern Cities
Programme (MVP) or complex road reconstruction programmes. Not least, due to the multi-year cycle of the
public work programme, hundreds of thousands of people could return to the world of work, thus facilitating
inclusive economic growth.
So the Government deployed, and will use also in the future, the entire fiscal room for manoeuvre available –
and also that created by itself – to establish favourable conditions for the highest possible boosting of the
domestic engines of growth.
Investment
In 2016 more than HUF 6200 billion developments has Chart 2.9.: Contribution of sectors to the
been implemented in Hungary; however, investment development of gross fixed investments
(percentage point)
activity decreased by 15.5% year-on-year. This setback
16
was primarily caused by the high base effect of
12
government investments related to the 2007-2013 EU
8
budget cycle, whereas some branches in private sector
4
showed a strengthening performance. As a result,
0
private investments contributed positively to the
-4
economic growth in 2016 as well. As for the future, a
massive pick up in investments can be expected from -8
2017, with a contribution of all the three sectors (Chart -12
2.9). Dynamic increase in investments is favourable since -16
2015 2016 2017 2018 2019 2020 2021
the developments will support the economic growth Government
also after the capacities have been built and the Households
production has started. Corporations
Investment growth (YoY, %)
Source: MfNE calculation, HCSO
Manufacturing investments, representing the largest
weight in corporate sector, increased by 7% in 2016, A strong growth dynamics is expected to unfold in the
also investments in trading services grew by 10% year- coming quarters, supporting on the one hand by the
on-year (Chart 2.10). These two branches amount to permanently high level of capacity utilisation in
40% of investments, confirming that, the overall manufacturing industry anticipating further
decrease in 2016 was not closely correlated with the developments. On the other hand, the corporate
performance of industrial productive and service income tax rate reduced to 9% and the historically low
providing companies. financial market yields along with the strong demand
are establishing appropriate conditions for the
replacement of depreciated production equipments,
the deployment of new capacities and the
enhancement of capital intensity in the Hungarian
17Convergence Programme of Hungary, 2017–2021 April 2017
economy. Furthermore, expansion of investments is The HIPA is increasingly focusing on technology-
also anticipated by the recently announced large intensive investments, which resulting in higher value
projects primarily linked to the automotive industry added production. It is supported by the changes in
and its supplier chain (Box 3). Favourable spill-over subsidy system based on individual government
effects can be generated as the ongoing decisions (IGDs), supplemented by R&D and
developments include capacity expansions by innovation-supporting schemes. The ability of
automotive flagships like Audi and Mercedes, Hungary to attract investments is further reinforced
attracting further significant investments into the by the corporate income tax rate cut to 9% from 2017,
country through their supplier network. which is the lowest within the European Union. This
encourages investment decisions of newly arriving
Chart 2.10.: Development of investments in
manufacturing and trading services
corporations, as well as further capacity expansions of
(year-on-year, per cent) incumbent companies.
25
20 Beyond the above, the Government and from 2015
15 the Ministry for National Economy support the
10 incumbent companies with significant contribution to
5 the Hungarian economic and employment growth
0 under the Large Corporation Investment Subsidy
-5 Programme. Regarding these companies, their
-10 capacity expansions neither are a target group of
-15 tenders announced primarily for SMEs financed from
-20 EU funds, nor reach the development amount
2008 2009 2010 2011 2012 2013 2014 2015 2016 required for the IGD investment subsidies. In 2015
Total investments Manufacturing
and 2016, 49 companies received non-refundable
Trading services Source: HCSO subsidy with an overall amount of HUF 27.3 billion,
The continuous strengthening of Hungary’s ability to resulting in developments of nearly HUF 70 billion and
1,600 new jobs in the country. In 2017, a further
attract capital can be illustrated by the projects
managed by the Hungarian Investment Promotion amount of at least HUF 15 billion is available for the
Agency (HIPA). Due to investment decisions with a Government in order to subsidise investments of large
total value of EUR 3.2 billion in 2016, nearly 18 companies. Consequently, total value of investments
related to Large Corporation Investment Subsidy
thousand jobs will be created in the country resulting
in a 131% increase in value of investments compared Programme for 2015-2017 is expected to exceed HUF
to 2015 and a 36% growth in the number of created 110 billion, representing 0.3% of annual Hungarian
jobs. Almost two-thirds of investments will be realized GDP.
in the automotive industry, also the electronics
As a favourable spill-over effect, developments of
industry and the food industry have a significant share
large companies also encourage the investments of
within the developments. Regarding the new jobs
supplier network. It is a top priority that, small and
created, shared service centers (SSCs) play significant
medium-sized enterprises could participate more in
role beside the automotive industry. It is particularly
production and development of high value added
favourable that the announced 12 investment
products in order to get involved in supplier networks
projects in service sector – as a result of positive
of international large companies. Thus Government
decisions in 2016 – will create 2,500 jobs in the
supports the improvement of SMEs’ competitiveness
country, and will have a significantly positive impact
with the Supplier Development Programme, allocating
on the service export in the coming period. More than
a total amount of HUF 14 billion as of 2017. On the
half of total investment value is related to
one hand, the programme aims to establish the
developments implemented by German companies,
required conditions for the qualified supplier status.
also the second place is held by the US.
On the other hand, the subsidy contributes to the
implementation of technological developments and
18Convergence Programme of Hungary, 2017–2021 April 2017
innovations of SMEs (that already meet the supplier the demand side is also confirmed by the 29% annual
requirements) in order to obtain knowledge from increase in total value of new housing loans in 2016,
large companies that meet the expectations of which may be further boosted from 2017 by the wage
international market. In addition, regarding the increases thanks to the 6-year wage agreement.
improvement of domestic suppliers, the supplier
programme of HIPA should be mentioned. Supporting The favourable tendencies started on housing market
a favourable investor decision, one element of this are expected to become stronger in the coming years
programme aims to provide the foreign partners with confirming by the two and a half times growth in the
information, already in the interest stage, about the number of dwelling permits in 2016, meaning 31
Hungarian supplier chains and their operation related thousand permits, which is an 8-year record. The
to their sector. Another pillar of this programme is the dynamics of housing construction is expected to
widest possible involvement of domestic SMEs in the accelerate further in 2017 thus households’
supplier chain of large companies. investments will significantly contribute to the GDP
growth (Box 4). Remaining favourable tendencies in
Regarding households’ investments, it can be stated real estate market can be underpinned by housing
that a strong pick up unfolded in 2016. Beside the market surveys. According to the survey of GKI, at the
stably low interest rate environment and the beginning of 2017 the intention of households to build
permanent improvements in employment stance and or purchase a home reached the pre-crisis level for
income position of households, the subsidies provided the first time. As a result of all these, nearly 20
under the Family Housing Subsidy Programme also thousand new dwellings are expected to be built in
boosted the demand side of housing market. As a 2017 and 30 thousand in 2018, in parallel with the
result of this, a continuous rise in the number of continuous build-up of capacities in the construction
issued dwelling permits in the last three years is industry. In the long run, the high number of housing
already reflected in the surge of dwelling constructions may stabilise, thus ensuring the gradual
constructions as well. During the last year, 10 renewal of housing stock.
thousand dwellings were built in the country, which
means a 31% increase year-on-year. The expansion on
19You can also read