The EEconomic aand EEmployment Contributions oof SShale GGas iin tthe United SStates
←
→
Page content transcription
If your browser does not render page correctly, please read the page content below
The Economic and Employment
Contributions of Shale Gas in the
United States

                                                 Prepared for:
                    AMERICA'S NATURAL GAS ALLIANCE

                                                Submitted by:
                                  IHS Global Insight (USA) Inc.
                       1150 Connecticut Avenue NW, Suite 401
                                       Washington DC 20036

                                              December 2011
THE ECONOMIC AND EMPLOYMENT CONTRIBUTIONS OF SHALE GAS IN THE UNITED STATES

          About IHS Global Insight (USA) Inc.
          IHS Global Insight (USA) Inc. is one of the leading economic analysis and forecasting firms in the world. With over 600 econ-
          omists, statisticians, and industry specialists in 25 offices worldwide, IHS Global Insight has an established track record for
          providing rigorous, objective forecast analysis and data to governments and businesses around the world.
          Among our areas of expertise are the economic impact, tax implications, and job-creation dynamics within multiple sectors
          core to national, state and local economies. It helps governments and companies at all levels interpret the impact of pro-
          posed investments, policies, programs, and projects.
          IHS Global Insight (USA) Inc. was formed by the merger of DRI and WEFA. Still active in an advisory capacity to the firm is the
          original founder of WEFA, Lawrence R. Klein, the 1980 winner of the Nobel Prize in Economics.

          About IHS Inc. (www.ihs.com)
          IHS Inc. (NYSE: IHS) is a leading source of information and insight in critical areas that shape today's business landscape,
          including energy and power; design and supply chain; defense, risk and security; environmental, health and safety, and sus-
          tainability; country and industry forecasting; and commodities, pricing and cost. IHS has been in business since 1959 and
          became a publicly traded company on the New York Stock Exchange in 2005. Headquartered in Englewood, Colorado,
          USA, IHS employs more than 5,100 people in more than 30 countries around the world.

                                                           For more information, contact:
                                                               Richard F. Fullenbaum
                                                         Vice President, Public Sector, IHS
                                                           Richard.Fullenbaum@ihs.com

                                                                  John W. Larson
                                                         Vice President, Public Sector, IHS
                                                               John.Larson@ihs.com

                                                          For press information, contact:
                                                                    Jim Dorsey
                                                       Senior Manager Media Relations, IHS
                                                               Jim.Dorsey@ihs.com

                                                          IHS Global Insight (USA) Inc.
                                                     1150 Connecticut Avenue NW, Suite 401
                                                            Washington, DC 20036

          (C) Copyright 2011. ALL RIGHTS RESERVED.
          All information contained herein is obtained by IHS Global Insight (USA) Inc. from sources believed by it to be accurate and reliable.
          All forecasts and predictions contained herein are believed by IHS Global Insight (USA) Inc. to be as accurate as the data and
          methodologies will allow. However, because of the possibilities of human and mechanical error, as well as other factors such as un-
          foreseen and unforeseeable changes in political and economic circumstances beyond IHS Global Insight's control, the information
          herein is provided "as is" without warranty of any kind and IHS Global Insight (USA) Inc., AND ALL THIRD PARTY PROVIDERS MAKE
          NO REPRESENTATIONS OR WARRANTIES EXPRESS OR IMPLIED TO ANY SUBSCRIBER OR ANY OTHER PERSON OR ENTITY
          AS TO THE ACCURACY, TIMELINESS, COMPLETENESS, MERCHANTABILITY OR FITNESS FOR ANY PARTICULAR PURPOSE OF
          ANY OF THE INFORMATION OR FORECASTS CONTAINED HEREIN.

ii                                                                                                                        DECEMBER 2011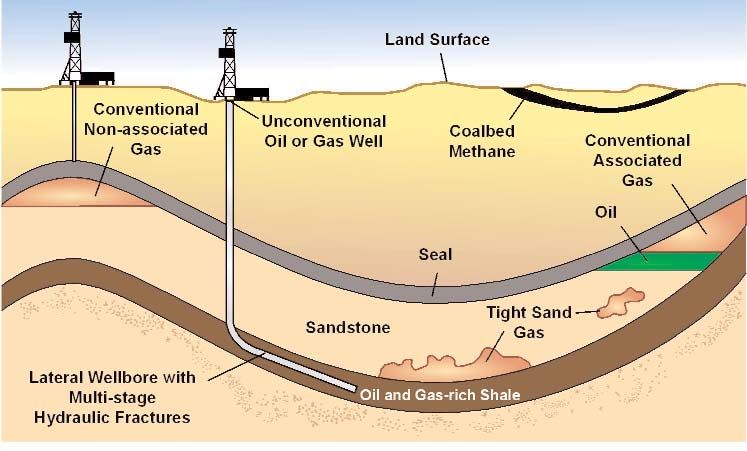
THE ECONOMIC AND EMPLOYMENT CONTRIBUTIONS OF SHALE GAS IN THE UNITED STATES

Project Team
Authors
Mohsen Bonakdarpour, Director, Economic Analysis and Planning, IHS
Bob Flanagan, Director, Economic Analysis and Planning, IHS
Chris Holling, Vice President, Economic Analysis and Planning, IHS
John W. Larson, Vice President, Public Sector, IHS
Contributors
Tabitha M. Bailey, Project Manager; Senior Associate, Public Sector, IHS
Richard F. Fullenbaum, Special Project Advisor; Vice President, Public Sector, IHS

Acknowledgments
We would like to acknowledge IHS Cambridge Energy Research Associates (IHS CERA) on which we have
relied for oil and gas expertise and analysis. For the data on oil and gas production, holdings, and reserves,
we have used the extensive IHS CERA oil and gas databases. In particular, we want to thank Dr. Mary Bar-
cella, IHS CERA Director, North American Natural Gas, and team leader; Samuel Andrus, Director, North
American Natural Gas, IHS CERA; and James Osten, Director, North American Natural Gas, IHS CERA.
We would also like to thank the additional subject-matter experts, technical experts, industry experts and
analysts that have contributed to this study:
    Parker Andrews, John Anton, Laura Hand, Miguel Goncalves, Yanni He, Dewey Johnson, Rafael
    McDonald, Joe Michael, Michael Montgomery, Walter Moody, John Mothersole, Shane Norton,
    Sunaina Ocalan, Rajeevee Panditharatna, Frantz Price, Surya Rajan, Tom Runiewicz, Mark We-
    genka, and Steve Zinger.

IHS Global Insight (USA) Inc. offers an independent assessment of the importance of the shale gas in-
dustry to the overall US economy. This research was supported by the America's Natural Gas Alliance
(ANGA). IHS Global Insight (USA) Inc. is exclusively responsible for all of the analysis and content con-
tained herein. The analyses and metrics developed during the course of this research are intended to
contribute to the national dialogue on the role of the shale gas in terms of production, employment, eco-
nomic growth, and energy security.

All of the value added and labor income contributions throughout this report are expressed in terms of
constant 2010 dollars.

IHS GLOBAL INSIGHT                                                                                               iii
THE ECONOMIC AND EMPLOYMENT CONTRIBUTIONS OF SHALE GAS IN THE UNITED STATES

Key Findings: The Economic and Employment Contributions of Shale Gas
in the United States
    This study examines the recent increases in shale gas production, the continued trend of growth ex-
    pected for shale gas production into the future, and the economic benefits of this growth, including
    the employment contributions.

A significant portion of the future growth in US natural gas productive capacity is expected to come from
shale gas. Increased shale gas activity will contribute to increased capital investment and job opportunities:
•   By 2010, shale gas had grown to 27% of total US natural gas production, and by September 2011, it
    had reached 34%.
•   By 2015, that share will grow to 43% and will more than double, reaching 60%, by 2035.
•   Nearly $1.9 trillion in shale gas capital investments are expected between 2010 and 2035.
•   Capital expenditures are especially strong in the near future, growing from $33 billion in 2010 to $48
    billion by 2015.
•   In 2010, the shale gas industry supported 600,000 jobs; this will grow to nearly 870,000 in 2015 and to
    over 1.6 million by 2035.
Growth in the shale gas industry will make significant contributions to the broader economy in terms of
Gross Domestic Product (GDP) and tax revenues:
•   The shale gas contribution to GDP was more than $76 billion in 2010. This will increase to $118 billion
    by 2015 and will triple to $231 billion in 2035.
•   In 2010 shale gas production contributed $18.6 billion in federal, state and local government tax and
    federal royalty revenues. By 2035, these receipts will more than triple to just over $57 billion. On a cu-
    mulative basis, the shale industry will generate more than $933 billion in federal, state, and local tax
    and royalty revenues over the next 25 years.
•   The extent of job and GDP contributions reflect the capital intensity of the shale gas industry, the ability
    to source inputs from within the United States, the nature of the supply chain, and the quality of the
    jobs created.
The growth of shale gas is leading to lower natural gas and electric power prices and increased productivity:
•   The full-cycle cost of shale gas produced from wells drilled in 2011 is 40-50% less than the cost of gas
    from conventional wells drilled in 2011.
•   Without shale gas production, reliance on high levels of liquefied natural gas (LNG) imports would influ-
    ence US natural gas prices, causing them to increase by at least 100%.
•   The lower natural gas prices achieved with shale gas production will result in an average reduction of
    10% in electricity costs nationwide over the forecast period.
•   By 2017, lower prices will result in an initial impact of 2.9% higher industrial production. By 2035, in-
    dustrial production will be 4.7% higher.
•   Chemicals production in particular stands to benefit from an extended period of low natural gas prices,
    as it uses natural gas as a fuel source and feedstock. Chemicals producers have already signaled their
    intentions to increase US capacity.
•   Savings from lower gas prices will add an annual average of $926 per year in disposable household in-
    come between 2012 and 2015. In 2035, this would increase to just over $2,000 per household.

IHS GLOBAL INSIGHT                                                                                                 v
THE ECONOMIC AND EMPLOYMENT CONTRIBUTIONS OF SHALE GAS IN THE UNITED STATES
TABLE OF CONTENTS
Executive Summary . . . . . . . . . . . . . . . . . . . . . . . . . . . . . . . . . . . . . . . . . . . . . . . . . . . . . . . . . . . . . . . . . .1
More than 1.6 Million Jobs . . . . . . . . . . . . . . . . . . . . . . . . . . . . . . . . . . . . . . . . . . . . . . . . . . . . . . . . . .1
$231 Billion in Total Value Added . . . . . . . . . . . . . . . . . . . . . . . . . . . . . . . . . . . . . . . . . . . . . . . . . . . . . .1
$933 Billion in Tax Revenues . . . . . . . . . . . . . . . . . . . . . . . . . . . . . . . . . . . . . . . . . . . . . . . . . . . . . . . . .2
A $1.9 Trillion Capital Expansion . . . . . . . . . . . . . . . . . . . . . . . . . . . . . . . . . . . . . . . . . . . . . . . . . . . . . .2
Macroeconomic Benefits of Lower Gas Prices . . . . . . . . . . . . . . . . . . . . . . . . . . . . . . . . . . . . . . . . . . .2
An Industrial Recovery and Renaissance . . . . . . . . . . . . . . . . . . . . . . . . . . . . . . . . . . . . . . . . . . . . . . . .2
Conclusion . . . . . . . . . . . . . . . . . . . . . . . . . . . . . . . . . . . . . . . . . . . . . . . . . . . . . . . . . . . . . . . . . . . . . .3
1. Introduction . . . . . . . . . . . . . . . . . . . . . . . . . . . . . . . . . . . . . . . . . . . . . . . . . . . . . . . . . . . . . . . . . . . . . .4
The Structure of This Report . . . . . . . . . . . . . . . . . . . . . . . . . . . . . . . . . . . . . . . . . . . . . . . . . . . . . . . . .5
2. An Introduction to Shale Gas . . . . . . . . . . . . . . . . . . . . . . . . . . . . . . . . . . . . . . . . . . . . . . . . . . . . . . . . .7
What Is Shale Gas? . . . . . . . . . . . . . . . . . . . . . . . . . . . . . . . . . . . . . . . . . . . . . . . . . . . . . . . . . . . . . . .7
Shale Gas Supply and Costs . . . . . . . . . . . . . . . . . . . . . . . . . . . . . . . . . . . . . . . . . . . . . . . . . . . . . . . .8
3. Shale Gas in the Context of the US Gas Market . . . . . . . . . . . . . . . . . . . . . . . . . . . . . . . . . . . . . . . . . .10
US Natural Gas Demand . . . . . . . . . . . . . . . . . . . . . . . . . . . . . . . . . . . . . . . . . . . . . . . . . . . . . . . . . . .11
Future Production Profile and Capital Expenditure Outlook for Shale Gas . . . . . . . . . . . . . . . . . . . . . .13
Estimating Production Profiles for Shale Gas Plays . . . . . . . . . . . . . . . . . . . . . . . . . . . . . . . . . . . . . . .14
Estimating Drilling Costs and Expenditures for Shale Gas Plays . . . . . . . . . . . . . . . . . . . . . . . . . . . . .15
4. Economic Contribution Assessment . . . . . . . . . . . . . . . . . . . . . . . . . . . . . . . . . . . . . . . . . . . . . . . . . .17
Approach and Methodology . . . . . . . . . . . . . . . . . . . . . . . . . . . . . . . . . . . . . . . . . . . . . . . . . . . . . . . .17
How to Define the Economic Contribution . . . . . . . . . . . . . . . . . . . . . . . . . . . . . . . . . . . . . . . . . . .17
Modeling the Economic Contribution . . . . . . . . . . . . . . . . . . . . . . . . . . . . . . . . . . . . . . . . . . . . . . .18
Measuring the Economic Contributions . . . . . . . . . . . . . . . . . . . . . . . . . . . . . . . . . . . . . . . . . . . . . . . .19
Employment Contribution . . . . . . . . . . . . . . . . . . . . . . . . . . . . . . . . . . . . . . . . . . . . . . . . . . . . . . . .20
Value Added- and Labor-Income Contributions . . . . . . . . . . . . . . . . . . . . . . . . . . . . . . . . . . . . . . .22
Government Revenues and Taxes . . . . . . . . . . . . . . . . . . . . . . . . . . . . . . . . . . . . . . . . . . . . . . . . .22
5. The Macroeconomic Impact of Low Natural Gas Prices . . . . . . . . . . . . . . . . . . . . . . . . . . . . . . . . . . . .24
Introduction . . . . . . . . . . . . . . . . . . . . . . . . . . . . . . . . . . . . . . . . . . . . . . . . . . . . . . . . . . . . . . . . . . . . .24
U.S. Manufacturing Industry and Natural Gas: The Context . . . . . . . . . . . . . . . . . . . . . . . . . . . . . . . . .24
Economic Contraction in a High Gas Price Scenario . . . . . . . . . . . . . . . . . . . . . . . . . . . . . . . . . . . . . .25
Macroeconomic Impact . . . . . . . . . . . . . . . . . . . . . . . . . . . . . . . . . . . . . . . . . . . . . . . . . . . . . . . . . . .26
6. Qualitative Impact on Key Industries . . . . . . . . . . . . . . . . . . . . . . . . . . . . . . . . . . . . . . . . . . . . . . . . . .28
The Chemicals Industry . . . . . . . . . . . . . . . . . . . . . . . . . . . . . . . . . . . . . . . . . . . . . . . . . . . . . . . . . . . .28
Power Generation Industry . . . . . . . . . . . . . . . . . . . . . . . . . . . . . . . . . . . . . . . . . . . . . . . . . . . . . . . . .33
Other Energy Intensive Industries . . . . . . . . . . . . . . . . . . . . . . . . . . . . . . . . . . . . . . . . . . . . . . . . . . . .34
7. Conclusions . . . . . . . . . . . . . . . . . . . . . . . . . . . . . . . . . . . . . . . . . . . . . . . . . . . . . . . . . . . . . . . . . . . . .36
Appendix A. Future Production and Capital Expenditure Outlook: Shale Gas . . . . . . . . . . . . . . . . . . . . . .39
Appendix B. Economic Contribution Assessment Detailed Tables: Shale Gas . . . . . . . . . . . . . . . . . . . . .46
Appendix C. IHS Global Insight Economic Contribution Assessment . . . . . . . . . . . . . . . . . . . . . . . . . . . .53
Appendix D. Bibliography of Existing Research Reviewed . . . . . . . . . . . . . . . . . . . . . . . . . . . . . . . . . . . .72
IHS GLOBAL INSIGHT viiExecutive Summary
This study presents the economic contribution of the shale gas industry - today and in the future. It does so
in terms of jobs, economic value, and government revenues. The research demonstrates how the develop-
ment of new sources of natural gas from shale formations has changed the US energy outlook and the
economy. In 2010, shale gas represented 27% of US natural gas production. Within the next five years, this
share will grow to 43% and is expected to increase to 60% by 2035. This natural gas "Shale Gale" has the
potential to support more than 1.6 million jobs and contribute more than $230 billion to GDP in 2035. On a
cumulative basis, it could generate more than $933 billion in federal, state and local government tax rev-
enues and federal royalty payments over the next 25 years.
In addition to the jobs, economic value, and government revenues generated by this industry, we also pres-
ent the broader macroeconomic impacts for both households and businesses. For example, in the absence
of the shale plays, the price of natural gas would be nearly triple ($10-$12 per MMBtu) what it is today ($4
per MMBtu). In turn, lower prices today provide a significant near-term boost to economic output and em-
ployment and are an important foundation for an increase in domestic manufacturing. This is especially true
in those industries that are intensive users of natural gas as a feedstock (transforming molecules into materi-
als), such as the chemicals industry, and industries that significantly benefit from lower costs for electricity.
More than 1.6 Million Jobs
The economic contribution of shale gas is measured by Shale Gas Employment Contribution
the sum of its direct contribution, its indirect contribution (Number of workers)
from shale's supplier industries, and an induced eco- 2010 2015 2035
nomic contribution resulting from further spending Direct 148,143 197,999 360,335
Indirect 193,710 283,190 547,107
throughout the US economy. The employment contribu-
Induced 259,494 388,495 752,648
tion takes on added significance at a time when jobs have
Total 601,348 869,684 1,660,090
become a top national issue. In 2010, the shale gas in-
Source: IHS Global Insight
dustry supported over 600,000 jobs, which included
148,000 direct jobs in the US, nearly 194,000 indirect jobs in supplying industries, and more than 259,000
induced jobs. By 2035, the shale gas industry will support a total of over 1.6 million jobs across the US
economy, comprised of more than 360,000 direct jobs, over 547,000 indirect jobs, and over 752,000 in-
duced jobs.
$231 Billion in Total Value Added
In terms of its value-added contribution to GDP, the shale Shale Gas Value Added Contribution
gas industry will contribute over $76 billion in 2010 alone. ($M)
This will increase to $118 billion by 2015 and will nearly 2010 2015 2035
Direct $29,182 $47,063 $93,043
triple to $231 billion in 2035.
Indirect $22,416 $33,501 $65,234
Induced $25,283 $37,650 $72,783
Total $76,880 $118,214 $231,061
Source: IHS Global Insight
All of the value added and labor income contributions throughout this report are expressed in terms of
constant 2010 dollars.
IHS GLOBAL INSIGHT 1THE ECONOMIC AND EMPLOYMENT CONTRIBUTIONS OF SHALE GAS IN THE UNITED STATES
$933 Billion in Tax Revenues Shale Gas Estimated Tax Payments
($M)
Furthermore, in 2010 the industry 2010 2015 2035 2010-2035
contributed $18.6 billion in govern- Federal Taxes $9,621 $14,498 $28,156 $464,901
ment tax revenues, comprised of State and Local Taxes $8,825 $13,827 $28,536 $459,604
federal, state and local taxes, and Federal Royalty Payments $161 $239 $583 $8,534
federal royalty payments. By 2035, Total Government Revenue $18,607 $28,565 $57,276 $933,039
Lease Payments to Private
this amount will grow to $57 billion. Landowners $179 $286 $841 $11,514
On a cumulative basis, the shale gas
Source: IHS Global Insight
industry will generate more than
$933 billion1 in tax revenues over the next 25 years.
A $1.9 Trillion Capital US Annual Capital Expenditure by Type: Shale Gas
($M)
Expansion Total
2010 2015 2035 2010-2035
IHS Global Insight expects Total Upstream Capital Expenditure 24,841 39,687 116,805 1,654,317
nearly $1.9 trillion in capi- Infrastructure Capital Expenditure 8,419 9,019 9,786 221,540
tal expenditures to be TOTAL CAPITAL EXPENDITURE $33,260 $48,706 $126,591 $1,875,856
made between 2010 and NOTE: Total 2010-2035 represents the total for all years including those years not reported.
2035. At the same time, Source: IHS CERA
there are significant near-
term benefits associated with this expansion. By 2015 alone, annual capital expenditures in support of the
shale gas expansion will grow to $48 billion from $33 billion in 2010.
Macroeconomic Benefits of Lower Gas Prices
In addition to the industry's direct economic contributions, the industry has fostered low and stable gas prices
that have a positive macroeconomic impact. A simulation of IHS Global Insight's Macroeconomic Model of
the US Economy shows that, in the near term, current low and stable gas prices contribute to a 10% reduc-
tion in electricity costs, a 1.1% increase in the level of GDP by 2013, 1 million more employed individuals by
2014, and 809,000 more employed by 2015. In the long run (beyond 15 years), the equilibrating tendency of
the economy drives GDP, and the employment impacts of low versus high gas prices, to less significant levels,
but low gas prices still bring noteworthy benefits. For example, there will be improvements in the competitive-
ness of domestic manufacturers due to lower natural gas and electricity costs. This will result in an initial im-
pact of 2.9% higher industrial production by 2017 and 4.7% higher production by 2035. In addition, the
near-term employment impact coincides with a period in which the US economy is marked by slow growth
and high unemployment.
An Industrial Recovery and Renaissance
Finally, low and stable gas prices benefit a wide range of domestic manufacturing industries, particularly those
that are dependent on gas as a feedstock and/or energy source. As a result of their confidence in an ex-
tended period of low natural gas prices, chemicals producers have already signaled their intentions to in-
crease capacity. For example, Royal Dutch Shell, The Williams Companies, LyondellBasell, and Westlake
Chemical Corporation have announced expansions to their existing assets. Chevron Phillips Chemical Com-
pany LLC (a joint venture between Chevron and ConocoPhillips) and ExxonMobil Corporation have an-
nounced major future capital investment plans. Dow Chemical Company has made actual investments and
has announced additional investments. Qualitatively, low gas prices will spur increased investment and jobs in
1 This represents an estimate of the sum of total government revenue for all years over the 25-year period.
2 DECEMBER 2011THE ECONOMIC AND EMPLOYMENT CONTRIBUTIONS OF SHALE GAS IN THE UNITED STATES the chemicals industry. Other manufacturing industries will experience a general increase in profitability and in- ternational competitiveness that will allow for an incremental but broad general increase in US manufacturing. Conclusion In summary, the shale gas industry makes a significant contribution to the US economy both in terms of di- rect employment, the many and diverse connections it has with supplier industries, and the amount of spending that this direct and indirect activity supports throughout the economy. As the production of shale gas expands over the next 25 years, the industry's economic contribution will expand significantly. By 2035, over 1.6 million jobs will be supported by the shale gas industry, which will contribute an additional $200 billion in government revenues. In the short term, lower gas prices will generate net GDP and employ- ment growth, and, in the longer term, will positively impact overall manufacturing profitability and competi- tiveness in the United States, especially in the chemicals industry. IHS GLOBAL INSIGHT 3
THE ECONOMIC AND EMPLOYMENT CONTRIBUTIONS OF SHALE GAS IN THE UNITED STATES

          1. Introduction
          The natural gas Shale Gale has transformed the US energy outlook in just three years, opening new possi-
          bilities for the future of energy in the United States, creating jobs, stimulating economic growth, and lower-
          ing gas prices. Between 2000 and 2008, the natural gas price at Henry Hub averaged $6.73 per MMBtu in
          constant 2010 dollars. But as shale production started to ramp up in significant volumes in 2009 and 2010,
          the price dropped to an average of $4.17 per MMBtu (constant 2010 dollars). By October 2011, it had de-
          clined further to $3.50 per MMBtu (constant 2010 dollars). From 2011 through 2035, IHS Global Insight
          projects that the price will average $4.79 MMBtu (constant 2010 dollars). Consequently, for the first time in
          decades, natural gas production is on a long-term growth path, and gas prices are low and stable. This
          has enhanced US energy security, since the United States will not need large imports of LNG to meet do-
          mestic needs, as had been expected as late as 2008. Abundant supplies of natural gas give more options
          for meeting environmental goals, as natural gas is now available to substitute for coal, which has higher
          carbon content, and to support expanded use of renewable sources in electric generation. This study pres-
          ents the economic contribution of the shale gas industry—today and in the future. It does so in terms of
          jobs, economic value, and government revenues. In so doing, this analysis seeks to provide a framework
          for assessing important policy choices ahead.
          The activity supporting the domestic shale gas industry creates significant economic benefits in terms of
          employment, tax revenues, and value added. Shale gas development requires drilling rigs, trucks and other
          equipment and the crews to drill and complete gas wells; plants to remove liquids and process gas to meet
          pipeline quality standards; and pipelines to move gas to market. This requires billions of dollars in capital in-
          vestments and tens of thousands of employees working directly in the gas industry, working for companies
          that supply services and materials to the gas industry, and working in jobs created throughout the economy
          as employees in gas-related jobs spend their income on food, housing, transportation, clothing, and other
          goods and services. These activities translate into significant contributions for the US economy:
          •   Employment: In 2010 alone, shale gas industry activities contributed more than 600,000 jobs to the US
              economy and by 2015 we project the industry to grow by 45%, adding an additional 270,000 to the
              economy. In fact, by 2035, we estimate that shale gas activities will contribute 1.6 million jobs to the
              overall US economy.
          •   Revenue: IHS Global Insight estimates that annual government revenues, driven in large part by per-
              sonal and corporate income taxes, will increase from $18.6 billion in 2010 to $28.6 billion in 2015 and
              to $57.3 billion by 2035. In addition, royalty payments to the federal government are estimated at $161
              million in 2010, growing to $239 million in 2015 and escalating to $583 million by 2035.
          •   GDP Gains: In 2010, shale gas industry activity contributed $76.9 billion to US GDP. This will increase
              by 53% to $118.2 billion by 2015 and to $231.1 billion by 2035.
          These economic contributions are even more significant when viewed against the backdrop of the current
          state of the US economy. Economic growth has slowed and is perilously close to stalling. Unemployment
          continues to hover around 9%, with 14 million seeking jobs. IHS Global Insight expects unemployment to
          remain stubbornly high through 2015. While IHS Global Insight still projects a small improvement in growth
          in the second half of this year, we expect a long, laborious recovery with only 1.7% GDP growth in 2011
          and 1.8% growth in 2012. This forecast presents a weak growth outlook, although not a recession, but we
          see a higher likelihood of recession (35%), since weak momentum leaves the economy more vulnerable
          and less able to withstand shocks.
          Moreover, the availability of a secure supply of low-cost natural gas is restoring a global competitive advan-
          tage to many energy-intensive industries—chemicals, aluminum, steel, glass, cement, and other manufac-
          turing industries—some of which are beginning to invest many billions of dollars to increase their US

4                                                                                                        DECEMBER 2011
THE ECONOMIC AND EMPLOYMENT CONTRIBUTIONS OF SHALE GAS IN THE UNITED STATES
operations based on the availability of low cost gas. Lower gas costs are also helping to hold down elec-
tricity prices as natural gas' share of power generation increases. And residential and commercial con-
sumers of gas are seeing lower heating costs as a result of cheaper gas. A number of studies have looked
at the importance of natural gas to the US economy, and some have focused on unconventional gas—
shale gas together with gas from tight sands and coal bed methane—but few have examined the specific
impacts of shale gas development on the US economy. As most of the future growth in US natural gas is
expected to come from shale plays, these impacts could be even more significant in the future. This study
aims to provide a better understanding of them.
This report examines the production profile for major shale plays in the United States through 2035, based
on IHS CERA's analyses of each play in the context of expected growth in natural gas demand. It calcu-
lates the investment of capital, labor, and other inputs required to produce that amount of shale gas. The
economic contributions of these investments are then calculated using IHS Global Insight's suite of macro-
economic and other economic impact assessment models, generating estimates of value added, income,
jobs, and tax revenues resulting from projected levels of shale development.
For a fuller understanding of the economic implications of shale gas development, the study first estimates
what the economy might look like without shale gas. Not only would the jobs and other economic benefits
of shale gas fail to materialize, but the United States would be importing much more LNG and competing
for supply with other markets in Europe and Asia. The price of gas would be nearly three times higher than
it is today. The higher gas price in turn would filter through the economy with contractionary effects that are
described in this report.
This is the first of three reports on the economic effects of unconventional gas and oil development in North
America. It focuses only on shale gas in the United States. But shale gas is only part of the unconventional
gas story. Unconventional gas is also produced from tight sands, coal seams, and unconventional oil plays.
In the past year, as high oil prices have widened the gap with natural gas prices (which reflect a well-sup-
plied market), operators have ramped up activity in liquids-rich plays such as the Eagle Ford Shale, Marcel-
lus Shale, and the Bakken formation in North Dakota. Economic activity resulting from these operations has
been significant and has had a positive impact on the local and state economies where they are located,
and beyond. And these plays are not confined to the United States. Canada also has significant shale and
other unconventional gas and oil resources. Subsequent reports in this series will look at other unconven-
tional oil and gas development in the United States and all unconventional oil and gas in Canada.
For purposes of these reports, the US Lower 48 states and Canada are considered as two components of
a single North American natural gas market. Alaska is excluded because it is not integrated into the natural
gas pipeline network that connects the rest of the United States and Canada. Mexico is also excluded.
While there are some shale resources in Mexico and some interconnectivity between the US Lower 48 and
Mexico, these connections are limited, and the Mexican gas market remains distinct from the US market. In
comparison, the US and Canadian markets operate in close synchrony, reflecting the overall integration of
the two economies
The Structure of This Report
The remainder of this report is divided into six sections.
• In Section 2, the report focuses on providing an overview of the shale gas industry.
• In Section 3, we present the critical inputs to the economic analysis, namely, the production profile and
capital expenditure outlook for shale gas. Since any discussion of production profiles must be bound
by market principles, we preface this section with an overview of the US market supply and demand
outlook through 2035.
IHS GLOBAL INSIGHT 5THE ECONOMIC AND EMPLOYMENT CONTRIBUTIONS OF SHALE GAS IN THE UNITED STATES
• Section 4 presents the results of IHS Global Insight's economic contribution analysis.
• Section 5 describes, in quantitative terms, the macroeconomic effects of limiting shale gas production,
which includes higher prices. This will allow the reader to clearly gauge the contribution of lower natural
gas prices emanating from the development of shale gas. It is important to note that Section 5 cap-
tures only the second-order macroeconomic shifts resulting from lower natural gas prices—it does not
account for the direct and indirect changes in capital investment and other impacts associated with the
development of shale gas.
• In Section 6, we offer context around the size of these direct and indirect opportunities associated with
lower natural gas prices by providing a qualitative assessment of the baseline scenario outlined in Sec-
tion 5, with a focus on the potential impacts for energy intensive industries.
Finally, we also provide several appendices to facilitate the readers' understanding of the methodologies,
research, and data relied upon for our analysis. In the appendices, we also present more detailed results
from our study. Appendix A contains the underlying methodology and detailed data related to the assumed
future production profile and capital expenditure outlook for shale gas. Appendix B provides the detailed re-
sults of the economic contribution assessment, while Appendix C presents the data and modeling ap-
proach underlying the economic contribution analysis. Finally, Appendix D contains the extensive
bibliography of the literature that was reviewed for this study.
6 DECEMBER 2011THE ECONOMIC AND EMPLOYMENT CONTRIBUTIONS OF SHALE GAS IN THE UNITED STATES 2. An Introduction to Shale Gas What Is Shale Gas? Shale gas is one of three commonly recognized forms of unconventional natural gas, the other two being tight gas and coal bed methane. The major characteristic common to all three is that they are embedded in geologic formations that restrict the flow of gas. Shale gas is contained in low permeability shale rock; tight sands gas is contained in low permeability sandstone; and coal bed methane is contained in low perme- ability coal seams. Permeability—a measure of how easily gases and fluids can flow through rock—is what drives whether economic development requires conventional or unconventional techniques for the extrac- tion of natural gas or oil from the rock formation. In a conventional reservoir, natural gas has migrated upward over geologic time from a lower source rock through other permeable rocks until it hits an impermeable layer of rock and encounters, along this barrier, a "trap" (sometimes in association with crude oil and sometimes not). A well is drilled into the reservoir to allow the natural gas to flow into the wellbore and then to the surface. Depending on geologic conditions, conventional well completion techniques have included horizontal drilling or hydraulic fracturing (these do not occur together), as well as other stimulation technologies to facilitate gas flow. It has long been known that the lower source rock existed and contained significant amounts of natural gas and oil. However, traditional completion techniques did not yield sufficient production for economic devel- opment. Through trial and error, production techniques have been developed to extract natural gas from this low permeability source rock. In particular, two technologies are critical and both have a long history of use preceding unconventional gas development. Horizontal drilling involves drilling a vertical well to the desired depth and then drilling laterally, or horizontally, to access a larger portion of the source rock. Hydraulic fracturing involves the injection of fluid (usually a mixture of water, sand, and chemicals) under high pressure into a natural gas well to create new fractures in the source rock. The sand prevents the cracks from closing when the pressure is removed creating pathways (permeability) for natural gas to move into the wellbore and then to the surface. The un- conventional combining of these two conventional techniques allows a large area of source rock to be ac- cessed by a single well and allows commercial production from formations so tight that significant amounts of gas had been unable to escape over millions of years. The Geology of Conventional and Unconventional Oil and Gas Source: EIA 10402-4 IHS GLOBAL INSIGHT 7
THE ECONOMIC AND EMPLOYMENT CONTRIBUTIONS OF SHALE GAS IN THE UNITED STATES
Shale Gas Supply and Costs
In its February 2010 study, Fueling North America's Energy Future, IHS CERA estimated that the recover-
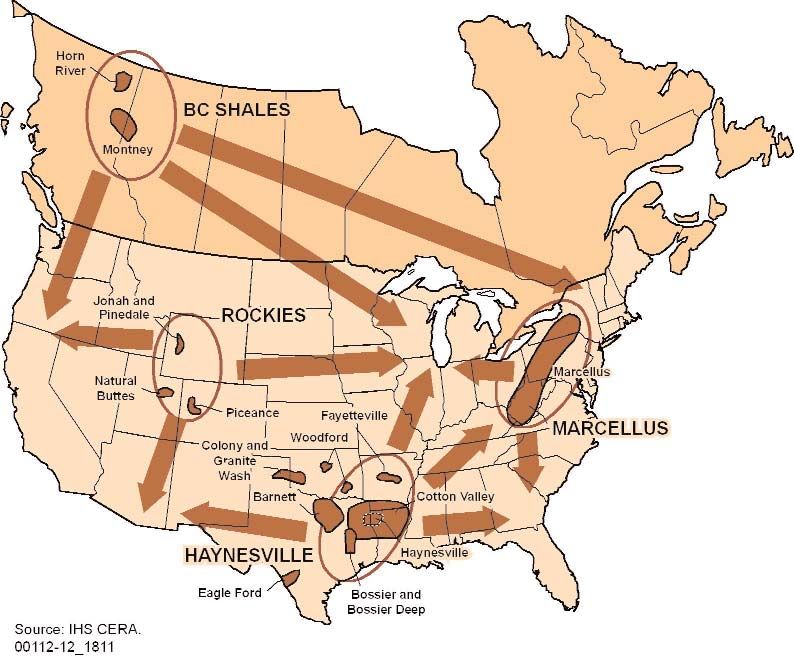
able gas resource base of six major shale gas plays in the United States—the Haynesville, Eagle Ford, Mar-
cellus, Fayetteville, Woodford, and Barnett—exceeded 1,100 trillion cubic feet (Tcf). This represents about
40% of the total estimated natural gas resource base in the United States. Prior to the development of un-
conventional natural gas, the Potential Gas Committee in 2000 estimated total US recoverable gas re-
source was 1,268 Tcf.
Major Unconventional Gas Plays in North America
Because unconventional production techniques allow such a broad range of source rock to be accessed
by a single well, the productivity of shale gas wells is very high, with typical initial production (IP) rates of 3
million cubic feet (MMcf) per day or higher, compared with 1 MMcf per day or less for a conventional gas
well. As a result, although a shale gas well costs several million dollars to drill and complete, its full-cycle
cost per unit of gas produced is much lower than for a conventional well. IHS CERA estimates that the full-
cycle cost of shale gas produced from wells drilled in 2011 is 40-50% less than the cost of gas from con-
ventional wells drilled in 2011.
Full-cycle costs of shale gas produced from wells drilled in 2011 are estimated to cost 40-50% less than
gas produced from conventional wells.
Because so much shale gas resource is now available at a low cost, the supply curve for natural gas has
become relatively elastic. In other words, the US natural gas resource base can now accommodate signifi-
cant increases in demand without requiring a higher price to elicit new supply. IHS CERA estimates that al-
most all of the US shale gas resource could be developed at a full-cycle cost of $4 per Mcf or less2. As a
result, not only have gas prices declined significantly over the past two years, but IHS CERA expects gas
prices to average below $5.15 (constant 2010 dollars) thru 2035.
2 Cost calculation includes credit for revenues from the sale of natural gas liquids that are produced with the gas and used primarily as inputs
to the petrochemical industry.
8 DECEMBER 2011THE ECONOMIC AND EMPLOYMENT CONTRIBUTIONS OF SHALE GAS IN THE UNITED STATES
Shale gas production has increased rapidly in the past few years. Total shale production in 2000 was only 1
billion cubic feet (Bcf) per day, or roughly 2% of total production in the US Lower 48. By 2010, it had grown
to more than 15 Bcf per day or 27% of total production. As of September 2011, IHS CERA estimates that
shale gas production accounted for 34% of total production
IHS CERA expects this growth to continue. In fact, almost all the future growth of US natural gas produc-
tive capacity is expected to come from shale gas. By 2035, total productive capacity is expected to be
about 88 Bcf per day, compared with 62.4 Bcf per day in 2011. Of the 2035 total capacity, nearly two-
thirds, or more than 56 Bcf per day, will come from shale gas.
U S L o w e r 4 8 N a t u r a l G a s P r o d u c t i o n B y T y p e : 2 0 0 0 t o 2010
Bcf per Day
70
60
50
40
30
20
10
0
2000 2001 2002 2003 2004 2005 2006 2007 2008 2009 2010 2011
Conventional Tight Gas Shale Gas Coalbed Methane
Source: EIA, IHS CERA
U S L o w e r 4 8 N a t u r a l G a s P r o d u c t i v e C a p a c i t y O u t l o o k b y T y p e: 2010 to 2035
Bcf per Day
90
80
70
60
50
40
30
20
10
0
2010 2015 2020 2025 2030 2035
Shale Tight Sands Conventional CBM Associated
Source: IHS CERA
IHS GLOBAL INSIGHT 9THE ECONOMIC AND EMPLOYMENT CONTRIBUTIONS OF SHALE GAS IN THE UNITED STATES
3. Shale Gas in the Context of the US Gas Market
The prospect of an abundant long-term gas supply at a low price has revolutionized the US natural gas
market. Accurately quantifying the economic contributions of the shale gas industry requires measuring
both the production profile and capital expenditures associated with the industry. However, production and
capital-expenditure decisions do not occur in a vacuum. Rather, they are a function of the size of the mar-
ket as determined by both demand and supply. In this section, we present a discussion on the evolving de-
mand for natural gas in the US market both today and in the future. We then turn to address the supply
side with a discussion of the production levels required to meet that demand and the underlying capital ex-
penditures required to support this level. This section assesses these factors, while Section 4 focuses on
measuring these factors in terms of their economic contributions.
As recently as 2007, it was commonly believed that the gas resource base in the United States had matured
or was inaccessible and that increasing imports of LNG would be required to meet demand. But then shale
gas production began to grow. Natural gas production in the US Lower 48 grew from a low of 49 Bcf per
day in January 2007 to almost 57 Bcf per day in July 2008—a 15% increase in just 18 months. Total gas
production has now grown to more than 62 Bcf per day, 30% of which is shale gas. Since 2009, gas pro-
ducers have succeeded in meeting the demands of two colder-than-normal winters and two hotter-than-
normal summers while building storage inventories to record levels. Gas supply is no longer in doubt. In fact,
the US gas market, which for most of its history was supply-constrained, is now demand-constrained, which
means that the outlook for shale gas production depends on the outlook for natural gas demand.
US Natural Gas Demand
IHS CERA's long-term outlook for natural gas forecasts demand in the US lower 48 increasing from 64.7
Bcf per day in 2010 to more than 90 Bcf per day by 2035. Almost all of this increase will occur in the power
sector, which will more than double its demand over this period, with some additional demand growth from
gas-field use and pipeline fuel related to higher production levels. Little growth is expected to come directly
from the residential and commercial sectors. Some conversions from oil heat to gas are under way in the
Northeast, but population shifts to warmer regions where electricity dominates the space-heating market
suggest that less gas will be used for heating and more gas will be used to generate electricity for space
heating and air conditioning. Therefore, some heating-related gas demand shows up as power sector-de-
mand for gas, rather than residential or commercial gas demand.
A similar phenomenon may be observed in efforts to increase gas use in trucks and automobiles. IHS CERA
estimates that direct vehicle use of natural gas may grow from a small base to just under 1 Bcf per day in the
next 25 years, but gas may also be used to produce power for electric vehicles. Again, indirect vehicular gas
use would show up as power-sector gas demand. Additionally, some believe that the spread between oil
and natural gas prices will be great enough to stimulate gas demand for transportation, beyond bus, truck,
and car fleets. Consequently, even if the IHS CERA outlook proves to be overly conservative, additional
transportation gas demand is unlikely to strain supply to the market or the price outlook used here.
Natural gas vehicle use is forecasted to grow from a current negligible base to just under 1 Bcf per day in
the next 25 years.
The industrial sector may hold more growth potential. Activity in the wetter shale plays, such as Eagle Ford and
the western portion of Marcellus, is increasing the supply and reducing the cost of natural gas liquids (NGLs),
which are commonly used as a petrochemical feedstock. With world oil prices so much higher than US natural
gas prices, US NGLs such as ethane have a big cost advantage over oil-based feedstocks for petrochemicals,
3 NGL's including ethane are separated from natural gas (mostly methane) early in the production process and are not considered part of in-
dustrial demand for natural gas in the outlook presented here.
10 DECEMBER 2011THE ECONOMIC AND EMPLOYMENT CONTRIBUTIONS OF SHALE GAS IN THE UNITED STATES
U S L o w e r 4 8 N a t u r a l G a s D e m a nd *
Bcf per Day
100
90
80
70
60
50
40
30
20
10
0
2010 2015 2020 2025 2030 2035
Residential Industrial Power Pipeline, Lease and Plant Fuel
Commercial
Source: IHS CERA
NOTE: *Combined Heat Power (CHP) from Independent Power Producers (IPP) is included in power sector
such as naphtha3. A number of chemical companies have announced plans to expand their US operations as a
result. Petrochemical production relies on natural gas as a process fuel. IHS CERA estimates that growth in this
industry could increase industrial sector natural gas consumption by 0.3-0.4 Bcf per day by 2035.
Prospects for other gas-intensive industries are more limited. Natural gas is an input to industrial produc-
tion, so industrial demand for gas is a derived demand, influenced far more by industry output than by the
price of gas. As the US economy becomes more service-oriented, its energy intensity is declining. IHS
Global Insight expects five of the six most gas-intensive industries to grow more slowly than the average for
all manufacturing industries, which will suppress growth in their demand for natural gas. The chemicals in-
dustry, which faces heavier US demand for its wide-ranging products, exports more easily, and is able to
take advantage of growing supplies of NGL feedstocks in the United States, is projected to grow faster
than all industries after 2030. Were it not for the expected growth in petrochemical demand, total industrial
gas demand would be in a long-term decline. Instead, it is expected to remain flat over the long term.
IHS GLOBAL INSIGHT 11THE ECONOMIC AND EMPLOYMENT CONTRIBUTIONS OF SHALE GAS IN THE UNITED STATES
U S O u t l o o k f o r N a t u r a l G a s -II n t e n sive Ind ustries
Natural Gas Consumption By Industry (Index 2002=100)
200
150
100
50
0
2010 2015 2020 2025 2030 2035
Chemicals Nonmetallic Mineral Products Total
Petroleum & Coal Products Primary Metals
Paper & Products Manufacturing - NAICS Basis
Food
Source: IHS Global Insight
Independent power producers (IPPs), which are included in the electric power sector portion of natural gas
demand, account for a growing share of combined heat and power (CHP). IPPs increased their natural gas
consumption for useful thermal output from 0.5 Bcf per day in 1999 to 0.9 Bcf per day in 2010, a 68% in-
crease. The IPP share of CHP rose from 20% in 1999 to nearly 40% in 2010, some of which is supplying
the industrial sector.
The outlook for industrial natural gas demand includes some CHP activity, but the choice of IPP or indus-
trial CHP to meet requirements for steam and power depend in part upon the ability to sell surplus electric
power into competitive markets. In some states, industries producing their own heat and power may not
be able to sell surplus power and thus cannot compete with IPPs in the CHP market. To the extent that in-
dustries are limited in their ability to sell power, CHP growth will occur in the IPP sector, which is included in
electric power sector demand for natural gas. However, it is important to note that within industrial CHP, it
is difficult to predict how potential investors going forward will react to a better-supplied natural gas market,
particularly in combination with more environmental regulation in the power sector.
Indeed, the electric power sector will be the primary driver of natural gas demand for the long term. Envi-
ronmental regulations, renewable energy mandates, and economics all work to promote increased gas use
for power generation. Environmental Protection Agency (EPA) regulations aimed at restricting emissions of
sulfur, mercury, particulate matter, and potentially carbon dioxide are increasing the costs of operating coal
generation units and, in some cases, are hastening their retirement. Natural gas is a cleaner burning fuel
than coal, with only half the carbon content, and is increasingly being favored over coal for power genera-
tion. Economics also favor natural gas. Gas-generation plants have lower capital costs than most other
types of generation units, and the low price of natural gas is giving it a stronger competitive position against
coal in electric dispatch. Also in the near term, utilization of existing gas-fired capacity will increase, with the
fuel share for natural gas rising from 24.4% in 2010 to 25.9% in 2012 in IHS CERA's view. Finally, the in-
creasing share of renewables in power generation capacity (driven in part by state Renewable Portfolio
Standards) requires gas capacity for backup generation when wind and solar power are unavailable. IHS
12 DECEMBER 2011THE ECONOMIC AND EMPLOYMENT CONTRIBUTIONS OF SHALE GAS IN THE UNITED STATES
CERA expects generation capacity additions to total 481 gigawatts (GW) between 2010 and 2035, inclu-
sive of coal retirements totaling 64 GW during that same period. Gas-fired capacity will account for 60% of
this (with 32% furnished by wind and other renewables, 3% by nuclear, and 5% by clean coal technolo-
gies). This translates into an increase in power-sector demand for natural gas from 20 Bcf per day in 2010
to 46 Bcf per day by 2035.
Future Production Profile and Capital Expenditure Outlook for Shale Gas
Because the US endowment of recoverable natural gas has expanded so rapidly as a result of unconven-
tional technologies, the United States is expected to be able to meet future demand growth almost entirely
from North American sources. Not only will little or no LNG imports be required, but this outlook anticipates
LNG exports from the US Gulf Coast beginning in mid-2016 and ramping up to 1.2 Bcf per day by the mid-
dle of 2020 (but never exceeding 2% of domestic production). IHS CERA expects US gas supply in 2035
to consist of 60% domestic shale gas, 32% other domestic gas (primarily other forms of unconventional
gas), and 6% pipeline imports from Canada. Canadian imports, which had exceeded 9 Bcf per day (or
15% of total US gas supply) for most of the last decade, have now fallen below 6 Bcf per day as domestic
production has increased, and they are not expected to regain their pre-2008 levels or share of supply.
Over the outlook period through 2035, imports from Canada will decline significantly in volume and per-
centage from current levels, but because of existing infrastructure, trade patterns, and the cost competi-
tiveness of this gas, we expect enduring imports to 2035.
U S L o w e r 4 8 N a t u r a l G a s S u p p ly
Bcf per Day
100
90
80
70
60
50
40
30
20
10
0
2010 2015 2020 2025 2030 2035
Shale Pipeline Imports from Canada LNG Imports
Other Domestic Production
Source: IHS CERA
The outlooks for both the production profile and corresponding capital expenditure for the shale gas indus-
try are required to accurately assess economic contribution. Within our framework, the capital requirement
is a function of underlying production. That is, IHS CERA projects the production and derives the corre-
sponding capital expenditures necessary to support that level of production. In developing our production
profiles and capital expenditure outlooks through 2035, IHS CERA's outlook considered production from
21 shale plays, of which six are the most prominent—Haynesville, Marcellus, Barnett, Eagle Ford, Fayet-
teville, and Woodford. On the basis of what is known today, these six plays are currently expected to ac-
count for more than 90% of US shale capacity by 2035. However, a number of smaller plays are also
IHS GLOBAL INSIGHT 13THE ECONOMIC AND EMPLOYMENT CONTRIBUTIONS OF SHALE GAS IN THE UNITED STATES
included in the outlook, providing a geographic diversity of gas supply that is already changing the North
American gas market. As more is learned about these plays, and if other plays not on this list come to be
known, the outlook for production from the various plays may be revised. The plays considered for this
analysis include:
• Utica
• Marcellus Shale
• Upper Devonian Shales
• Ordovician Shales
• Devonian Shale
• Antrim Shale
• Haynesville Shale
• Floyd
• Bossier (THE ECONOMIC AND EMPLOYMENT CONTRIBUTIONS OF SHALE GAS IN THE UNITED STATES
• Type curves showing production decline rates over time
• Acreage (total area to be developed)
• Well spacing
• Possibility of geologic success
The number of possible locations to be developed was derived from the last three items. Type curves were
derived for each play using IHS databases (Enerdeq, Power Tools, and ArcGIS), based on actual well data.
Number of days to drill a well (including mobilization and demobilization of the rigs) was obtained from well
data available in IHS databases. Rig forecasts were developed for each play based on historic rig counts
and rig counts for 2011, along with the per-well economics of each individual play.
US Lower 48 Annual Natural Gas Production and Well Completions: Shale Gas versus Total Gas
2010 2015 2020 2025 2030 2035
PRODUCTION
Shale (Mcf) 5,771,561,991 9,898,869,883 12,998,811,671 15,026,085,081 16,664,762,297 18,899,176,790
Total Gas (Mcf) 21,229,024,284 23,276,996,872 26,000,032,080 27,769,207,506 29,114,085,717 31,263,775,082
Shale Share of Total 27% 43% 50% 54% 57% 60%
WELL COMPLETIONS
Shale Gas 5,123 4,383 5,472 4,886 5,654 6,588
Total Gas 17,858 18,344 19,532 17,355 16,213 16,224
Shale Share of Total 29% 24% 28% 28% 35% 41%
Henry Hub Price $4.38 $4.77 $4.57 $4.84 $4.91 $5.15
(Constant 2010 $US per MMBtu)
Source: IHS CERA and EIA
Shale gas production is expected to increase from 5.8 Tcf, or 27% of natural gas production, in 2010, to
18.9 Tcf, or 60% of natural gas production, in 2035.
Estimating Drilling Costs and Expenditures for Shale Gas Plays
A shale gas well will typically cost anywhere between $3 million and $9 million, depending on physical fac-
tors such as vertical depth, lateral length, reservoir pressure, and rock characteristics, as well as commer-
cial factors such as taxes and fees and ease of access to materials and services including water, proppant,
drilling and completion services. Capital expenditures are undertaken for land, drilling, completion, facilities,
gathering, processing, and compression. Development of a major shale play also requires the addition of
pipeline capacity to transport the natural gas to consumers.
Well capital expenditures were divided into three main categories and further subdivided down to the level
of consumable goods and services (see Appendix A):
Drilling 40%
Completions 50%
Facilities 10%
All capital costs were escalated using a normalized version of the Upstream Capital Cost Index developed
by IHS CERA to reflect projected cost increases for the inputs to oil and gas development.
IHS GLOBAL INSIGHT 15THE ECONOMIC AND EMPLOYMENT CONTRIBUTIONS OF SHALE GAS IN THE UNITED STATES
The costs of pipeline expansions to connect new supply areas to consumers were calculated based on the
expansion requirements indicated by the Gas Pipeline Competition Model (GPCM™) used for the market
analysis in this study and on representative pipeline capital costs.
U S Annual Capital Expenditure by Type: Shale Gas
($M)
Total
2010 2015 2020 2025 2030 2035 2010-2035
Drilling Capital Expenditure 9,937 15,875 23,895 25,189 34,650 46,722 661,727
Drilling 6,657 10,636 16,010 16,877 23,215 31,304 443,357
Support Services 3,279 5,239 7,885 8,312 1,434 15,418 218,370
Completion Capital Expenditure 12,421 19,844 29,869 31,487 43,312 58,402 827,158
Hydraulic Fracturing 9,937 15,875 23,895 25,189 34,650 46,722 661,727
Other 2,484 3,969 5,974 6,297 8,662 11,680 165,432
Facilities Capital Expenditure 2,484 3,969 5,974 6,297 8,662 11,680 165,432
Material 1,490 2,381 3,584 3,778 5,197 7,008 99,259
Fabricaton 621 992 1,493 1,574 2,166 2,920 41,358
Project Management 124 198 299 315 433 584 8,272
Other 248 397 597 630 866 1,168 16,543
TOTAL Upstream Capital Expenditure $24,841 $39,687 $59,737 $62,973 $86,624 $116,805 $1,654,317
Infrastructure Capital Expenditure 8,419 9,019 7,854 7,188 10,203 9,786 221,540
Gathering and Processing 2,407 3,160 4,560 4,873 6,589 8,778 128,421
Interstate Pipelines 6,012 4,459 2,244 2,315 3,614 1,008 79,119
LNG Export - 1,400 1,050 - - - 14,000
TOTAL CAPITAL EXPENDITURE $33,260 $48,706 $67,591 $70,161 $96,828 $126,591 $1,875,856
NOTE: Total 2010-2035 represents the total for all years including those years not reported.
Source: IHS CERA
IHS CERA expects nearly $1.9 trillion in capital expenditures for shale gas development to take place be-
tween 2010 and 2035. These expenditures will clearly have a significant economic contribution, in terms of
jobs, value added, labor income, and tax revenues. These economic contributions are discussed in the fol-
lowing sections.
16 DECEMBER 2011THE ECONOMIC AND EMPLOYMENT CONTRIBUTIONS OF SHALE GAS IN THE UNITED STATES
4. Economic Contribution Assessment
Approach and Methodology
How to Define the Economic Contribution
The objective of measuring the economic contribution is to fully "size" the industry's economic influence by
capturing all of the supply-chain and income effects associated with shale gas activity in the United States.
The results of the production and capital expenditure analysis discussed in the previous section were inte-
grated into a modeling system to capture the comprehensive contribution of the shale gas industry to the
US economy.
The steps used to derive the economic contribution of any industry can be summarized as follows:
• Any dollar of industrial revenue (in this case, the shale gas industry) results in direct repercussions on
GDP.
• Furthermore, any dollar of trade expenditure (spending with suppliers) results in indirect repercussions
on final demand. Theoretically, an increase of shale gas production, with everything else constant,
would lead to more revenue and output among supplier industries, such as chemicals, machinery, and
professional services. This increase would also result in higher US demand for manufactured products
such as pumps and compressors, which in turn require more fabricated metal and steel products.
These are only a few of the repercussions in the chain resulting from the isolated initial change in the
target industry, in this case shale gas.
Shale gas drilling and production use many different types of products and services from the mining, manu-
facturing, services and other sectors. Thus, a change in the shale gas industry would result in both direct
effects (through production output and capital expenditures) and indirect effects (via supply-chain dynam-
ics) across a broad spectrum of sectors. The contribution to these supplier industries has repercussions on
their supply chains, thereby magnifying the indirect contribution.
As further explained below, the net effects on the US economy and its industrial sectors, due to these con-
tributions, are divided into three stages: the direct contribution, the indirect contribution and the induced
economic contribution.
• The direct contribution is the effect of the core industry's output, employment, and income. For exam-
ple, the shale gas industry's direct contributions are generated by the exploration, production, transport,
and delivery of shale gas to downstream elements or by providing critical onsite services. Investments in
these activities have a direct contribution to production levels (output), the number of workers employed
by the industry, how much those workers are paid and otherwise compensated, etc.
• Any change in the direct purchasing activities of the shale gas industry initiates the indirect contribu-
tions to all of the supplier industries that support shale gas production activities. Changes in demand
(from the direct industries) lead to corresponding changes in output, employment, and income through-
out the supply chains, as well as suppliers' interindustry linkages. The affected supplier activities span
the majority of industries in the US economy.
• Finally, workers and their families in both the direct and indirect industries spend their income on food,
housing, leisure, autos, household appliances, furniture, clothing, and other consumer items. The addi-
tional output, employment, and income effects that result from these consumer spending activities are
categorized as the induced economic contribution.
IHS GLOBAL INSIGHT 17You can also read