Biological Diversity 81CBD Technical Series No. 81 - PLANT CONSERVATION REPORT 2014: Convention on Biological Diversity
←
→
Page content transcription
If your browser does not render page correctly, please read the page content below
81
Secretariat of the     CBD Technical Series No. 81
Convention on
Biological Diversity

                               4

                       PLANT CONSERVATION
                       REPORT 2014:

                                   A review of progress towards
                                   the Global Strategy for Plant
                                   Conservation 2011-2020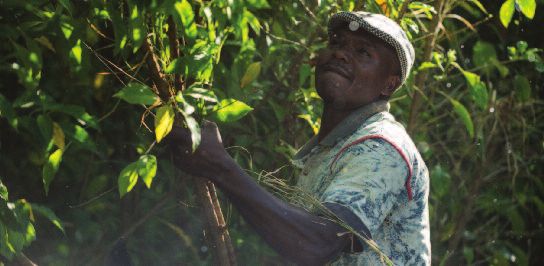
CBD Technical Series No. 81

              PLANT CONSERVATION
                 REPORT 2014:
             A review of progress towards the
          Global Strategy for Plant Conservation
                       2011-2020

A contribution to the mid-term review of the Strategic Plan for Biodiversity
    2011-2020 and the fourth edition of Global Biodiversity Outlook.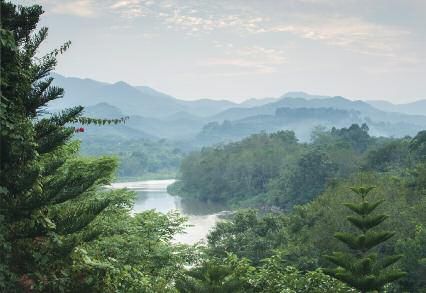
The designations employed and the presentation of material in this publication do
                           not imply the expression of any opinion whatsoever on the part of the copyright
                           holders concerning the legal status of any country, territory, city or area or of its
                               authorities, or concerning the delimitation of its frontiers or boundaries.

                          This publication may be reproduced for educational or non-profit purposes without
                                special permission, provided acknowledgement of the source is made.

                          The Secretariat of the Convention and Botanic Gardens Conservation International
                          would appreciate receiving a copy of any publications that use this document as a
                             source. Reuse of the figures is subject to permission from the original rights
                                                               holders.

                                Published by the Secretariat of the Convention on Biological Diversity in
                                    collaboration with Botanic Gardens Conservation International.
                                                 ISBN 92-9225- 563-0 (print version);
                                                  ISBN 92-9225-564-9 (web version)
                                Copyright © 2014, Secretariat of the Convention on Biological Diversity

                                                                 Citation:
                                            Sharrock, S., Oldfield, S. and Wilson, O. (2014).
                            Plant Conservation Report 2014: A review of progress in implementation of the
                           Global Strategy for Plant Conservation 2011-2020. Secretariat of the Convention
                             on Biological Diversity, Montréal, Canada and Botanic Gardens Conservation
                                   International, Richmond, UK. Technical Series No. 81, 56 pages.

                                                    For further information, contact:
                                          Secretariat of the Convention on Biological Diversity
                                                           World Trade Centre,
                                                          413 Rue St. Jacques,
                                                                Suite 800,
                                                                Montréal,
                                                                  Quebec,
                                                                  Canada
                                                                 H2Y 1N9
                                                         Tel: +1 (514) 288 2220
                                                        Fax: +1 (514) 288 6588
                                                       E-mail: secretariat@cbd.int
                                                     Website: http://www.cbd.int/

                                                           Photo Credits:
                                           All images Barney Wilczak (except where stated)

2   PLANT CONSERVATION REPORT 2014
THIS DOCUMENT WAS PREPARED BY:

Authors
Suzanne Sharrock, Sara Oldfield and Oliver Wilson (Botanic Gardens Conservation International)

Acknowledgments
The production of this publication was made possible thanks to funds provided by the Japan Biodiversity Fund and the Rufford
Foundation. We are very grateful for this support.

We gratefully acknowledge the help and information provided by Jens Mutke (Nees-Institut für Biodiversität der Pflanzen Rheinische,
Germany), Adrian Newton (University of Bouremouth, UK), Peggy Olwell (Bureau of Land Management, USA), Nick Salter (Aduna,
UK), Jana Skornickova (Singapore Botanic Garden), Paul Smith, (RBG, Kew, UK), K. van Peterson (PanAmerican Seed, Netherlands),
Mark Webb (Kings Park and Botanic Garden, Australia) and Garance Wood-Moulin (BGCI, UK). We are also grateful to Malin Rivers,
BGCI, for advice on the text and preparing the maps used in this report.

We are most grateful to Robert Höft, CBD Secretariat, for his support and guidance, particularly during the preparation of the report on
which Section 4 of this publication is based. The information presented in Section 4 is drawn largely from information provided by
members of the Global Partnership for Plant Conservation (GPPC), with contributions from other plant conservation practitioners
from around the world. We particularly acknowledge the contributions from the following institutions and individuals: Associação
Ibero-Macaronésica de Jardins Botânicos, Portugal (Maria Dalila Espírito Santo and colleagues from Portuguese Botanic Gardens);
Australian National Botanic Gardens, Australian GSPC Focal Point (Judy West); Australian Seed Bank Partnership (Lucy A. Sutherland);
Botanic Garden of Barcelona, Spain (Josep M. Montserrat Martí); Botanic Gardens Conservation International (BGCI) (Abby Hird,
Meirion Jones, Malin Rivers, Stephen Blackmore); Bristol Zoo Gardens, UK (Eddie Mole); Cadereyta Regional Botanic Garden, México
(Beatriz Maruri Aguilar, Emiliano Sánchez Martínez, Maria Magdalena Hernández Martínez); Chicago Botanic Garden, USA (Kayri
Havens); Colombian Botanic Gardens Network (Alberto Gómez-Mejía, Carolina Sofrony-Esmeral); Comisión Nacional de Áreas Naturales
Protegidas, SEMARNAT, Mexico (Mariana Bellot Rojas, Oscar Manuel Ramírez Flores); Comisión Nacional para el Conocimiento y Uso
de la Biodiversidad (CONABIO), Mexico (Hesiquio Benítez Díaz, Francesca Acevedo, Caroline Burgeff, Ana Angelica Cervantes Maldonado,
Sandra Janet Solís Jerónimo); Conservatoire et Jardin botaniques de la Ville de Genève (CJBG) (Pierre-André Loizeau); Denver Botanic
Gardens, USA (Jennifer Ramp Neale); ECOSUR - Botanic Garden “Alfredo Barrera Marín”, México (Cecilia Elizondo, Dalia Hoil Villalobos);
Fairchild Tropical Botanic Garden, USA (Joyce Maschinski); Fédération des Conservatoires botaniques nationaux, France (Philippe
Bardin); Instituto de Ecologia AC,(INECOL) Mexico (M. Luisa Martinez, Sergio Zamudio Ruiz); International Union for Conservation of
Nature (IUCN) — The Species Survival Commission (SSC) (Oliver Hasinger with input from the IUCN Species Survival Commission
(SSC) plant Specialist Groups); Joint Nature Conservation Committee, UK (Christine Cheffings); Jardim Botânico da Madeira (José
Augusto Carvalho, Francisco Manuel Fernandes); Jardín Botánico Gaspar Xuárez sj (JBGXSJ) México (Diana Perazzolo); Ljubljana
University Botanic Gardens, Slovenia (Jože Bavcon); Memorial University of Newfoundland Botanical Garden, Canada (Todd Boland,
Madonna Bishop); Mexican Association of Botanic Gardens (MABG) (Cecilia Elizondo, Emiliano Sánchez Martínez, Beatriz Maruri
Aguilar, María Magdalena Hernández Martínez); Missouri Botanical Garden (Peter Wyse Jackson); Muséum National d'Histoire Naturelle,
France (Maïté Delmas, Antoine Lombard, Frédéric Hendoux, Nathalie Machon); New York Botanical Garden, USA (Todd Forrest, Barbara
M. Thiers); Norwegian network for botanical gardens (Vibekke Vange); PlantLife International (Elizabeth Radford); Royal Botanic
Garden Edinburgh (Peter Wilkie); Royal Botanic Gardens Kew, UK (Natasha Ali, Alan Paton, Eimear Nic Lughadha, Iain Darbyshire,
Steve Bachman, Oliver Whaley, William Milliken, Clare Trivedi, Kenwin Lui, Michael Way, Jonas Mueller, Noel McGough, Julia Willison,
Colin Clubbe, Kate Gold); South African National Biodiversity Institute (SANBI) (Domitilla Raimondo, Christopher Willis, John
Donaldson); Spanish Network of Botanic Gardens (AIMJB) (Álvaro Bueno Sánchez and colleagues from Spanish Botanic Gardens);
Tallinn Botanic Garden, Estonia (Ruth Aguraiuja); TRAFFIC (Anastasia Timoshyna); Universidad Nacional Autónoma de México
(UNAM), Mexico (Eliana Ceccon); Vallarta Botanical Gardens A.C. (VBG) – México (Alan Heinze); Vilnius University Botanical Garden,
Lithuania (Silva Žilinskait ); Xishuangbanna Tropical Botanical Garden (XTBG), China (Richard Corlett).

                                                      A REVIEW OF PROGRESS TOWARDS THE GLOBAL STRATEGY FOR PLANT CONSERVATION 2011-2020    3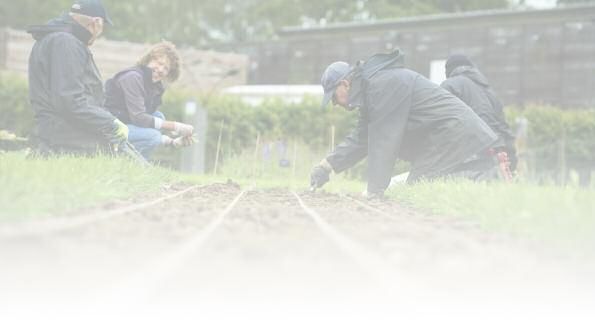
CONTENTS
FOREWORD. . . . . . . . . . . . . . . . . . . . . . . . . . . . . . . . . . . . . . . . . . . . . . . . . . . . . . . . . . . . . . . . . . 5
EXECUTIVE SUMMARY . . . . . . . . . . . . . . . . . . . . . . . . . . . . . . . . . . . . . . . . . . . . . . . . . . . . . . . . . 6
1. INTRODUCTION. . . . . . . . . . . . . . . . . . . . . . . . . . . . . . . . . . . . . . . . . . . . . . . . . . . . . . . . . . . . . 8
2. THE STATE OF THE WORLD’S FLORA . . . . . . . . . . . . . . . . . . . . . . . . . . . . . . . . . . . . . . . . . . . 9
2.1 How many plants are there? . . . . . . . . . . . . . . . . . . . . . . . . . . . . . . . . . . . . . . . . . . . . . . . . . . . . . . . . . . . . . . . . . . . . . 9
2.2 e global distribution of plant diversity . . . . . . . . . . . . . . . . . . . . . . . . . . . . . . . . . . . . . . . . . . . . . . . . . . . . . . . . 10
2.3 Plants under threat . . . . . . . . . . . . . . . . . . . . . . . . . . . . . . . . . . . . . . . . . . . . . . . . . . . . . . . . . . . . . . . . . . . . . . . . . . . 11
3. THE IMPORTANCE OF THE WORLD’S PLANTS . . . . . . . . . . . . . . . . . . . . . . . . . . . . . . . . . . 14
3.1 Wild plants and ecosystems . . . . . . . . . . . . . . . . . . . . . . . . . . . . . . . . . . . . . . . . . . . . . . . . . . . . . . . . . . . . . . . . . . . 14
3.2 Wild plants and livelihoods . . . . . . . . . . . . . . . . . . . . . . . . . . . . . . . . . . . . . . . . . . . . . . . . . . . . . . . . . . . . . . . . . . . . 16
4. GLOBAL PLANT CONSERVATION . . . . . . . . . . . . . . . . . . . . . . . . . . . . . . . . . . . . . . . . . . . . . 24
4.1 National responses to the GSPC . . . . . . . . . . . . . . . . . . . . . . . . . . . . . . . . . . . . . . . . . . . . . . . . . . . . . . . . . . . . . . . . 24
4.2 International partnerships . . . . . . . . . . . . . . . . . . . . . . . . . . . . . . . . . . . . . . . . . . . . . . . . . . . . . . . . . . . . . . . . . . . . . 26
4.3 In situ conservation . . . . . . . . . . . . . . . . . . . . . . . . . . . . . . . . . . . . . . . . . . . . . . . . . . . . . . . . . . . . . . . . . . . . . . . . . . . 26
4.4 Ex situ conservation . . . . . . . . . . . . . . . . . . . . . . . . . . . . . . . . . . . . . . . . . . . . . . . . . . . . . . . . . . . . . . . . . . . . . . . . . . 31
4.5 Conserving crop diversity . . . . . . . . . . . . . . . . . . . . . . . . . . . . . . . . . . . . . . . . . . . . . . . . . . . . . . . . . . . . . . . . . . . . . 34
4.6 Sustainability of wild plant resources for local use and trade. . . . . . . . . . . . . . . . . . . . . . . . . . . . . . . . . . . . . . . . 35
4.7 Education and public awareness . . . . . . . . . . . . . . . . . . . . . . . . . . . . . . . . . . . . . . . . . . . . . . . . . . . . . . . . . . . . . . . . 39
5. SUMMARY OF PROGRESS TOWARDS THE GSPC TARGETS . . . . . . . . . . . . . . . . . . . . . . . 40
REFERENCES . . . . . . . . . . . . . . . . . . . . . . . . . . . . . . . . . . . . . . . . . . . . . . . . . . . . . . . . . . . . . . . 45
NOTES . . . . . . . . . . . . . . . . . . . . . . . . . . . . . . . . . . . . . . . . . . . . . . . . . . . . . . . . . . . . . . . . . . . . . 48
ANNEXES. . . . . . . . . . . . . . . . . . . . . . . . . . . . . . . . . . . . . . . . . . . . . . . . . . . . . . . . . . . . . . . . . . . 51
Annex 1: e Aichi Targets of the CBD’s Strategic Plan for Biodiversity 2011-2020 . . . . . . . . . . . . . . . . . . . . . . . . 51
Annex 2: Members of the Global Partnership for Plant Conservation. . . . . . . . . . . . . . . . . . . . . . . . . . . . . . . . . . . . 53
Annex 3: Potential contribution of CITES to the GSPC targets . . . . . . . . . . . . . . . . . . . . . . . . . . . . . . . . . . . . . . . . . 54
4 PLANT CONSERVATION REPORT 2014
FOREWORD
It is impossible to overstate the importance of plants in the life of our planet. e process of photosynthesis is the
fundamental way in which the energy of the sun is harnessed. Food and fossil fuels are just two of the benefits
flowing to us from photosynthesis. From within the huge diversity of wild plants, estimated to number around
400,000 species, we have selected and domesticated only a small percentage. Just three crops: maize, rice and wheat
provide 40% of the calories we consume. ousands more are harvested from the wild to meet demand for food,
fibres, medicines and other products from nature. But the bounty of plants goes far beyond commodities: the water
cycle, carbon cycle and countless other processes in nature depend upon the rich diversity of vegetation. Without
plants maintaining and renewing the biosphere, there would be no place in it for us.
Why then do we neglect the Earth’s green inheritance, allowing old growth forests to be converted to mere plantations,
permitting once common species to become rare and driving others into extinction? Perhaps, in a world of 7 billion
people, where more than half of us live in cities, we have simply forgotten how the world works.
is timely report on the status of the world’s wild plants comes as an urgent reminder of their significance and role
in nature. It makes no claim of being encyclopaedic, but presents a snapshot of the current state of affairs in a rapidly
changing world. What it shows is that there is much to be concerned about, but also that we have much to celebrate.
Our planet is still home to large tracts of forest and grasslands with many of its most outstanding wild places
benefitting from designation as biosphere reserves or other kinds of protected area. Our exploration of nature
remains incomplete, we continue to discover new plants, some with direct value to us, and all with a part to play in
the web of life. Yet, in too many places, even protected areas are threatened by development or the illegal exploitation
of natural resources. Climate change adds enormously to such challenges and, with food security and poverty
alleviation, is a defining issue our times. By locking away carbon, creating carbohydrates, liberating oxygen and
sustaining life, plants are a vital part of the solution to all of these great challenges. As the report highlights, there
are many inspiring examples of plant conservation and ecological restoration from which we can learn.
Today, we continue to lose plant diversity with almost casual disregard. We cannot afford to watch from the side-
lines. To create the more equal and sustainable world envisaged in the post-2105 development agenda and the 2050
vision of the Strategic Plan for Biodiversity 2011-2020 requires us to invest in securing continuity in the silent work
of plants. We do know how to do this. We commend the authors of this report on their skill and expertise in
compiling it and hope that by reminding us why we call environmental issues “green” they secure a more active
commitment to plants.
Stephen Blackmore Braulio Ferreira de Souza Dias
Chair of BGCI Executive Secretary of the
Convention on Biological Diversity
A REVIEW OF PROGRESS TOWARDS THE GLOBAL STRATEGY FOR PLANT CONSERVATION 2011-2020 5
EXECUTIVE SUMMARY
Plants are essential for all life on earth. e uptake of carbon dioxide, one of the principle greenhouse gases, during
photosynthesis is the major pathway by which carbon is removed from the atmosphere and made available to humans
and animals for growth and development. Plant diversity also underpins all terrestrial ecosystems and these provide
the basic life-support systems on which all life depends.
Wild plants are also vitally important in supporting livelihoods for millions of people around the world. e most
significant is timber, with wood removals from forests being valued at over US$100 billion annually between 2003
and 2007. Other important wild plant products include fuel wood (valued at US$7 billion in 2005), food (non-
cultivated plants are especially important in enhancing dietary diversity and combating micro-nutrient deficiency),
medicine (global exports of medicinal plants were valued at US$2.2 billion in 2012) and raw materials for cosmetics.
A number of plant species are also harvested from the wild for ornamental purposes providing an important source
of income for rural communities. However, the unregulated exploitation of wild plants can put severe pressure on
populations and even threaten the survival of species. Greater efforts are required to ensure the sustainability of wild
harvested plant products.
Despite the importance of plants, the total number of species in existence is not yet accurately known. Plant scientists
estimate that there are around 400,000 species, but with an average of 2,000 new species being discovered and
described every year, and a possible 10-20% of flowering plants as yet unknown to science, this number may still
grow.
e first consolidated list of the world’s plants (e Plant List) was completed in 2010 and now includes over 350,000
accepted plant names. Building on the knowledge gained in producing e Plant List, efforts are now focused on the
development of a World Flora Online by 2020.
Despite not knowing all the world’s plant species, we do know that they are unevenly distributed across the globe,
with the majority of plants being found in the tropics. Many plant species are restricted in range with a significant
number being single country endemics. Islands have particularly high numbers of endemic plants and are home to
35% of the world’s plants.
Plant diversity is under increasing threat from the combined effects of habitat loss, pollution, invasive species and
climate change. Although this crisis is a reality, the scale of the problem is not yet clear and there is no list of globally
threatened plants. Estimates suggest that at least one in five of all plant species are under threat of extinction.
e Global Strategy for Plant Conservation (GSPC), adopted by the Convention on Biological Diversity in 2002 and
updated in 2010 provides the overall framework for plant conservation at the global and national level. It consists of
16 output-oriented targets covering all aspects of conservation and sustainable use of plants. A number of countries
have developed national responses to the GSPC, including several mega-diverse countries (e.g. Brazil, China, Mexico
and South Africa). Other countries are implementing the GSPC through their National Biodiversity Strategies and
Action Plans (NBSAPs). Implementation of the GSPC provides a direct contribution to the achievement of the CBD’s
Strategic Plan for Biodiversity 2011-2020 and the associated Aichi targets.
6 PLANT CONSERVATION REPORT 2014
is report provides a review of progress towards the 16 targets of the GSPC. It shows that progress is being made
towards all the targets, but generally not at a sufficient rate to achieve the targets in full by 2020. Lack of information
on the distribution and conservation status of plants constrains efforts to conserve plants effectively, both in situ and
ex situ. Furthermore, as the threats to plant conservation increase, botanical capacity and funding for plant conservation
are decreasing in many parts of the world. Having said this, the GSPC is generally recognised as a successful strategy.
It has stimulated the development of new initiatives at both national and global level and has helped to focus the
attention of the biodiversity community on the importance of plants.
Although encouraging progress is being made in some areas towards conserving and sustainably using wild plants,
these efforts are not enough. Activities are still constrained by a general lack of recognition of the importance of
plants and the insufficient allocation of resources for their effective conservation. It is essential that CBD Parties and
other Governments further engage with partner organizations to make the best use of available expertise and find
ways to fully involve indigenous and local communities and the widest range of stakeholders, to enhance plant
conservation and ensure full implementation of the GSPC.
A REVIEW OF PROGRESS TOWARDS THE GLOBAL STRATEGY FOR PLANT CONSERVATION 2011-2020 7
1 . INTRODUCTION
Plant diversity is an essential component of the biosphere e GSPC aims to halt the continuing loss of plant
and underpins societal development worldwide. Our basic diversity. e vision of this essential Strategy states:
needs are supplied by plants. Plants provide the world’s
oxygen and produce the biochemical components for all Without plants, there is no life. e functioning
food. Despite global development and the increasing of the planet, and our survival, depends on plants.
sophistication of agriculture, horticulture and forestry, wild e Strategy seeks to halt the continuing loss of
plants still provide a huge diversity of products of plant diversity.
subsistence and financial value. Millions of people around
the world depend directly on wild plant resources for at Our vision is of a positive sustainable future
least part of their livelihoods, be it for food, medicine, where human activities support the diversity of
building materials, fuelwood or financial income. plant life (including the endurance of plant
genetic diversity, survival of plant species and
is report provides a snapshot of the status and communities and their associated habitats and
importance to humankind of the world’s plant diversity. ecological associations), and where in turn the
We highlight examples of the livelihood values of wild diversity of plants support and improve our
plants with recent data on the financial value of wild plant livelihoods and well-being.
resources wherever possible. Information on the value of
plants is drawn mainly from a literature and internet survey. As well as highlighting the value of plants, this report
evaluates plant conservation progress in relation to the
Although the world’s flora is of immense importance, plant 16 targets of GSPC. e evaluation is based primarily
species are under threat globally as a result of habitat on a mid-term review of progress towards the 2020
transformation, climate change, over-exploitation, pollution targets which was carried out in early 20141. Further
and the impact of invasive alien species. e Global information has been extracted from the GSPC Toolkit2
Strategy for Plant Conservation (GSPC) provides an overall which provides resources and case studies in support of
framework to address this situation through measures at GSPC implementation and from related literature.
the global and national level. e Strategy, with its 16
output-oriented targets was originally adopted by the Implementation of the GSPC Targets directly supports
Parties to the Convention on Biological Diversity (CBD) the implementation of the Strategic Plan for Biodiversity
in 2002, marking the first ever internationally agreed targets 2011-2020 of the CBD and its 20 Aichi Targets (See Annex
for biodiversity conservation. In 2010, updated GSPC 1). Unless the GSPC Targets are met the Aichi Targets
targets for 2020 were adopted (A full list of GSPC targets cannot be delivered because all life depends on plants.
is provided in Section 5).
8 PLANT CONSERVATION REPORT 2014
2 . THE STATE OF THE WORLD’S FLORA
Plants cover virtually all terrestrial regions of the earth with the exception of ice-covered regions
and extremely arid lands. Plant species diversity represents millions of years of evolution and
provides an important visible expression of biodiversity, giving character to ecosystems and shape
to genetic diversity.
“To such an extent does nature delight and abound in variety that among her trees there is not one
plant to be found which is exactly like another; and not only among the plants, but among the boughs,
the leaves and the fruits, you will not find one which is exactly similar to another.”
Leonardo da Vinci.
2.1. HOW MANY PLANTS ARE THERE?
e total number of vascular plant species (flowering
plants, conifers, ferns, etc.) in existence is not yet Box 1: Plant names
accurately known but is estimated to be in the order of
400,000 (Paton et al., 2008). Of these, between 80,000 – Linnaeus named more than 9,000 plants including
100,000 species are thought to be woody plants and trees, most major crops, medicinal plants and many
representing a quarter of all plants. important ornamentals. Charles Darwin bequeathed
money to the Royal Botanic Gardens, Kew (RBG,
Despite the importance of plants to humankind, the first Kew) for the development of the Index Kewensis a
consolidated checklist list of the world’s plants was only list of all flowering plant names from the time of
completed in 2010. is list was developed as a direct Linnaeus, which is still compiled today. Building on
response to the GSPC, which called for such a list to be this, the International Plant Names Index (IPNI) is
in place by 2010. e Plant List3 provides a catalogue of the product of collaboration between RBG, Kew; e
plant names organised to show which names are accepted Harvard University Herbaria and the Australian
and which should be considered as synonyms. e Plant National Herbarium. In the last ten years (2004-2013)
List currently includes 1,064,035 scientific plant names over 21,000 new plant species names were published,
of species rank. Of these 350,699 are accepted species which averages about 2,000 new species being
names, 470,624 are synonyms and 242,712 are names discovered and described each year. In addition, in
remaining to be resolved. Knowledge of the true number the last decade, nearly 2,000 new genera and over
of plants existing in the world relies not only on 3,000 infraspecific names were also added to the
completing the identification of synonyms amongst world’s known flora. ese figures exclude new
existing plant names, but also on further botanical taxonomic combinations and new taxonomic ranks.
exploration for new species in particular areas of rich
plant diversity. Scheffers et al., (2012) estimate that 10- Source: www.ipni.org
20% of existing flowering plant species are still unknown
to science.
A REVIEW OF PROGRESS TOWARDS THE GLOBAL STRATEGY FOR PLANT CONSERVATION 2011-2020 9Drawing from the knowledge gained in producing e GSPC Target 1:
Plant List, Target 1 of the GSPC now calls for the An online flora of all known plants.
development of an online World Flora by 2020 (Box 2).
Box 2: e World Flora Online – responding to GSPC Target 1
e World Flora Online (WFO) project was launched e WFO will be an information discovery portal,
at the 11th Conference of the Parties (COP) to the bringing together floristic data on all known plant
Convention on Biological Diversity (CBD) in species that are currently available in various electronic
Hyderabad, India in October, 2012 where the COP formats. WFO will include baseline information on
adopted a decision welcoming the World Flora Online plant names, distributions, descriptions, and related
initiative. In January, 2013 the Memorandum of information. It will provide a single consensus
Understanding on the World Flora Online, was opened classification, and give the user expert guidance on
for signature. Up to the end of August 2014, 24 reliability, accuracy and completeness. e WFO aims
institutions and organizations had signed the MOU. to primarily be a reference for conservationists.
A range of other institutions and organizations Currently a roadmap for the project is being prepared
GLOBAL
worldwide is also being invited to participate in theBIODIVERSITY:
with planning of which SPECIES NUMBERS
elements should be includedOF VASCULAR P
WFO Consortium. is represents a major step 180°
in the first release.
160° 140° 120° 100° 80° 60° 40° 20° 0° 20° 40° 60° 80° 100° 120° 14
forward in developing a consolidated global
80°
information service on the world’s flora. Source: http://www.plants2020.net/world_flora/
60°
2.2 THE GLOBAL DISTRIBUTION OF PLANT DIVERSITY
Moscow
Berlin
London
Vancouver
Paris
Montreal
Rome
New York Madrid
40° Denver
San Francisco
Algiers
Despite not knowing all the world’s plant species, we do Andes and NW Amazonia, eastern Brazil, northern
know that the world’s plant diversity is unevenly Borneo, and New Guinea, the Cape Region of South Cairo
Delhi
distributed across the globe, with the majority of plants
20°
Mexico City Africa, southern Mexico, East Himalaya, western Riyadh
found in the tropics. Sumatra, Malaysia, and eastern Madagascar (Barthlott
et.al, 2007).
Areas of the world which have the greatest vascular plant Bogotá Abidjan
0° species richness (higher than 3,000 species / 10,000 km2) Figure 1: Geographic patterns of vascular plant diversity
Manaus
Nairobi
are the Chocó-Costa Rica region extending from NW at continental to global scales (reproduced from Barthlott
South America through Meso-America; tropical eastern et al., 2007) Luanda
Lima
20°
Rio de Janeiro
Santiago
Buenos Aires Cape Town
40°
60°
80°
© W. Barthlott
Robinson Projection Diversity Zones (DZ): Number of species per 10 000km2 sea surface temperatur
Standard Parallels 38°N und 38°S
DZ 1 (29°C
DZ 2 (100 - 200) DZ 6 (1500 - 2000) DZ 10 ( 5000) >27°C
DZ 3 (200 - 500) DZ 7 (2000 - 3000)
DZ 4 (500 - 1000) DZ 8 (3000 - 4000)
10 PLANT CONSERVATION REPORT 2014All these areas fall within the 34 areas which qualify as specific geographical area is said to be endemic to that
global biodiversity hotspots based on the concept area. Oen when we talk about endemics, we talk about
originally proposed by Myers et al., (2000). To qualify endemics to a specific country or island (see Box 3).
as a hotspot an area must have at least 1,500 endemic
vascular plants and 30% or less of its original natural
vegetation remaining. ese 34 global biodiversity Box 3: e special case of islands
hotspots represent only 2.3% of the Earth’s land surface,
but support more than half of the world’s endemic plant Islands have higher than expected values of endemism
species, including the majority of yet-to-be-described richness than mainland counterparts. e high
species (Joppa et al 2011a). endemism of islands is thought to be due to
geographical isolation, both in terms of evolution in
While, the majority of biodiversity hotspots and the isolation and also the absence of certain
vascular plant richness regions are within the tropics, competitors/predators/pests.
other important areas for plant diversity are mainly
located in Mediterranean climatic zones (Central Chile, Islands cover about 5% of the Earth’s land surface but
Cape Floristic Province, Succulent Karoo, California have more than 35% of the world’s vascular plant
Floristic Province, Mediterranean Basin and Southwest species. ere are around 50,000 insular endemic
Australia). e Caucasus, New Zealand and the plants of which 20,000 are estimated to be threatened
mountains of Southwest China are also home to with extinction. Of the 34 global biodiversity hotspots,
important plant diversity. 14 are islands, archipelagos or have an important
insular component. Six other hotspots include
Plants are not only unevenly distributed geographically offshore islands within their limits
but species are also uneven in their range sizes. e
majority of plant species are restricted in ranges (Joppa et Source: Bramwell, 2011
al., 2013). Species recently discovered are also oen very
range restricted (Joppa et al, 2011b). A plant unique to a
2.3. PLANTS UNDER THREAT
e preamble to the GSPC notes that:
Of urgent concern is the fact that many plant species,
communities, and their ecological interactions, including
the many relationships between plant species and human
communities and cultures, are in danger of extinction,
threatened by such human-induced factors as, inter alia,
climate change, habitat loss and transformation, over-
exploitation, alien invasive species, pollution, clearing for
agriculture and other development. If this loss is not
stemmed, countless opportunities to develop new solutions
to pressing economic, social, health and industrial problems
will also be lost.
e plant extinction crisis is a reality but the true scale
of this is not yet clear. GSPC Target 2 therefore aims to
address this gap:
GSPC Target 2: An assessment of the conservation
status of all known plants, as far as possible, to
guide conservation action.
A REVIEW OF PROGRESS TOWARDS THE GLOBAL STRATEGY FOR PLANT CONSERVATION 2011-2020 11Various attempts have been made to estimate the number
of threatened plants on a global scale. e IUCN Red
List of reatened Species™ is recognized as the most
comprehensive objective global approach for evaluating
15%
the extinction risk of species and is the scientific basis
underpinning many of the indicators adopted by the
CBD for monitoring progress towards the achievement
of the GSPC and Aichi Targets. Unfortunately as noted
43%
by Vié et al., (2009) the number of plant assessments on
28%
the Red List has increased very slowly compared to other
taxonomic groups. By the end of 2013, only 6% of plant
species had been assessed at the global level using the
IUCN Red List categories and criteria. In addition, the 14%
taxa on the list are skewed both in terms of taxonomic
and geographic coverage. An attempt to provide an
objective overview based on a subset of the world’s flora,
Data deficient Possibly threatened
is the Sampled Red List Index for plants undertaken by
Not threatened reatened
RBG, Kew and the Natural History Museum, London
which indicated that 20% of the world’s plants are
threatened with extinction (Anon, 2012). Figure 2: Interim results of the global plant assessment
(RBG, Kew)
As an interim measure to support the achievement of
GSPC Target 2, RBG, Kew is leading an effort to produce geographical regions i.e. the global biodiversity hotspots
a list of plant conservation assessments by compiling defined on plant endemism and habitat loss are areas of
existing datasets, including the IUCN Red List but also greatest plant extinction risk.
including assessments made on a national (or regional)
level, and assessments made using other systems. e At a national level there has been good progress in red
interim list of plant assessments (for 2013) includes listing. According to an analysis of National Red Lists
58,494 unique plant assessments (approx. 16% of all (NRLs) carried out in 2010, vascular and nonvascular
plants). Of these, 43% plants assessed are categorised as plants were the most assessed of all taxonomic groups in
‘threatened’ with extinction (Figure 2). NRLs, with vascular and nonvascular plants being
assessed by 88% and 76% of countries with NRLs,
We are clearly still some way from reaching GSPC Target respectively, although not always comprehensively
2 and a complete global analysis of plant extinction on a (Zamin et al., 2010). 96 countries presently have a
species basis. However there is a presumption that certain national plant red list (Figure 3).
Figure 3: Countries with national plant Red Lists (data from Zamin et al., 2010 and www.nationalredlist.org).
(Solid colour, countries with a national plant Red List updated since 2000 and hatched, countries with a Red List
published before 2000).
12 PLANT CONSERVATION REPORT 2014Box 4: Red Listing in megadiverse countries
South Africa Colombia
South Africa has the world’s richest temperate flora e two-way partnership between South Africa and
with 20,456 recorded indigenous plant taxa. Of these, Brazil expanded in 2013 to include Colombia, a country
65% are endemic to the country. In 2009, South African with one the highest recorded number of plant species
botanists completed comprehensive assessments of the per unit area worldwide. A plan to assess the entire
country’s flora using the IUCN 3.1 Red List Categories Colombian flora (ca 24,000 species) was developed
and Criteria, becoming the first megadiverse country during a workshop involving botanists from the
to achieve GSPC Target 2. e results showed that Humboldt Institute, Colombia, CNC Flora and SANBI.
nearly a quarter of the South African flora is considered is relationship will continue over the next two years
either threatened with extinction or of conservation with SANBI and CNC-Flora providing continuing
concern. Habitat loss is by far the most severe threat support for Colombian plant Red List assessments.
to South African plants.
Madagascar
Source: http://redlist.sanbi.org
Madagascar, the fourth largest island in the world, is a
Brazil global biodiversity hotspot. Madagascar has between
10,000 and 14,000 species of plants, 90% of which are
Brazil has the world’s richest flora with 43,448 recorded endemic. For woody plants the degree of endemism is
indigenous vascular plant taxa, of which 41% (17,9840 even higher at 96%. It has been estimated that
taxa) are endemic. Two of the world’s biodiversity Madagascar had already lost more than half its forests
hotspots (the Atlantic rainforest and the Cerradao) by 1950 and subsequently there has been a 33%
are included within its borders. In 2011, in reduction in forest area since the 1970s (Moat and
collaboration with the South African National Smith, 2007). Only an estimated 18% of Madagascar’s
Biodiversity institute (SANBI), the National Centre primary vegetation remains.
for Plant Conservation (CNCFlora) began the task of
completing a comprehensive national assessment of Comprehensive Red Listing of Malagasy plants has not
Brazil’s flora. e first step in this process was the taken place but recent estimates suggest that 54% of
assessment of 4,617 selected species. e results of Madagascar’s flora as a whole is under threat, with risks
this assessment work revealed the following: being even greater for some groups – such as palms
(83% threatened) and Pandanaceae (91% threatened).
• 45% of assessed species were categorized as
threatened at some level; Source: Rakotoarinivo et al., (2014) and Callmander,
• Habitat loss was considered the major threat for et al., (2007)
87% of species;
• Nearly 15% of species assessed had at least one use e cost of plant Red Listing for megadiverse countries
ascribed to it in literature; has been estimated at around US$30 for Madagascar
• Only 1% of threatened species has their total area and South Africa and US$50 for Brazil. In South Africa
of distribution within protected areas and 17% were the costs have decreased as Red List experience
distributed completely outside protected areas. increases (Martinelli & Moraes, 2013). is suggests
that other countries with rich floras should able to
Source: Red Book of the Flora of Brazil in 2013 benefit from adopting similar cost-effective approaches
(Martinelli and Moraes, 2013) to conservation assessments for plants.
A REVIEW OF PROGRESS TOWARDS THE GLOBAL STRATEGY FOR PLANT CONSERVATION 2011-2020 133 . THE IMPORTANCE OF THE WORLD’S PLANTS
Plants are an essential component of the biosphere. ey use the sun’s energy in the process of
photosynthesis to capture carbon dioxide from the atmosphere and generate oxygen. Plant diversity
also underpins all terrestrial ecosystems, providing vital life support systems for other forms of
biodiversity, including humankind. is section explores the role wild plant species play in
supporting human well-being – both as component parts of ecosystems and through providing
direct livelihood support.
“Plants are not optional; they are essential to life and central to the future of human well-being.”
(Havens et al., 2014)
3.1 WILD PLANTS AND ECOSYSTEMS
Collectively, the benefits ecosystems provide are known
as ecosystem services and these can be grouped into four Box 5: Wild plants and pollination
main areas (Millennium Ecosystem Assessment (MA),
2005): One of the essential ecosystem services that has
received widespread attention is pollination. Some
• Provisioning (e.g. wild foods, plant-derived medicines, 87 out of the 115 leading global food crops depend
fresh water); upon animal pollination including important cash
• Regulating (e.g. climate regulation through carbon crops such as cocoa and coffee (Klein et al., 2007).
storage, pollination); In turn, animal pollinators rely on nectar and pollen
• Supporting (e.g. nutrient cycling, photosynthesis); from wild plants to survive. On a global scale, it has
• Cultural (e.g. spiritual, aesthetic and cultural benefits). been estimated that the services that insect
pollinators provide are worth around US$200
It is clear that wild plants, as the building blocks of billion, which is 9.5% of the total value of the world’s
ecosystems, make a significant, if not unique contribution agricultural food production in 2005 (Gallai et al.,
to all these services. A study in 1997 estimated the total 2009). Insect pollination is also estimated to increase
annual non-marketed contribution of ecosystems to the yields of 75% of globally important crops and is
human welfare at between US$16 - US$54 Trillion responsible for an estimated 35% of world crop
(Costanza et al., 1997). More recently, e Economics production (Klein et al., 2007).
of Ecosystems and Biodiversity (TEEB) report
highlighted that nature provides trillions of dollars in Source: http://www.teebweb.org/wp-
‘free’, life-supporting services to us each year (TEEB, content/uploads/2012/10/Green-Economy-Report.pdf
2010). However, as Salles (2011) indicates:
“e total value of biodiversity is infinite, so
having a debate about what is the total value of
nature is actually pointless because we can’t live
without it.”
14 PLANT CONSERVATION REPORT 2014Forests contribute to the maintenance of good water
quality by trapping or filtering water pollutants. ey
also minimize soil erosion and mitigate flash water flows
that cause erosion downstream. As water quality levels
around the world deteriorate and the cost of filtration
facilities remains high, several municipalities have
decided to invest resources in the conservation of water
catchment areas, including protected forests.
Approximately 9 million people in New York City and
nearby areas enjoy access to clean, inexpensive drinking
water. About 90% of that water is drawn from the
Catskill/Delaware watershed where the abundant forest
reserves, as well as soil with adequate carbon levels, provides
excellent conditions for natural filtration (WRI 2008).
e societal benefits provided by wild plant species at e annual value of the ecosystem services provided by
the ecosystem level can be illustrated by looking at forest forests has been estimated at US$4.7 trillion, or 38% of the
and grassland ecosystems, which together cover over 70% terrestrial total (Costanza et al., 1997). e estimated value
of the world’s land surface. of aesthetic and passive use of forest ecosystem services
3.1.1 Forest ecosystems
alone is US$280 million a year in the United States4.
3.1.2. Grassland ecosystems
Tree species (of which there are an estimated 80,000) are
the main biological components of forest ecosystems Grass species (of which there are an estimated 10,000)
which cover some 31% of the world’s land surface area. dominate the world’s grasslands and prairies. Grassland
As such they provide critical ecosystem goods and ecosystems cover approximately 40% of the world’s land
services, including food, fodder, water, shelter, nutrient surface area excluding Greenland and Antarctica and are
cycling, and cultural and recreational value. Forests found in every region of the world; Sub-Saharan Africa
provide habitat for a wide range of species supporting at and Asia have the largest total area in grassland, 14.5
least half of the Earth’s terrestrial biodiversity (MA, 2005) and 8.9 million km2 respectively. Worldwide, these
including 80% of amphibian, 75% of bird and 68% of ecosystems provide livelihoods for nearly 800 million
mammal species (Vié et al., 2009). It has been shown people.
that tree species richness significantly influences richness
in other species groups (Novotny et al., 2006). Grasslands are home to many food grains - wheat, maize,
rice, rye, millet, and sorghum - and they remain the
Forest ecosystems play a major role in the Earth’s primary source of genetic resources for improving our
biogeochemical processes, influencing hydrological, crops. Grasslands produce forage for domestic livestock,
nutrient and carbon cycles, as well as global climate (MA, which in turn support human livelihoods with meat,
2005). Forests contain about 50% of the world’s terrestrial milk, wool, and leather products. Grasslands provide
carbon stocks (FAO, 2010; MA, 2005), illustrating their habitat for breeding, migrating, and wintering birds;
importance for mitigation of climate change.
Chicago Botanic Garden
Box 6: Conserving forests avoids greenhouse
gas emissions worth US$ 3.7 trillion
Halving deforestation rates by 2030 would reduce
global greenhouse gas emissions by 1.5 to 2.7 GT
CO2 per year, thereby avoiding damages from climate
change estimated at more than US$ 3.7 trillion in
Net Present Value terms. is figure does not include
the many co-benefits of forest ecosystems.
Source: Eliasch 2009
A REVIEW OF PROGRESS TOWARDS THE GLOBAL STRATEGY FOR PLANT CONSERVATION 2011-2020 15ideal conditions for many soil fauna; and rangelands for
wild herbivores. ese ecosystems cycle water and Box 7: Restoring ecosystem services
nutrients, and build and maintain stabilization
mechanisms for soil (White et al., 2000). e financial value of wild plant diversity is oen not
realised until it needs to be restored. In the US, the
Grassland vegetation, above and below ground, as well Bureau of Land Management’s Plant Conservation
as the soil itself, serve as large storehouses for carbon, Program aims to ensure sufficient native plant
helping to limit global warming. Grasslands also supply materials are available in the commercial market for
energy, increasingly generated from windfarms that are restoring and maintaining the native plant
proliferating in such areas. communities on 655 million acres of land managed
by the federal government; including sufficient
Grasslands store approximately 34% of the global quantity of native seed for emergency stabilisation
stock of carbon in terrestrial ecosystems while and rehabilitation following a 15 million acre wildfire
forests store approximately 39% season. From 2001 – 2014, over US$70 million has
(White et al., 2000). been spent on this program. e Bureau of Land
Management is working together with many different
e large open landscapes grasslands provide also partners who have contributed over US$20 million
support recreational activities such as hunting, wildlife- towards this collaborative effort. A supply of over
watching, and tourism more generally, and offer aesthetic 1,000 native restoration species is being developed
and spiritual gratification. e economic contribution because native plant species stabilise soils and reduce
of grasslands through recreation and tourism, especially erosion; they more effectively filter storm water than
safari tours and hunting, can be high. However, excessive exotic plantings, thus improving water quality and
human use and wildlife poaching could decrease the supporting biodiversity including pollinators such as
capacity of grasslands to maintain such tourism services. bees, bats and birds.
Source: Peggy Olwell, 2014 pers. comm.
3.2 WILD PLANTS AND LIVELIHOODS
Wild plants support human livelihoods worldwide but
we do not yet have a full inventory of all the plants that
7%
are or could be utilised. We therefore do not know what
we have or what we are losing.
e most significant wild plant contribution to livelihoods
on a global scale is provided by timber. 39% 30%
3.2.1 Trees for timber and fuel
Globally, 3.4 billion m3 of wood was extracted from
forests in 2005 – not including the 100 million m3 of 24%
illegally cut timber believed to be produced each year5.
is timber comes from a mixture of planted forests, and
managed natural forests (Figure 4).
Planted Forest Forest where production
Wood removals from forests were evaluated at is part of the purpose
Forest primarily
just over US$100 billion annually between 2003 managed for timber Other forest
and 20076.
Figure 4: Types of global forest cover.
Only 7% of the world’s forested land is planted forest (a
category which includes afforested land as well as various is means that around two thirds of all harvested timber
plantation types) and some 1.4 billion of the 3.4 billion comes from natural or semi-natural forests8. is is
m3 of wood removals recorded in 2005 is thought to have particularly true in the tropics. In 2011, the International
come from such sources7. Tropical Timber Organisation (ITTO) (whose member
16 PLANT CONSERVATION REPORT 2014countries are involved in 90% of the global tropical timber 3.2.2. Wild plants for food
trade and hold 80% of the world’s tropical forests) reported
tropical timber imports worth US$13.6 billion, the majority Plants are essential for food production. e majority of
sourced from natural forests9. Just 22.4 million ha. of the our food needs are met from cultivated crops, with a small
total 783 million ha. permanent forest estate (PFE) reported number having global importance – for example, seven
by ITTO producer countries in 2010 was planted, and more plant species that provide wheat, sugar and rice are among
than half of the natural forest area was designated for the most significant contributors to per-capita calorie intake
production with 165 million ha. available for harvesting10. in 90% of countries around the world15. However, in
addition, thousands of species are grown locally for food
A recent list of commercial timbers traded internationally or used in traditional agriculture, some of them scarcely
includes over 1,500 species (Mark et al., 2014). or only partially domesticated, and many thousands more
are gathered from the wild (Heywood, 2011).
Box 8: Artisanal logging in the Democratic e importance of wild plants for food should not be
Republic of Congo (DRC) overlooked: some are valuable traded commodities and at
a local level, many species contribute directly to meeting
Estimates for the amount of forested land in the people’s nutritional needs and improving their food
Democratic Republic of Congo vary widely, from security. While much attention is rightly given to people
112 million ha. to 205.5 million ha. of tree cover, in chronic hunger (which affected around one in eight
but it is believed to constitute two thirds of the people in 2011-1316), the significant dangers of the ‘hidden
remaining humid forest in tropical Africa. While hunger’ of micronutrient deficiency (affecting around 30%
much of the exploitation of this resource is on a of the global population17) must also be addressed. Wild
commercial scale, the DRC’s artisanal loggers and foods can play a crucial role in preventing such
millers produce an estimated average of 3.4 million malnutrition: one study in Tanzania found that wild foods
m3 of logs a year, more than 13 times the output of contributed just 2% of the total energy in informants’ diets,
the large concessions of the country’s commercial but 19% of the iron, 20% of the vitamin C, and 31% of the
timber sector. e 25,000 people directly employed vitamin A18; another (looking at >93,000 children across
in the artisanal sector in DRC produce more than a 21 African countries) found that children had more diverse
million m3 of sawn wood, around 85% of which is and nutritious diets in areas with more tree cover19.
bought on domestic markets which generate in
excess of US$100 million per year. Importantly, local
people benefit from the trade, to the tune of Box 9: Edible nuts
approximately US$50 million a year; it is not yet
known, however, whether an expanded artisanal e global market for edible nuts excluding
timber sector would lead to unsustainable groundnuts is projected to exceed 13 million tons
exploitation of the forest.11,12,13 by the year 2015, while world unshelled groundnut
output could reach 39 million tons.
Source: various – see notes
e majority of edible nuts are cultivated in plantations
or orchards but some species are still harvested from
the wild for international trade. e brazil nut
As well as timber, trees continue to provide an essential Bertholletia excelsa is a well-known example. Global
source of energy for many communities. Despite the production of Brazil nuts in 2011 is estimated at 23,995
development of oil supplies during the twentieth century, metric tons, a 9% decrease from the previous year, of
fuel wood remains the most important single source of which Bolivia accounts for 76% of total production,
renewable energy, providing over 9% of global total followed by Brazil with 8% and Peru with 7%. e
primary energy supplies. Brazil nut is the most economically important plant
product that is harvested sustainably from the
e total reported value of fuel wood harvested Amazonian rain forest. Today, around 70% of the
in 2005 was US$7 billion (FAO, 2010). world’s supply comes from the Pando region, an area
that represents only 3% of the Amazon forest.
Wood energy is as important as all other renewable
energy sources combined (hydro, geothermal, wastes, Source: http://www.intracen.org/itc/market-
biogas, solar and liquid biofuels). Over two billion people insider/edible-nuts/#sthash.jVZxFlOd.dpuf and
depend on energy from wood collected from natural http://www.nutfruit.org/global-statistical-
forests for cooking and/or heating, particularly in review_13608.pdf
households in developing countries.14
A REVIEW OF PROGRESS TOWARDS THE GLOBAL STRATEGY FOR PLANT CONSERVATION 2011-2020 17Detailed inventories of wild vegetables are rarely available at around US$5 million at factory level and around US$50
at national level. Hundreds of species are used in countries million at consumer level with the potential to be worth at
such as Kenya, India and Ethiopia. Traditional leafy least US$500 million within the next few years.
vegetables also remain important in Mediterranean
countries such as France, Greece, Italy, Spain and Turkey. e global market for seasonings, spices and
Over 90 wild vegetables have been catalogued in Crete; herbs is likely to exceed US$6.5 billion per year
419 edible wild plants recorded in Spain and over 40 wild in the near future25.
Crop Wild Relatives
food species are regularly harvested in Anatolian Turkey
(Heywood, 2011).
By filling cyclical food gaps like the hungry season Crop wild relatives (CWR) are wild plant taxa with
between harvests, and acting as a safety net in times of relatively close genetic relationships to crop plants which
unexpected shortage, wild foods can play a major role in make them valuable to agriculture26. 77 of the world’s
improving people’s food security20. major and minor crops are believed to have around 700
close wild relatives, species which can be used readily as
sources for desirable traits in crop breeding27,28. is
Box 10: Counting the cost of micronutrient potential makes CWR species extremely valuable. At
deficiencies: present their contributions to the production chains of
rice, wheat, potatoes and cassava are worth US$25 billion,
Iron deficiencies mean two billion people worldwide and could potentially be worth US$73 billion in the
are anaemic, impairing their growth, productivity and future; for 29 crops with major importance to global
cognitive development, and increasing maternal food security29 these figures rise to current and potential
mortality21. Iodine deficiencies in pregnancy cause 20 values of US$42 billion and US$120 billion respectively30.
million babies a year to be born mentally impaired,
lowering the average IQ in deficient areas by 10-15
points22. Vitamin A deficiencies affect 250 million Box 11: Wild relatives in the cultivation of
preschool-aged children around the world: this causes yams
up to half a million children to go blind each year, half
of whom die within 12 months as a result of reduced Yams (Dioscorea spp.) are an important staple crop
immunity and increased rates of infection23,24. around the world. ey make significant contributions
to the food supply of more than a dozen countries,
Source: various – see notes particularly in West Africa, which accounts for 95%
of global production. In Benin, around 5% of yam
farmers exploit local CWR diversity in a process called
ennoblement. Ennoblement involves farmers selecting
e food and drinks industries have a significant interest wild yams with desirable traits and bringing them into
in wild plants for product development and marketing. In cultivation over several years. Genetic analyses show
recent years interest in wild species and associated that around a fih of cultivated individuals are of wild
traditional knowledge in these sectors has increased and is or wild-cultivated hybrid origin, highlighting the role
likely to be maintained as these help companies to market ennoblement plays in diversifying the genetic makeup
their products in competitive markets (Laird and Wynberg, of farmers’ crops and increasing their adaptive
2012). potential. is is especially important as yams are a
vegetatively propagated crop and there are few other
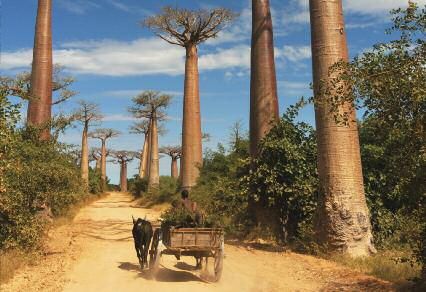
One species that has recently received increased global opportunities for variation to be introduced.31,32,33,34
attention is the baobab, an iconic African tree that features
in many stories and myths. Baobabs are extremely long- Source: various – see notes
lived, and have a wide variety of traditional uses. e leaves,
fruit, seeds and trunk are all utilized for diverse purposes
including water storage, food, medicine, oils, cosmetics,
rope and clothes. International interest is mainly in baobab Considering the significance of wild foods to food
as a nutritional supplement. Trying to define the global security and nutrition, and the value of CWR taxa to
baobab market is very difficult as there are no published agriculture – especially as global food demand is set to
figures. Broadly, Aduna, an African-inspired health and continue rising until mid-century35 – the importance of
beauty brand based in the UK, estimate the current market conserving wild plants for food cannot be overstated.
18 PLANT CONSERVATION REPORT 20143.2.3 Wild plants for medicine
Box 12: Prunus africana
Plants have been significant parts of traditional medical
systems for millennia, and these healthcare systems Prunus africana is a montane tree species of tropical
continue to be extremely important today. 100 million Africa. It yields a valuable medicinal product used
Europeans are thought to use traditional and to manufacture treatments for benign prostatic
complementary medicine; in 2008, out of pocket hyperplasia sold internationally and has a wide range
spending on natural products in the USA was US$14.8 of local uses in Africa. e bark is harvested in the
billion; in China (where 90% of hospitals have a largest quantity of any tree species and this has led
traditional medicine department) in 2009, there were to concerns about sustainability. e international
907 million visits to Traditional Chinese Medicine (TCM) market is robust and projected to increase. Retail
institutions and 13.6 million TCM in-patients, equating value of Prunus africana products is estimated at
to 18% of all visits and 16% of in-patients in surveyed over US$200 million annually, and may be
institutions and in 2012, the Chinese materia medica, considerably higher.
80% of which is plant-based, was estimated to have an
output of US$83.1 billion (Hawkins, 2008)36. ere has been strong interest in developing Prunus
africana as a plantation and agroforestry crop. Prunus
Plants also play a major role in allopathic (or ‘Western’) africana grows moderately fast and is quite adaptable
medicine. Over a twenty year period (1981-2002), 61% to different conditions. In Cameroon there are
of new pharmaceutical drugs (including 67% of cancer considerable numbers of planted trees, on private lands
treatment drugs and almost 70% of anti-infectives) had and in community forest areas. Overall however
novel chemical entities that were derived or inspired by collection is predominantly from the wild.
natural chemicals37 (although not necessarily all derived International trade is subject to the provisions of
from plants), with a quarter of prescription medicines CITES.
derived directly from flowering plants or modelled on
molecules they contain38. With these uses in mind, it is Source: http://www.cites.org/common/prog/african-
unsurprising that the trade in plants for medicine is cherry/11-CUNNINGHAM.pdf
highly valuable.
In 2012 global exports of plants whose use was
primarily pharmaceutical were valued at US$2.2 Box 13: e Loliondo Wonder Tree
billion39,40, and in 2000 global sales of herbal
products were estimated at US$60 billion41. One species facing extreme pressure is the Tanzanian
medicinal plant Murigariga (Carissa spinarum L.
is can have important effects on plants in the wild. ere [syn. C. edulis (Forssk.) Vahl.]). Between October
are thought to be in the region of 400,000 flowering plant 2010 and April 2012, seven million people visited
species in the world (Paton et al., 2008; see also Section 1), Samunge village in Arusha province for a purported
an estimated one in eight (12.5%) of which have medicinal miracle cure made from Murigariga roots. e
uses: these figures give a crude approximation of 45,000 – volume of visitors, with people queuing for tens of
50,000 medicinal plant species in the world flora. While kilometres and several days, has led to
the majority of commercial material comes from cultivated environmental degradation in the area; and with
sources, no more than a few hundred of the estimated 2,500 many acres of wild C. spinarum destructively
internationally traded medicinal plant species are thought harvested to meet demand, there are concerns that
to be commercially cultivated42, so both international trade the species is now at significant risk of local
and unsustainable local use put wild medicinal plants under extinction.45,46,47
significant pressure. In India around 90% of the medicinal
plants used by the country’s industry are harvested from Source: Various – see notes
the wild, and 315 of the 6,560 known medicinal species are
threatened with extinction43,44.
A REVIEW OF PROGRESS TOWARDS THE GLOBAL STRATEGY FOR PLANT CONSERVATION 2011-2020 19You can also read