CIRCULARITY GAP REPORT - THE - APO
←
→
Page content transcription
If your browser does not render page correctly, please read the page content below
THE
CIRCULARITY
  GAP REPORT
                2021

 Solutions for a linear world that consumes
  over 100 billion tonnes of materials and
          has warmed by 1-degree
WHO WE ARE
We work to accelerate the transition
to a circular economy. As an impact
organisation, we identify opportunities
to turn circular economy principles into
practical reality.
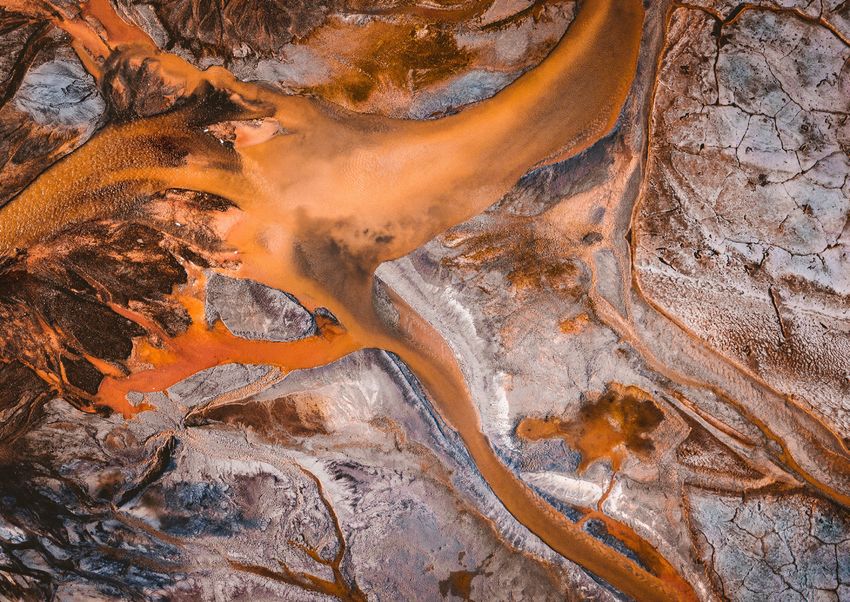
B E H I N D T H E C OV E R
With nature as our mentor, we combine
The image shows the ripple effects of even the smallest of actions: while a single
piece of gum clinging to a wall is trivial, the accumulation of billions has a massive
practical insights with scalable responses
impact. The same can be said for our individual ecological footprints, which have to humanity’s greatest challenges.
merged to spark a climate emergency. This image reminds us that the power to
Our vision is economic, social and
enact change is within all of us and that we are even more powerful if we come
environmental prosperity, without
together. Collaborative circular climate action is within our reach.
compromising the future of our planet.
Our mission is to connect and empower a
global community in business, cities and
governments to create the conditions for
systemic transformation.
The Platform for Accelerating the Circular Economy (PACE): This report is
published as part of the Platform for Accelerating the Circular Economy (PACE).
PACE is a public-private collaboration mechanism and project accelerator
dedicated to bringing about the circular economy at speed and scale. It brings
together a coalition of more than 70 leaders and is co chaired by the heads of
Royal Philips and the Global Environment Facility. It was initiated at the
World Economic Forum and is currently hosted by the World Resources Institute.
’As the circular economy has become a widely accepted
IN SUPPORT O F T H E political aspiration, the annual Circularity Gap Report has also
become a go-to resource for public and private world leaders.
C I R C U L A R I T Y G A P R EP O RT C A R LO S M A N U E L This year’s report articulates the critical linkages between the
circular economy and climate change, connecting two major
RODRIGUEZ
priority areas. With countries currently working to build
CEO of the Global
Environment Facilit y back better from the covid-19 pandemic and submit updated
climate pledges in the 2021 COP26, this report’s insights are
particularly timely.’
’The Circularity Gap Reports show the circular economy’s
enormous emission mitigation potential and key role in
achieving our climate goals, as well as the need for national ‘More than half of all greenhouse gas emissions are caused
S T I E N T J E VA N
and global action. We need systemic change in how we use by the use of our planet’s resources, such as minerals, metals
V E L D H OV E N and biomass. If the world economy is to be successfully
our resources, that goes beyond recycling and incorporates
Minister for the sustainable and resilient, then circularity must be built in
new business models, design and metrics. In order to fully DIMITRI DEVREEZE
Environment, Netherlands from the start as we endeavor to design out waste and
understand our progress and identify specific action areas, Co-CEO of Royal DSM
we need a variety of coordinated metrics, including the pollution. This report rightly stresses the role of business and
Circularity Gap Report.’ how important it is that we address the interconnected issues
of climate change and resource use together, hand-in-hand.’
’The Circularity Gap Report offers not only a sober warning
of the danger of climate inaction, but a clear map forward.
MARTIN FRICK ‘For billions of years, our home planet operated in a perfect
BORGE BRENDE Collaborative effort among government, business and civil
Senior Direc tor of the United cycle: new life emerged from the same carbon that existed as
President of the World society is necessary to scale the circular economy and drive
Nations Framework Convention life before. We are running out of time to restore this balance
Economic Forum down emissions. Only through collective investment in
on Climate Change (UNFCCC) &
and commitment to circular practices can we shape a more and achieve carbon neutrality. For that, we need to eliminate
Deput y to the Special Envoy for
sustainable, resilient future.’ waste and create products that last, can be repaired and
the UN Food System Summit
ultimately be transformed into new products.’
2021
’The economic recovery the world is facing represents a unique
‘The Circularity Gap Report 2021 provides a clear and alarming
opportunity to build back better. The circular economy offers
view on the insufficient progress towards a circular economy.
F R A N S VA N H O U T E N an integrated approach that reinforces the need to incorporate
Decoupling economic growth from resource use is critical to G A B R I E L Q U I JA N D R I A
CEO of Royal Philips & collaborative and low-carbon economic models.
mitigate climate change. I urge the global community to step Minister of the
Co-Chair of PACE The Circularity Gap Report and its close link with emissions
up efforts and to adopt circular practices with urgency.’ Environment, Peru
reduction targets is not only necessary but essential if we want
to rebuild sustainable, harmonious economies that guarantee
the well-being of people.’
‘If humanity is to meet the needs of all people within the
means of this delicately balanced living planet, it is essential
for the linear, degenerative industrial systems that we have
K AT E R AW O R T H inherited to become circular and regenerative by design. ‘The Circularity Gap Report 2021 shines a light on the elephant
Author of the book Doughnut Last century’s economic theories, models and policies in the room: that we can only achieve the goals of the Paris
PAVA N S U K H D E V Agreement by managing and consuming materials in a
Economics & Senior Visiting were not designed to bring about this transformation: it is a
President of W WF International
Research A ssociate at ECI, challenge that belongs to our own generation. The Circularity more circular way. This report gives all nations practical and
Universit y of Oxford Gap Report 2021 plays a key role here by providing highly innovative policy guidance and strategies that can be included
valuable analysis, data, guidance and examples that build in their updated Nationally Determined Contributions.’
the necessary momentum for circularity in this critical
decade ahead.’
’The National Strategy for Circular Economy involves the ‘Climate change is undeniably the biggest market failure of the
C A R LO S 20th century. Our current system, based on the assumption
joint work of producers, suppliers, consumers and other ANDRE HOFFMANN
E D UA R D O C O R R E A actors in production and consumption systems to develop of infinite growth on a finite planet is both obsolete and
Environmentalist,
Minister of the Environment and implement new business models that incorporate waste incomplete. The time has come to take a step back and rethink
Philanthropist & Vice-Chairman
& Sustainable Development management, efficient handling of materials and changes in human activity on our planet. This report offers a toolkit to
of Roche
,Colombia equip governments, businesses, academia and civil society
the lifestyles of citizens.’
at large to implement sustainable and circular policies.’
4 Th e Ci r c ul a r i t y G a p R e p o r t 2 02 1 5
’As we begin to recover from a difficult year, we now
                                   have a chance to solve multiple crises at once, from
                                   resource scarcity to biodiversity loss and climate change.
         J Y R K I K ATA I N E N   The Circularity Gap Report 2021 presents an important
        President of the Finnish
                                   contribution for how we can tackle both overconsumption
          Innovation Fund Sitra
                                   and climate change through smarter management of the
                                   world’s resources. For the upcoming COP26, the circular
                                   economy needs to be at the heart of the conference.’

                                                                                                       ABOUT THE CIRCUL ARIT Y GAP REPORT
                                   ‘In these unprecedented times, a compass that helps
                                   businesses steer action and sets realistic targets to make             The first Circularity Gap Report presented the
                                   our economy more circular is crucial. Doubling our global
          FEIKE SIJBESMA                                                                              alarming statistic that our world economy was only
                                   circularity rate is by no means easy, but with the support
            Honorar y Chairman                                                                        9.1% circular, leaving a massive Circularity Gap. The
                                   of the Circularity Gap Report, we can start measuring and
                 of Royal DSM
                                   monitoring our progress to redesign our value chains and           Report, launched in January 2018 during the World
                                   treat waste as a renewable input.’                                 Economic Forum in Davos, has since been updated
                                                                                                        and published on an annual basis. This iteration
                                                                                                         marks the fourth edition. The Reports provide
                                                                                                       high-level insights into the global metabolism and
                                   ‘Circular economy is becoming a widely recognised and                key levers for transitioning to circularity, as well
        JA N E Z P OTO Č N I K     accepted concept. But to make it real, as the Report shows,         as supporting decision-makers by communicating
Former European Commissioner       will require many efforts and a system change, also in our
                                                                                                        metrics and better measurement of the circular
          for the Environment &    understanding of the circular economy and its relation to
                                                                                                        economy to guide their action. Yet, updating the
           Co-Chair of the UNEP    climate change. We need to embrace dematerialisation,
   International Resource Panel    rethink concepts of ownership and move from resource               Circularity Metric is not feasible on an annual basis
                                   efficiency to resource sufficiency.’                                due to the limited availability of data. Since 2020,
                                                                                                      the Circularity Gap Reporting Initiative also explores
                                                                                                       how data to inform stakeholder decision-making
                                   ‘When will we know that we are truly sustainable? I have             can best be collected, communicated and made
                                   come to the conclusion that this will occur when we have           globally accessible. For updates and contact details
                                   transitioned to a carbon neutral circular economy.
                                                                                                             we encourage you to visit our website:
                                   Zero-carbon energy is a crucial part of the transformation,
         PAU L K LY M E N KO       but it is not enough. The Circularity Gap Report 2021 quantifies
                                                                                                                        circularity-gap.world
              CEO of Planet Ark    the essential role that a more circular economy will have
                                   in meeting global societal needs, without exceeding our
                                   available carbon budget. In a time of post-covid-19 economic
                                   reconstruction, it highlights the way forward in building
                                   sustainable society.’

                                   ‘To fight climate breakdown our system needs a major
                                   overhaul. A truly circular economy mimics nature and can
                                   ensure the restoration of our environment and reconnect
    EBERHARD BRANDES
                                   humans with the natural world. In order to achieve this, we
         CEO of W WF Germany
                                   need a better understanding of how circularity can live up
                                   to its potential. The Circularity Gap Report 2021 provides a
                                   decisive first step in that direction.’

6                                                                                                                                                 Th e Ci r c ul a r i t y G a p R e p o r t 2 02 1   7
E XEC U T I V E
SUMMARY

Enacted globally, a circular economy can close the            century.1 Global warming shows no signs of slowing          They do, though, wield power—especially now.
Emissions Gap. This study shows that combining                and the reality is that certain vulnerable cities and       Economic stimulus packages to pull countries out of
the twin agendas of circular economy and climate              countries will face catastrophes that threaten much         their post-pandemic slumps are rolling out and the
mitigation gets us on a path to a well below 2-degree         of the population. 2 And in a cruel irony, lower-           crunch UN summit, the COP26, has been postponed
world by 2032. In adopting a roadmap packed with              income nations who contribute the fewest emissions          to Autumn 2021. This means we have lost valuable
circular strategies, we can pave the way for the              are also most vulnerable to the impacts of climate          time to accelerate action, especially as the majority
systemic transformations needed to course-correct             breakdown. We are already past the point of minor           of countries were not on track to update their already
the global economy—going far beyond the limitations           amends. Course-correction will require a major,             ‘woefully inadequate’ 7 climate pledges by the end of
of current policy and national climate pledges. The           transformational gear-change in systemic thinking.          2020. 8 To guide this process, we examine the common
current pledges bring us over 15% of the way; the             This big shift is the circular economy.                     challenges and opportunities for three overarching
circular economy delivers the other 85%. If the coming                                                                    country profiles and present blueprints for action
decade is the decisive one for humanity’s future on           Climate breakdown demands more than current                 tailored to each context and set of unique climate
earth, then 2021 is the year to ramp up our efforts           climate pledges can deliver. This Circularity Gap           pledges. For countries, this truly is their time.
to bring our goals into realistic reach and prevent           Report quantitatively maps how greenhouse gas
the worst effects of climate breakdown. Our current           (GHG) emissions and resources move through our              This is the real year of truth. With 2020 struck
economy is only 8.6% circular, leaving a massive              economy, from extraction to end-of-use. What we             by covid-19, lockdowns around the globe not only
Circularity Gap. The good news is that we only need to        find is that material handling and use3 accounts for        contributed to a sharp decline in emissions, but
close the Gap by a further 8.4%—or roughly double the         the vast majority (70%) of GHGs 4 emitted. This proves      also accelerated decommissioning of fossil assets.9
current global figure of 8.6%—to get there.                   how vital it is to look beyond the narrow energy focus      Despite this progress being unintended and arguably
                                                              of the current climate pledges to make a real impact.       temporary, it can teach us valuable lessons to translate
However, circularity in our 8.6% world is trending            By applying circular strategies at the intersection of      into structural change—and now, the world seems
down, not up. Whilst the Circularity Gap Report 2020          materials and emissions hotspots, we can increase           to be listening. Emboldened by universal uptake of
revealed that the global economy was only 8.6%                value-retention and cut excessive consumption,              renewables, governments are making decisions that
circular, just two years earlier it was 9.1%—things have      thereby slashing GHGs. This is how narrowing the            will positively shape our climate future. The events
got worse. So, although we only need to almost double         Circularity Gap, in turn, closes the Emissions Gap.         of 2020 also served to hold a magnifying glass to the
circularity to close the Emissions Gap by 2032, the                                                                       flaws in our system—an unsustainably linear system
globe remains shackled by outdated ‘take-make-waste’          A circular economy can satisfy societal needs and           reliant on the exploitation of nature and people—
practices. Humanity has now also breached two major           wants by doing more with less. We need materials to         and there is no environmental justice, without social
milestones: the world is consuming 100 billion tonnes         fuel our lifestyles; this produces emissions. However,      justice. Destructive and instructive as the pandemic
(Gt) of materials and it is 1-degree warmer. Due to data      the circular economy ensures that with less material        proved, it is ultimately climate breakdown that will be
unavailability, the Circularity Metric was not updated        input and fewer emissions, we can still deliver the         the biggest global health-threat of the century.10 In a
for this year, yet all indicators point to the reality that   same, or better, output. Through smart strategies           time of building back better, the circular economy has
the globe remains engulfed by the linear economy and          and reduced material consumption, we find that the          never been more relevant.
its unsustainable practices, processes and behaviours.        circular economy has the power to shrink global GHG
However, when the covid-19 pandemic swept the                 emissions by 39% and cut virgin resource use by 28%.
world in 2020, we saw empty skies and roads, as entire        Within this, the societal need of Housing delivers half
populations were placed under national lockdown.              of the impact, while Mobility and Nutrition account for
Temporary as the resulting drop in annual global              much of the rest. To get to our end goal of a socially
emissions may be, it has shown us what is possible:           just and ecologically safe space5, we need intelligent
from governments to citizens, we are now armed with           resource management to stem consumption and
the knowledge that transformational change is doable.         cut emissions, so their impact falls within planetary
                                                              boundaries.
And time is running out. Even if all countries that
pledged climate action as part of the Paris Agreement         Countries: another year lost in the race to get it
fulfil their emissions-cutting promises, the rise in          right. No country is firmly on the path to achieving
temperatures is still forecast to hit 3.2-degrees this        our goal of a socially just and ecologically safe space.6

8                                                                                                                                                                                    Th e Ci r c ul a r i t y G a p R e p o r t 2 02 1   9
CONTENTS

                        BRIDGE THE GAPS THROUGH
                        LE ADERSHIP AND AC TION

                                                                                          1   INTRO D U C TI O N
                                                                                                                                  5
                                                                                                                                       S E T TIN G A N E W CO U RS E
                        1. Build a coalition for action that is both diverse and                                                       T he trans formational impac t
                                                                                              12 - 17                                  of circularit y
                        inclusive. Bringing a diverse community of businesses,
                        governments, NGOs and academics together to boost
                        capacity and capability will accelerate collective action                                                      36 - 4 3
                        toward circularity, serving the betterment of societal needs

                                                                                          2   MIND THE GAPS

                                                                                                                                  6
                        and global ecological health. This will enable action toward          Emissions and material hot spot s
                        reaching the Paris Agreement’s goals before it’s too late and                                                  TAILO RED TR AN S ITI O N
                                                                                              in the linear economy
                        begin to build the necessary infrastructure and alliances to                                                   PATHWAYS
                        collect, retrieve and share circular knowledge on a global            18 - 2 3                                 Countr y prof ile roadmaps
                        level.
                                                                                                                                       4 4 - 57

                                                                                          3
                        2. Integrate plans for leveraging the circular economy                ME TRI C S B EHIND
                        into national climate pledges. Circular strategies suited

                                                                                                                                  7
                                                                                              THE GAPS
                        to different country profiles can get nations back on a well                                                   NATI O NAL CLIMATE
                                                                                              Global circularit y
                        below 2-degree pathway. Integrating tailored plans can also                                                    PLED GE S & THE ND C S
                        enable better goal-setting, measurement and benchmarking              the Emissions Gap
                                                                                                                                       Enabling a global circular economy
                        for countries in the NDC revision process, and ensure that
                        each nation can address global issues in a way that aligns to
                                                                                              24 - 27
                                                                                                                                       58 -63
                        their local context, incentives and mandates. This can also

                                                                                          4
                        support key industries that need to shoulder the change.

                                                                                                                                  8
                                                                                              B RID GIN G THE GAPS
                                                                                                                                       THE WAY F O RWARD
                        3. Create an enabling environment to facilitate the                   Our roadmap to a well below
                        circular transition. Market and regulatory failures that              2- degree world                          64 -65
                        inhibit the enabling conditions needed for circular initiatives
                        to reach scale can be addressed by policymakers; including            28 - 35
                        steering away from financial models that only support linear
                        projects. Capital must also be mobilised toward circular
                        initiatives to unlock the potential of ‘building back better’.
Photo by Ivan Bandura

    10                                                                                                                                Th e Ci r c ul a r i t y G a p R e p o r t 2 02 1   11
1. INTRODUCTION

Humanity is living beyond the means of Planet             In 2017, we passed another bleak milestone: the
Earth. Our use of finite resources continues to spiral    threshold of human activities causing 1-degree global
upward; greenhouse gas (GHG) emissions continue           warming.11 In 2020, we reached 1.1-degrees.12 To date,
to disperse into the air. The earth continues to heat     the last five years have broken successive weather
up. It is becoming clear that we’re running out of        records and—even if the current climate pledges,
time to course-correct. Yet, in light of rapid global     the Nationally Determined Contributions (NDCs),
change, since the covid-19 pandemic struck in March       are followed—the global rise in temperatures is still
2020, the world is finally waking up. Covid-19 has        forecast to hit 3.2-degrees this century.13 This is an
disrupted business-as-usual. Climate breakdown,           alarming number; the Intergovernmental Panel on
resource scarcity and ecological collapse have            Climate Change (IPCC) has warned that going beyond
moved from the horizon to the now, as shocks and          1.5-degrees alone will increase the frequency and
crises have exposed the fragility of our current,         intensity of climate impacts. In a 3-degree warming
linear system. Calls to ‘build back better’ with a        situation, the globe risks being drowned by climate
green recovery—thereby mending the impacts of             extremes such as floods, droughts and wildfires,
the pandemic in a way that also addresses climate         all of which displace populations and increase food
breakdown—are strong. This 2021 edition of the            insecurity. Global GHG emissions reached record highs
Circularity Gap Report quantifies the huge synergistic    in 2018, and despite dips following lockdown-lifestyles
and transformational power the circular economy           due to covid-19, we are still far off track. This difference
holds for the climate mitigation agenda—just in           between ‘where we are likely to be and where we need
time for this year’s crunch UN summit that will           to be’ has become known as the Emissions Gap.
pave our future climate pathways. In getting
smarter about our global resource use and                 F I V E Y E A R S S I N C E T H E PA R I S AG R E E M E N T
consumption, we can close the globe’s widening
                                                          There has been, however, globally coordinated action
Circularity and Emissions Gaps. Closing both Gaps
                                                          on climate breakdown. According to United Nations
together will put us firmly back on a path toward
                                                          Climate Change, in 2015; 196 countries signed the
the goal of the Paris Agreement: limiting warming
                                                          Paris Agreement. Worldwide climate action was set
to well below 2-degrees.
                                                          out: mitigation of climate change by limiting the
                                                          average global temperature rise this century to well
1 B I L L I O N TO N N E S , 1- D E G R E E G LO B A L
                                                          below 2-degrees; support for lower-income nations
WA R M I N G
                                                          and transparent reporting of climate goals. Things
In our 2020 Circularity Gap Report, we recorded a         could only get better—or so was the presumption.
bleak, first-time milestone: 100 billion tonnes of        It is now clear, though, that the blueprints mapped
materials enter the global economy every year. These      out for the globe in the form of national climate
materials are funnelled through our economy and           promises—NDCs—were never powerful enough
allow us to continue our way of life. However, of         to fulfil the Agreement’s well below 2-degree goal.
this massive amount, only 8.6% is cycled back into        With a prevailing focus on renewable energy and an
the economy. For the past 200 years at least, the         incremental focus on industries, they will not get us
hallmark of global consumption and resource use           where we need to be. And in the five years that have
can be aptly described as ‘take-make-waste’: a linear     passed since Paris, large gaps between promises and
economy. Whilst this model has enabled vast growth,       implementation have emerged. With every year of
a defining characteristic has unfortunately been huge     slow progress, the challenge grows. More extreme
overconsumption to the detriment of planetary health.     action is necessary. However, what should have been
Furthermore, despite bringing prosperity to some of       a pivotal moment for updating and strengthening the
the population, some of the time, global social equity    NDCs was missed: the COP26 in 2020 was cancelled
has also been negatively impacted. In many parts of the   and postponed to November 2021 due to the covid-19
world, linear over-consumption has effectively become     pandemic. As a result, 2021 has become a pivotal year
the norm, whilst elsewhere, minimum living standards      for climate action—the decisions we make this year will
are not even being reached.                               shape our future climate.

12                                                                                                                       Th e Ci r c ul a r i t y G a p R e p o r t 2 02 1   13
Calls for a green recovery in alignment with other global 2.1-degree pathway—according to recent estimates—if we can deliver improved prosperity. This will require
THE CIRCUL AR ECONOMY AS A MEANS challenges have never been louder, and many see a backed up with long-term action.We see momentum more than just a focus on renewable energy: it calls
TO A N E N D rare opportunity like no other to build a resilient and building. There are also many facilitating factors that for transformational course-correction that not only
low-carbon economic future. The circular economy, make now a perfect time for action. 20 Renewable energy encourages behavioural changes, but prompts a total
Society now finds itself at a historic economic and
as a tangible way of achieving this vision, is now more prices are dropping and if China and the EU continue overhaul of linear activities. In this report, we are also
cultural crossroads. Do we continue to tweak and
relevant than ever. to invest in wind, solar and batteries, they will fall careful to examine ethical considerations and
tamper with our broken linear model, cognisant of the
further, while climate legislation may see the price of trade-offs that could potentially arise in the transition
consequences and liable by default? Or, do we pivot
Governments around the world are now making huge carbon-intensive materials rise. to circularity. The circular economy must not perpetuate
to a new model—such as the circular economy—with
decisions that will shape our climate future. Firstly, the same mistakes of the linear economy, which relies
fresh minds and new tools to pursue a desirable and
as a result of the impacts of the pandemic, stimulus T H E P OW E R O F C O U N T R I E S on the continued exploitation of both people and planet.
deliverable paradigm shift?
packages designed to pull us out of economic slumps We therefore pinpoint the seven core societal needs
In making these future-shaping decisions, countries
mean governments are now making decisions on and wants that guide our research: Housing, Nutrition,
The circular economy holds the promise for systemic clearly have potential—and potential is power. From
how to spend capital that could build back better and Mobility, Communications, Services, Consumables and
transformation of our society, as its core tenants design determining the focus of each country’s NDC to
help set new goals for resilience and preparedness. Healthcare. Central to our proposition is ensuring that
out waste and pollution, keep products and materials funnelling capital toward future-oriented innovation,
Alternatively, in thrall to business-as-usual, they might our roadmap for a well below 2-degree world is built
in use and regenerate natural systems.14 However, the their role is massive. The NDCs now largely focus on
instead leave us vulnerable, divided and susceptible. upon scenarios that are resource efficient, but also
circular economy is also an action agenda with impact energy efficiency and renewable energy, as well as
These stimulus packages could, for example, drive a people-centric; the impact of one circular strategy could
that extends beyond resource efficiency. As a multi- curbing emissions from land use, land-use change and
huge uptake in renewable energy, which in turn would have vastly different repercussions on communities in
stakeholder model, its systems-thinking approach forestry. Looking ahead, circular economy strategies
spur jobs. The 2020 Emissions Gap report, which calls for different localities and this must be taken into account.
boosts capacity and capability to serve universal could be employed to support countries in identifying
a green recovery, notes that around one-quarter of G20 There is no environmental justice without social justice.
societal needs. This circular framework aligns with and developing mitigation options which go beyond
members have dedicated shares of their spending, up
a vision of a more resource-aligned, people-centric current pledges, both in scope and ambition.
to 3% of GDP, to low-carbon measures. For most others, The Circularity Gap Report approach shows the potential
future. But getting there will not be easy. A full circular But different countries should take different paths.
spending has mostly been high-carbon or neutral.18 benefits of circular economy solutions to trigger
transition calls for creative innovation in systems design Different country profiles, although operating under
Moreover, high hopes were being pinned by many on government and company action with ‘what if’ scenarios.
and rigorous collaboration across and within value- similar overarching global trends, need to problem-
the COP26 UN summit supposed to take place in 2020, Consider this when interpreting the figures we use in
chains, plus among multiple stakeholders. Change may solve very differently and the implementation of circular
but rescheduled for Autumn 2021. Therefore, how our roadmap (detailed in Chapter Four), such as ‘cutting
be difficult, but it is necessary. Closing the Circularity strategies will, therefore, differ between localities.
countries move forward with their NDCs following the virgin resource use by 28%’. This is important because
Gap serves the higher objective of preventing further Higher-income nations, that are responsible for the
events of the past year—and how governments take ours is not a dynamic modelling analysis (as used in
and accelerated environmental degradation and social overwhelming majority of historical emissions, need
action to implement their pledges—can and will shape the Emissions Gap Reports): material extraction and
inequality. In moving the globe toward an ecologically to shift away from current linear paradigms that fuel
the future of our climate for years to come. emissions are not forecasted to 2030 or 2050, nor do our
safe and socially just operating space for humankind, overconsumption of the earth’s resources—and fast.
interventions and scenarios account for technological or
the circular economy is a critical pathway.15 Economies that are still growing, or rapidly building,
A G LO B A L C OA L I T I O N TOWA R D socio-economic trends occurring in that period.
can navigate away from linearity now so that they don’t
D E C A R B O N I S AT I O N ?
In our analysis, we have found that the vast majority face the same challenges in the future. With this in mind,
(70%) of emissions16 are associated with material The encouraging announcements from a number this Circularity Gap Report tailors its global roadmap A I M S O F T H E C I R C U L A R IT Y
handling and use, demonstrating the clear and of countries calling for a green recovery in 2020 for different country profiles in Chapter Six to deliver GA P R E P O R T 202 1
necessary role for circular economy strategies—which largely placed net-zero at the heart of action. Capital actionable roadmaps. In Chapter Seven, we dive into 1. Illustrate and quantify the mutually reinforcing
look to do more with less—in emissions reduction. The funds enforced significant divestments in the fossil the on-the-ground barriers to the circular transition, relationship of the circular economy and the climate
aim of this report is to provide a quantified link between industry.19 So, are we seeing a global coalition toward and recommend points of change for countries’ NDCs. mitigation agenda.
the circular economy and climate mitigation agenda. decarbonisation? Sweden, the UK, France, Denmark, With the pandemic, we have lost a valuable year
2. Demonstrate the power of circular economy
We create an x-ray of global emissions to unpack the New Zealand, Hungary, China (which alone is responsible to accelerate action. But the urgency is now more
strategies to close the Circularity Gap and the
blinking lights of climate breakdown and locate where for 28% of global emissions), South Korea and Japan apparent and the collective attitude more accepting of
Emissions Gap and help us reach the goals of the
emissions-material hotspots are to be found in our all have a net-zero target in place by law (albeit with fundamental change. This report can guide countries
Paris Agreement.
economy. Building on this analysis, we set out both different goal years). The recent election success of the in this process of making the course-correction we so
global and regional treatment plans to get us back on a Biden administration means the US will also rejoin the desperately need. For countries, this truly is their time. 3. Accordingly, identify key interventions for
well below 2-degree and circular path. Paris Agreement and the new President promises to impact, based on the needs of society, that are
delivery net-zero emissions by 2050. Also, the European S A M E G LO B A L N E E D S , R A D I C A L LY F E W E R resource-smart and low-emission.
THE REAL YEAR OF TRUTH Green Deal has stated the ambition to be the first zero M AT E R I A L S A N D E M I S S I O N S 4. Identify how our scenarios can be tailored to
emissions continent by 2050 with a specific Circular
2020 was struck by covid-19. The pandemic served What this report will ultimately do is show the power national levels to inform goal-setting and NDC
Economy Action Plan as part of the roadmap. These
to unite the global population in one sentiment: of the circular economy to fulfil our global needs and revision.
recent emissions-reduction pledges, especially from
vulnerability—the vulnerability of our economy, of our wants, but with radically fewer materials and emissions. 5. Identify key pathways for three distinct country
the US and China, could potentially bring the world on a
environment and, ultimately, our future on earth.17 The circular economy ensures that with less input, profiles to transition towards the safe and just space.
14 Th e Ci r c ul a r i t y G a p R e p o r t 2 02 1 15
S E VE N S O C I E TA L N E E DS & WA NTS

                                         HOUSING                                         S E RV I C E S

                                         The need that represents the largest            The delivery of services to society ranges
                                         resource and emissions footprint is             from education and public services to
                                         for construction and maintenance of             commercial services like banking and
                                         residential houses, especially in lower-        insurance. The material and emissions
                                         income nations.                                 footprint is modest in total and typically
                                                                                         involves the use of professional
                                                                                         equipment, office furniture, computers
                                                                                         and other infrastructure.

                                         NUTRITION

                                         Also with a large footprint is the need         H E A LT H C A R E
                                         for nutrition, which includes agricultural
                                                                                         With an expanding, ageing and, on average,
                                         products such as crops and livestock.
                                                                                         more prosperous population, healthcare
                                         Food products have short lifecycles in
                                                                                         services are increasing globally. Buildings
                                         our economy, being consumed quickly
                                                                                         aside, typical resource groups include use
                                         after production.
                                                                                         of capital equipment such as x-ray
                                                                                         machines, pharmaceuticals, hospital
                                                                                         outfittings (beds), disposables and
                                                                                         homecare equipment.

                                         MOBILIT Y

                                         A considerable resource and emissions
                                         footprint is taken up by our need for
                                                                                         C O M M U N I C AT I O N
                                         mobility. In particular, two resource types
                                         are used: the materials to build transport      Communication is becoming an ever-
                                         technologies and vehicles like cars, trains     more important aspect of today’s
                                         and aeroplanes; plus, predominantly, the        society, provided by a mix of equipment
                                         fossil fuels burned to power them.              and technology ranging from personal
                                                                                         mobile devices to data centres. Increased
                                                                                         connectivity is also an enabler of the
                                                                                         circular economy, where digitisation can
                                                                                         make physical products obsolete, or
                                         CONSUMABLES
                                                                                         enable far better use of existing assets,
                                         Consumables are a diverse and complex           including consumables, building stock or
                                         group of products—such as refrigerators,        infrastructure.
                                         clothing, cleaning agents and paints—
                                         that generally have short to medium
P h o t o b y Yo g e n d r a S i n g h

                                         lifetimes. Textiles, including clothing, also
                                         consume different kinds of resources
                                         such as cotton, synthetic materials like
                                         polyester, dye pigments, and chemicals.

        16                                                                               Th e Ci r c ul a r i t y G a p R e p o r t 2 02 1   17
Circularity is in reverse: our 2020 report commu-
                                                        nicated that the global economy is 8.6% circular,
                                                        while our 2018 edition reported 9.1%. Alongside our
                                                        widening Circularity Gap, the world is heating up.
                                                        In 2017, for the first time, humanity consumed
                                                        more than 100 billion tonnes of materials and
                                                        increased the mean global temperature by more
                                                        than 1-degree above pre-industrial level. 21 We need
                                                        to course-correct. Therefore, this year we—in a
                                                        first for the Circularity Gap Report—have created
                                                        an x-ray of how global greenhouse gas emissions
                                                        flow along through different value-adding stages
                                                        of the economy. By taking an approach to global
                                                        resource use that considers both mass and carbon,
                                                        we can consume fewer materials, increase value-re-
                                                        tention and increase cycling back into the economy,
                                                        whilst simultaneously slashing emissions. In the

                          2
                                                        face of mounting urgency, the solutions we apply to
                                                        our situation must also be multidimensional.

                                                        X- R AY O F O U R G LO B A L E C O N O M Y

                                                        In the first edition of the Circularity Gap Report released
                                                        in 2018, we asked ourselves: how circular is the global
                                                        economy today? Supplying an answer to that question,
                                                        as well as insights into key global levers to move us
                                                        toward circularity, are crucial for us to plan our path
                                                        forward. Three consecutive reports have contributed
                                                        to developing these insights, as well as bolstering
                                                        metrics for circularity as a discipline. We now know
                                                        how circular the globe is and what we need to do to
                                                        close the Gap.

                          MIND                          It soon became clear how the circular economy has to
                                                        do more than look at material flows alone. In our 2019

                          THE
                                                        report, we introduced the Mass-Value-Carbon (MVC)
                                                        nexus, a concept that looks at how much greenhouse
                                                        gas (GHG) emissions (Carbon) and value-created (Value)

                         GAP(S)
                                                        get distributed through meeting our key societal
                                                        needs and wants with materials (Mass). Building on
                                                        our MVC nexus concept and profoundly deepening
                                                        our exploration, this report will scrutinise how global
                                                        GHG emissions arise from the extraction, processing
                                                        and use of resources. Following our signature style of
                                                        providing one single visual that gives an overview of
                                                        the entire global economy’s material flows, we will now
                          X-rays of global emis sions   present one for global GHG emissions: our x-ray of
Photo by Jeremy Bishop

                          and materials                 global GHG emissions.

                                                                                                                      Th e Ci r c ul a r i t y G a p R e p o r t 2 02 1   19
To satisfy all global needs and wants, we emitted 59.1 Beginning from the left-hand side, we see how four relative terms (8%), with calcination of cement
TH E E M I S S I O N S billion tonnes of GHGs in 2019, including land use, land- types of resources—fossil fuels, minerals, ores and kiln being the most emissions-intensive
X-R AY BEHIND use change and forestry (LULUCF). 22 This is the amount
that is dispersed into our atmosphere every year and it is
biomass—are extracted (Take) and put to use in
the global economy. Fossil fuels are responsible
non-combustion process.
GLOBAL SO CIE TAL the mammoth tonnage that we seek to strip back 23. But
first, we need to know where these emissions stem from
for by far the most global embodied emissions
(65%), with petroleum fueling much of the globe’s
It is interesting to observe how the switch between
the emissions related to materials and energy occurs.
NEEDS to reduce them. Our emissions x-ray, Figure One, shows transportation, plus coal and natural gas providing Notice that before energy carriers such as oil, gas,
us how the vast majority of GHG emissions (70%) are inputs for electricity, heat and industrial processes. coal and fuelwood undergo transformation (Process)
ultimately generated through material handling and use The second-largest source of embodied emissions is into refined materials, and energy and heat, they
(at the Provide level)—whether for the clothes we wear, the production of biomass through agricultural and represent the majority of the emissions (70%); while,
the phones we own, or the meals we eat. In illustrating forestry processes, with significant emissions (26%) at this stage, materials are only responsible for 30%26
Energy carriers such as oil, gas, coal and how 59.1 billion tonnes of emissions flow along and across related to LULUCF. This delivers us food products, 27
(broken down into 23% material processing and 7%
fuelwood travel through the economy global value-chains, Figure One allows us to gain a deeper timber and fuelwood, as well as fibres for the textiles waste management and LULUCF). These materials for
Before energy carriers such as oil, gas, coal and At the point of final consumption At the point of final consumption
f u e l w o o d u n d e r g o
understanding
t r a n s f o r m a t
of
i o n
the( P
upstream
r o c e s s ) i n
drivers
t o
of those emissions.
( P r o v i d e ) t h e e m i s s
industry.
i o n s r e l a
The
t e d
extraction,
t o
basic processing and use
(Provide) the emissions related to
industry and construction then enter manufacturing
Key points in the value-chain (from Process to Provide)
In doing so, the necessity for integrated policies that e n e r g y b e c o m e 3 0of % both
a n d ores and minerals (together
e n e r g y with b e cwaste and industrial processes in the form of plastic, rubber,
where emissions embodied in energy carriers andr e fi n e d m a t e r i a l s , a n d e n e r g y a n d h e a t , t h e y r e p r e s e n t ome 30% and
materials shift and eventually switch 7 0 % o f e m i s s i o n s address
w h i l e , embodied
a t t h i s s t aemissions
g e , m a t e rbecomes
i a l s a r e clear. 24 25
m a t e r i a l s 7 0 % . handling) have the smallest emissions
m a t e r i a l s contribution,
7 0 % . in iron, cement and wood products.
only responsible for 30%.
Societal
Resources Take Process Produce Provide End-of-use
Needs
Passenger transport MOBILITY
Petroleum Tr a n s p o r t f u e l
Energy use in transport Tr a n s p o r t f u e l s
production
FOSSIL FUELS 17.1 Gt
To t a l
emissions 38.4 Gt Freight transport
embodied in Ve h i c l e s
each resource HOUSING
group
59.1 Gt Natural gas 13.5 Gt
Extraction Energy use in Energy use in
residential residential
MINERALS Energy use in buildings
Residential
buildings
1.6 Gt C O M M U N I C AT I O N
3.5 Gt
Energy carriers in
non-residential Energy carriers in CO2 4 2 . 6 G t
non-residential
Coal
Cement
ORES HEALTHCARE
Material use in
residential
1.2 Gt Energy use in industry
3.0 Gt
Iron, steel & Non-residential
and food Construction materials buildings
non-ferrous metals
production Construction materials
Sand & clay
Material use in
Mineral mining Stone Chemicals, plastics & non-residential
rubber SERVICES
Ores mining Metal ores
Material use in buildings
Electronics
6.4 Gt
BIOMASS Wo o d Material use in buildings Wo o d p r o d u c t s
Forestry Other products Other products
16.0 Gt Metal ores M a n u fa c t u r i n g
Machinery & equipment
Animals Public & private Public & private
Other products CONSUMABLES
Other materials ser vices ser vices
CH4 1 1 . 2 G t
Farming
Material use in
5.6 Gt
industry and food
Crops Food products
Food products
Food products
WA S T E
Land use &
land use change NUTRITION
1.9 Gt Land use & Land use & Land use &
N2O 3 . 5 G t
land use change land use change land use change
10.0 Gt
Wa s t e Wa s t e m a n a g e m e n t Wa s t e m a n a g e m e n t Wa s t e m a n a g e m e n t F-GASES 1 . 8 G t
Figure One X-ray of global greenhouse gas emissions behind
meeting key societal needs and want s in billion tonnes (Gt).
20 Th e Ci r c ul a r i t y G a p R e p o r t 2 02 1 21Added to these materials is process heat and well as the material needs for their functioning. RESOURCES & EMISSIONS T H E G L O B A L E CO N O M Y S OC I E TA L N E E D S
electricity, as well as energy carriers such as oil Communication is responsible for 3.5 billion tonnes
derivatives, gas and coal. of emissions. These largely fuel communication
50.8 Gt 38.8 Gt
infrastructure as well data storage and communication MINERALS HOUSING
1.6 Gt 13.5 Gt
They are then transformed (Produce) into products devices. The broad group of Consumables accounts
such as electronics, capital equipment, construction for 5.6 billion tonnes of emissions for the production THE GLOBAL 5.6 Gt
materials and food. At this point, the balance between E CO N O M Y
of clothing, personal health products and consumer C O M M U N I C AT I O N
10.1 Gt 3.5 Gt
emissions related to energy versus materials has electronics. With the smallest footprint of all the ORES
shifted to be almost fifty-fifty. Materials together societal needs and wants, Healthcare’s footprint 1.2 Gt This figure shows the material throughput 8.7 Gt
(Mass) and GHG emissions (Carbon) MOBILITY
represent 51% of all emissions, while the energy of 3 billion tonnes is mostly related to hospital associated with the four resources (minerals, 17.1 Gt
used to heat and cool buildings, light our homes buildings, healthcare equipment such as MRI scanners ores, fossil fuels and biomass) on the left and
on the right the Mass-Carbon profiles for the
and workspaces, as well as the energy that is used and the production of medical disposables and FOSSIL
15.1 Gt
seven societal needs.
9.3 Gt
HEALTHCARE
for personal and freight transport, represents the pharmaceuticals.
FUELS
38.4 Gt 3 Gt
It assesses the global economy through two
remaining 49%. However, ultimately—at the point of lenses that are critical to circularity:
final consumption (Provide)—both freight transport D E V I S I N G A T R E AT M E N T P L A N T H R O U G H emissions (Carbon) and materials (Mass). 10.0 Gt
SERVICES
Applying Mass-Carbon thinking, it will assess
and the lighting, heating and cooling of non-residential A MASS-CARBON LENS 24.6 Gt 6.4 Gt
both the carbon emissions footprint, as well
buildings also serve material purposes: the emissions BIOMASS as the mass factors, behind meeting key
16 Gt
related to energy become 30% and materials, 70%. We now want to complement the insights the societal needs, such as Housing, Mobility and 6.9 Gt
Nutrition. This analysis can, therefore, help to CONSUMABLES
Now, a huge proportion of the emissions that were at emissions x-ray has given us with the reality of material 5.6 Gt
show which societal needs consume what
first associated with energy carriers have gradually use in our global economy. Material transformation resources and cause GHG emissions.
become embodied into finished goods and services offers the prospect of adding value at each step WA S T E 1.9 Gt
21.3 Gt
NUTRITION
which, in turn, satisfy the seven societal needs. of the supply chain—from simple raw materials, 10 Gt
through to complex products. As part of the same
process, however, emissions and waste are generated.
EMISSIONS-INTENSIVE HOUSING,
Therefore, when considering our economic activity
MOBILIT Y AND NUTRITION F i g u r e Tw o T h e g l o b a l r e s o u r c e a n d e m i s s i o n s f o o t p r i n t b e h i n d
more holistically, we need to adopt different lenses— E M I S S I O N S CO 2 e q
meeting key societal needs, side by side. Units in billion
Providing Mobility, Housing and Nutrition to the here Mass-Carbon—to scrutinise the combined inputs tonnes (Gt).
world accounts for almost 70% of global emissions. and outputs from these steps and understand fully
Mobility leads the way with an emissions footprint how these activities contribute to meeting our societal
of 17.1 billion tonnes. This is primarily the result needs. In combining the material and emissions
of fossil fuel combustion across passenger and footprints in Figure Two, we can see the multiple
freight transport. The production of automobiles, avenues that hold the most impact from a
trucks, trains and aeroplanes is relatively limited in Mass-Carbon perspective. The energy-density properties of fossil carriers with processes that extend the lifespan of the material,
emissions contributions. Responsible for the second- make them very lucrative as a commodity, but it is such as repair, we would reduce the need for excess
largest footprint is Housing, at 13.5 billion tonnes of By revealing how both materials and emissions flow impossible to bypass any steps in the value-chain virgin material extraction and emit fewer GHGs. We
emissions. Housing’s hefty footprint comes down through the economy, Figure Two shows us that for due to the very nature of their use. This is why we see put this to the test in our roadmap to a well below
to the vast extraction, transport and construction some societal needs, the focus areas where we can fossil fuels as having no place in the circular economy. 2-degree world, which is presented in Chapter Four.
activities it entails, as well as the energy used to light, close the Emissions Gap overlap with the focus areas to Biomass is responsible for around 25% of materials
heat and cool dwellings. Third in line is the provision of close the Circularity Gap. Yet for other societal needs, and 27% of emissions, yet as a resource it represents
food for Nutrition with 10 billion tonnes of emissions. there is no overlap, and we must adapt our approach an interesting case: biomass captures carbon from the
LULUCF associated with the production of food, but accordingly. From a material (Mass) perspective, atmosphere during its growth, but again is often used
also fibres and clearing for expansion of urban centres, Minerals represent by far the largest share (51%), as an energy carrier, thereby eventually producing
is responsible for about 4 billion tonnes of emissions while they only make a minor contribution from an emissions. In applying circular strategies, we would
(high uncertainty). GHG emissions (Carbon) perspective (2.8%). That said, promote the increase of carbon storage in biomass
there are still ‘hot spots’ along the mineral value-chain (through, for example, the use of wooden construction
The remaining 30% of emissions flow into satisfying that are exceptionally emissions-intensive, which we materials), while bypassing the emissions-producing *Land use, land - use change and fores tr y (LULUCF ) is def ined
Communications, Services, Consumables and should aim to bypass by applying circular strategies steps in the value-chain.
by the United Nations Climate Change Secretariat as a
Healthcare. At 6.4 billion tonnes of emissions, ’greenhouse gas inventor y sec tor that covers emissions and
(as in the case of cement clinker production). The
removals of greenhouse gases resulting from direc t human-
Services is the biggest of the smaller needs. The opposite is true for fossil fuels: in terms of materials In using circular strategies, we can reconfigure these induced land use such as set tlement s and commercial uses ,
footprint for service provision includes the buildings they represent a modest share of 15%, yet they are supply chains to ‘bypass’ the emissions hot-spots. l a n d - u s e c h a n g e , a n d f o r e s t r y a c t i v i t i e s .’ W e i n c l u d e L U L U C F
and energy required for educational institutions, responsible for 65% of emissions. These resources are By swapping out emission-intensive processes such as because it is included in the Emissions Gap and because
museums and other public-service properties, as almost entirely used for combustion purposes. smelting and remanufacturing for metals, for example,
they are impor tant in the estimation of sustainably sourced
(c a r b o n - n e u t r a l ) — a n d t h u s c i r c u l a r— b i o m a s s .
22 Th e Ci r c ul a r i t y G a p R e p o r t 2 02 1 23Measurements are critical to understanding Provisioning systems are the essential link between
the world around us. Consistent measurement biophysical resource use and social outcomes.
frameworks should inform governments and For example, different forms of transportation
businesses alike to engage in uniform goal-setting infrastructure (railways versus motorways or
and guide future action toward circularity and car-sharing versus car ownership) can generate
climate mitigation in the most impactful way. similar social outcomes, but at very different levels
In last year’s Circularity Gap Report , we saw the of material use.
global Circularity Metric go from 9.1% to 8.6%,
demonstrating the power of having a single, In capturing one overarching measurement of
3
overarching metric to track progress and change. circularity, we need to reduce this complexity
And now in this fourth edition of the Report, somewhat. So, we take the metabolism of the globe—
we present robust, quantified evidence to show how materials flow through the economy and are in
how the circular economy and climate mitigation long-term use—as the starting point. This approach
agenda are mutually reinforcing by using both builds on and is inspired by the work of Haas et al. 31
the Circularity Gap and the Emissions Gap to (2015). Taking the x-ray of the globe’s material use,
illustrate our case. What the findings tell us is that we consider six fundamental dynamics of what the
governments wanting to satisfy our societal needs circular economy transition aims to establish and how
and wants within healthy planetary boundaries it can do so. This translates into two objectives and
need a roadmap and fresh strategies. four strategies, which we base on the work of
Bocken et al. (2016):32
WHY THE CIRCUL AR TRANSITIONS
NEEDS METRICS • Objective one: Resource extraction from the
METRIC S
lithosphere is minimised and biomass production
We need metrics and measurements to search for and and extraction is regenerative.
identify solutions and to help monitor and report our
• Objective two: The dispersion and loss of
progress in alleviating problems. Our Circularity Metric
materials is minimised, meaning all technical
measures the circularity of the globe, and in providing
materials have high recovery opportunities, ideally
an initial assessment of how wide the Circularity Gap
without degradation and quality loss; emissions to
is, the analysis provides an insight into where circular
air and dispersion to water or land is prevented;
opportunities and priorities lie in material flows. By
BEHIND
and biomass is optimally cascaded.
measuring circularity in this way, businesses and
governments can track their circular performance over
time and put trends into context, as well as engage in The four strategies we can use to achieve these
THE uniform goal-setting and guide future action in the
most impactful way.
objectives are:
• Narrow flows—Use less: The amount of material
GAPS
THE CIRCUL ARIT Y METRIC AND GAP used or greenhouse gases (GHGs) emitted in the
making of a product or in the delivery of a service
The circular economy is a big picture and holistic idea. are decreased. This is through circular design
Ultimately, it is a means to an end—a socially just or increasing the usage rates of materials and
and ecologically safe space. Exactly how the circular products. In practice: Sharing and rental models,
transition can deliver more beneficial social and material lightweighting, multifunctional products
environmental outcomes is not a question with just or buildings, energy efficiency, digitisation.
one right answer however. There is no simple straight-
• Slow flows—Use longer: Resource use is optimised
Global circularit y & line solution and the feedback loops in the system
as the functional lifetime of goods is extended.
run in all directions. 28 In particular, three connected
the Emis sions Gap Durable design, materials and service loops that
spheres need to be taken into account: how resources
extend life, such as repair and remanufacturing,
are put to work to deliver social outcomes via
both contribute to slowing rates of extraction
provisioning systems. Provisioning systems comprise
and use. In practice: Durable material use,
of physical systems such as road infrastructure,
modular design, design for disassembly, repair,
technologies, and their efficiencies29 and social
remanufacturing, refurbishing, renovation,
systems, which include government institutions,
remodelling.
businesses, communities and markets. 30
Th e Ci r c ul a r i t y G a p R e p o r t 2 02 1 25• Regenerate flows—Make clean: Fossil fuels, THE EMISSIONS GAP IN THE CIRCUL ARIT Y
pollutants and toxic materials are replaced with GAP REPORT
regenerative sources, thereby increasing and
It was in 2017 that we at Circle Economy took
maintaining value in natural ecosystems. In
inspiration from the Emissions Gap Report and felt an
practice: Regenerative material use, renewable
equivalent for the use of materials was needed on a
energy, regenerative agriculture.
global stage. Then the Circularity Gap Report was born.
• Cycle flows—Use again: The reuse of materials
The Emissions Gap that is referred to in this Circularity
or products at end-of-life is optimised, facilitating
Gap Report is defined in reference to a 1.75-degree
a circular flow of resources. This is enhanced with W HERE D O E S O U R
trajectory to be achieved by 2032, thereby meeting
improved collection and reprocessing of materials
the goal of staying well below 2-degree of warming as
DATA CO ME F RO M?
and optimal cascading by creating value in each
specified in the Paris Agreement. Where the NDCs and Our study draws upon an increasingly broad research stream
stage of reuse. In practice: Design for recyclability
current policies end, this Emissions Gap begins. that makes use of Environmentally-extended Multi-regional
(both technical and biological), design for
Input-Output Analysis (EE-MRIOA) to model the potential
disassembly, recycling, waste-to-energy.
environmental impacts and benefits of the circular economy
T H E E M I S S I O N S G A P 2020
from a macroeconomic perspective. Relying on the EE-MRIO
If we effectively deploy strategies focused on slowing, According to the latest Emissions Gap Report, based database Exiobase v3.7, our methodology and underlying
narrowing, cycling and regenerating the flow of on a scenario of current Unconditional NDCs, model is based on the same equation set of two other
materials, we will ultimately require fewer materials global temperatures are estimated to rise by about prominent studies—Wood et al. (2017) 37 and Donati et al.
to provide for similar needs. Because of this, fewer 3.2-degrees above pre-industrial levels by 2100. 34 (2020) 38 —with the exclusion of rebound effects.
materials will be used by the economy, they will have Carbon dioxide emissions are predicted to fall by up to
a longer lifespan and can be reused more effectively 7% (between 2% and 12%) compared to 2019 emission The key features of our assessment are its life-cycle
and with less harm caused to the environment. For our levels as a result of the pandemic slowdown. However, and consumption-based perspective as well as the use
Circularity Metric to capture this crucial process, we atmospheric concentrations of GHGs continue to rise. of modelling blueprints that revolve around changes in
measure the share of cycled materials as part of the This is because the NDCs are ‘woefully inadequate’, consumption patterns (demand), production recipes (supply)
total material inputs into a global economy. As such, it states the report. UNEP also looks at ways to bridge and adoption rates in the form of either a partial increase,
illustrates the current progress towards achieving the the Gap—with the latest report summarising the scale reduction or substitution, of products or services. The scope
circular economy’s ultimate goal of designing out waste of emerging net-zero emissions pledges made by and data for our scenarios and interventions (displayed in
through the four listed strategies. countries and exploring the potential of the lifestyle, Chapter Four as the roadmap) build upon the work of Ivanova
aviation and shipping sectors. et al. (2020) 39, Vita et al. (2019) 40, Moran et al. (2018) 41 and
Hertwich et al. (2018) 42, among others.
THE EMISSIONS GAP
It also states that if we were to continue on a business-
For a decade, the United Nations Environment Our input-output assessment measures the impact of
as-usual pathway, emissions could reach 65 billion
Programme (UNEP) has highlighted the Emissions chosen interventions and scenarios on the material and
tonnes CO2 equivalents by 203035 (see Figure Three
Gap every year. The Emissions Gap assesses the level carbon footprints of the globe, which we divided into three
on page 38 for more information). In this scenario, we
of GHGs emitted if we continue to plunder along a country profiles, namely: Grow, Build and Shift. A separate
would be faced with dangerous climate breakdown.
business-as-usual scenario that includes current modelling is carried out for quantifying flows of waste and
The climate policies already in place can deliver a
Nationally Determined Contributions (NDCs), compared secondary materials based on a ‘light update’ of the hybrid
reduction of 11 to 13 billion tonnes CO2 equivalents.
to the level we must emit to stay on track to keep Exiobase v3.3.17 IOTs. Bringing this information together,
Of the remaining emissions, previous Circle Economy
rising global temperature to 2-degrees, and ideally the Circularity Gap measures the share of virgin materials
research estimated that circular economy strategies
1.5-degrees. In the 2020 edition of the Report, launched in the total material consumption, while the Emissions Gap
could further close the Emissions Gap by about half. 36
in December 2020, seven scenarios are outlined gauges how much of the global GHG footprint still needs
This report finds it delivers a huge reduction of 28.8
specifying the Gap under different policy settings to be reduced in order to stay within the 1.5 and 2-degrees
billion tonnes and closes the Gap by more than 70%.
(2010 policies, current policies, Unconditional NDCs, emissions pathways set by the IPCC.
Conditional NDCs) and under different goals (2-degree
goal, a 1.8-degree goal and a 1.5-degree goal). 33 To read more about our methodologies, visit our
website circularity-gap.world.
P h o t o b y M a t t h e w D eV r i e s
26 Th e Ci r c ul a r i t y G a p R e p o r t 2 02 1 27You can also read