Reducing European Dependence on Russian Gas
←
→
Page content transcription
If your browser does not render page correctly, please read the page content below
October 2014

              Reducing European
      Dependence on Russian Gas:
               distinguishing natural gas security from geopolitics

                                              Ralf Dickel, Elham Hassanzadeh,
                                             James Henderson, Anouk Honoré,
                                                   Laura El-Katiri, Simon Pirani,
                                             Howard Rogers, Jonathan Stern &
                                                                 Katja Yafimava

OIES PAPER: NG 92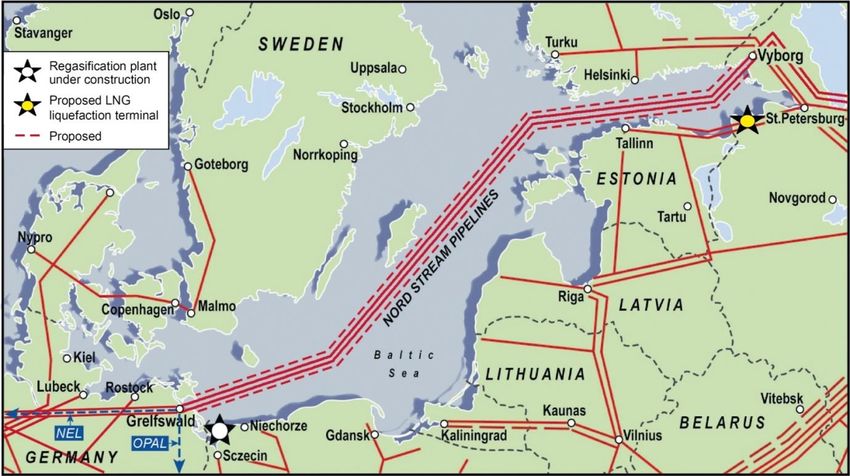
The contents of this paper are the authors’ sole responsibility. They do not
         necessarily represent the views of the Oxford Institute for Energy Studies or any of
                                            its members.

                                          Copyright © 2014
                               Oxford Institute for Energy Studies
                                  (Registered Charity, No. 286084)

This publication may be reproduced in part for educational or non-profit purposes without special
permission from the copyright holder, provided acknowledgment of the source is made. No use of this
publication may be made for resale or for any other commercial purpose whatsoever without prior
permission in writing from the Oxford Institute for Energy Studies.

                                      ISBN 978-1-78467-014-6

October 2014: Reducing European Dependence on Russian Gas                                         ii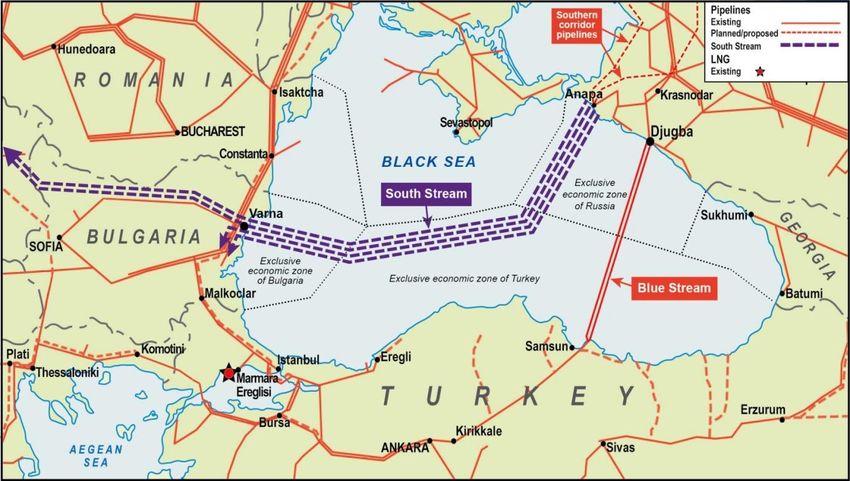
Preface
The aim of this paper is to fill a gap in the discourse on Russian and European gas issues, which has
been opened up (again) in the wake of the 2014 Ukraine crisis. It was galvanized by the need to
correct simplistic judgements by political and media commentators on the possibilities of a rapid
reduction of Russian gas exports to Europe.
This paper is, in every sense, a ‘team effort’ by staff of the OIES natural gas research programme to
summarize much longer and more detailed research work which we have already published, or will
shortly publish. The principal authors of the individual sections are:
European indigenous gas supply – Anouk Honoré
North Africa and East Mediterranean gas – Laura El-Katiri
Caspian and Central Asia – Simon Pirani
Iran and Iraq – Elham Hassanzadeh
The role of LNG – Howard Rogers
Infrastructure issues – Katja Yafimava
Alternative sources of energy supply and potential for demand reduction –
Ralf Dickel and Anouk Honoré
Reducing Ukrainian dependence on Russian gas – Simon Pirani
The Russian response – James Henderson and Katja Yafimava
The geopolitical arguments – Simon Pirani and Jonathan Stern
I am the principal author of other sections with overall editorial responsibility for the text.
Many thanks to all the contributors for meeting challenging deadlines, to Catherine Gaunt for editorial
support, and Kate Teasdale for making everything else happen.
Jonathan Stern
Oxford, October 2014.
October 2014: Reducing European Dependence on Russian Gas iii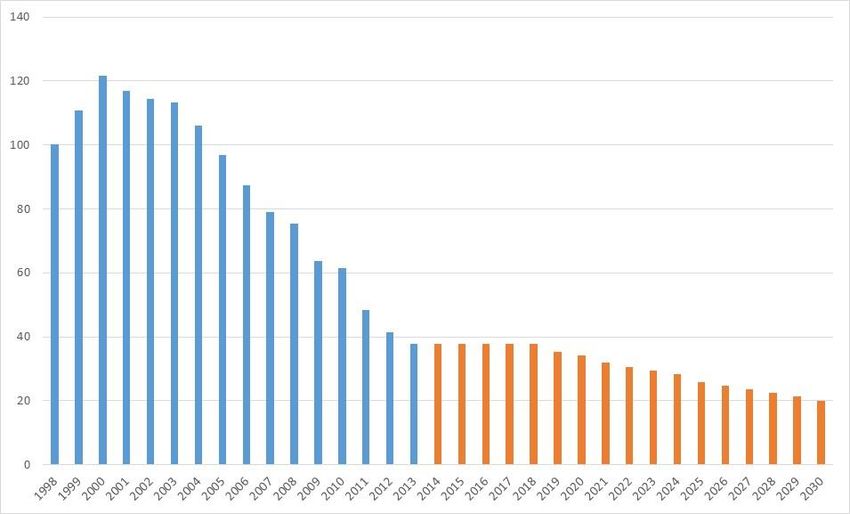
Contents
Preface .................................................................................................................................................. iii
Contents ................................................................................................................................................ iv
Figures ................................................................................................................................................... v
Tables and Maps ................................................................................................................................... v
Executive Summary .............................................................................................................................. 1
Introduction ........................................................................................................................................... 2
1. European Dependence on Russian Gas ......................................................................................... 3
   1.1 Russian gas exports to Europe: volumes and contracts ............................................................... 3
   1.2 Statistical measures of dependence and vulnerability .................................................................. 6
   1.3 European gas demand projections to 2030 .................................................................................. 9
Appendix 1: Conventional natural gas reserves and reserve to production ratios for current
and potential suppliers to Europe, end 2013 ................................................................................... 11
2. Alternative Sources of Gas Supply to Europe: volumes, time frames, and infrastructure
requirements ....................................................................................................................................... 12
   2.1 Supply options ............................................................................................................................. 12
     2.1.1 European indigenous gas supply – conventional and unconventional ................................. 12
     2.1.2 North Africa .......................................................................................................................... 17
     2.1.3 East Mediterranean gas ........................................................................................................ 21
     2.1.4 Caspian and Central Asia ..................................................................................................... 24
     2.1.5 Iran and Iraq.......................................................................................................................... 27
     2.1.6 The role of LNG .................................................................................................................... 29
   2.2 Bringing non-Russian gas to Europe: Infrastructure Issues ....................................................... 34
     2.2.1 EU infrastructure and regulatory initiatives ........................................................................... 35
     2.2.2 The LNG situation ................................................................................................................. 37
     2.2.3 Pipeline gas: the Southern Corridor...................................................................................... 40
     2.2.4 Conclusions: likely infrastructure developments 2015–2030 ............................................... 40
3. Fuel Substitution, Conservation, and Efficiency ......................................................................... 42
   3.1 Introduction ................................................................................................................................. 42
   3.2 Substitution of oil products and coal ........................................................................................... 42
   3.3 Low carbon options ..................................................................................................................... 45
     3.3.1 Biogas ................................................................................................................................... 45
     3.3.2 Renewables, heat, and nuclear power ................................................................................. 46
   3.4 Energy saving and efficiency ...................................................................................................... 47
   3.5 Conclusion .................................................................................................................................. 48
4. Reducing Ukrainian Dependence on Russian Gas ..................................................................... 50
   4.1 Introduction ................................................................................................................................. 50
   4.2 The current crisis ......................................................................................................................... 50
   4.3 Reverse-flow options................................................................................................................... 52
   4.4 Moving the delivery points of European contracts ...................................................................... 52
   4.5 Impacts on Ukrainian and European gas markets ...................................................................... 52
   4.6 Post-2020: possible integration of Ukraine into the European market ....................................... 53
   4.7 Conclusions ................................................................................................................................. 55
5. The Russian Response................................................................................................................... 56
   5.1 Introduction ................................................................................................................................. 56
   5.2 A shift towards Asia..................................................................................................................... 57

October 2014: Reducing European Dependence on Russian Gas                                                                                                  iv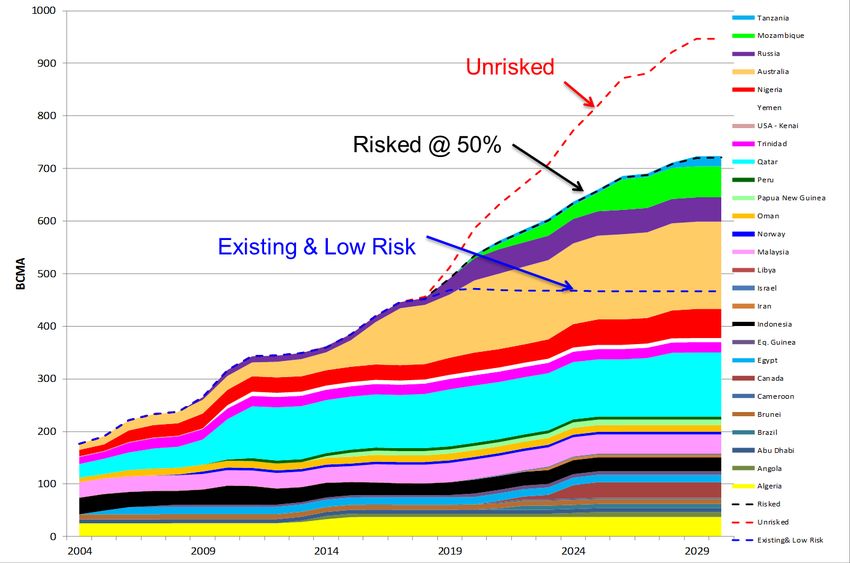
5.3 A move into the LNG market ....................................................................................................... 59
   5.4 Removal of Gazprom’s export monopoly – less likely? .............................................................. 60
   5.5 Price competition with alternative pipeline gas and LNG supplies ............................................. 61
   5.6 Competitiveness of Russian gas in relation to LNG supplies ..................................................... 61
   5.7 Existing export infrastructure and decisions on new pipelines ................................................... 63
6. The geopolitical arguments ........................................................................................................... 68
7. Summary and Conclusions ............................................................................................................ 71
   7.1 Contractual obligations, dependence and demand .................................................................... 71
   7.2 European gas production ............................................................................................................ 71
   7.3 Alternative gas imports and infrastructure .................................................................................. 72
   7.4 Fuel substitution, conservation, and efficiency ........................................................................... 73
   7.5 Reducing Ukrainian dependence on Russian gas ...................................................................... 73
   7.6 The Russian response ................................................................................................................ 74
   7.7 The geopolitical arguments ......................................................................................................... 74
Bibliography ........................................................................................................................................ 76

Figures
Figure 1: Russian long-term export contracts with OECD European countries to 2030: annual contract
quantity and take-or-pay levels* .............................................................................................................. 5
Figure 2: Share of Russian gas in European demand 1990–2013* (bcm and %) .................................. 7
Figure 3: Sales Gas from Norwegian fields 1985–2025 (bcm) ............................................................. 12
Figure 4: Historical and estimated future production of natural gas in the Netherlands 2001–2038
(bcm) ..................................................................................................................................................... 13
Figure 5: Historical and estimated UK net natural gas production 1998–2030 (bcm) .......................... 14
Figure 6: Gross North African gas exports, 2004-2013 (bcm) .............................................................. 18
Figure 7: Global LNG Supply outside the USA 2004–2030 .................................................................. 30
Figure 8: Regional Gas Prices 2007–August 2014 ............................................................................... 31
Figure 9: Scenarios of Chinese gas demand and US Gas production ................................................. 32
Figure 10: Oil and gas contributions to Russian budget revenues (billion rubles)................................ 56
Figure 11: Split of Gazprom revenues in 2013 ..................................................................................... 57
Figure 12: Comparison of Gazprom contract prices and NBP spot price ............................................. 62
Figure 13: Cost and price of Russian gas versus potential US LNG imports to Europe ...................... 62

Tables and Maps
Table 1: Russian Gas Exports to European Countries 2003–2013 (bcm*) ............................................ 3
Table 2: EU Member State Country-Specific Concentration Index* for Natural Gas supplies from
outside the European Economic Area 2000–2012 ................................................................................. 8
Table 3: Non-EU Member State Imports of Russia Gas and Estimated Supplier Concentration Index,
2013* ....................................................................................................................................................... 9
Table 4: Gas Demand Projections for Countries Highly Dependent on Russian Gas 2015–2030
(bcm*) .................................................................................................................................................... 10
Table 5: Indigenous conventional gas production in European markets 2013–2030 (bcm) ................. 14
Table 6: North African gas balances, 2013 ........................................................................................... 17
Table 7: Projected North African Gas Exports 2015–2030 (bcm)......................................................... 21
Table 8: Likely Exports of East Mediterranean Gas 2015–2030 (bcm) ................................................ 23

October 2014: Reducing European Dependence on Russian Gas                                                                                                   v
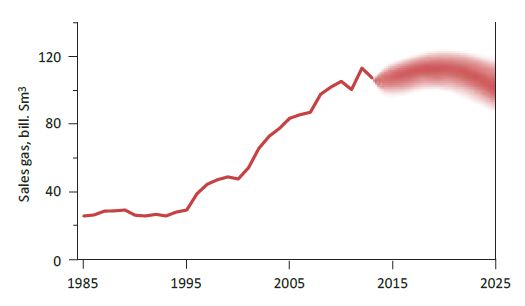
Table 9: Likely Exports of Caspian and Central Asian Gas 2015–2030 (bcm)..................................... 27
Table 10: European LNG re-gasification capacity relevant to countries dependent on Russian gas:
existing and planned ............................................................................................................................. 38
Table 11: Oil-fired generating capacity and utilization in 2012 and 2013 ............................................. 44

Map 1: The Nord Stream Pipelines ....................................................................................................... 64
Map 2: The South Stream Pipelines ..................................................................................................... 64

October 2014: Reducing European Dependence on Russian Gas                                                                                         vi
Executive Summary
The main finding of this paper is that there is limited scope for significantly reducing overall European
dependence on Russian gas before the mid-2020s. However, countries in the Baltic region and south-
eastern Europe which are highly dependent on Russian gas, and hence extremely vulnerable to
interruptions, could substantially reduce and even eliminate imports of Russian gas by the early
2020s, by a combination of LNG supplies and pipeline gas from Azerbaijan. Similar measures could
reduce (but not eliminate) the dependence of central Europe and Turkey on Russian gas. In the
majority of countries, there is limited scope to reduce gas with oil products, and to the extent that it is
replaced by coal in power generation carbon emissions will increase significantly.
Up to the mid-2020s, European companies are contractually obliged to import at least 115 bcm/year
of Russian gas (approximately 75 per cent of the 2013 import level), a figure which reduces to around
65 bcm by 2030. Even if long-term contracts disappear, our modelling shows a requirement of at least
100 bcm/year of Russian gas up to 2030, and in some scenarios up to twice that volume. The main
additional source of non-Russian gas for Europe up to 2030 will be LNG; pipeline gas imports from
domestic and other imported sources are not envisaged to increase substantially and may decline.
Russian gas deliveries to Europe will be highly competitive with all other pipeline gas and LNG
(including US LNG) supplies throughout the period to 2030, and Gazprom’s market power to impact
European hub prices may be considerable.
Countries with strong geopolitical fears related to Russian gas dependence will need to either
terminate, or not renew on expiry, their long-term contracts with Gazprom. This will result in
substantial additional infrastructure costs for LNG import terminals and pipeline connections, or
investments in alternative energy sources, energy conservation, and efficiency measures.
Whatever the political relationship between Russia, the European Union, and individual European
countries, a continued natural gas relationship will be necessary and needs to be carefully managed.
The most immediate problems are: a resolution of the Ukrainian transit situation, and a successful
conclusion of the EU’s regulatory treatment of the South Stream pipeline. Once the immediate crisis
has passed, both sides need to discuss the future role of gas in EU energy balances, together with its
potential contribution to the EU’s ambitious carbon reduction targets.

                                                                                                         1
  October 2014: Reducing European Dependence on Russian Gas
Introduction
The Russian reaction to political events in Ukraine in 2014, and specifically its annexation of Crimea,
military involvement in the separatist movements in eastern Ukraine, and the Malaysian airlines MH17
disaster, has generated a great deal of commentary about European dependence on Russian energy
in general and natural gas in particular. The price dispute which led to termination of Russian supplies
to Ukraine in June 2014, and the possibility of interruptions of gas supplies to Europe, led to renewed
calls for diversification of European gas supplies and reduction of Russian imports. These discussions
have repeated a great deal of the geopolitical and security discourse around European imports of
Russian gas which has been heard periodically over the past 40 years during both the Soviet and
post-Soviet periods, but particularly during the Russia–Ukraine gas crises of January 2009 and
January 2006. The OIES natural gas research programme has published a number of books and
papers on these crises, Russian and CIS gas issues, and European gas supply and demand issues. 1
This paper has two major aims: first to examine the realistic options for reducing European
dependence on Russian gas in three time frames – 2015, 2020, and 2030. In so doing it examines the
alternative gas and non-gas options for reducing dependence on Russian gas; it also provides some
idea of the possible costs of alternatives to Russian gas, who will pay these costs, and the likely
competitiveness of Russian versus alternative gas supplies. The second aim is to distinguish natural
gas security from geopolitical arguments, given the concern that freedom of action in EU and national
foreign and security policies will be constrained for fear that Russia will retaliate by cutting off gas
supplies.
It is also important to say what this paper is not addressing: it is not dealing with general security
issues surrounding European gas, and it is not considering the impact of potential interruptions of
Russian gas deliveries (either due to Ukrainian or Russian actions) on different European countries.
We and others have covered such subjects in previous work.2 What we seek to do in this paper is to
examine the potential for reducing European dependence on Russian gas and contrast this with
assertions by some commentators that this can be quickly and easily achieved.
This paper is structured in seven chapters: following this introduction Chapter 1 looks at volumes,
contractual obligations, definitions of dependence, and projections of gas demand for countries highly
dependent on Russian gas. Chapter 2 reviews non-Russian gas supply sources for Europe in terms
of likely volumes and necessary infrastructure. Chapter 3 examines non-gas alternatives to Russian
gas supplies. Chapter 4 looks at how Ukrainian dependence on Russian gas might be reduced in the
context of the current crisis, and the impact of this on European imports of Russian gas. Chapter 5
looks at likely Russian responses to European actions. Chapter 6 examines the geopolitical
arguments in favour of reducing Russian gas supplies, and Chapter 7 summarizes and draws some
conclusions. In this paper, we have aimed at brevity. Rather than lengthy textual and data exposition,
we have summarized the research that we and others have already published on these issues. We
encourage those seeking further explanation of our data and conclusions to consult our more detailed
research.
1
See (among others and most recently): Henderson and Pirani (2014); Honoré (2014); Yafimava (2011); Pirani (ed.) 2009;
Pirani et al. (2009), Stern (2006).
2
Most recently Pirani et al. (2014).
2
October 2014: Reducing European Dependence on Russian Gas1. European Dependence on Russian Gas
1.1 Russian gas exports to Europe: volumes and contracts
Russian gas exports to Europe exceeded 100 bcm in virtually every year in the 1990s; rose to more
than 160 bcm/year in the mid-2000s and fell below that level only in the late 2000s before recovering
to pre-recession levels in 2013 (Table 1). 3
Table 1: Russian Gas Exports to European Countries 2003–2013 (bcm*)
2003 2004 2005 2006 2007 2008 2009 2010 2011 2012 2013
WESTERN
Austria 6 6 6.8 6.6 5.4 5.8 5.4 5.6 5.4 5.4 5.2
Belgium 0 0 2 3.2 4.3 3.4 0.5 0.5 0 0 0
Denmark 0 0 0 0 0 0 0 0 0 0.3 0.3
Estonia 0.8 0.9 1.3 0.7 0.9 0.6 0.8 0.4 0.7 0.6 0.7
Finland 5.1 5 4.5 4.9 4.7 4.8 4.4 4.8 4.2 3.7 3.5
France 11.2 14 13.2 10 10.1 10.4 8.3 8.9 8.5 8.2 8.6
Germany 35 40.9 36 34.4 34.5 37.9 33.5 35.3 34.1 34 41
Greece 1.9 2.2 2.4 2.7 3.1 2.8 2.1 2.1 2.9 2.5 2.6
Ireland 0 0 0 0 0 0 0 0 0 0.3 0.5
Italy 19.8 21.6 22 22.1 22 22.4 19.1 13.1 17.1 15.1 25.3
Latvia 2.4 1.2 1.4 1.4 1 0.7 1.1 0.7 1.2 1.1 1.1
Lithuania 2.9 2.9 2.8 2.8 3.4 2.8 2.5 2.8 3.2 3.1 2.4
Netherlands 2.3 2.7 4.1 4.7 5.5 5.3 4.3 4.3 4.5 2.9 2.9
Switzerland 0.3 0.3 0.4 0.4 0.4 0.3 0.3 0.3 0.3 0.3 0.4
Turkey 12.9 14.5 18 19.9 23.4 23.8 20 18 26 27 26.7
United Kingdom 0 0 3.8 8.7 15.2 7.7 11.9 10.7 12.9 11.7 16.6
Sub-Total 100.6 112.2 118.7 122.5 133.9 128.7 114.2 107.5 121 116.2 137.8
EASTERN
Bosnia and Herzegovina 0.2 0.3 0.4 0.4 0.3 0.3 0.2 0.2 0.3 0.3 0.2
Bulgaria 2.9 3 2.6 2.7 2.8 2.9 2.2 2.3 2.5 2.5 2.9
Croatia 1.2 1.1 1.2 1.1 1.1 1.2 1.1 1.1 0 0 0.2
Czech Republic 7.4 6.8 7.4 7.4 7.2 7.9 7 9 8.2 8.3 7.9
Hungary 10.4 9.3 9 8.8 7.5 8.9 7.6 6.9 6.3 5.3 6
Macedonia 0.1 0.1 0.1 0.1 0.1 0.1 0.1 0.1 0.1 0.1 0.1
Poland 7.4 6.3 7 7.7 7 7.9 9 11.8 10.3 13.1 12.9
Romania 5.1 4.1 5 5.5 4.5 4.2 2.5 2.6 3.2 2.5 1.4
Serbia 1.9 2.3 2 2.1 2.1 2.2 1.7 2.1 2.1 1.9 2
Slovakia 7.3 7.8 7.5 7 6.2 6.2 5.4 5.8 5.9 4.3 5.5
Slovenia 0.7 0.7 0.7 0.7 0.6 0.6 0.5 0.5 0.5 0.5 0.5
Other countries 0 0 0 0.4 0.5 0.6 1.2 2.1 1.3 0.8 1.2
Sub-Total 44.6 41.8 42.9 43.9 39.9 43 38.5 44.5 40.7 39.6 40.8
GRAND TOTAL 145.2 154 143.5 166.4 173.8 171.7 152.7 152 161.7 155.8 178.6
Deliveries under long term contracts** 158.8 168.5 142.8 138.6 150.3 139.9 166
*data in Russian cubic metres – to convert to European units reduce by 7.97%. **deliveries under long-term
contracts represent volumes which are believed to be delivered from Russian gas fields to Europe; the higher
totals include gas delivered by Gazprom but sourced from elsewhere.
Sources: Gazprom in Figures: 2005–2009, p.56; 2008–2012, p.63; 2009–2013, p.67; Stern (2005), Table 3.1,
p.110; Long term contract data from GazpromExport.
3
Data in this section refer to all gas sold in Europe by the Gazprom Group in Russian cubic metres (which need to be reduced
by 7.97% to convert to European cubic metres) and includes the Baltic countries in Europe.
3
October 2014: Reducing European Dependence on Russian GasHowever, all of the increase in volumes has been in (to use Cold War terminology) Western Europe,
while Central and East European countries imported less Russian gas in 2013 than they did not only
10 years previously, but also less than in the early 1990s, primarily because of reduced demand,
economic restructuring and much higher prices than during the Soviet era. The vast majority of the
‘west’ European increase stems from two countries: Turkey which doubled its imports over this period,
and the UK, which imported no Russian gas prior to 2005 but had become Gazprom’s fourth largest
market by 2013 – although it is unlikely that any Siberian molecules were physically delivered to the
UK, rather this was most likely gas of non-Russian origin acquired and resold by Gazprom Marketing
and Trading (Gazprom’s UK-based marketing subsidiary).4 Aside from these countries, only Italy and
Poland imported significantly more (in other words, more than 1 bcm) Russian gas in 2013 than they
did a decade earlier, and many imported significantly less (Table 1).
Russia, and specifically Gazprom, is the largest single supplier of gas to European countries. In 2013,
Gazprom exported a record volume of gas to Europe, significantly exceeding deliveries in the 2008–
2012 period (Table 1) and, due to a fall in European demand and deliveries from other indigenous
and external suppliers, representing 34 per cent and 30 per cent respectively of European imports
and demand.5
The vast majority of Russian gas exports to Europe are sold on long-term contracts varying from 10 to
35 years in length. These contracts, which are legally binding and subject to international arbitration,
contain take-or-pay clauses which require buyers to pay for a minimum annual quantity of gas,
irrespective of whether they take that quantity. In the post-2008 period, the take-or-pay level in many
of these contracts was reduced from 85 to 70 per cent.6 Figure 1 illustrates the profile of Russian
long-term contracts with European buyers, showing that at an assumed 70 per cent take-or-pay level,
European buyers are committed to purchasing more than 125 bcm of gas from Gazprom in 2020 and
around 70 bcm in 2030.7 There are significant limitations on the options to reduce the volumes in
these contracts, or to terminate contracts before expiry. 8 Thus far, despite difficult renegotiations and
a large number of arbitration proceedings, no such actions have been reported. Indeed, we are aware
of only two European contracts for Russian gas which have not been extended at expiry, one of which
involved Russian gas being sold to other buyers in the same country. 9
4
This accounts for at least part of the difference between the grand total figures in Table 1 and the long-term contract figures
which represent gas which was delivered to Europe from Russian sources.
5
IEA Natural Gas (2014). Note this data relates to 35 European countries including the Balkans and Turkey, data for EU
member states can be found below (see note 14).
6
All European long-term gas contracts are subject to commercial confidentiality, which means that it is difficult to be categorical
about their terms; for details of the changes since 2008 see Stern (2012, ed.), especially pp. 59–66.
7
These figures may understate the position, particularly up to 2020, because they do not include some countries with long-term
contracts which expire before that date. The figures are in Russian units, the corresponding European units are 115 bcm in
2020 and 65 bcm in 2030.
8
As already noted, annual take-or-pay levels in many contracts have been reduced, but this may have the effect of extending
the life of contracts as buyers are still contractually obliged to take volumes over a longer period.
9
For details of renegotiations and arbitrations see Henderson and Pirani (2014), Chapter 3. The Croatian contract was not
renewed on expiry and that country replaced Russian gas with supplies from Italy (although small deliveries recommenced in
2013); the first Turkish contract with Botas was not renewed but the gas was sold to other buyers, mainly Gazprom affiliates.
4
October 2014: Reducing European Dependence on Russian GasFigure 1: Russian long-term export contracts with OECD European countries to 2030: annual
contract quantity and take-or-pay levels*
250
200
150 ACQ
bcm
Take or Pay 85%
100
Take or Pay 70%
50
0
2005200720092011201320152017201920212023202520272029
*Data in Russian units; not including Baltic and south East European countries (aside from Turkey and Greece)
Source: ERI RAS in Henderson and Pirani (2014), Figure 3.3, p.60.
Long-term contractual commitments are, therefore, an important starting point for any discussion of
reducing – or of making any significant change in – the volumes of Russian gas deliveries to
European countries. In the exchange of letters between Russia’s President Putin and the EU’s
President Barroso in April 2014, the latter reminded the Russian president that: 10
The contractual reliability of the Russian Federation as a supplier of gas is at stake in this matter…I would like
to recall that supply contracts are between European companies and Gazprom. It therefore continues to be
Gazprom’s responsibility to ensure the deliveries of the required volumes as agreed in the supply contracts.
The European Union has repeatedly stated that we expect commercial operators on all sides to continue
respecting their contractual obligations and commitments.
The final sentence provides clear confirmation at the highest EU level that the obligations in Russian
long-term gas contracts with European companies are expected to be fulfilled by both sides,
irrespective of any political crisis in Ukraine or between the latter and the Russian Federation.
Therefore, even if it were possible to replace Russian gas supplies with other sources of energy and
gas (which will be the main subject of this paper), aside from force majeure there are no
circumstances including sanctions which would allow either European companies or Gazprom to
renounce the overall volume offtake obligations in their long-term contracts.11 In the meantime, it will
be important to see whether Russian contracts which expire in the next several years in countries
such as Lithuania (2015) and Hungary (2016) will be extended or replaced by non-Russian gas.
Another option for countries which consider Russian gas imports to constitute an unacceptable
geopolitical threat to their national security – but which are unable to access alternative supplies at
acceptable costs – would be to replace gas with other fuels in their energy balances.
10
Letter from President Barroso to President Putin, European Commission Statement, Brussels, 17 April 2014.
11
This may be the reason why – at least up to September 2014 – no European sanctions have been placed on the Russian gas
industry which might allow Gazprom or European companies to declare force majeure i.e. that sanctions are preventing them
from fulfilling their long-term contract obligations.
5
October 2014: Reducing European Dependence on Russian Gas1.2 Statistical measures of dependence and vulnerability
Many commentators on European dependence on Russian gas start with reserve estimates which
show that Europe is ‘surrounded by gas reserves’, and draw the conclusion that there is plenty of gas
available to replace Russian supplies.12 Others observe that Europe has more than 80 bcm of gas
storage capacity and nearly 200 bcm of LNG import capacity and therefore 160 bcm of Russian
imports can easily be replaced. 13 This section addresses the problems of arithmetic analysis, which is
extremely popular with commentators seeking to demonstrate the existence of simple solutions which
would reduce European dependence on Russian gas.
In its May 2014 Communication on European Energy Security Strategy, the European Commission
(EC) summarized dependence on Russian gas as follows: 14
Six Member States depend from Russia as single external supplier for their entire gas imports and three of
them use natural gas for more than a quarter of their energy needs. In 2013 energy supplies from Russia
accounted for 39% of EU natural gas imports or 27% of EU gas consumption.
There are several problems connected with the interpretation of dependence statistics, the most
obvious being that (with the exception of countries which have no other source of gas) the figures
change every year, with 2013 being a record level which is substantially higher than the 2008–2012
period (Table 1). More importantly, arithmetic dependence can be misleading if interpreted as a
measure of vulnerability to an interruption of supplies. This is particularly the case for countries where
considerable volumes of gas are traded (imported and exported) each year, so that the percentage (of
either gross or net imports) of Russian gas fails to accurately reflect the alternative gas import options
available to these countries should Russian supplies be interrupted. 15
Figure 2 shows a simple dependence chart with European imports of Russian gas (adjusted to
European units) plotted against European demand for the period 1990–2013. From this it is clear that
the share of imports was relatively steady (in the range of 20–25 per cent) until 2013, when European
demand fell and Russian exports increased, at which point it reached 28 per cent of the total (similar
to the EU figure of 27 per cent cited above).
12
For a table of gas reserves in a range of countries see Appendix 1.
13
Bryza (2014) is a good example of this type of commentary.
14
EU Commission (2014c), p.2.
15
This is because countries which trade (i.e. import and re-export) may have the option not to do so if they do not have enough
gas to meet domestic demand.
6
October 2014: Reducing European Dependence on Russian GasFigure 2: Share of Russian gas in European demand 1990–2013* (bcm and %)
700 30%
600 25%
500
Russian share (%)
20%
demand (bcm)
400
15%
300
10%
200
100 5%
0 0%
1990 1992 1994 1996 1998 2000 2002 2004 2006 2008 2010 2012
Europe Russian imports (adjusted) Russia %
Source: EIA International Energy Statistics Database, based on 40 European countries.
For these reasons, the 2014 EC security strategy document uses two different metrics: an estimate of
resilience against interruptions – the so-called N-1 standard; 16 and a country-specific supplier
concentration index (SCI). In 2013, 16 member states met the N-1 standard for natural gas; those
which did not were Bulgaria, Greece, Lithuania, Estonia, Slovenia, Sweden, Ireland, Luxembourg, and
Portugal.17 The failure of the first five countries to meet this standard relates to their dependence on
Russian gas.
16
This standard requires Member States to ensure that, in case of disruption of their single largest piece of gas infrastructure,
the capacity of the remaining infrastructure could satisfy an exceptionally high demand level; it also requires developing
physical reverse-flow capacity subject to a potential cost/benefit analysis. These measures were set out in Regulation (EU) No
994/2010 of the European Parliament and of the Council of 20 October 2010, Concerning measures to safeguard security of
gas supply and repealing Council Directive 2004/67/EC, Official Journal of the European Communities, 12.11.2010, L295/1.
17
EU Commission (2014d), p.112.
7
October 2014: Reducing European Dependence on Russian GasTable 2: EU Member State Country-Specific Concentration Index* for Natural Gas supplies
from outside the European Economic Area 2000–2012
2000 2005 2009 2010 2011 2012
Austria 42.7 49 63.7 61.8 79.8 96.8
Belgium 7.8 5.1 11.8 7.8 14.6 1.6
Bulgaria 87.5 76.8 97.3 85.8 74.1 69.5
Croatia 16.8 15.3 11.7 10.4 0 0
Czech Republic 61.1 56.4 46.6 57.3 118.5 79.3
Denmark 0 0 0 0 0 0
Estonia 100 100 100 100 100 100
Finland 100 100 100 100 100 100
France 14.5 8.8 6.3 4.7 5.1 4.2
Germany 15.1 17 11.6 14.1 15.7 15.3
Greece 60.5 71.3 38.1 39.8 40.1 35.7
Hungary 44.3 36.8 51.2 57.5 48.9 63.4
Ireland 0 0 0 0 0 0
Italy 24.7 17.9 16.6 16.4 16.1 16
Lithuania 100.1 101.3 100.7 99.4 100.5 100.1
Luxembourg 100 100 6.9 6.9 6.9 6.8
Latvia 103.9 111.5 130.1 38.2 119.7 129.5
Netherlands 0 0.8 0.5 0.5 0.2 0.4
Poland 30 22.7 31 38.8 41.1 34.7
Portugal 76.9 56.9 37 42 46.2 38.6
Romania 3.9 9.1 2.2 2.7 3.6 3.3
Slovenia 51.2 51.3 31.9 32.5 28.2 20.1
Slovakia 97.6 105.6 116.8 99.8 109.9 82.3
Spain 39.4 25.2 19.8 19.8 24 26.5
Sweden 0 0 0 0 0 0
UK 0 0 0.4 2.2 0.5 n/a
*The SCI is computed as the sum of squares of the quotient (multiplied by 100) of net positive imports from a
partner to an importing country (numerator) and the gross inland consumption of that fuel in the importing country
(denominator). Smaller values of SCI indicate larger diversification and therefore lower risk.
Source: EU Commission (2014d), Table 12, pp.151–2.
The country-specific supplier concentration index shown in Table 2 is a measure of diversification and
the exposure of countries to suppliers outside the EU and European Economic Area (EEA). 18 The
index reports values between 0 (no import) and 100 (where the entire consumption comes from a
single supplier). Values above 100 indicate use of storage (for example Latvia); the values may also
18
Since Norway is not an EU member state, it was important to include EEA countries in order to count its supplies as
‘European’.
8
October 2014: Reducing European Dependence on Russian Gasbe overly high in countries which transit large volumes of Russian gas (such as Austria and the Czech
Republic) due to the fact that intra-EU trade movements are not reported as exports.19
With the exception of Portugal, the countries in Table 2 with a concentration level above 30 per cent
are all highly dependent on Russian gas. The value of this methodology is its ability to show how
dependence changes over time: increasing (Austria and the Czech Republic), decreasing (Bulgaria
and Greece), and remaining relatively constant (Poland). However, this assumes that supplies from
outside Europe are more insecure than those from European sources – a widely accepted
assumption, but one which needs to be questioned empirically.
Table 3: Non-EU Member State Imports of Russia Gas and Estimated Supplier Concentration
Index, 2013*
Imports of Russian Gas Estimated Supplier
(bcm) Concentration Index
(SCI)
Turkey 26.7 38.36
Serbia 2.0 56.47
Bosnia & Herzegovina 0.2 100
FYROM 0.1 100
*calculated using IEA data and therefore may not be completely comparable to the data in Table 2.
Source: IEA Natural Gas (2014), pp.II.8–9, Table 3, pp.II.34–37, Tables 17–18.
Three further observations are relevant here: first, many of the largest European gas markets
(Germany, UK, France, Italy, Netherlands, and Belgium) have relatively low concentrations (SCIs of
4–18 over the period) of non-European supplies; Spain, which had an SCI of 20–40, imports no
Russian gas. Second, that at least some of the countries noted above which do not meet the N-1
standard (Sweden, Luxembourg, and Slovenia) and are therefore relatively vulnerable to
interruptions, have low non-European supply concentrations. Third, European dependence on
Russian gas needs to be considered in a wider geographical framework than limiting the analysis to
EU member states. The vulnerability of Bosnia & Herzegovina and Serbia was graphically illustrated
during the January 2009 Russia–Ukraine crisis;20 Turkey is Gazprom’s second largest customer and
Russian gas accounted for around half of total supply in the early 2010s. 21 For this reason, we have
applied the SCI methodology to these countries and Table 3 shows the total dependence of Bosnia &
Herzegovina and FYROM; together with the significant dependence of Serbia and, to a lesser extent,
of Turkey. In relation to dependence on Russian gas, and security of supply, it is therefore logical to
concentrate on whether and how countries with high dependence/supplier concentration could
substantially alter their situation, using projections of their gas demand levels up to 2030.
1.3 European gas demand projections to 2030
Table 4 shows gas demand scenarios for those countries which are – and are likely to continue to be
– highly dependent on Russian gas (with an SCI exceeding 30) up to 2030.
In 2013 these ‘exports’ (in reality transit) amounted to 40.5 bcm for Austria and 7.1 bcm for Czech Republic, see IEA Monthly
19
Natural Gas Survey, July 2014, Table 4, p.17.
20
This applied less to FYROM which still retained oil-switching capability. See Pirani et al. (2009) and Kovacevic (2009).
21
Rzayeva (2014), pp.27–31.
9
October 2014: Reducing European Dependence on Russian GasTable 4: Gas Demand Projections for Countries Highly Dependent on Russian Gas 2015–2030
(bcm*)
Gas Demand in 2013 Russian Gas Imports in 2013* Gas Demand Projections
CENTRAL EUROPEAN COUNTRIES 2015 2020 2025 2030
Austria 8.53 4.79 8.53 7.54 7.60 7.11
Czech Republic 8.47 7.27 8.08 8.69 8.68 9.94
Slovakia 5.81 5.06 4.72 4.86 6.19 7.66
Poland 18.31 11.87 15.73 17.08 19.49 21.07
Hungary 9.28 5.52 10.65 11.12 10.37 9.79
TOTAL 50.4 34.51 47.70 49.30 52.33 55.57
BALTIC COUNTRIES
Estonia 0.68 0.64 0.34 0.38 0.41 0.43
Latvia 1.73 1.01 1.83 1.93 2.05 2.13
Lithuania 2.71 2.21 3.24 3.47 3.75 4.03
Finland 3.48 3.22 2.33 2.35 2.72 3.06
TOTAL 8.6 7.08 7.74 8.13 8.92 9.65
SOUTH EAST EUORPEAN COUNTRIES
FYROM 0.16 0.09 0.12 0.12 0.12 0.12
Bosnia/Herzegovina 0.19 0.18 0.26 0.27 0.29 0.30
Bulgaria 2.59 2.67 2.89 3.03 3.14 3.29
Serbia 2.52 1.84 2.30 2.30 2.30 2.30
Greece 3.84 2.39 4.32 4.10 3.85 3.64
TOTAL 9.3 7.17 9.89 9.82 9.69 9.65
GRAND TOTAL 68.3 48.76 65.33 67.25 70.95 74.86
Turkey 45.64 24.57 49.56 59.26 65.58 70.62
*converted to European units by reducing data in Table 1 by 7.97%
Sources: 2013 demand for OECD countries from IEA Natural Gas (2014), Tables 3 and 8, pp. 8–9, 16–17;
Russian imports from Table 1; 2015–2030 projections from Honoré (2014).
An important conclusion from Table 4 is that for the three groups of countries which are highly
dependent on Russian gas, demand is expected to increase by less than 7 bcm during the period
2013–2030: in Central Europe by 5.2 bcm, in the Baltic countries by 1.05 bcm, and in south-east
Europe by 0.4 bcm. In 2030, total demand for gas in countries highly dependent on Russian gas in
the Baltics and south-east Europe will be 19.3 bcm. In Central Europe, demand is much larger,
particularly in Poland (which has significant domestic gas production and an SCI which is significantly
lower than other countries in the region). Table 4 sets Turkey apart, as its gas demand is of a
completely different order of magnitude and in the 2020s will approach the sum of all other countries.
This data provides useful metrics for considering how much gas would be needed to replace Russian
gas in the most dependent European countries up to 2030.
Chapters 2–5 review the potential for non-Russian gas supplies and the non-gas options available to
Europe and Ukraine up to 2030.
10
October 2014: Reducing European Dependence on Russian GasAppendix 1: Conventional natural gas reserves and reserve to production
ratios for current and potential suppliers to Europe, end 2013
Reserves (trillion cubic metres) Reserve/Production Ratio (years)
Azerbaijan 0.9 54.3
Kazakhstan 1.5 82.5
Norway 2.0 18.8
Netherlands 0.9 12.4
Russian Federation 31.3 51.7
Turkmenistan 17.5 >100
UK 0.2 6.7
Uzbekistan 1.1 19.7
Iran 33.8 >100
Iraq 3.6 >100
Qatar 24.7 >100
Algeria 4.5 57.3
Egypt 1.8 32.9
Libya 1.5 >100
USA 9.3 13.6
Canada 2.0 13.1
Source: BP Statistical Review (2014), p.20.
11
October 2014: Reducing European Dependence on Russian Gas2. Alternative Sources of Gas Supply to Europe: volumes, time frames, and
infrastructure requirements
2.1 Supply options
2.1.1 European indigenous gas supply – conventional and unconventional
Conventional gas production
In the early 1970s, European indigenous production covered most of the region’s gas demand. By
2013, due to faster growth rates of consumption and a decline in gas production since the early
2000s, it only accounted for around 57 per cent of demand. 22 European production is falling
everywhere apart from Norway, and as a result, despite slow demand growth expected up to 2030,
Europe will become increasingly dependent on imports. The following paragraphs look at the
uncertainties surrounding future indigenous production and at the prospects for an increase in output
up to 2030.
Two countries represented 70 per cent of the indigenous production in 2013 – Norway: 109 bcm and
the Netherlands: 86 bcm. These countries are also the two main sources of indigenous gas for the
other European countries. Production from the UK continental shelf (UKCS) is still significant, at about
38 bcm, but it only represents about half of the national needs. Another 19 countries produced gas in
2013; this was used by their national markets, except for Denmark which exported small quantities.
In 2013, Norway was the world’s third-largest gas exporter behind Russia and Qatar and the biggest
natural gas producer in Europe (21.6 per cent of regional gas consumption). Nearly all Norwegian gas
is sold on west European markets via pipeline and this gas has partly offset the loss of both volumes
and flexibility from the UKCS in the 2000s. However, projections from Norway’s Ministry of Petroleum
in Figure 3 show gas sales in the range of 100–125 bcm in 2020, and 75–115 bcm in 2025 (from 103
bcm in 2013).23 The impression therefore is of plateau and possible decline in the late 2010s and
early 2020s. This could be reversed if more reserves are discovered, particularly in the Barents Sea
where exploration is still at an early stage. But gas exports – whether by pipeline or LNG – from the
far north are likely to be high cost.
Figure 3: Sales Gas from Norwegian fields 1985–2025 (bcm)
Source: The Ministry of Petroleum and Energy (2014), Figure 4.16, p.45.
22
Data for OECD Europe in IEA Natural Gas (2014), calculated from pages II.4 and II.8
23
Scenario up to 2025: Ministry of Petroleum and Energy (2014), p.45. Data in standard cubic metres converted to normal
cubic metres by multiplying by 0.948.
12
October 2014: Reducing European Dependence on Russian GasIn 2013, the Netherlands was the largest European producer and exporter of gas after Norway. Total
production peaked in 2010 and since then has declined marginally, a trend which Figure 4 shows is
due to accelerate in the 2010s. The Groningen field is one of the ten largest gas fields in the world,
with production of nearly 54 bcm in 2013. But following fears of earth tremors, production in the areas
most at risk will be reduced by 80 per cent (rather than entirely, to ensure a sufficient supply of natural
gas during periods of peak demand, such as the coldest days); limits on Groningen production for
2014, 2015, and 2016 have been set at 42.5, 42.5, and 40 bcm, respectively. 24 After 2016, the
situation will be evaluated to decide on further restrictions; as a result, a continuation of the maximum
annual production of 40 bcm25 is assumed until 2020, followed by a rapid decline reaching 16 bcm by
2030.
Figure 4: Historical and estimated future production of natural gas in the Netherlands 2001–
2038 (bcm)
Source: Netherlands (2012), p.25.
The United Kingdom produced 38 bcm in 2013, almost all from offshore fields, mostly from the North
Sea but also the Irish Sea. The decline in UKCS production from its peak of about 120 bcm in 2000
has been relatively steep but is expected to level off in the late 2010s. 26 Department of Energy and
Climate Change scenarios show that production will decline further in the 2020s to reach about 20
bcm in 2030 as shown below in Figure 5.27
24
Government of the Netherlands (2014).
25
Groningen Gas Equivalent (heating value of 35.17 MJ/Nm 3).
26
IEA (2014c), Energy Supply Security, emergency response of IEA countries, p.473;
http://www.oilandgasuk.co.uk/economic_report/production.cfm.
27
DECC (2014).
13
October 2014: Reducing European Dependence on Russian GasFigure 5: Historical and estimated UK net natural gas production 1998–2030 (bcm)
Source: DECC (2014).
Elsewhere in Europe, German production amounted to 11.7 bcm in 2013, but is expected to decline
at an average of 5 per cent per year to less than 5 bcm/year by 2030. Romania produced 10.6 bcm in
2013, but levels are expected to decline to 6 bcm/year by 2030. 28 Italy still produces more than 7 bcm
of gas a year but is in long-term decline; Poland produced more than 6 bcm in 2013 but conventional
gas is also in decline. Denmark is a net exporter of natural gas, but production peaked in 2005 (at
10.4 bcm) and has been in decline since then. 29 No other European country produces more than 2
bcm/year.
Table 5 shows scenarios for indigenous gas production in Europe for 2015, 2020, and 2030.
Production is expected to decline from 282 bcm in 2013 to about 266 bcm in 2015, mostly due to the
limit imposed on production from the Groningen field in the Netherlands. By 2020, indigenous
production could decline by another 20 bcm as a result of sharper decline in the Netherlands, UK, and
Germany. By 2030, European conventional gas production is expected to be about 172 bcm, a
reduction of 110 bcm compared with 2013. Table 5 also shows that the total is very dependent on the
three largest producers, which account for 82–84 per cent of the total throughout the period.
Table 5: Indigenous conventional gas production in European markets 2013–2030 (bcm)
2013 2015 2020 2030
Norway 109 109 110 100
UK 38 38 34 20
Netherlands 86 71 63 26
Other 49 48 39 27
TOTAL 282 266 246 172
Norway/UK/Netherlands 83 82 84 84
as a % of total
Sources: Figures 3–5, Danish Energy Agency (2014), IEA, author’s own analysis
28
OIES estimates.
29
See Danish Energy Agency (2014), p.19
14
October 2014: Reducing European Dependence on Russian GasUnconventional gas in Europe
Much attention has been devoted to the prospects for unconventional, especially shale, gas in
Europe. Recoverable shale gas reserves are estimated to be 16 trillion cubic meters (tcm), far above
tight gas at 3 tcm, and coal bed methane at 2 tcm. 30 While high expectations exist for shale gas
production, it is unlikely that this will significantly change the supply landscape at the regional level in
the time frame considered in this paper. Production may be significant at the national level but most
probably not this side of 2020.
There is no homogenous approach to shale gas exploration around Europe. 31 About 20 countries
have allowed exploratory drilling, although in countries such as Spain regional bans exist. The most
advanced market is Poland, where 64 exploratory wells had been drilled as of June 2014, of which
more than 20 have been fracked. The Polish authorities expected an additional 20 wells and the first
commercial production before the end of 2014. 32 However, the promise of the early 2010s has not
been maintained and companies such as ExxonMobil, Marathon, Total, ENI, and Talisman have
pulled out because of disappointing results and a complicated fiscal and regulatory landscape.
Nevertheless, other companies, such as Chevron, ConocoPhillips, and smaller companies such as
San Leon Energy, have achieved positive results after fracking.
The next most advanced country is the UK, which decided that exploratory drilling and fracking could
resume in December 2012, following a one year halt due to earth tremors recorded in the vicinity of
Blackpool in 2011. While reserves are judged to be significant, it is difficult to estimate how much gas
could be produced until the well flow rates have been tested. 33 The government has placed great
emphasis on shale gas exploration and production and has announced several measures designed to
lessen opposition from local communities and attract investment. 34 However, the lengthy planning and
consent process – not to mention large potential public opposition and disruption from protestors –
complicate the picture. In other countries progress is even slower, and most activity is at a very
preliminary stage. Some countries (and regions of countries) have imposed outright bans on drilling
and fracking.
While the hope was that shale gas could flatten the projected decline of conventional production, as of
2014 it is too early to estimate if and when significant quantities of shale – or any other
unconventional gas – will be produced. In a 2010 paper published by OIES Gény proposed three
scenarios – low, medium, and high potential35 – if commercial shale gas production in Europe began
in 2015, unconventional gas production was not expected to exceed 4.2 bcm 36 before 2020. By 2030,
the range represented in each scenario goes from 28 to 100 bcm/year, the upper bound of which is
viewed as a very optimistic but not ‘totally unrealistic production level’. 37 However, production of 8
bcm/year would necessitate 300 wells drilled per year (from 25 pads) over 10 years (based on a
30
EU Commission (2014e), p.4.
31
Despite concerns over possible pollution and seismic consequences of hydraulic fracking, the European Commission did not
regulate and instead published a list of non-binding recommendations on minimum principles applicable to exploration or
production using high volume hydraulic fracking on 22 January 2014. Source: EU Commission, Energy and environment
website: http://ec.europa.eu/environment/integration/energy/unconventional_en.htm.
For more information, see IEA (2014b), p.82.
32
Reuters UK, 31 July 2014, ‘Poland cuts estimate for shale gas exploration wells’,
http://uk.reuters.com/article/2014/07/31/poland-shalegas-minister-idUKL6N0Q438P20140731.
33
On 27 June 2013 the British Geological Society doubled its estimate of shale gas resources (in place, as distinct from
recoverable) in the north of England to (a central estimate of) 37 tcm.
34
Government of the UK (2014).
35
Gény (2010).
36
Data in Tcf converted in bcm by multiplying by 0.0283
37
Gény (2010), p.62
15
October 2014: Reducing European Dependence on Russian GasBarnett Shale Well analogue).38 Thus to reach production levels of even 28 bcm/year could require
800–1000 wells to be drilled each year for 10 years – an activity level which currently seems
unimaginable. Perhaps for this reason, the IEA’s 2013 World Energy Outlook sees less than 20
bcm/year of shale gas being produced in Europe in 2035.39
Green gas / biogas
Green gas, or biogas, is produced from organic materials – it is thus a form of renewable/sustainable
energy – via digestion (chemical process) or gasification (a thermal process which is still in its
infancy). Biogas can be considered a direct substitute for natural gas and can be used in many of the
same applications: heat, steam, electricity generation and co-generation, the vehicle fuel market,
feedstock in the chemical industry (fertilizer), and grid injection (it has to be upgraded to biomethane40
before it can be injected into the natural gas grid). Biogas can be considered as indigenous
production and can be viewed as improving security of supply.
Most of the Member States in Europe have a biogas roadmap as part of their National Renewable
Energy Action plans. However, biogas production is reliant on support from national legislation such
as feed-in tariffs (FITs), tax systems, or subsidies. In 2012, there were 13,800 biogas plants in
Europe, representing more than 7.4 GW el of installed capacity. More than 60 per cent of these plants
(8,700) were in Germany alone, where most biogas is converted into electricity and heat in
cogeneration units.41 Total production of biogas in Europe was about 14 bcm in 2012, with Germany
responsible for more than half (53 per cent) the total, followed by the UK (15 per cent), and Italy (less
than 10 per cent); other countries have much smaller levels of biogas production. 42 In 2013, there
were more than 200 methanization plants in 15 European countries (Austria, Switzerland, Germany,
Denmark, Spain, Finland, France, Hungary, Iceland, Italy, Luxembourg, Netherlands, Norway,
Sweden, and the UK) and biomethane was injected into the gas network in ten countries (Austria,
Switzerland, Germany, Spain, Finland, France, Luxembourg, Netherlands, Norway, and the UK). 43
Germany was in the lead with 130 plants as of November 2013, representing 76 cubic metres of
combined injection capacity per hour. 44 The biomethane is mostly used in CHPs, but its application as
a transport fuel is also developing in, for example, Sweden and Germany. In 2012, Van Foreest
estimated the cost of biomethane production at: €29/MWh from sewage feedstock, €38/MWh from
landfill processes, and €75/MWh from co-digestion.45
The level of biogas production expected in 2020 in the National Renewable Energy Action Plans is
expected to double to about 28 bcm/year in 2020. 46 More optimistic scenarios exist: from 48 bcm/year
in 2020, European Biomass Organization; up to 200 bcm/year, Institute for Energy and
Environment. 47 These scenarios may be unrealistic, or at best unlikely, due to a number of
uncertainties such as: the continuation of financial support to the development of biogas; the
sustainability of biomass production with its impacts on ecosystems; the effect of competition on
cultivated land between biomass production and food and feed production; and the issue of
38
See Rogers (2013).
39
IEA (2013), p.121.
40
The CO2 is removed while the share of methane is increased to meet the quality standards for natural gas
41
European Biogas Association website.
42
EurObserv’ER (2013), p.47.
43
European Biogas Association (2013).
44
EurObserv’ER (2013), p.45.
45
See Van Foreest F. (2012), p. 40, Figure 20.
46
European Biogas Association (2013).
47
See Van Foreest F. (2012), Introduction.
16
October 2014: Reducing European Dependence on Russian GasYou can also read