CARBON CAPTURE, UTILIZATION, AND STORAGE
←
→
Page content transcription
If your browser does not render page correctly, please read the page content below
CARBON CAPTURE, UTILIZATION, AND STORAGE:
Technology and Policy Status and Opportunities
 National Association of Regulatory Utility Commissioners | November 2018

                                Kiera Zitelman, NARUC
      James Ekmann, John Huston, and Pradeep Indrakanti, Leonardo Technologies, Inc.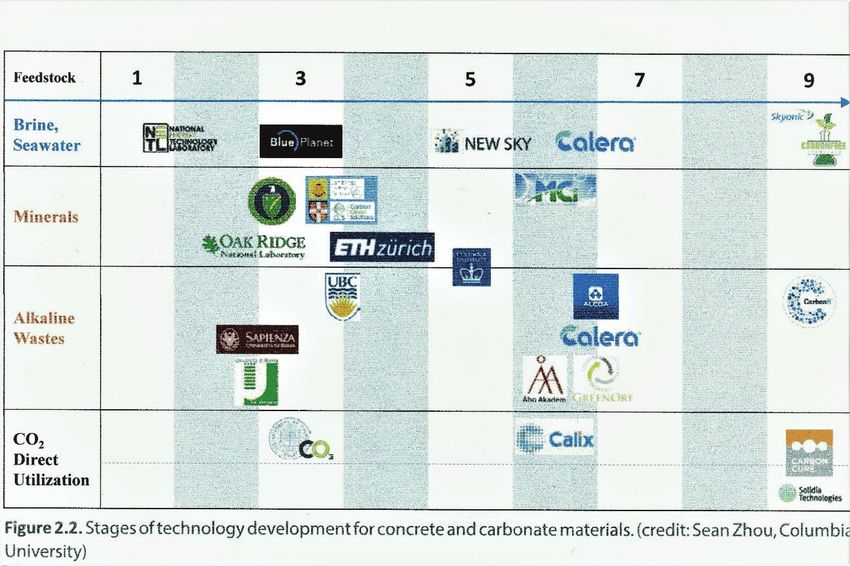

Acknowledgments and Disclaimers
The report you are reading was developed under the project: “Carbon Capture Storage and Utilization
Partnership between NARUC and the United States Department of Energy,” an initiative of the National
Association of Regulatory Utility Commissioners (NARUC) Center for Partnerships and Innovation. This material
is based upon work supported by the U.S. Department of Energy under Award Number DE-FE0027486.
This report was authored by Kiera Zitelman of NARUC and James Ekmann, John Huston, and Pradeep
Indrakanti of Leonardo Technologies Inc., under subcontract to NARUC. Throughout the preparation process,
NARUC staff and members provided the authors with editorial comments and suggestions. However, the
views and opinions expressed herein are strictly those of the authors and may not necessarily agree with
positions of NARUC or those of the U.S. Department of Energy.
Special thanks to:
Danielle Sass Byrnett, NARUC Center for Partnerships & Innovation
Joseph Giove, U.S. Department of Energy
Tom Sarkus and Venkat Venkataraman, National Energy Technology Laboratory
Hon. Jeremy Oden, Alabama Public Service Commission
Hon. Kara B. Fornstrom, Wyoming Public Service Commission
Hon. Thomas Johnson, Public Utility Commission of Ohio
Please direct questions regarding this report to Kiera Zitelman, NARUC Center for Partnerships &
Innovation at kzitelman@naruc.org or (202) 898-2212.
© November 2018 National Association of Regulatory Utility Commissioners
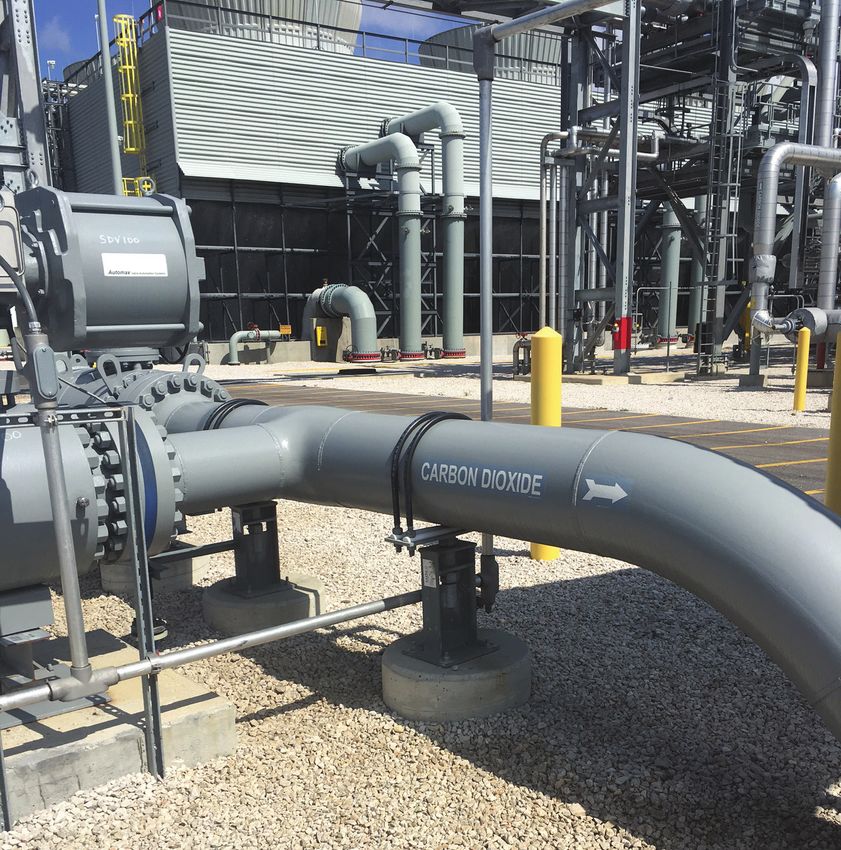
Cover photo courtesy of Kiera Zitelman, NARUC.
Disclaimer: This report was prepared as an account of work sponsored by an agency of the United States Government. Neither the United
States Government nor any agency thereof, nor any of their employees, makes any warranty, express or implied, or assumes any legal
liability or responsibility for the accuracy, completeness, or usefulness of any information, apparatus, product, or process disclosed, or
represents that its use would not infringe privately owned rights. Reference herein to any specific commercial product, process, or
service by trade name, trademark, manufacturer, or otherwise does not necessarily constitute or imply its endorsement, recommendation,
or favoring by the United States Government or any agency thereof. The views and opinions of authors expressed herein do not necessarily
state or reflect those of the United States Government or any agency thereof.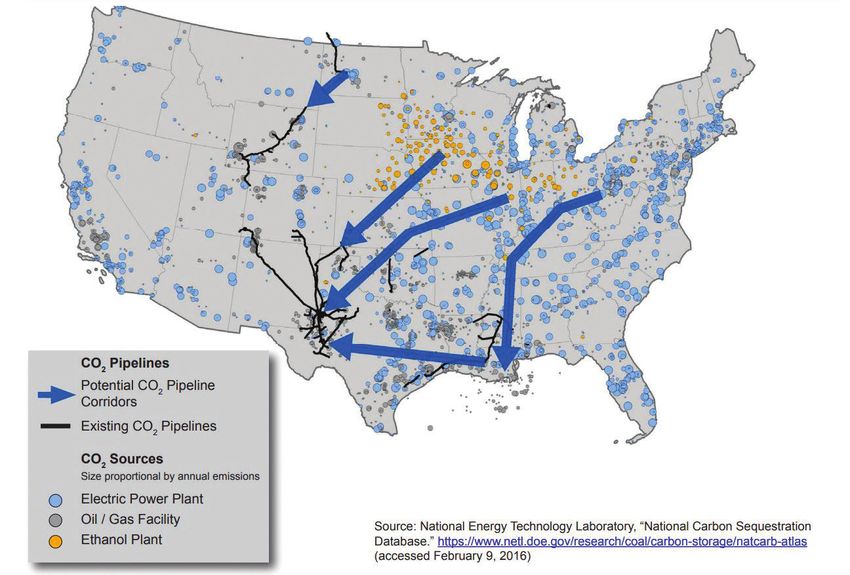
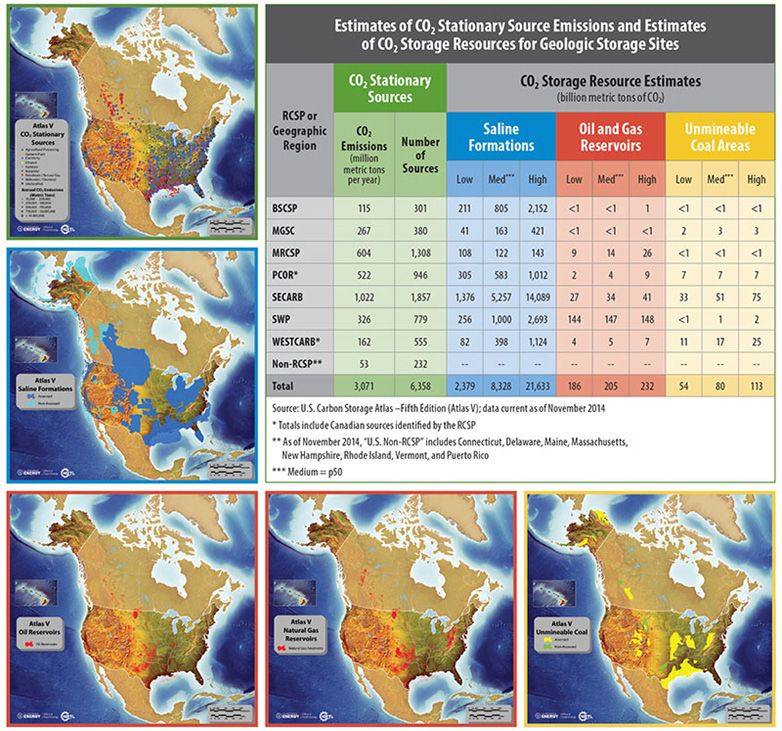
Table of Contents

Executive Summary                                                                 1

I.    Historical Context                                                          3
A.    Regulation of coal-fired electricity, 1970–2018                             3
B.    Coal and competing generation sources                                       5
C.    CCUS at coal facilities                                                     6
      1.  Projects in development                                                 7
      2.  Utilization: Enhanced Oil Recovery (EOR)                                7

II.   Benefits of Encouraging Carbon Capture and Storage for Coal Power Plants    9
A.    Decreasing CO2 emissions                                                    9
B.    Economic development benefit                                               10
C.    Grid reliability and fuel diversity                                        11
D.    International development                                                  12

III. CCUS Technology Primer                                                      13
A.    Post-combustion                                                            15
      1.  Advanced solvents                                                      17
      2.  Advanced sorbents                                                      17
      3.  Membranes                                                              17
B.    Oxy combustion                                                             20
      1.  Chemical loopin                                                        22
C.    Pre-combustion                                                             23
D.    CO2 utilization: EOR, fuels, other                                         25
E.    Future applicability of CCUS to natural gas-fired generation               27
F.    CCUS outside the electricity sector: industrial facilities                 28
G.    Sequestration                                                              31
      1.  Oil and gas reservoirs                                                 32
      2.  Deep saline reservoirs                                                 32
      3.  Unmineable coal seams                                                  32
      4.  Future potential                                                       34
      5.  Global status                                                          34
      6.  Offshore                                                               34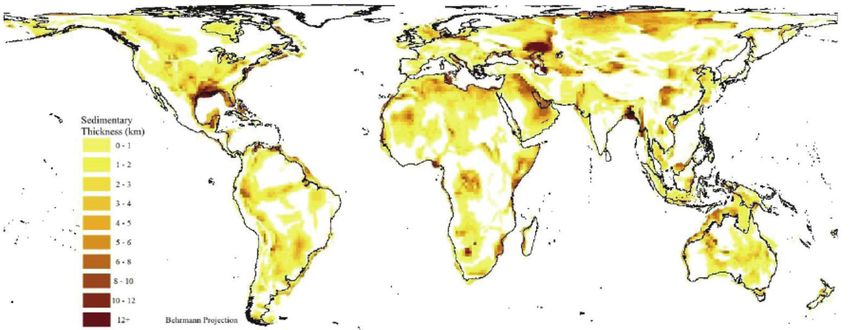
H.   Technology lessons learned from major demonstration projects            35
     1.  Petra Nova                                                          35
     2.  Kemper                                                              36
     3.  Boundary Dam                                                        37
     4.  Industrial projects: Air Products, Archer Daniels Midland           39
     5.   International lessons: Where has CCUS worked in other countries?   41
I.   Challenges remaining/barriers to widespread adoption                    45
     1.  Technical status                                                    45
     2.  Cost status                                                         46
     3.  Immediately achievable cost reductions for power plants             47
     4.  Regulatory status                                                   49
J.   Summary of RD&D opportunities                                           51

IV. Policy Approaches to Expand CCUS                                         53
A.   Public utility commission options                                       55
     1.  RPS compliance                                                      55
     2.  Low-carbon credits                                                  57
     3.  Enabling cost recovery for CCUS                                     57
     4.  Siting                                                              58
     5.  Planning                                                            59
B.   State government beyond PUC                                             59
     1.  Requiring CCUS                                                      60
     2.  Bonding authority                                                   60
     3.  Underground injection control program primacy                       60
     4.  Long-term sequestration liability                                   61
     5.  Subsurface ownership                                                62
C.   Federal government                                                      62
     1.  Financial options to reduce risk and lower cost of capital          62
     2.  Section 45Q tax credits                                             64
     3.  New source review                                                   65
     4.  Direct funding                                                      65
     5.  National infrastructure planning                                    67

V.   Collaboration and Partnerships                                          69
A.   International Collaboration                                             69
B.   U.S. Regional Partnerships                                              70
C.   CCUS Possibilities in the Eastern Interconnection                       73

Appendix A. Glossary                                                         81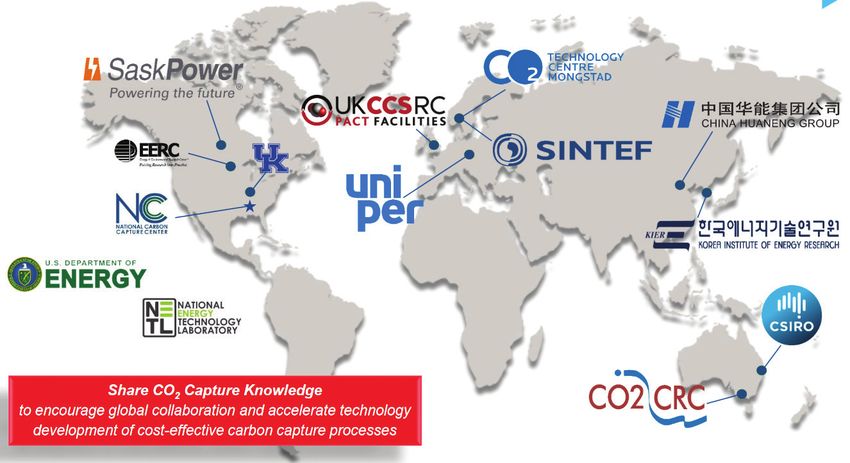
List of Figures
Figure I.1 Current CO2-EOR projects and pipeline infrastructure                                                          8
Figure II.1 Comparative costs of CO2 reductions across technologies                                                     10
Figure III.1 Typical schematic of an oxy-fuel pulverized coal-fired power plant                                         20
Figure III.2 Schematic of the CDCL process                                                                              22
Figure III.3 Schematic of TDA Research’s pre-combustion capture system in an IGCC power plant                           24
Figure III.4 Potential utilization streams for captured CO2                                                             25
Figure III.5 Quantity of CO2 available from U.S. industrial sources by region                                           28
Figure III.6 Comparison of economics of CO2 capture from industrial sources                                             30
Figure III.7 Global CO2 storage potential                                                                               33
Figure III.8 Comparison of lower storage capacity estimates and the demand for carbon storage under various scenarios   33
Figure III.9 View of the WA Parish Petra Nova project                                                                   35
Figure III.10 Cumulative oil production from the West Ranch oilfield following CO2 injection                            36
Figure III.11 Average monthly quantity of CO2 captured from BD3                                                         37
Figure III.12 Schematic of Port Arthur CCS project                                                                      39
Figure III.13 Breakeven costs for CO2 capture and availability                                                          47
Figure III.14 Comparative costs for capture from candidate CO2 emitters                                                 48
Figure III.15 Actual and anticipated progress in reducing CCUS costs                                                    48
Figure IV.1 Power sector regulation                                                                                     53
Figure IV.2 Federal, State, local, and tribal jurisdiction over electricity                                             54
Figure IV.3 Non-renewable resources eligible for RPS compliance                                                         56
Figure IV.4 Illustration of UK CFD scheme                                                                               63
Figure IV.5 Cost declines for renewable technologies, 2008 - 2014                                                       66
Figure IV.6 Recommendations for regional CO2 pipeline infrastructure                                                    67
Figure V.1 ITCN sites around the world                                                                                  69
Figure V.2 Regional Carbon Sequestration Partnerships                                                                   71
Figure V.3 RSCP large-scale development-phase projects                                                                  72
Figure V.4 RTOs/ISOs and non-RTOs comprising the Eastern Interconnection                                                74
Figure V.5 Fuel mix by power markets                                                                                    75
Figure V.6 Summary of storage potential                                                                                 76
Figure V.7 U.S. natural gas pipeline network                                                                            77
Figure V.8 U.S. CO2 pipeline network                                                                                    77
Figure V.9 Illustration of pipeline segment build-out under low-carbon scenario                                         79
Figure V.10 Mineralization options and technology readiness levels                                                      79

List of Tables
Table III.1 Capture technology options and areas for further development                                                16
Table lll. 2 Oxy-fuel combustion technologies: Benefits, challenges, status                                             21
Table V.1 Generating capacity within the Eastern Interconnection                                                        73
Table V.2 Geographic areas with large-scale CO2 pipeline systems operating currently in the U.S.                        78
Executive Summary

In the 19th and 20th centuries, coal was the energy resource that drove the electrification of the modern world,
and to this day remains a key source of fuel for generating electricity in the United States and worldwide.
Domestically, rising concern over environmental degradation associated with coal plants and competition
from abundant natural gas and renewable generation have challenged coal’s dominance. From 2000 to 2017,
more than 100 GW of U.S. coal-fired generation was retired, according to M.J. Bradley & Associates. Coal
presently accounts for approximately 30 percent of overall electricity generation in the U.S., down from nearly
45 percent in 2009.

Recently, the coal industry has focused on making a case for the reliability benefits coal plants offer and
the national security advantages of domestic coal production, as well as the importance of maintaining fuel
diversity in the electric sector. However, coal still faces a multitude of policy, technological, and financial
obstacles to its remaining an indispensable source of power in the 21st century.

Carbon capture, utilization, and storage (CCUS) technologies constitute an important opportunity for coal.
Decades of public and private research, development, and demonstration (RD&D) have led to crucial
breakthroughs in CCUS on coal-fired power plants. Although CCUS is confined to a handful of power plants
and faces barriers to widespread adoption in the power sector, CCUS has shown promising results in industrial
uses, and results from power sector applications have been encouraging. CCUS is an exciting technology area
with the potential to deliver environmental benefits, improved reliability, and increased economic activity.
These broad benefits have attracted support for CCUS from a wide range of stakeholders. With thoughtful
policies at the federal, state, and local levels and continued investment in RD&D, the deployment of CCUS
technology could be increased to improve the environmental performance of coal-fired power plants and
other industrial processes. Such action could enable coal to deliver the benefits the industry cites while
improving environmental performance—making coal a more robust clean energy competitor.

This paper examines the present state of CCUS and the challenges to widespread deployment in the energy
sector. It explores the policy and technology environment for coal-fired power generation and CCUS for
energy and industrial uses. It offers an array of actions policymakers and regulators can use to encourage
CCUS adoption to extend the life of existing coal-fired power plants while drastically cutting carbon dioxide
emissions, illuminating how the coal plant of the future could look.

This paper can be a resource for any stakeholder concerned with the intersection of energy and environmental
issues related to coal, but focuses on the role state public utility commissions play in the future of CCUS
technology. As economic regulators, state commissions must balance reliability, resilience, policy goals,
and customer needs while maintaining fair prices for ratepayers. However, the energy sector is subject to a
complex combination of regulatory bodies at all levels of government, and state commissions have limited
authority in some key areas. Therefore, the paper also looks at federal and other state and local actions that
could encourage CCUS adoption.

                                                                                      CCUS Technology and Policy  |  1
l. Historical Context

Coal has been generating electricity in the U.S. for over a century. Peaking at close to 50 percent of annual
generation in the mid-2000s, by 2017, coal had fallen to supplying approximately 30 percent of total
generation.1 Coal use expanded rapidly in the 1970s and 1980s after the 1973 oil embargo. Reliance on an
abundant domestic resource became much more attractive once the American public experienced petroleum
shortages. The Power Plant and Industrial Fuel Use Act of 1978 restricted the use of natural gas for electricity
generation by regulated utilities until its eventual repeal in 1987.2 On a dollars per unit of energy basis, coal
was substantially cheaper and more stable than petroleum or gas during the 1980s and 1990s.3

A.  Regulation of coal-fired electricity, 1970–2018
Coal combustion produces a number of byproducts that are harmful to human health and the environment,
mainly particulate matter (some of which contains mercury), sulfur dioxide, nitrogen oxides, and carbon
dioxide (CO2). Particulate matter can cause respiratory problems, heart and lung disease, and haze. Sulfur
dioxide causes acid rain. Nitrogen oxides contribute to acid rain and ground-level ozone (smog), which
causes respiratory problems. CO2 has no immediate adverse effect on human health, but contributes to
climate change by trapping heat in the earth’s atmosphere. Coal-fired electricity generation produces nearly
70 percent of CO2 emissions from the electric power sector.4

Pollution from coal plants has been regulated in two ways: through the Clean Air Act and through the use
of targeted incentives to encourage generation from other sources.5 In 1970, the Clean Air Act regulated
emissions of particulates, sulfur dioxide, and nitrogen oxides by requiring the U.S. Environmental Protection
Agency (EPA) to set national ambient air quality standards (NAAQS). Stationary (or point source) polluters are
required to obtain state permits before emitting regulated pollutants into the air. State air quality regulators
can dictate a precise emissions limitation to reflect currently available technology, ideally resulting in gradual
pollution reductions over time as pollution control technology advances.6 Congress originally exempted
existing power plants from permitting requirements.

1   U.S. Energy Information Administration, “Electricity Explained: Electricity in the United States,” April 20, 2018,
    https://www.eia.gov/energyexplained/index.php?page=electricity_in_the_united_states.
2   David Tuttle et al., “The Full Cost of Electricity (FCe-): The History and Evolution of the U.S. Electricity Industry,” University of Texas at
    Austin Energy Institute, 2016, http://sites.utexas.edu/energyinstitute/files/2016/09/UTAustin_FCe_History_2016.pdf.
3   David Spence, “Coal-Fired Power in a Restructured Electricity Market,” Duke Environmental Law & Policy Forum 15 No. 187 (Spring
    2005): 187–220. https://scholarship.law.duke.edu/cgi/viewcontent.cgi?article=1100&context=delpf.
4   U.S. Energy Information Administration, “Where Greenhouse Gases Come From,” July 20, 2018.
    https://www.eia.gov/energyexplained/index.php?page=environment_where_ghg_come_from.
5   Ibid.
6   Ibid.

                                                                                                                    CCUS Technology and Policy | 3
After the passage of the Clean Air Act, partially due to the decision to grandfather existing plants, acid rain
remained a persistent issue with adverse effects on vegetation and aquatic life. The 1990 amendments to
the Clean Air Act created the Acid Rain Program, a national cap-and-trade program to target acid rain by
controlling sulfur dioxide and nitrogen oxide emissions. The sulfur dioxide program set a national cap on
total emissions by electric generators, then granted tradeable allowances to generators in a market-based
effort to reduce pollution by the most cost-effective means. By 2016, the program had reduced sulfur dioxide
emissions by approximately 91 percent from 1990 levels. Nitrogen oxide was controlled through more
traditional rate-based regulation. The program reduced nitrogen oxide emissions by 81 percent from 1990
levels.7 The Acid Rain Program is widely recognized as a successful application of market-based regulation to
price an externality and let private actors respond accordingly.
Unlike particulate matter, sulfur dioxide, and nitrogen oxides, CO2 emissions are not regulated by the federal
government, although the 2007 Supreme Court decision in Massachusetts v. EPA ordered the EPA to regulate
greenhouse gases including CO2 as air pollutants under the Clean Air Act if the agency made a finding that
greenhouse gases endanger public health or welfare.8 In 2009, the EPA found that emissions of six greenhouse
gases (CO2, methane, nitrous oxide, hydrofluorocarbons, perfluorocarbons, and sulfur hexafluoride) from
motor vehicles threatened public health and welfare.9 The EPA cited this endangerment finding in the Clean
Power Plan, proposed in June 2014. The proposal required substantial cuts to CO2 emissions from existing
electricity generators, aiming to reduce emissions by 30 percent below 2005 levels by 2030.10 The proposal
was predicted to force the retirement of 92 GW of coal-fired generation by 2030.11 The Clean Power Plan was
stayed by the Supreme Court in February 201612 and the EPA proposed to repeal it in October 2017.13 The
EPA proposed a new rule to address emissions from coal-fired power plants in July 2018.14 As of the time of
writing, the status of this rule is unknown.
Other regulations passed during the Obama administration targeted pollutants from coal plants, mainly the
Mercury and Air Toxics Standard (MATS). MATS targeted coal- and oil-fired electricity emissions of heavy
metals, sulfur dioxide, and fine particulate matter. Approximately 1,100 coal-fired units at 600 power plants
had to comply with the rule. The total annual cost was estimated to reach $9.6 billion, with between $37
billion and $90 billion in annual benefits.15 Bloomberg New Energy Finance estimated that 30 GW of coal-
fired power would retire by 2020 due to MATS.16 At the time of writing, the EPA was conducting a residual
risk and technology review of the rule while leaving the standard in place. The future of the rule is uncertain.17
7 U.S. Environmental Protection Agency, “Clean Air Markets: Acid Rain Program,” https://www.epa.gov/airmarkets/acid-rain-program.
8 U.S. Department of Justice, “Massachusetts v. EPA,” May 14, 2015, https://www.justice.gov/enrd/massachusetts-v-epa.
9 U.S. Environmental Protection Agency, “Greenhouse Gas Emissions: Endangerment and Cause or Contribute Findings for the Greenhouse
Gases under the Section 202(a) of the Clean Air Act,” https://www.epa.gov/ghgemissions/endangerment-and-cause-or-contribute-find-
ings-greenhouse-gases-under-section-202a-clean.
10 “Regulation Database – Clean Power Plan,” Columbia Law School, Sabin Center for Climate Change Law,
http://columbiaclimatelaw.com/resources/climate-deregulation-tracker/database/clean-power-plan/.
11 Robert Rapier, “Premature Power Plant Retirements: Drivers and Responses,” GE Power, April 12, 2018.
https://www.ge.com/power/transform/article.transform.articles.2018.apr.premature-power-plant-retirements.
12 U.S. Supreme Court, “Order in Pending Case: Chamber of Commerce, et al. v. EPA, et al.,” February 9, 2016,
https://www.supremecourt.gov/orders/courtorders/020916zr3_hf5m.pdf.
13 U.S. Environmental Protection Agency, “Electric Utility Generating Units: Repealing the Clean Power Plan,”
https://www.epa.gov/stationary-sources-air-pollution/electric-utility-generating-units-repealing-clean-power-plan.
14 U.S. Environmental Protection Agency, “Proposal: Affordable Clean Energy (ACE) Rule,”
https://www.epa.gov/stationary-sources-air-pollution/proposal-affordable-clean-energy-ace-rule.
15 U.S. Environmental Protection Agency, “Fact Sheet: Mercury and Air Toxics Standards for Power Plants,”
https://www.epa.gov/sites/production/files/2015-11/documents/20111221matssummaryfs.pdf.
16 Meredith Annex, “Medium-Term Outlook for US Power: 2015 = Deepest De-Carbonization Ever,” Bloomberg New Energy Finance, April
8, 2015, https://data.bloomberglp.com/bnef/sites/4/2015/04/BNEF_2015-02_AMER_US-Power-Fleet-De-Carbonisation-WP.pdf.
17 “Mercury and Air Toxics Standards (MATS),” Harvard School of Law, Harvard Environmental Law Program, 2018,
http://environment.law.harvard.edu/2017/09/mercury-air-toxics-standards-mats/.
4 | CCUS Technology and PolicyIn 2016, the EPA finalized the Cross-State Air Pollution Rule (CSAPR), requiring a select number of states to
reduce sulfur dioxide and nitrogen oxide emissions that were causing neighboring states to exceed ground-
level ozone NAAQS. (Previously, states had been allowed to petition the EPA to address pollution from
particular electricity generating units in neighboring states under section 126 of the Clean Air Act.) The new
rule largely targeted Eastern and Midwestern states with coal-, gas-, or oil-fired electricity generation units.18
The EPA estimated that by 2017, CSAPR would cost industry $68 million per year and reduce nitrogen oxide
emissions by 20 percent compared to 2005 levels, leading to between $530 million and $880 million in
annual benefits.19 In April 2018, the EPA denied a petition from Connecticut requesting EPA regulation on a
coal-fired power plant in Pennsylvania, signaling that the agency may reduce enforcement.20
In April 2015, the EPA published a final rule on the safe disposal of coal combustion residuals (CCRs), a
byproduct of more than 400 coal-fired power plants. The rule established technical requirements for CCR
landfills and surface storage under the Resource Conservation and Recovery Act (RCRA)21 and included
provisions to allow for the beneficial use of CCRs, such as in concrete or gypsum panel products.22 The EPA
estimated the total annualized costs of the rule at $509 billion to $735 billion and benefits at $236 billion to
$294 billion using discount rates of 3 or 7 percent, respectively.23 In July 2017, the EPA revised the 2015 rule
to provide utilities and states with more flexibility in CCR management.24
B. Coal and competing generation sources
In the last three decades, coal has plateaued and then declined as a share of total electricity generation.
Regulation and economics have contributed to this change. The “shale revolution” (the combination of
hydraulic fracturing and horizontal drilling to produce natural gas from previously uneconomic shale rock)
around 2008 resulted in a flood of cheap gas produced mainly in Texas, Louisiana, Oklahoma, North Dakota,
Wyoming, Pennsylvania, Ohio, and West Virginia.25 In addition to natural gas, coal faced competition from
increasingly less expensive renewable generation. Federal funding for research and development and federal
and state incentives such as the Production Tax Credit for solar, Investment Tax Credit for wind, and state
renewable portfolio standards eventually contributed to economically competitive renewable generation.
Beyond a difficult regulatory and economic environment, coal plants built in the 1970s and 1980s are simply
aging out of the generation fleet.26
18 U.S. Environmental Protection Agency, “States that are Affected by the Cross-State Air Pollution Rule (CSAPR),”
https://www.epa.gov/csapr/states-are-affected-cross-state-air-pollution-rule-csapr.
19 U.S. Environmental Protection Agency, “Clean Air Markets: Final Cross-State Air Pollution Rule Update – Benefits Information and Maps,”
https://www.epa.gov/airmarkets/final-cross-state-air-pollution-rule-update-benefits-information-and-maps.
20 “Cross-State Air Pollution Rule and Section 126 Petitions,” Harvard School of Law, Harvard Environmental Law Program, 2018,
http://environment.law.harvard.edu/2018/07/cross-state-air-pollution-rule-section-126-petitions-information/.
21 U.S. Environmental Protection Agency, “Disposal of Coal Combustion Residuals from Electric Utilities,”
https://www.epa.gov/coalash/coal-ash-rule.
22 U.S. Environmental Protection Agency, “Coal Ash Reuse,” https://www.epa.gov/coalash/coal-ash-reuse.
23 U.S. Environmental Protection Agency, “Final Rule: Hazardous and Solid Waste Management Systems: Disposal of Coal Combustion
Residuals from Electric Utilities,” 40 CFR Parts 257 and 261, April 17, 2015,
https://www.regulations.gov/document?D=EPA-HQ-RCRA-2009-0640-11970.
24 U.S. Environmental Protection Agency, “EPA Finalizes First Amendments to the Coal Ash Disposal Regulations Providing Flexibilities for
States and $30M in Annual Cost Savings,” July 18, 2018,
https://www.epa.gov/newsreleases/epa-finalizes-first-amendments-coal-ash-disposal-regulations-providing-flexibilities.
25 “The U.S. Shale Revolution,” The University of Texas at Austin,
https://www.strausscenter.org/energy-and-security/the-u-s-shale-revolution.html.
26 Meredith Annex, “Medium-Term Outlook for US Power: 2015 = Deepest De-Carbonization Ever,” Bloomberg New Energy Finance, April
8, 2015, https://data.bloomberglp.com/bnef/sites/4/2015/04/BNEF_2015-02_AMER_US-Power-Fleet-De-Carbonisation-WP.pdf.
CCUS Technology and Policy | 5Coal-fired power continues to face a difficult economic outlook at present. Demand for electricity fell to
below one percent annual growth from 2000 to 2008, and essentially flat for the past ten years.27 No new
coal plants are under construction, and the majority of new generation build is divided between renewables
(wind and solar PV) and natural gas.28 As renewables produce a greater share of electricity, they make the
generation fleet more intermittent, thereby creating an incentive for flexible generation that can quickly ramp
up and down to match wind- and solar-driven output. Whereas natural gas generation can exhibit this quality,
coal plants have a harder time doing so and face higher costs. In North Dakota, where intermittent wind now
supplies a quarter of electricity demand,29 Coal Creek Station estimated that rapid ramping was imposing an
additional $3 million in annual operating costs.
Between 2008 and 2018, about half of the nation’s coal-fired power plants retired, with 262 plants still
operating as of March 2018.30 The capacity-weighted average age of operating coal plants is 39 years,
whereas coal-fired units have a typical lifetime of between 35 and 50 years.31 Broader deployment of cost-
effective CCUS can enhance coal’s competitiveness with other forms of generation, including natural gas and
renewable energy.
C. CCUS at coal facilities
The leading example of carbon capture on a coal-fired power plant resides at the Petra Nova project at NRG’s
W.A. Parish plant outside Houston, TX. Delivered on-time in December 2016 and on-budget at $1 billion,
Petra Nova captures CO2 from Unit 8 of the 3.7-GW plant via the amine-based Kansai Mitsubishi Carbon
Dioxide Recovery (KM-CDR) process and KS-1 high-performance solvent. While Unit 8’s capacity is 650 MW,
Petra Nova’s capture capacity is equivalent to 240 MW. A 70-MW gas-fired cogeneration system helps power
the system, reducing Petra Nova’s parasitic load to 22 percent.
Petra Nova is based on technology originally tested at Alabama Power’s James M. Barry Electric Generating
Plant. Mitsubishi Heavy Industries (MHI) demonstrated that the KM-CDR process and KS-1 solvent could
capture up to 500 tons of CO2 per day at a 25-MW coal-fired facility. Petra Nova scaled this technology up by
nearly 10 times to capture approximately 1.6 million metric tons of CO2 per year. Captured CO2 is pressurized
and transported via pipeline 80 miles to the West Ranch Oilfield to be used in enhanced oil recovery (EOR).
W.A. Parish was selected due to its proximity to carbon sequestration opportunities in oilfields. Additionally,
Texas offered abatement of half of the EOR severance tax, franchise tax credits, and property and sales
tax exemptions. NRG entered into a joint venture with JX Nippon Oil & Gas Exploration Corporation and
received $190 million in cost sharing from the U.S. Department of Energy and a $250 million loan from the
Japan Bank for International Cooperation. NRG and JX Nippon each contributed up to $300 million in equity.
Hilcorp, the oilfield operator, estimates that EOR from captured CO2 will increase the field’s output from 300
to 15,000 barrels per day. The project breaks even with oil prices at $50 per barrel.32
27 Robert Rapier, “Premature Power Plant Retirements: Drivers and Responses,” GE Power, April 12, 2018,
https://www.ge.com/power/transform/article.transform.articles.2018.apr.premature-power-plant-retirements.
28 David Tuttle et al., “The Full Cost of Electricity (FCe-): The History and Evolution of the U.S. Electricity Industry,” University of Texas at
Austin Energy Institute, 2016, http://sites.utexas.edu/energyinstitute/files/2016/09/UTAustin_FCe_History_2016.pdf.
29 U.S. Energy Information Administration, “North Dakota: State Profile and Energy Estimates,” https://www.eia.gov/state/?sid=ND.
30 “The U.S. Shale Revolution,” The University of Texas at Austin,
https://www.strausscenter.org/energy-and-security/the-u-s-shale-revolution.html.
31 U.S. Department of Energy, “Staff Report to the Secretary on Electricity Markets and Reliability,” August 2017,
https://www.energy.gov/sites/prod/files/2017/08/f36/Staff%20Report%20on%20Electricity%20Markets%20and%20Reliability_0.pdf.
32 Sonal Patel, “Capturing Carbon and Seizing Innovation: Petra Nova is POWER’s Plant of the Year,” Power 161 No. 8 (August 2017):
20 – 25, https://cdn2.hubspot.net/hubfs/3999852/Power%20Magazine%20Aug%202017%20Desalitech%20-%20Full%20Version.
pdf?t=1510942883532.
6 | CCUS Technology and Policy1. Projects in development
Petra Nova is the only operating large-scale power generation carbon capture facility in the U.S., according
to the Global CCS Institute (GCCSI). GCCSI counts five power generation pilot and demonstration projects
nationwide: NET Power (Texas), Plant Barry and Citronelle Integrated Project (Alabama), Pleasant Prairie Power
Plant Field Pilot (Wisconsin), Jupiter Oxy-Combustion and Integrated Pollutant Removal Test Facility (Indiana),
and the Mountaineer Validation Facility (West Virginia).33 In addition, Project Tundra in North Dakota involves
Allete Clean Energy, Minnkota Power Cooperative, Energy & Environmental Research Center, and National
Energy Technology Laboratory and DOE carbon capture research programs. Several Phase II CarbonSAFE
projects are considering the feasibility of storing greater than 50 million metric tons of CO2 captured from
coal-fired power plants.34
Internationally, large-scale operational power generation projects can be found at Boundary Dam in Canada,
Caledonia Clean Energy in the United Kingdom, and a handful of projects in East Asia—four in China and two
in South Korea.35 GCCSI counts 31 pilot and demonstration projects in the power generation industry outside
the U.S.36 Section III.H contains case studies of a selection of major CCUS projects with key lessons learned.
2. Utilization: Enhanced Oil Recovery (EOR)
The Petra Nova project extracts a revenue stream from captured CO2 by selling the pressurized gas for use
in EOR. EOR refers to methods to enhance oil production once extraction from an oilfield has begun to
decline due to a drop in pressure that naturally occurs as more oil is drawn out of the reservoir. CO2 acts as a
solvent to cause a portion of immobile oil to expand and flow to wells for extraction. EOR may be conducted
with other solvents and/or heat.37 CO2-EOR has been successfully applied for more than 50 years38 and is
currently in use to produce an additional 170,000 barrels of oil per day in the Permian Basin in west Texas and
southeastern New Mexico. CO2 is competitive for EOR use due to its low price compared to other solvents
and its miscibility (ability to mix in all proportions) with crude oil.39
33 Global CCS Institute, “Projects Database,” https://www.globalccsinstitute.com/projects.
34 National Energy Technology Laboratory, “Carbon Storage and Oil and Natural Gas Technologies Review Meeting,” August 2018,
https://www.netl.doe.gov/events/conference-proceedings/2018/2018-mastering-the-subsurface-through-technology-innovation-partner-
ships-and-collaboration-carbon-storage-and-oil-and-natural-gas-technologies-review-meeting/.
35 Global CCS Institute, “Projects Database: Large-Scale CCS Facilities,”
https://www.globalccsinstitute.com/projects/large-scale-ccs-projects.
36 Ibid.
37 Global CCS Institute, “What is CO2-EOR?” https://hub.globalccsinstitute.com/publications/what-happens-when-co2-stored-underground-
qa-ieaghg-weyburn-midale-co2-monitoring-and-storage-project/8-what-co2-eor.
38 From EOR to CCS Philip Marston and Patricia Moore, “From EOR to CCS: The Evolving Legal and Regulatory Framework for Carbon
Capture and Storage,” Energy Law Journal 29 No. 421 (2008): 421–490.
http://groundwork.iogcc.ok.gov/sites/default/files/From%20EOR%20to%20CCS.pdf.
39 National Energy Technology Laboratory, “Carbon Dioxide Enhanced Oil Recovery,”
https://www.netl.doe.gov/file%20library/research/oil-gas/CO2_EOR_Primer.pdf.
CCUS Technology and Policy | 7Figure I.1 Current CO2-EOR projects and pipeline infrastructure40
Given current technology, EOR is the most attractive option for CCUS on coal-fired power plants. The
oil industry is a highly motivated customer. Based on U.S. Energy Information Administration oil market
projections, CO2-EOR will be worth approximately $26 per metric ton in 2020 and up to $40 per metric ton by
2050.41 EOR can recover up to 28 billion additional barrels of oil.42 The biggest barrier to additional utilization
of CO2-EOR is affordable CO2 supply. CO2 pipelines are a critical component of affordability. NETL estimates
that the CO2-EOR industry has spent $1 billion on 2,200 miles of CO2 pipelines in the Permian Basin.43
Additional opportunities for CO2-EOR exist in unconventional oil extraction. Residual oil zones (ROZ) located
in the Permian Basin in west Texas contain 238 billion barrels of oil, according to analysis by Advanced
Resources International. With CO2-EOR, ARI estimates the area contains 18 billion economically recoverable
barrels.44 Application of CO2-EOR to shale oil reservoirs is more technically challenging than CO2-EOR at
traditional sites but still feasible under favorable geologic and economic conditions.45
40 National Energy Technology Laboratory, “Carbon Dioxide Enhanced Oil Recovery,”
https://www.netl.doe.gov/file%20library/research/oil-gas/CO2_EOR_Primer.pdf.
41 Carbon Utilization Research Council and ClearPath Foundation, “Making Carbon a Commodity: The Potential of Carbon Capture
RD&D,” July 25, 2018, http://www.curc.net/webfiles/Making%20Carbon%20a%20Commodity/180724%20Making%20Carbon%20a%20
Commodity%20FINAL%20with%20color.pdf.
42 State CO2-EOR State Deployment Work Group, “Infrastructure for Carbon Capture: Technology, Policy, and Economics,” National
Association of Regulatory Utility Commissioners, May 15, 2017, https://www.naruc.org/default/assets/File/GPI%20NARUC%20webinar%20
slides.pdf.
43 Carbon Utilization Research Council and ClearPath Foundation, “Making Carbon a Commodity: The Potential of Carbon Capture
RD&D,” July 25, 2018, http://www.curc.net/webfiles/Making%20Carbon%20a%20Commodity/180724%20Making%20Carbon%20a%20
Commodity%20FINAL%20with%20color.pdf.
44 Vello Kuuskraa, Advanced Resources International, “Using CO2-EOR, the ROZ and Carbon Management for Energy Independence,”
December 6, 2016, http://www.adv-res.com/pdf/Kuuskraa-ROZ-Midland-CO2-ROZ-DEC-2016.pdf.
45 Dheiaa Alfarge et al., “Feasibility of CO2-EOR in Shale-Oil Reservoirs: Numerical Simulation Study and Pilot Tests,” Carbon Management
Technology Conference (2017), https://doi.org/10.7122/485111-MS.
8 | CCUS Technology and Policyll. Benefits of Encouraging Carbon Capture and Storage
for Coal Power Plants
Carbon capture and storage/sequestration (CCS) refers to technology that captures CO2 from sources
of emissions, compresses it for transportation, and permanently sequesters it underground in geologic
repositories.46 CO2 may also be captured and utilized (CCUS) in enhanced oil recovery or other uses. This
paper generally uses the more expansive term, CCUS, when discussing carbon capture, utilization, and/or
sequestration.
Without regulation limiting CO2 emissions, there is no regulatory driver for coal-fired power plants to install
CCUS technology. However, there are a number of other reasons why coal plants may want to consider CCUS.
Federal tax incentives reward CCUS, and state subsidies make CCUS more cost-effective. State pollution
standards can also create a more hospitable environment for CCUS.
This paper focuses on CCUS applied to new and existing coal-fired power plants, paying particular attention
to CCUS retrofits on existing plants, as few coal plants have been built in recent years and no plants are
currently under construction. Encouraging CCUS on existing coal plants has four main benefits: decreased
emissions, economic development, grid reliability, and global leadership in market development.
A. Decreasing CO2 emissions
CCUS has the potential to decrease CO2 emissions from baseload generation. Coal-fired power is a particularly
attractive area of focus for reducing these emissions, as electricity generation is responsible for 41 percent of
U.S. CO2 emissions from combustion of fossil fuels and coal is the most carbon-intensive fossil fuel. Further,
electricity generation emissions come from a manageable number of stationary emitters with emissions
monitoring and existing pollution controls—particularly compared to other sectors (transportation emissions
come from millions of small, mobile sources; industrial, residential, and commercial sector emissions likewise
come from millions of decentralized, stationary sources of varying sizes). In other words, coal-fired power is a
sensible place to start for policymakers looking to reduce CO2 emissions.47
Unlike renewable generation, coal-fired power is always available, particularly during emergencies. Decreasing
coal-fired emissions would therefore have a magnified impact compared to replacing fossil generation with
intermittent renewable generation. The State CO2-EOR Deployment Working Group, a collection of public
utility commission staff, state energy officials, state-level cabinet secretaries, and other state regulatory staff
from 14 states, estimated the cost per ton of CO2 reductions from various generation and storage technologies
and found that CCUS retrofits of existing coal plants was similar in cost to replacing existing fossil fuel plants
with wind and retrofitting natural gas combined cycle plants with CCUS. Coal CCUS retrofits were cheaper
than several renewable options and only slightly more expensive than maintaining the existing nuclear fleet
and replacing coal plants with natural gas combined cycle plants (Figure II.1).48
46 Global CCS Institute, “Understanding Carbon Capture and Storage,” https://www.globalccsinstitute.com/understanding-ccs
47 Peter Folger, “Carbon Capture and Sequestration (CCS): A Primer,” Congressional Research Service, July 16, 2013,
https://fas.org/sgp/crs/misc/R42532.pdf.
48 State CO2-EOR Deployment Work Group, “Electricity Market Design and Carbon Capture Technology: The Opportunities and the
Challenges,” June 2017, http://www.betterenergy.org/wp-content/uploads/2018/02/Electric-Markets-and-CCS-White-Paper-1.pdf.
CCUS Technology and Policy | 9Figure II.1 Comparative costs of CO2 reductions across technologies49
Further, although some environmental groups have hesitated to endorse captured CO2 being used for
additional fossil fuel production, CO2-EOR actually results in net lifecycle emissions reductions. Including
emissions from oil combustion, a barrel of oil produced through CO2-EOR emits 37 percent less net CO2 than
a traditional barrel of oil.50 EOR also results in permanent geologic sequestration of CO2 once the efficient
amount of oil has been extracted from the field.
B. Economic development benefits
Coal is a widely available domestic fuel source. Coal mining employs approximately 53,100 American workers
as of May 2018.51 Coal mining is a significant source of employment in rural areas including Appalachia, the
northern Rockies, and the Illinois Basin.52 In many of these places, work in coal production offers a steady,
competitive income where few other opportunities exist. Coal miners produce coal as fuel for electricity
generators and also metallurgical coal for steel manufacturing. However, domestic electricity production is a
major driver of coal mining employment and the mining sector has stagnated as coal-fired power plants have
struggled to remain competitive and coal mining has become more automated. More than 80 percent of coal
mining jobs support electricity production and are vulnerable to power plant retirements.53 To the extent that
CCUS can increase the competitiveness and prolong the life of existing coal plants, coal producers and their
employees have an interest in supporting its expansion.
49 State CO2-EOR Deployment Work Group, “21st Century Energy Infrastructure: Policy Recommendations for Development of American
CO2 Pipeline Networks,” February 2017, http://www.betterenergy.org/wp-content/uploads/2018/02/White_Paper_21st_Century
Infrastructure_CO2_Pipelines_0.pdf.
50 State CO2-EOR Deployment Work Group, “Putting the Puzzle Together: State & Federal Policy Drivers for Growing America’s Carbon
Capture & CO2-EOR Industry,” December 2016, http://www.betterenergy.org/wp-content/uploads/2018/02/PolicyDriversCO2_
EOR-V1.1_0.pdf, and Carbon Utilization Research Council and ClearPath Foundation, “Making Carbon a Commodity: The Potential of
Carbon Capture RD&D,” July 25, 2018, http://www.curc.net/webfiles/Making%20Carbon%20a%20Commodity/180724%20Making%20
Carbon%20a%20Commodity%20FINAL%20with%20color.pdf.
51 U.S. Department of Labor, Bureau of Labor Statistics, “Employment, Hours, and Earnings from the Current Employment Statistics Survey
(National): CES1021210001,” 2018, https://data.bls.gov/timeseries/CES1021210001.
52 U.S. Energy Information Administration, “Table 18: Average Number of Employees by State and Mine Type, 2016 and 2015,”
https://www.eia.gov/coal/annual/pdf/table18.pdf.
53 U.S. Department of Energy, “Staff Report to the Secretary on Electricity Markets and Reliability,” August 2017,
https://www.energy.gov/sites/prod/files/2017/08/f36/Staff%20Report%20on%20Electricity%20Markets%20and%20Reliability_0.pdf.
10 | CCUS Technology and PolicyIn addition, the market for using CCUS-produced CO2 is growing. Enhanced oil recovery requires steady
delivery of pressurized CO2 to produce an additional 10 to 20 percent of oil once conventional extraction
methods remove 30 to 50 percent of the original oil. The EOR market is in need of reliable CO2 supply,
representing an important opportunity for CCUS to support jobs in that sector.54 The Carbon Utilization
Research Council and ClearPath Foundation estimate that an aggressive RD&D program for CO2-EOR could
support between 270,000 and 780,000 new jobs in oil production and $70 to $90 billion in additional GDP
by 2040.55 Further, enhancing the use of carbon capture for enhanced oil recovery lessens U.S. dependence
on foreign oil imports and stimulates domestic economic activity: “Producing more domestic oil through EOR
also further displaces heavier and more carbon-intensive imported crude oil and lowers our trade deficit by
reducing expenditures on oil imports. Additionally, installing carbon capture facilities, building CO2 pipelines
and reworking mature oil fields to revitalize their production through CO2-EOR brings jobs and investment to
key energy and industrial sectors of the U.S. economy.” 56
Several private firms and universities are engaged in research on other utilization methods for CO2 including
CO2 -based cement production, fuels, plastics, and building materials.57 CCUS could supply the primary fuel
for these budding industries, contributing to innovative jobs and economic development.”
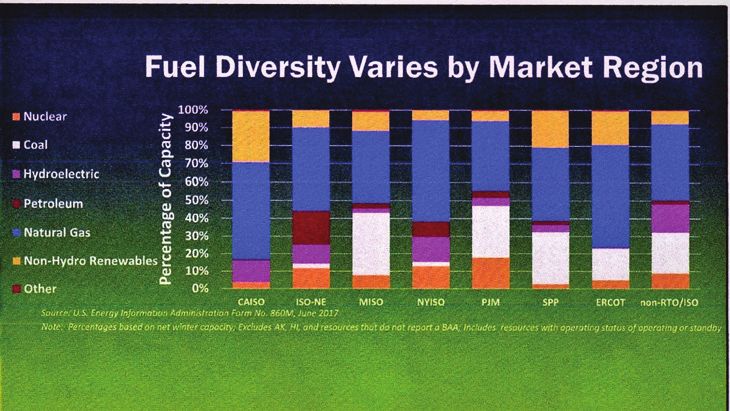
C. Grid reliability and fuel diversity
The federal government, the Federal Energy Regulatory Commission (FERC), regional market operators,
and states are engaged in ongoing conversations about the meaning of power sector resilience and to what
extent, if any, particular fuel sources provide resilience benefits to electricity customers or the grid as a whole.
This discussion is beyond the scope of this paper; however, coal-fired power plants, like other generation
sources, are contributors to the diversity of the electricity system. DOE noted in a 2017 staff report on
electricity markets and reliability that fuel diversity is an important component of resilience and reliability.58
54 Carbon Utilization Research Council and ClearPath Foundation, “Making Carbon a Commodity: The Potential of Carbon Capture
RD&D,” July 25, 2018, http://www.curc.net/webfiles/Making%20Carbon%20a%20Commodity/180724%20Making%20Carbon%20a%20
Commodity%20FINAL%20with%20color.pdf.
55 Carbon Utilization Research Council and ClearPath Foundation, “Making Carbon a Commodity: The Potential of Carbon Capture
RD&D,” July 25, 2018, http://www.curc.net/webfiles/Making%20Carbon%20a%20Commodity/180724%20Making%20Carbon%20a%20
Commodity%20FINAL%20with%20color.pdf.
56 State CO2-EOR Deployment Work Group, “Electricity Market Design and Carbon Capture Technology: The Opportunities and the
Challenges,” June 2017, http://www.betterenergy.org/wp-content/uploads/2018/02/Electric-Markets-and-CCS-White-Paper-1.pdf,
and Carbon Utilization Research Council and ClearPath Foundation, “Making Carbon a Commodity: The Potential of Carbon Capture
RD&D,” July 25, 2018, http://www.curc.net/webfiles/Making%20Carbon%20a%20Commodity/180724%20Making%20Carbon%20a%20
Commodity%20FINAL%20with%20color.pdf.
57 “Carbon XPRIZE,” NRG Cosia, https://carbon.xprize.org/.
58 U.S. Department of Energy, “Staff Report to the Secretary on Electricity Markets and Reliability,” August 2017, https://www.energy.gov/
sites/prod/files/2017/08/f36/Staff%20Report%20on%20Electricity%20Markets%20and%20Reliability_0.pdf.
CCUS Technology and Policy | 11Retiring coal plants may leave ratepayers more vulnerable to a number of threats to affordable, reliable
energy, according to NETL analysis.59 Coal plants make up a significant portion of generation during weather-
induced emergencies. For example, during a “cold snap” from December 27, 2017, through January 8, 2018,
coal produced 55 percent of generation in RTO/ISO territories. Coal’s key role is underscored by high natural
gas prices due to limited pipeline capacity, particularly during cold weather.60 PJM noted that it “dispatched
coal units because their costs were lower during certain hours of the cold snap. PJM had adequate amounts
of resources to supply power” (emphasis in original).61 PJM did agree with NETL’s finding that high natural
gas prices led to the increased dispatch of coal units. Similarly, demand spikes during increasingly common
heat waves could result in high prices and, at worst, brownouts or blackouts. Following the retirements of
three large coal-fired units in Texas (1208 MW at Big Brown, 1200 MW at Sandow 4 & 5, and 1865 MW at
Monticello), the Electric Reliability Council of Texas (ERCOT) North hub experienced day-ahead prices of
$551/MWh and real-time 15-minute prices of $3,125/MWh in spring 2018, far above the seasonal averages.62
DOE emphasized the need for fuel diversity in the August 2017 DOE grid study and in a September 2017
request that FERC exercise its authority under sections 205 and 206 of the Federal Power Act to compensate
fuel-secure plants for the resilience they provide to the electric grid.63 FERC denied the request and opened a
new docket to discuss the resilience of the power fleet and explore what, if any, action the commission could
take to improve resilience.
The action FERC will take in response to DOE’s request under section 403 of the Department of Energy
Organization Act is uncertain. However, coal inarguably plays an important role in today’s generation fleet,
and unchecked retirements of coal-fired capacity are a concern to state and federal policymakers.
D. International development
Although the U.S. is not seeing new coal plants being built, developing countries are relying heavily on
coal-fired power to supply cheap, reliable electricity to rapidly growing populations. These populations are
vulnerable to the human health and environmental impacts of pollution associated with coal-fired power.
Therefore, there are numerous international opportunities for U.S. firms to develop and apply CCUS to
existing and new coal plants, spreading the global development benefits of increased access to energy while
reducing emissions of greenhouse gases and other pollutants—a particularly important balance to strike as
developing countries commit to greenhouse gas reduction goals.
59 Peter Balash et al., “Reliability, Resilience and the Oncoming Wave of Retiring Baseload Units Volume 1: The Critical Role of Thermal Units
during Extreme Weather Events,” National Energy Technology Laboratory, March 13, 2018, https://www.netl.doe.gov/energy-analyses/
temp/ReliabilityandtheOncomingWaveofRetiringBaseloadUnitsVolumeITheCriticalRoleofThermalUnits_031318.pdf.
60 Ibid.
61 PJM Interconnection, “Perspective and Response of PJM Interconnection to National Energy Technology Laboratories Report Issued
March 13, 2018,” 2018, https://www.pjm.com/~/media/library/reports-notices/weather-related/20180413-pjm-response-to-netl-report.
ashx.
62 April Lee, “Coal Plant Retirements and High Summer Electricity Demand Lower Texas Reserve Margin,” U.S. Energy Information
Administration, July 2, 2018, https://www.eia.gov/todayinenergy/detail.php?id=36593.
63 U.S. Department of Energy, “Grid Resiliency Pricing Rule: Notice of Proposed Rulemaking,” 18 CFR Part 35, Docket No. RM17-3-000,
https://www.energy.gov/sites/prod/files/2017/09/f37/Notice%20of%20Proposed%20Rulemaking%20.pdf.
12 | CCUS Technology and Policylll. CCUS Technology Primer
CO2 capture, as a separations process, has been in use for many years. Separation of CO2 from natural gas
started in the 1930s.64 The use of CO2 as a means for tertiary recovery of petroleum (CO2-EOR) makes use of
known underground formations that trap significant volumes of CO2. This practice began in the early 1970s.65
CO2 has found widespread industrial applications. CO2 gas is used in refrigeration systems, welding systems,
water treatment processes (to stabilize the pH of water), and carbonated beverages. It is also used in the
metals industry to enhance the hardness of casting molds and as a soldering agent. CO2 is found in some fire
extinguishers.
Organized research, development, and demonstration (RD&D) of CO2 capture, followed by permanent
storage or consumption, began to get a serious look in the United States starting in 1997. The Sleipner
project was initiated in 1996 to separate CO2 from natural gas and inject the CO2 into a formation under the
North Sea.66 The earliest studies that considered CCUS as a means of controlling emissions of CO2 focused
on existing technologies, such as sub- and super-critical power cycles based on coal as the primary fuel.
Industrial gasifiers and power cycles based on gasification of coal (integrated gasification combined cycle
systems) were also identified as an important potential application.
The United States began a formal program of RD&D in 1997 with the intent of facilitating deployment as
technology options matured. The technical effort was split into two major efforts. One set of activities focused
on capture of CO2 from power sector facilities and from large industrial facilities in industries that are known
emitters of large amounts of CO2. The second set of activities focused on storage options with the intent
that the captured carbon (usually as CO2) be stored in some way that ensured permanence. The storage
had to be verifiable—that is, to be secure for thousands of years. Technologies that used the captured CO2
were also included in the research portfolio. The main thrust in the storage component was to characterize
different geological formations within the United States and to assess the potential that these held to store
large amounts of CO2. This characterization and assessment process was emulated by many nations to the
point where global statistics on potentially suitable storage reservoirs are now available.67
Countries initially active in advancing CCUS developed programs that pursued both major themes: capture
and storage. Some focused on early demonstration and assurance of storage integrity, others on the basic R&D
necessary to underpin technology development with sound science and to create tools to guide the research
and development. Global assessments of climate change mitigation strategies continue to emphasize the
important role that CCUS must play.
64 National Energy Technology Laboratory, “A Review of the CO2 Pipeline Infrastructure in the U.S.,” 2015, https://www.energy.gov/sites/
prod/files/2015/04/f22/QER%20Analysis%20-%20A%20Review%20of%20the%20CO2%20Pipeline%20Infrastructure%20in%20the%20
U.S_0.pdf
65 Global CCS Institute, “The Global Status of CCS,” 2017, http://www.globalccsinstitute.com/sites/www.globalccsinstitute.com/files/
uploads/global-status/1-0_4529_CCS_Global_Status_Book_layout-WAW_spreads.pdf.
66 Global CCS Institute, “The Global Status of CCS,” 2017, http://www.globalccsinstitute.com/sites/www.globalccsinstitute.com/files/
uploads/global-status/1-0_4529_CCS_Global_Status_Book_layout-WAW_spreads.pdf.
67 Ibid.
CCUS Technology and Policy | 13This chapter provides a brief overview of the existing state-of-the-art in CO2 capture, transport, and storage
technology options. Table III.1 is a brief summary of the capture technology options currently available or
under development for any of the power technologies described in this chapter. Existing and developmental
thermal power generation technologies that emit CO2 are described and linked to the capture technologies
appropriate for each option:
• Subcritical and advanced (super critical, ultra-super critical) pulverized coal systems,
• Gasifiers and combined cycle power systems based on gasification, and
• Oxy-fuel combustion.
The large-scale emitting industries are also described. In addition, many of the emerging novel and advanced
capture systems offer the potential to apply to a variety of existing and emerging combustion systems that
may not be good candidates for the capture technologies already deployed or in large pilot-scale testing.68
The chapter provides an overview of characterization of a range of potential geological storage formations
and of tool developments that have been pursued, a discussion of lessons learned from major projects is
included. The chapter concludes with a discussion of remaining issues, including non-technical obstacles to
new project development and to commercial deployment.
Within the CCUS community, important lessons have been learned at all scales—from laboratory-scale work
through small- and large-pilot studies up to demonstrations. Continuing efforts within several nations have
further converged, allowing for improved research and development up through large pilot-scale studies.69
CCUS researchers are pursuing improvements to well-established methods for capture for coal- and natural
gas-fired power plants as well as industrial facilities and for the development of radically new techniques
that offer lower energy penalties and lower capture costs or that explore means to reuse captured CO2.70 In
addition, separate studies have been conducted to assess storage technologies and to develop an inventory
of global storage capacity.
Organizations funding CCUS RD&D assess progress toward goals for both capture system performance
and for storage site capacity and permanence. In addition, widespread international participation in CCUS
projects and through international meetings (such as the Greenhouse Gas Control Technologies conferences)
has led to an evolving consensus on appropriate standards. Significant progress has already been made.
68 U.S. Department of Energy, “Accelerating Breakthrough Innovation in Carbon Capture, Utilization, and Storage: Report of the Carbon
Capture, Utilization and Storage Experts’ Workshop,” 2017. https://www.energy.gov/sites/prod/files/2018/05/f51/Accelerating%20
Breakthrough%20Innovation%20in%20Carbon%20Capture%2C%20Utilization%2C%20and%20Storage%20_0.pdf.
69 Frank Morton, “International Collaboration on CCUS R&D,“ Carbon Management Technology Conference, Houston, Texas, 2017.
70 Ahmed Al-Mamoori et al., “Carbon Capture and Utilization Update,“ January 23, 2017, https://onlinelibrary.wiley.com/doi/full/10.1002/
ente.201600747.
14 | CCUS Technology and PolicyYou can also read


