CHINA'S CLIMATE COOPERATION SMOKESCREEN - A Roadmap for Seeing Through the Trap and Countering with Competition - Baker Institute ...
←
→
Page content transcription
If your browser does not render page correctly, please read the page content below
CHINA’S CLIMATE
COOPERATION SMOKESCREEN
A Roadmap for Seeing Through the Trap
and Countering with Competition

Gabriel Collins, J.D.
Baker Botts Fellow in Energy & Environmental Regulatory Affairs,
Rice University’s Baker Institute for Public Policy

Andrew S. Erickson, Ph.D.
Professor of Strategy, China Maritime Studies Institute, Naval War College

September 2021

                                                   China’s Climate Cooperation Smokescreen | 1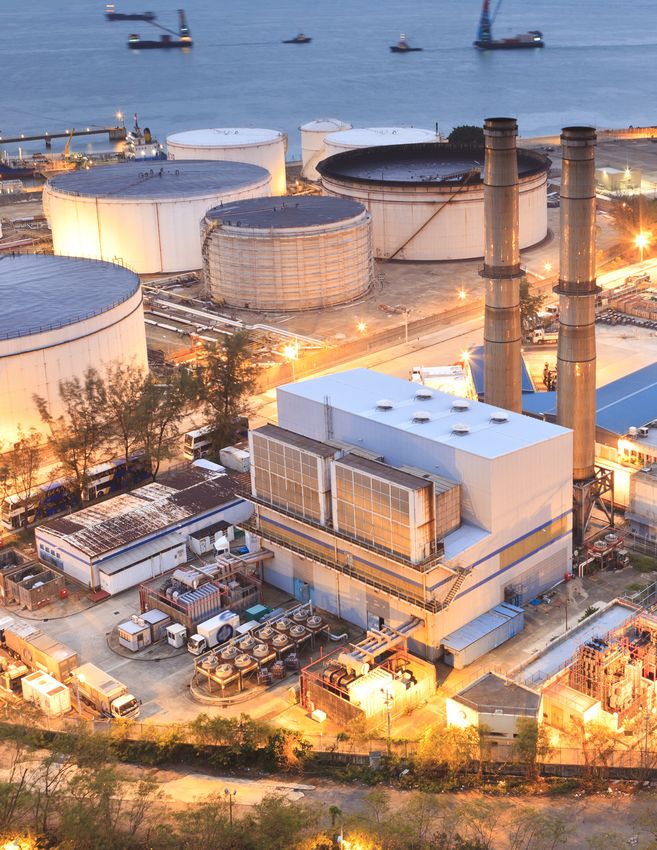
Acknowledgement: The authors wish to thank multiple anonymous reviewers for their
                        insightful comments. Their inputs made this a stronger, more useful piece. Any errors
                        are the authors’ alone.

                        Contact information: gabe.collins@rice.edu.

                        © 2021 by Rice University’s Baker Institute for Public Policy

                        This material may be quoted or reproduced without prior permission, provided
                        appropriate credit is given to the authors and the Baker Institute for Public Policy.

                        Wherever feasible, papers are reviewed by outside experts before they are released.
                        However, the research and views expressed in this paper are those of the individual
                        researchers and do not necessarily represent the views of the Baker Institute or the
                        position of any organization with which the authors are affiliated or have been affiliated.

                        Gabriel Collins, J.D.
                        Andrew S. Erickson, Ph.D.
                        China’s Climate Cooperation Smokescreen:
                        A Roadmap for Seeing Through the Trap and Countering with Competition

                        https://doi.org/10.25613/3vx3-jd10

2 | Rice University’s Baker Institute for Public Policy
Key Points
 • Beijing’s quest for political leverage at home and abroad overrides its concern for
   the climate.
 • Leading-emitter China pushes to link its political priorities to others’ climate
   priorities.
 • When foreign supplicants collide with the Chinese Communist Party’s (CCP) self-
   interest, they will pay with both up-front concessions and wasted time, during
   which critical climate systems could be pushed beyond the point of no return.
 • This is a major danger facing the administration of President Joe Biden.
 • Real pro-climate progress requires fundamentally shifting the CCP’s calculus by
   actually altering the economic bottom line on which its power hinges.
 • Climate competition—specifically, leveraging the threat of carbon taxation—
   is the only Archimedean lever powerful enough to incentivize a timely
   transformation.
 • This paradigm-shifting approach would curtail China’s latitude for exploitative
   geopolitical maneuvering and empower sidelined reformers.
 • Climate competition supports a whole-of-coalition “race to the top” for pro-
   climate actions, with the EU carbon border tax proposal an extant example.
 • Crucially, it could also anchor the bipartisan domestic support necessary to keep
   Washington a reliable long-term climate leader and partner of choice.
 • Finally, it offers on-ramps for China itself to engage more decisively on climate
   change both domestically and internationally, and to benefit accordingly.
 • No silver bullet exists, but climate competition offers the most viable pathway to
   preserving the atmosphere and oceans for future generations.

Executive Summary
This report expands on an essay the authors published in the May/June 2021 issue
of Foreign Affairs.1 It provides additional explanation of how President Biden and
his team can, and must, avoid two important foreign policy pitfalls: (1) entrapment
in climate cooperation negotiations with Beijing that compromise vital American
interests up front without corresponding Chinese concessions (let alone reciprocation),
and/or (2) economic self-sabotage if the United States makes great climate
sacrifices unilaterally, but the People’s Republic of China (PRC) fails to do its part.
To help manage these looming risks, this report provides a roadmap to guide U.S.
policymakers through Beijing’s climate cooperation smokescreen and into emissions-
constraining competition with China.

                                                                    China’s Climate Cooperation Smokescreen | 3
The most viable path to sustainable biosphere security entails first competing with
                        China by rallying a climate coalition whose alignment Beijing will ultimately seek by
                        making more credible commitments than Washington itself could prompt unilaterally.
                        It is time for a signature American initiative that brings allies and partners from the
                        world’s largest market bloc into a massive U.S.-led movement. This conglomerate of the
                        committed can generate the one Archimedean lever too powerful for Beijing to ignore.
                        The fulcrum: carbon taxation and border adjustment taxes that would impose a heavy
                        cost on future PRC climate destruction, directly impacting not only China’s international
                        reputation, but—far more consequentially—its core growth model. No amount of
                        domestic repression, propaganda, or recalcitrance could hide or offset an undermining
                        of that growth model, a cornerstone of Chinese Communist Party (CCP) legitimacy.

                                                                To that end, this report first explains the
                                                                empirical roots of China’s contradictory
         The most viable path to                                stances on carbon and greenhouse gas
         sustainable biosphere security                         emissions and how Beijing’s attempts
                                                                to extract concessions actually reflect a
         entails first competing with                           fundamental weakness in its competitive
         China by rallying a climate                            position on carbon. It then articulates a
         coalition whose alignment                              set of actionable, forward-leaning policy
         Beijing will ultimately seek                           ideas aimed at regaining the climate
         by making more credible                                initiative through a novel course of
                                                                action—competition. A proactive whole-
         commitments than Washington                            of-coalition effort can incentivize Beijing
         itself could prompt unilaterally.                      to defend its global diplomatic, economic,
                                                                and industrial competitive position in ways
                                                                that unilateral supplication simply cannot—
                                                                with much greater prospects for success.
                   Only such a realignment has the potential to bring China to the table for productive
                   negotiations rather than the distracting or extractive ones it currently pursues.

                        Our report leverages extensive empirical evidence to help explain China’s abiding
                        commitment to coal and the CCP interests that drive the ongoing obfuscation in its
                        climate rhetoric.2 For policymakers, it also outlines a climate competition strategy
                        to incentivize Beijing to become a positive force for climate progress, rather than
                        a selfish spoiler. While competition is presently not a universally popular approach,
                        it offers Washington’s most plausible route (in concert with allies and partners) to
                        help fundamentally recalibrate China’s incentive structure in the interests of global
                        biosphere security. Competition is also the pathway most congruent with achieving
                        emissions reductions and reshaping the international climate diplomacy paradigm,
                        while also making progress on domestic emissions reduction. While this report
                        emphasizes competition, it also leaves open on-ramps to simultaneous avenues for
                        engagement, should Beijing finally elect to participate in good faith.

4 | Rice University’s Baker Institute for Public Policy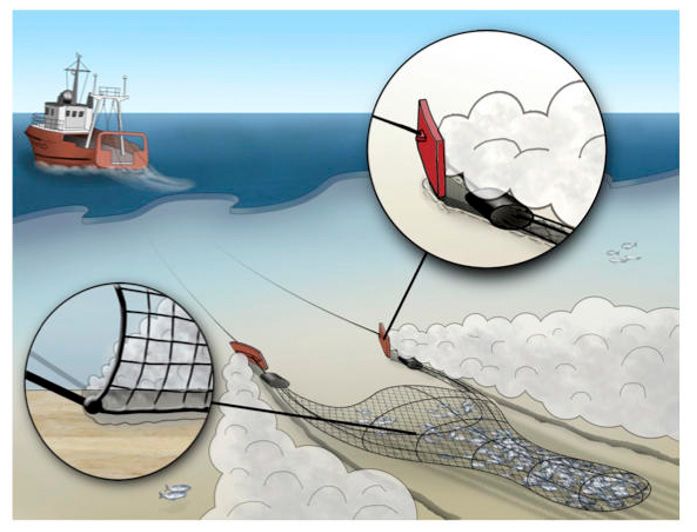
China Pursues Climate Leverage Over
Genuine Cooperation

     “The United States cannot repeatedly challenge China’s rights and
      interests on issues related to Taiwan, Xinjiang, and Hong Kong while
      expecting China to cooperate with it on issues it cares about.”
                   —Wang Yi, State Councilor and Foreign Minister, People’s Republic of China,
                                                                              April 23, 20213

In the unforgiving crucible of world affairs, President Biden and his team face two
outsized global challenges: China’s increasingly aggressive revisionist behavior
and the need to accelerate the global energy transition and reduce emissions. But
to maintain both America’s global power position and global biosphere integrity,
Washington must not allow Beijing to link or leverage the two.

Accordingly, a consequential reckoning looms large. Executive Order 14008 has
enshrined climate and energy transition activities as central elements of American
foreign and national security policy.4 This prioritization heightens the likelihood that
“Team Biden”—with the sincerest of intentions—will fall into the trap behind what we
term “China’s climate cooperation smokescreen.”

Namely, Beijing will seek to either entrap the U.S. government in preliminary
maneuvering and “dialogue” that dangles the amorphous prospect of climate
cooperation negotiations—but only upon the up-front payment by Washington
of concessions on key security and values items—or encourage Washington to
preemptively constrain itself with restrictions that China won’t reciprocate anytime
soon. U.S. climate zeal could, under such conditions, very plausibly compromise vital
American interests up front without corresponding Chinese concessions, let alone
actual commensurate contributions.

Accordingly, this “friend of the court” roadmap explains how President Biden and
his team can and must avoid this train wreck. Divisions have already emerged within
the Democratic Party on how to approach climate diplomacy vis-à-vis China. Dozens
of progressive groups and a progressive contingent in the House and Senate are
increasingly pressuring the White House and fellow legislators to emphasize a
cooperation-first climate agenda, even if that, in practice, means accepting multiple
revisionist PRC actions and substantial human rights violations.5 Meanwhile, John

                                                                    China’s Climate Cooperation Smokescreen | 5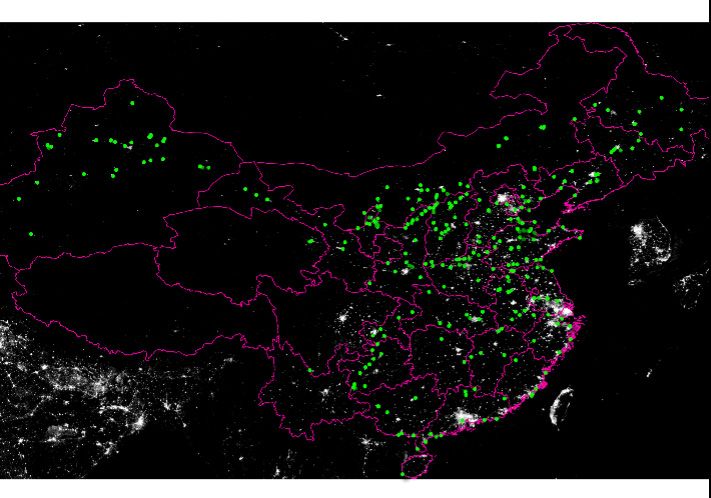
Kerry, the U.S. special presidential envoy for climate, and U.S. Secretary of State
                        Antony Blinken have explicitly promised never to allow such trade-offs.6 Yet the “Road
                        to Glasgow” they emphasize, where the UK will host the 26th UN Climate Change
                        Conference of the Parties (COP26) on November 1-12, 2021, is fraught with peril.

                        The international diplomatic battle is already underway. China’s repositioning from
                        emissions-control opponent a decade ago to establishing a carbon-neutrality plan
                        ahead of the United States in 2020 thus far appears superficially persuasive. It creates
                        the impression of Chinese global leadership on the issue, albeit one that diverges
                        from reality. PRC President Xi Jinping’s December 12, 2020, Climate Ambition Summit
                        speech, marking the Paris Agreement’s fifth anniversary, epitomized this smokescreen.
                        He made no meaningful commitments binding Beijing to specific actions, but he
                        clearly expected binding commitments from Washington. This is a classic example
                        of China under Xi seeking advantage through a second-mover position (e.g., by
                        promising “carbon neutrality” before 2060—a goal the U.S., U.K., and other Western
                        industrialized democracies have committed to reaching by 2050).7 With climate action
                        plans that are often “backloaded” and save the hardest and most expensive steps
                        for future political leaders, a decade-long deferral can mean a lot. At China’s current
                        emissions pace, 10 years could mean 100 billion tonnes of additional CO2 emissions—
                        perhaps more, if offset measures are not implemented in time.

                                                                It also illustrates a second risk dimension:
                                                                Beijing setting a much later date for
         Between 2009 and 2019, China                           significant emissions cuts of its own,
         emitted nearly twice as much                           while goading the U.S. and the EU into
         cumulative CO2 as the United                           serving as the “crash test dummies” for
                                                                ascertaining the extent to which aggressive
         States—a gap likely to widen                           decarbonization generates an economic
         further in coming years.                               hit. If the U.S. and EU successfully transition
                                                                to lower-carbon emissions profiles with
                                                                manageable impacts on economic growth
                                                                and industrial competitiveness, China can
                  cherry-pick “second-mover advantage” practices that work, without having to pay as
                  many of the “growing pains” costs that first movers incur. Conversely, if some of China’s
                  major industrial competitors undermine their position through a transition process that
                  imposes major economic costs, creates energy scarcity, and triggers serious socio-
                  political disruptions, Beijing’s global economic and industrial base advantages would be
                  further entrenched without China having had to incur anywhere near the same costs.8

                        Consider President Biden’s Leaders’ Summit on Climate in April 2021, where he
                        pledged a U.S. emissions reduction of at least 50% by 2030, relative to 2005 levels,
                        as well as a “100 percent carbon pollution-free” power grid by 2035.9 Meanwhile,
                        Chairman Xi reiterated prior, subjective PRC targets—for instance, an intent to “strictly
                        control coal-fired power generation projects, and strictly limit the increase in coal

6 | Rice University’s Baker Institute for Public Policy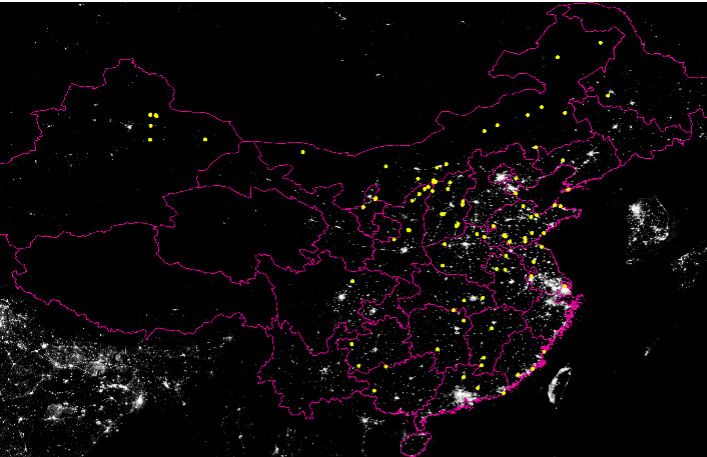
consumption over the 14th Five-Year Plan period and phase it down in the 15th Five-
Year Plan period.”10 In rhetoric, this builds on Xi’s announcement at the Belt and Road
Forum for International Cooperation in May 2017 that “[w]e should pursue the new
vision of green development and a way of life and work that is green, low-carbon,
circular and sustainable.”11

While PRC summit statements may sound meaningful in theory, they crumble under
the weight of the nearly 10 billion tonnes per year of carbon dioxide plus two billion
tonnes or more of other greenhouse gases that China now emits annually, along with
a profusion of toxic pollutants released by its coal combustion.12 China accounts for
approximately 29% of global carbon dioxide emissions (twice the U.S. share—as seen
in Figure 1, below), roughly a third of global PM2.5 particulate emissions (about 10
times the U.S. share), and more than 30% of global mercury emissions (a long-lived
toxic that can poison ecosystems for decades).13

     Figure 1: U.S. and China CO2 Emissions (Million Tonnes)

      10,000

       9,000

       8,000

       7,000

       6,000

       5,000

       4,000
                                                                                          Paris Agreement
       3,000

       2,000

       1,000

          0
                   5

                   7

                  9

                              1

                             3

                             5

                              7

                             9

                              1

                             3

                             5

                              7

                             9

                              1

                             3

                             5

                              7

                             9
                           01

                           03

                           05

                           07

                           09

                             11

                            13

                            15

                            17

                           19
                         197

                         198

                         199
               196

                         197

                        198

                        199
               196

                        197

                        197

                        198

                        198

                        199

                        199
               196

                        197

                       198

                       199

                         20

                        20
                        20

                        20

                       20
                       20

                       20
                       20

                       20

                       20

                                                           U.S.   China

     Source: BP Statistical Review of World Energy 2021.

                                                                          China’s Climate Cooperation Smokescreen | 7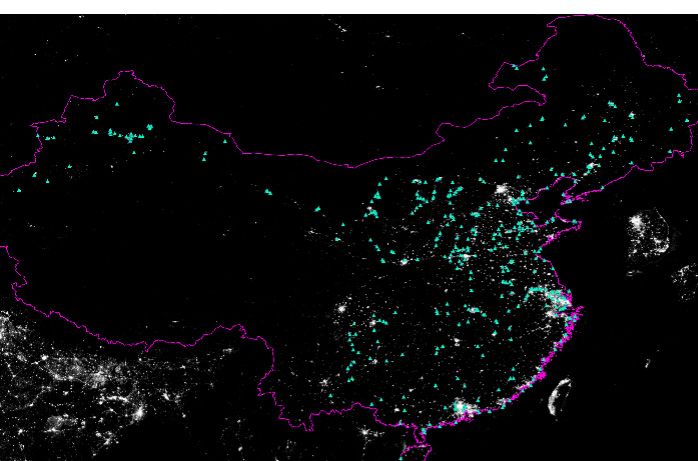
China’s massive annual CO2 flows also mean that it accounts for an increasingly large
                        portion of the world’s atmospheric CO2 stock. Between 2009 and 2019, China emitted
                        nearly twice as much cumulative CO2 as the United States—a gap likely to widen further
                        in coming years. Beijing circa 1979 would have had reasonable moral capital to argue
                        that Washington should cut emissions first. But China in 2019 and beyond has reached
                        a level where the sheer scale of its emissions overwhelms arguments about emissions
                        intensity and treating China as a less-developed country for climate purposes.

                        Indeed, recent research from the Rhodium Group finds that in 2019, China’s
                        emissions of the six key greenhouse gases covered by the Kyoto Protocol—carbon
                        dioxide, methane, nitrous oxide, hydrofluorocarbons, perfluorocarbons, and sulfur
                        hexafluoride—exceeded the emissions of all developed countries combined.14
                        Meanwhile, “since the Paris accords, China has produced more greenhouse gases
                        than the combined total of cuts by Europe and the United States.”15 Moreover, policy
                        incentives in China are set to keep coal a core energy source for decades to come,
                        yielding even more future emissions. And, as will be discussed later, fully factoring
                        in the lifecycle impacts of energy sources and related technologies reveals China’s
                        leading emissions impact and continued coal-centricity in even starker relief.

                        Even if China’s leadership made emissions reduction its top priority—an unlikely
                        shift given the countervailing incentives that will be explored later in this report—the
                        sheer scale of the task is astounding. To reach its stated target of reducing emissions
                        intensity by 60%–65% relative to 2005 levels, it would need to attain the current U.S.
                        level—albeit on a significantly larger scale, in a country that consumes 1.5 times as
                        much primary energy, and in one that is far more coal-reliant.16 For perspective, China
                        would have to bring its economy-wide emissions intensity down from the current level
                        of approximately 73 kilograms (kg) of CO2 per million British thermal units (BTU) of
                        primary energy consumed (about the same as burning crude oil) to an economy-wide
                        level equivalent to burning natural gas—which is where the United States is now after
                        many years of major investments in natural gas and renewables (Figure 2).

                        It has been nearly a century since the United States relied on coal to the proportional
                        extent that China still does today. America now obtains almost 10% of its primary
                        energy from almost-no-carbon nuclear energy (an order of magnitude more than
                        China’s proportionate share), 34% from natural gas, nearly 13% from “scalable”
                        renewables (i.e., wind and solar), and less than 10% from coal—a sixth of China’s
                        relative level.17 Even if China were able to accomplish the Herculean energy sector
                        rewiring needed to reach the current U.S. emissions intensity level, the underlying
                        continued use of coal and likely growth in energy usage could still realistically leave
                        its absolute carbon emissions similar to the present level of nearly 10 gigatons a year.
                        “Holding steady” will be hard enough, and approaching net-zero will likely be an
                        order of magnitude more difficult.

8 | Rice University’s Baker Institute for Public Policy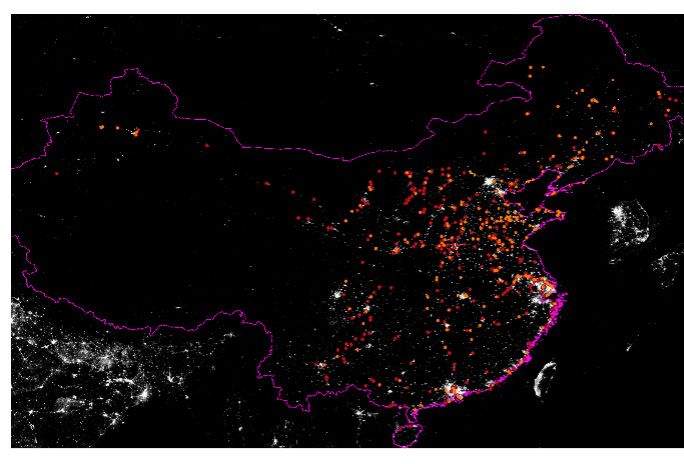
Figure 2: Kilograms of CO2 Emitted Per Million (MM) BTU of Primary Energy
     Consumed

     100
                                                Coal: 95.35 CO2 / MMBTU

      90

      80
                                             Crude oil: 74.54 kg CO2 / MMBTU

      70

      60
                                            Natural Gas: 53.07 kg CO2 / MMBTU

      50

                                                                        China’s long-term carbon intensity reduction target
      40

      30

      20

      10

       0
               5

               7

              9

                        1

                        3

                               5

                                       7

                                      9

                                               1

                                               3

                                               5

                                               7

                                               9

                                                                 1

                                                                 3

                                                                 5

                                                                 7

                                                                 9

                                                                01

                                                                03

                                                                05

                                                                07

                                                                09

                                                                                                       11

                                                                                                      13

                                                                                                      15

                                                                                                                   17

                                                                                                                  19
                     197

                                            198

                                                              199
           196

                                   197

                                           198

                                                             199
           196

                    197

                            197

                                           198

                                           198

                                                             199

                                                             199
           196

                                   197

                                           198

                                                            199

                                                                                                    20

                                                                                                                20
                                                                                                    20

                                                                                                    20

                                                                                                                20
                                                            20

                                                            20
                                                            20

                                                            20

                                                            20

                                                     U.S.      Norway          China

     Sources: BP Statistical Review of World Energy 2021; EIA (U.S. Energy Information Administration);
     authors’ analysis.

Even if China’s per capita emissions—already higher than those in Italy and the U.K.—
are still lower than those of some OECD countries, the relative basis becomes much
less meaningful when nearly one in every three tonnes of anthropogenic CO2 entering
the atmosphere now comes from the PRC. Moreover, present policy incentives in
China are poised to keep coal a core energy source for decades to come, leading
to massive future emissions. In theory, the PRC government could impose stricter
reductions. Yet, the far likelier outcome is that the CCP will treat a tragedy of the
global atmospheric and oceanic commons as the lesser evil in its unrelenting quest to
retain a monopoly on political control domestically and deference abroad.

                                                                                   China’s Climate Cooperation Smokescreen | 9
The implications for U.S. policy in coming years are therefore stark: Any
accommodations or self-limitations made to coax China to discuss climate issues would,
in fact, make America, East Asia, and the world lose twice. America would weaken its
economy and stress its social fabric while forfeiting its ability to effectively confront
China’s ongoing coercive envelopment efforts in the Indo-Pacific, as PRC interlocutors
stall at the negotiating table. Meanwhile, existing coal-fired plants in China and those
being built by Chinese firms abroad would continue to emit millions of tonnes per day
of additional greenhouse gases. The CCP would win on the geopolitical front, but all
parties would ultimately lose from degradation of our shared biosphere.
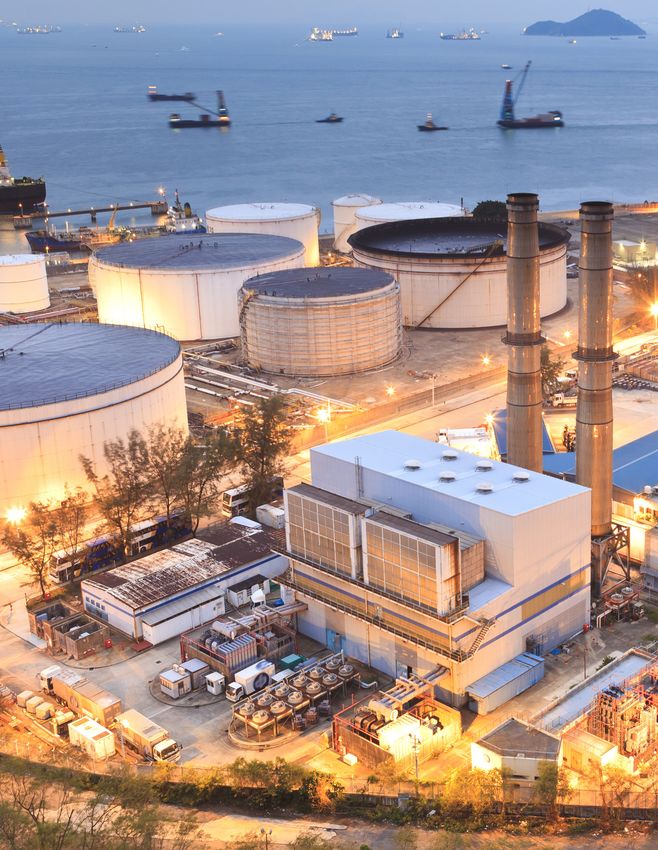
China Talks Green, but Runs on Coal
The coal numbers the PRC keeps burning domestically fly in the face of its
environmental rhetoric to the outside world. China’s economic growth model depends
on tera-scale industrial activity that cannot be operated competitively without reliable,
affordable energy supplies. An infrastructure-building juggernaut fed by emissions-
intensive industries remains the central pillar of China’s economy—including its post-
pandemic economic recovery attempts. On both accounts, coal provides the reliable
and affordable baseload energy needed.
PRC officials talk green abroad but burn coal at home to power their industrial
economy and political position. In 2020, blast furnaces and mills in China produced
over a billion tonnes of crude steel—a historic high.18 Aluminum smelters in China also
produced record volumes during 2020, while cement plants baked nearly 2.4 billion
tonnes of product—each accounting for nearly 60% of total global production of their
respective commodities.19 This was powered, in part, by China’s consuming over four
billion metric tonnes of coal—55% of all coal consumed globally in 2020.20
Thanks to this constant coal consumption course, China was the only major industrial
power whose emissions actually rose in 2020, as policymakers leaned on “King
Coal” to power economic recovery. And emissions-intensive industries are not just
a temporary lifeline to growth during the pandemic. Rather, they exemplify the
Chinese economy’s deep structural reliance on massive brick-and-mortar projects
and the carbon-belching basic materials sectors that feed the resulting skyscrapers,
rails, roads, bridges, airports, and power plants. Beijing reaches quickly for coal to
dial up economic output, but it will likely move much more slowly to moderate its
dependency—particularly as growth slows or sputters in coming years.21
History shows that even with less consequential emissions, economic expedience
(and the underappreciated power of local officials) still often trumps the country’s
international climate commitments. As just one example, Beijing has repeatedly
backslid on binding commitments it made when it ratified the Montreal Protocol
30 years ago, agreeing to reduce—and eventually eliminate—emissions of ozone-
10 | Rice University’s Baker Institute for Public Policydestroying, heat-trapping chlorofluorocarbons (CFCs). Even as a “developing
country,” it still needed to end the production and use of multiple CFC varieties
by January 2010. Yet, multiple independent scientific inquiries have found that
not only have production and emissions of CFCs (and their chemical cousin,
hydrochlorofluorocarbons—HCFCs) continued in China, but that emissions actually
rose after 2010—all despite Beijing’s pledge in 1991 to phase them out entirely.22 The
global biosphere likely cannot afford China requiring a 30-plus year cushion to peak
and the meaningfully reduce emissions from coal use.
The CCP’s concerns over environmental degradation have clearly grown in recent
years, particularly for the most visible, publicly controversial manifestations. However,
this has motivated a focus on reducing localized air pollution in first-tier coastal cities,
typically through approaches that have failed to meaningfully reduce net national
greenhouse gas emissions. Moreover, environmental policies must be implemented
along a continuum of priorities that frequently shifts in its middle and bottom portions
but is consistently dominated at the top by economic prerogatives that the Party
leadership equates with its ability to maintain power. As just one contemporary
example, consider that China’s ongoing
economic recovery is led by industrial
production and real estate investment:
the same two sectors it has relied on to
Beijing has repeatedly backslid
generate growth for more than a decade,
despite consistent calls for restructuring.23
on binding commitments it made
when it ratified the Montreal
And activity may be poised to expand in Protocol 30 years ago, agreeing
the coming several years. Excavator sales, to reduce—and eventually
one of the best indicators of real economic
eliminate—emissions of ozone-
activity in China, reached a historic high in
2020 (Figure 3). Some of this represents
destroying, heat-trapping
fleet recapitalization. But, even accounting chlorofluorocarbons (CFCs).
for that, the sales numbers are still
remarkably high.
Heavy equipment buying sprees suggest that local contractors, the best-positioned
of anyone outside government to anticipate future construction plans, see major
new projects on the horizon. This, in turn, portends substantial further production of
steel, cement, and other high-emissions commodities in coming months and years.
Furthermore, if China adheres to previously stated plans to have its carbon emissions
peak by 2030, it is sandbagging the international community by creating a higher
baseline from which future “peak carbon” would be measured.
Certain heavy industrial activities—such as cement and steel production—involve
direct combustion of coal to provide process heat,24 while others are very electricity-
intensive. Yet, even greater electrification will not push coal out of China’s energy
China’s Climate Cooperation Smokescreen | 11Figure 3: Excavator Sales in China Hit a Historic High in 2020
12-mo. Rolling Avg. Domestic Excavator Sales
40,000
35,000
30,000
25,000
20,000
15,000
10,000
5,000
0
7
No 7
Ap 7
Sep 8
Sep 8
9
De 9
Ma 9
10
0
1
11
-12
12
3
-13
-14
-14
Ma 4
15
5
6
16
-17
-17
17
8
-18
-19
-19
Ma 9
20
0
1
r-1
r-2
-0
-0
0
r-1
t-1
1
-0
-0
0
r-1
1
r-0
-0
r-1
t-1
t-2
g-
v-
v-
y-
c-
g-
c-
y-
v-
y-
c-
Jan
Jun
Jun
Sep
Feb
Jul
Feb
Jul
Sep
Ma
Jan
Jun
Jul
Au
Oc
Ap
Ma
Ma
Oc
Ap
No
De
No
De
Au
Oc
Sources: China Construction Machinery Association; Xinhua; authors’ analysis.
system. Under certain assumptions, electrification could actually entrench coal
use, since efficiency losses in power generation mean that an industrial facility that
formerly burned coal directly for process heat but now uses electric boilers could
require more than twice as much coal to apply the same ultimate heat load in its
facility. Over the last four decades and counting, since China became a major global
emitter, coal has formed the bedrock of the nation’s electricity supply, followed
distantly by hydropower (Figure 4).
Two fundamental quandaries dog China’s heavy reliance on basic materials production
as a bedrock of economic activity. First is the diminishing returns in efficiency: Gains
are slowing as world production (often dominated by China) draws closer to basic
thermodynamic limits.25 Second, how can producers obtain affordable and reliable
process heat in sufficient quantities to support world-class production volumes of
steel, cement, and other energy-intensive basic materials? In China, the answer often
circles back to direct or indirect combustion of coal.
12 | Rice University’s Baker Institute for Public PolicyFigure 4: China’s Electricity Supply by Fuel Source (Terawatt hours/TWh)
9,000
8,000
7,000
6,000
5,000
4,000
3,000
2,000
1,000
0
5
6
7
8
9
0
1
2
3
4
5
6
7
8
9
00
01
02
03
04
05
06
07
08
09
10
11
12
13
14
15
16
17
18
19
20
199
198
199
198
199
199
199
199
198
198
199
199
198
199
199
20
20
20
20
20
20
20
20
20
20
20
20
20
20
20
20
20
20
20
20
20
Oil Coal Hydro Wind Nuclear Gas Solar Other
Source: BP Statistical Review of World Energy 2021; authors’ analysis.
Note: One terawatt-hour is approximately the amount of energy contained in the cargo of an Aframax oil tanker
(a ship 250 meters in length).
Two plausible core explanations arise for China’s continuing production of energy-
intensive commodities on a scale unprecedented in human history. Neither augurs
well for Beijing’s dependability as a climate partner. Either (1) China’s central
leadership is being purposefully disingenuous when it says what foreigners hope to
hear while tolerating continued growth in domestic coal use, or (2) key elements of
the central leadership are making aspirational climate commitments but cannot reign
in local and provincial officials whose advancements hinge on largely unrestrained
use of coal, locking in world-scale CO2 and toxics emissions for many years to come.
In either case, allowing Beijing to tie indefinite promises of climate cooperation to
definite forbearance or concessions in other areas of strategic interest, or to motivate
unreciprocated American economic self-limitation, would jeopardize the vital interests
of the United States, its treaty allies, and other regional stakeholders. Any viable
solution must squarely address both dynamics.
China’s Climate Cooperation Smokescreen | 13Beijing Won’t Negotiate Coal Away with
Washington Alone, Today
Multiple structural factors and incentives in China’s political-economic system are
currently on track to keep the CCP treating climate diplomacy as a leverage point
rather than a true space for cooperation—let alone as a basis for making and
delivering on promises. Party control and the desire for political survival and economic
growth, which hinge upon continued coal use, mean that PRC leaders currently aren’t
incentivized to even begin to negotiate coal away. This poses a profound set of
challenges for meaningful bilateral (or multilateral) climate diplomacy.
President Reagan famously remarked amidst U.S.-Soviet arms control negotiations
that he preferred to “trust but verify,” an approach based on reality-tinged optimism
that Moscow’s future actions would be positive. But American and Soviet interlocutors
confronted a problem—the dangers of mounting nuclear weapons stockpiles—wherein
each government could literally negotiate away hundreds or more warheads without
practically undermining its security. This is unfortunately not true when dealing with
China’s coal-centric energy sector and its currently inextricable bonds to the CCP’s
political imperative of delivering growth to help it maintain control and stay in power.
Like virtually all other matters, China’s
climate interactions are subordinate
Like virtually all other matters, to the Party’s quest for control, further
China’s climate interactions are aggrandizement of power, and political
survival.26 A tragic track record looms
subordinate to the Party’s quest for large: Elizabeth Economy and Yanzhong
control, further aggrandizement of Huang have each documented China’s
power, and political survival. extreme air, water, and soil pollution and
their direct linkages to toxic legacies of
CCP control.27 Moving forward, the CCP
faces a profound strategic quandary: Its
social contract with China’s population (growth and stability in exchange for repressed
liberties) yields an addiction to over-investment across the board, as well as to the
coal that still powers most of the enterprise.
Economic expediency will be hard to dislodge as a core driver of PRC decision-
makers’ energy-sourcing calculus. Local officials pursue investments of questionable
efficacy to boost growth figures and other metrics long enough to be promoted to
higher assignment elsewhere. Coal plants under their administrative influence help
their career progression far more than developing climate-friendly, trans-provincial
energy transmission-infrastructure collaborations beyond their direct control. The
14 | Rice University’s Baker Institute for Public Policyrepeated result: investments of questionable efficacy, including additional coal plants,
and green power capacity that is often built to meet targets but ultimately faces
substantial curtailments that keep it off the grid.
These factors directly influence officials’ tolerance for private, parastatal, and state-
owned enterprises’ non-compliance with emissions control targets promulgated by
the central leadership in Beijing—particularly when environmental objectives conflict
with economic growth imperatives.28 With economic growth remaining a paramount
Party priority, China will continue trying to swap cleaner sources into its tera-scale
energy system, but this will remain subordinate to three dominant preoccupations:
(1) ensuring energy supply security amidst source substitution, (2) managing the
relationship between energy affordability and reliability, and (3) minimizing the
disruption that energy transition measures can have upon China’s vast coal production
and use, its value chain, and the millions of workers it employs.
Energy Source Substitution
Undeniably, PRC policymakers face costs and disruptions inherent in transitioning
a colossal energy system that is 50% larger than that of the United States. They are
trying to accelerate source substitution in the world’s largest energy ecosystem as
consumption still expands. An increasing preference for domestically sourced energy
means there are three core possibilities for ensuring stable baseload supplies—coal,
hydro, and nuclear.29
Of these, only coal and nuclear (assuming requisite political will) have the ability to
be expanded at scale and stored onsite in a manner immune to weather events—i.e.,
as coal piles or a long-lived nuclear fuel assembly. Further complicating matters, the
energy sources needed to substitute for coal are either: (1) not being built quickly
enough and are marred by the recent emergency shutdown of a reactor at the Taishan
Plant in Guangdong province—nuclear, (2) running intermittently at low-capacity
factors that require massive investments in backup energy sources—wind and solar, (3)
able to be built quickly, but would subject China’s power grid to risks associated with
commodity import reliance—natural gas, or (4) possibly capable of being scaled up,
but only at substantial environmental and diplomatic cost—hydro.30
The challenge is staggering. Using data from the China Electricity Council, we
estimate that replacing 10% of China’s coal-fired power plants with nuclear energy
would require more than triple the nuclear capacity it has slated to enter service by
2026. Replacing 10% of coal with renewables could require China to install nearly
as much wind capacity as it has built cumulatively to date, or more than 1.5 times
the existing solar generation base—both of which are already the world’s largest.31
Only true leverage can incentivize Beijing to pursue such a heavy lift on the timeline
needed to decisively address a potentially existential set of global climate challenges.
China’s Climate Cooperation Smokescreen | 15Meanwhile, PRC decision-making continues to emphasize coal’s central role. Witness,
for example, Premier Li Keqiang’s remarks to the State Council in October 2019
calling coal a priority “energy resource endowment for China” (“我国以煤为主的
能源资源禀赋”) and urging accelerated development of coal transport and power
transmission infrastructure, as well as promoting mine safety and clean coal efforts.32
Accordingly, the economic and political arithmetic of energy source substitution in
China fundamentally and inexorably traces back to coal. Even briefly examining the
capacity utilization (actual power produced versus theoretical nameplate capacity)
of the core electricity generation sources in China helps illuminate the scale of the
challenge. China presently has about 1,100 gigawatts (GW) of coal-fired power
plant capacity—more than half the global total—which in 2020 ran at about a 50%
utilization rate, according to the China Electricity Council (Figure 5).
Figure 5: Capacity Utilization of Key Electricity Production Sources in China
100%
90%
80%
70%
60%
50%
40%
30%
20%
10%
0
5
6
7
8
9
0
1
2
3
4
5
6
7
8
9
00
01
02
03
04
05
06
07
08
09
10
11
12
13
14
15
16
17
18
19
20
199
198
199
198
199
199
199
199
198
198
199
199
198
199
199
20
20
20
20
20
20
20
20
20
20
20
20
20
20
20
20
20
20
20
20
20
Nuclear Fossil Hydro Wind Solar
Sources: CEC (China Electricity Council); EIA; authors’ analysis.
16 | Rice University’s Baker Institute for Public PolicyIn simple terms, this means that China would need 56 GW of additional nuclear
reactors—which run at roughly 90% capacity utilization—to replace 100 GW of coal
plants. Yet, World Nuclear Association data reveal that China only has about 18 GW
of nuclear capacity under construction and slated to enter service by 2026. That is the
functional equivalent of 32 GW of coal-fired power capacity under current utilization
rates and is actually less than the net coal power station capacity added in 2020 alone.
China is certainly a “build fast” society, but even under the favorable conditions it can
offer, nuclear power stations still entail site selection, planning, and permitting, followed
by a five-to-six year construction period, before they can deliver power to the grid.
Accordingly, even a re-prioritization toward nuclear power that occurred today would
likely not show up as coal-free electrons on the country’s power grid until close to 2030.
Wind and solar present different challenges. They can be built rapidly, but do not
produce reliable baseload power unless integrated with substantial energy storage
capacity (e.g., batteries) or are coupled with thermal power sources that can fill in the
gaps when the wind isn’t blowing or the sun isn’t shining.
Multiple studies have concluded that intermittent renewables can provide stable
baseload power supplies.33 Yet, thus far, the collision between neat computer
simulations and messy real-world energy system realities suggests that going beyond
certain threshold levels of intermittent power in a large industrial economy would, in
fact, likely create costly reliability challenges that could be obscured by the zero fuel
costs of intermittent renewables. “Zero fuel costs” reflect the idea that the owners of
a wind or solar generation facility do not have to pay for the moving air or photons
that allow their assets to generate electricity.
Renewables need energy storage—either batteries, pumped hydro, or throttleable
spinning thermal reserve power (i.e., coal or natural gas-generated electricity
dispatchable on short notice)—to compensate for their intermittent electricity delivery.
This need invokes two distinct levels in a large industrial economy like China’s. On the
first level, smoothing “peaking” energy demands in a system where renewables are one
source in a diverse portfolio can likely utilize a combination of gas-fired “peaker” power
plants (i.e., small, simple-cycle turbine facilities that help meet electricity demand during
periods of maximum usage) and grid scale batteries for short-term balancing.
The second level—a system in which renewables are the chief energy generator—
poses much larger physical and economic challenges. Batteries or other storage
mechanisms must not only handle larger peak management tasks, but they must also
be able to balance variations across a terawatt-scale power system in a country where
multi-day weather disruptions can simultaneously affect major swathes of territory.
Chinese grid planners will likely ask how a high-renewables energy system might have
responded when faced with an event such as the nearly month-long cycle of multiple
snowstorms and severe cold that afflicted Central and Southern China in early 2008.34
China’s Climate Cooperation Smokescreen | 17Figure 6: Levelized Cost of Energy for Various Electricity Sources in United States
2020 ATB LCO Range by Technology for 2018 Based on R&D Financial Assumptions
$0 $50 $100 $150 $200 $250 $300 $350 $400 $450
Levelized Cost of Energy ($/MWh)
Source: NREL (National Renewable Energy Laboratory).
The economic and political costs of building resiliency against infrequent, but
extremely high-impact weather events will be formidable if China moves to use
renewables to substitute for baseload thermal energy sources. As Steve Brick, a
senior advisor to California’s Clean Air Task Force, put it in a 2018 interview with MIT
Technology Review:
The system becomes completely dominated by the cost of storage. You build this
enormous storage machine that you fill up by midyear and then just dissipate it.
It’s a massive capital investment that gets utilized very little. ... You have to pause
and ask yourself: “Is there any way the public would stand for that?”35
To put the matter into an approximate quantitative perspective, consider the impact
of adding 10-hour lithium iron phosphate grid-storage batteries to a wind power
system. Absent an obligation to provide firmly consistent, reliable power supplies,
wind farms’ rapid and relatively uncomplicated construction process, plus their zero
marginal fuel cost, make them a low-cost power source—able to provide power for
as little as $35 per megawatt-hour (Figure 6). But, pairing renewables with associated
utility-scale storage raises the levelized cost of energy supplied by the facility beyond
$100 per megawatt-hour—roughly a three-fold increase.36
While U.S. price levels often do not translate directly into a Chinese domestic
context, they provide a useful directional benchmark as to what would happen if
storage requirements were imposed on wind and solar project developers in the PRC.
18 | Rice University’s Baker Institute for Public PolicyUltimately, coal-fired and nuclear-power generation facilities would suddenly find
themselves even more economically competitive if intermittent renewable facilities
had to internalize the costs of their generation variability by including substantial
storage capacity for new projects. Large power consumers would also likely more
explicitly seek to obtain lower-cost electricity from large baseload projects [i.e.,
“opting out”], which would force the government to either (1) override these rational
economic preferences with mandated power offtake requirements (indirect subsidy)
or (2) increase subventions to continue incentivizing the installation of wind and solar
capacity (direct subsidies).
System balancing challenges and storage costs will be magnified in a market where
electricity demand is likely to grow for some years to come. The world’s “first-mover”
deep decarbonization experiments are now unfolding at the national level in Germany
and the state level in the United States (particularly in California). Decarbonization in
these highly developed marketplaces is primarily a substitution exercise given that
electricity demand has plateaued for years. In China, however, even relatively bearish
projections still suggest that power generation needs could expand by more than
20% over the coming two decades (Figure 7).
Figure 7: China Power Generation to 2040, Actual and Forecast
(Terawatt hours/TWh) 1%, 3%, and 5% annual growth projected
25,000
20,000
15,000
10,000
5,000
0
5
7
9
1
3
5
7
9
01
03
05
07
09
11
13
15
17
19
21
23
25
27
29
31
33
35
37
39
199
198
199
198
199
199
198
199
20
20
20
20
20
20
20
20
20
20
20
20
20
20
20
20
20
20
20
20
China Actual Power Generation, TWh 1% Growth Scenario 3% Growth Scenario 5% Growth Scenario
Sources: BP Statistical Review of World Energy 2021; China Electricity Council; authors’ analysis.
China’s Climate Cooperation Smokescreen | 19Moreover, green economy advocates should note that coal in China is not just
focused on the “old way” of obtaining energy. Behind picturesque portrayals of wind
and solar generation facilities around the world, a largely coal-fired, China-centric
supply chain underpins the global green energy revolution. Activities ranging from
rare earth smelting to electric vehicle (EV) battery production still generally rely heavily
on coal power.
Indeed, EV batteries and components exported from China require significant energy
inputs, which often come from coal.37 A study by Argonne National Laboratory
researchers, who accessed primary data from battery component producers in China,
suggests that a Tesla Model S-sized 100 kilowatt-hour, nickel-manganese-cobalt
battery could embed approximately seven tonnes of thermal coal equivalent worth
of input energy.38 Electric pickup batteries can be twice the size of car batteries, with
those for freight trucks significantly larger still.
Furthermore, EVs are only as clean as the power grid from which they charge.
Accordingly, vehicles plugging into grids with large shares of hydro, nuclear, or
renewable energy will have much lower emissions intensity. Conversely, grids
dominated by coal (the baseline in China), mean that a growing EV fleet is basically
replacing petroleum with coal at approximate emissions parity and with a re-housing
of emissions from car tailpipes in cities to power plant smokestacks that are often
hundreds of kilometers distant. Thus, the global impacts of giga-scale PRC coal use
are poised to continue. A battery-powered electric passenger car using 18 kilowatt-
hours of electricity from China’s power grid, per 100 kilometers (km) driven, would,
with 60% of power coming from coal, emit approximately 13.5 kg of CO2.39 For
comparison, a Great Wall Haval H6 SUV (China’s 2020 bestseller), consuming seven
liters of gasoline per 100 km driven, would emit 16.5 kg of CO2 over that same
distance.40 Thus, one million EVs could still create CO2 emissions on par with more
than 800,000 SUVs under China’s present national power generation mix.
De-carbonizers thus will likely have to chase a gargantuan moving target and try
to change China’s carbon-intensity course by capturing both incremental demand
growth and replacing legacy installed infrastructure—tasks that, by themselves, are
already extremely challenging. The CCP can marshal the resources to overcome such
complexity and scale, but doing so would require substantial financial resources and—
critically for climate issues—time.
20 | Rice University’s Baker Institute for Public PolicyEconomic Costs, Climate, and Possible Geological Disadvantages
A viable path to a net-zero emissions profile by the 2050–2060 timeframe will likely
require pursuit of what Princeton University’s Net-Zero America project calls the “six
pillars” approach. The respective pillars are: (1) development of increased efficiency
and greater electrification, (2) reduction of electricity production’s carbon intensity, (3)
expanded use of zero-carbon fuels, (4) implementation of CO2 capture and storage,
(5) reduction of non-CO2 greenhouse gas emissions, and (6) greater use of natural
carbon sinks through forest management and improved agricultural practices.41
Net-Zero America emphasizes using existing technologies, rather than predicating
achievement of emissions targets on the successful deployment of technologies that
may not even exist at the present time. Nevertheless, energy transition costs appear
formidable. Its high-electrification (“E+”) scenarios in the United States could require
$2.6 trillion worth of supply-side capital investment by 2030 and $10 trillion by 2050.
Readers should note that the models that yielded these estimates do not include
demand-side capital investments—of which electric vehicles are but one example.
Such omissions can lead to a substantial understatement of energy transition costs.
The models also assume perfect foresight and seamless integration—which are
exceedingly unlikely to actually occur in the real world amidst the complex physics,
chemistry, economics, and politics of the energy transition in a large, industrialized
society.42 Furthermore, China’s energy system is 1.5 times larger than America’s in pure
consumption terms. While the cost figures might not directly translate, extrapolating
the projected price tag of the American energy transition likely underestimates the
total cost that would be incurred for China to move closer to net-zero, particularly
given the relative disadvantages imposed by its geography and energy structure.
Emissions-neutral synthetic fuels are one example of an area where China will likely
be severely disadvantaged. Various U.S. scenarios for such fuels could require as
many as 1.2 billion tonnes of biomass feedstock per year—a feasible target given the
abundance of arable land, the supporting water supplies, and the lack of competition
with food crops in an extraordinarily grain-abundant nation.43
For China, in contrast, directing scarce arable land and water resources to biomass
cultivation would risk exacerbating the already-fraught competition between the
production of food and fuels. For most of the past 20 years, China’s grain supply
deficit, as measured by simple subtraction of tonnage consumed from tonnage
produced domestically, has risen (Figure 8). Famine and grain supply problems helped
topple at least five of China’s 17 dynasties, and the strong correlation between food
supply disruptions and regime change keeps the CCP tightly focused on ensuring
sufficient grain supplies.44
China’s Climate Cooperation Smokescreen | 21Figure 8: China’s Grain Supply Deficit has Increased for 20 Years Running
100,000
Units = ‘000 Tonnes
50,000
0
-50,000
-100,000
-150,000
-200,000
0
2
4
6
8
0
2
4
6
8
0
2
4
6
8
0
2
4
6
8
00
02
04
06
08
10
12
14
16
18
20
196
197
198
199
196
197
198
199
196
197
198
199
196
197
198
199
196
197
198
199
20
20
20
20
20
20
20
20
20
20
20
Corn Soybeans Rice Wheat
Sources: USDA (U.S. Department of Agriculture); authors’ analysis.
China’s emissions reduction plans also suggest that the bulk of the effort and cost
are “backloaded”—i.e., saved largely for future generations of cadres to implement.
In addition to kicking the political can down the road, backloading also increases
the risk that the greatest energy sector reform costs coincide with the period when
demographic pressures and other anti-growth factors are imposing significantly
intensified constraints and challenges relative to current levels.
22 | Rice University’s Baker Institute for Public PolicyManaging Economic Impacts of an Energy Transition
Away from Coal
Despite Xi’s centralization of power, it will be incredibly hard to get China off the
coal-for-growth treadmill. Local officials readily tap into coal to boost growth figures
and other metrics long enough to be promoted to a higher assignment elsewhere.
Amplifying the continued carbon-dependency, officials prefer local solutions within
their jurisdiction over more climate-friendly, trans-provincial energy optimization that
would place more of the supply chain beyond their control.
When officials engage in these practices contrary to Beijing’s directives, the center
often finds it difficult to fully exert its will. As we put it in our Foreign Affairs essay,
“Efforts to change China’s colossal energy system in an acceptable timeframe will work
only if the interests of power brokers at the local, provincial, and national levels are
broadly aligned.”45 A Chinese idiom summarizes the challenge even more succinctly: “a
powerful dragon cannot repress a local snake” (强龙不压地头蛇). To be more precise,
the powerful CCP dragon must make local snake repression one of its few foremost
priorities, or else rapid systemic energy evolution will not actually succeed.
Economic factors intensively shape the alignment of interests among China’s various
levels of government on coal and emissions policy issues. Shanghai, Guangdong,
and other wealthy coastal areas do not mine much coal and only a tiny sliver of their
workforces draws paychecks from the coal sector. For those provinces, coal-fired
powerplants are an eyesore and “lung sore” that also occupy scarce real estate
that could be used for more valuable (i.e., tax base-boosting) purposes. The coastal
economic powerhouses still need abundant energy, but coal increasingly comes in by
“wire” (via ultra-high-voltage power lines) from plants hundreds of kilometers distant.
Geospatial analysis of how coal plant siting has evolved over time across China
illustrates how “Coastal metropolises’ eyesores are Northwest and rural China’s
employers.” The images below plot (1) operational coal plants in China in 2008, (2)
plants added between 2009 and 2014, (3) plants added between 2015 and 2020, and
(4) plants currently under construction.
Satellite images of light emissions offer a proxy for areas of human habitation and
shows how, relative to the orange and red dots representing coal-fired power plants
circa 2008, coal plant additions have increasingly emphasized (1) locations further
from major cities, and (2) siting closer to major coalfields in Northwest China/Xinjiang.
Neither trend reflects an overall decline in coal use. The “black rock” remains critically
important to China’s energy system and its location of combustion and conversion
into electrons is simply being geographically reshuffled.
China’s Climate Cooperation Smokescreen | 23Figure 9: China Coal Plants are Being Located Further from Cities (Marginal Additions)
1 2
3 4
Sources: GADM; Global Energy Monitor; NASA; authors’ analysis.
Notes: Images’ underlayer comes from NASA’s Earth at Night satellite showing lights. Images chart marginal
incremental (not cumulative) additions. Hence, Image 3 depicts peak new coal plants added, not Image 4.
Coal use and greenhouse gas emissions can only be addressed through a
fundamental rewiring of the CCP’s relationship with China’s citizenry and the personal
ambitions of Xi and his successors. The current course is clear: despite green rhetoric,
coal plant construction in China continues to occur at a world-leading giga scale.
According to the Global Energy Monitor, China had an additional 88 GW of additional
domestic coal-fired plants under construction as of year-end 2020, equivalent to more
than one-third of the United States’ entire existing coal-fueled generation capacity.46 If
these plants enter service and operate for four decades, they could collectively burn
more than six billion tonnes of coal. This would come atop an existing fleet of nearly
3,000 coal-fired units that could very plausibly burn more than 50 billion tonnes of
coal by the time they reach the end of an assumed 40-year service life.
24 | Rice University’s Baker Institute for Public PolicyAdding coal plants abroad built—and planned—by PRC firms as part of the Belt and
Road Initiative (BRI) suggests a further 18 billion tonnes of coal yet to be burned.
And that amount does not even account for China’s vast fleet of industrial boilers, at
least 500,000 of which were coal-fired as of late 2018. The bottom line: without major
changes—few to none of which will be driven by bilateral American pressure—China’s
net additional “coal to be burned” could realistically exceed 100 billion tonnes by
2045–60. That’s enough to bury all five boroughs of New York City under a 340-foot
(104-meter)-tall pile.
Burning a metric ton of bituminous coal emits approximately two metric tons of CO2,
according to U.S. Energy Information Administration data. To put the potential effects
of China’s future carbon dioxide emissions in perspective, Earth’s atmosphere has an
estimated mass of five quadrillion (million billion) tonnes. Each five billion tonnes of
additional net CO2 emissions would thus raise the global level by one part per million.
As of May 2021, instruments located at Hawaii’s Mauna Loa Observatory showed the
atmospheric CO2 concentration to be just under 420 parts per million.47 An additional
100 billion tonnes of coal burned in China could thus raise atmospheric CO2 levels by
nearly 10% relative to today’s levels.
Long Shot: Could China Use Carbon Capture to
Balance Coal Reliance and Emissions Reductions?
Capturing and storing carbon offers a path to move coal-fired power plants toward
carbon neutrality. It would potentially help mitigate some of the economic impacts
that would come from de-emphasizing coal and allow China to continue utilizing
a reliable, domestically available energy resource. Carbon capture, utilization, and
storage (CCUS) would also appeal to the Chinese leadership’s persistent propensity
to try to engineer its way past physical challenges—a legacy arguably dating back
thousands of years to the earliest dynasties.48 Yet in keeping with this report’s broader
theme, China’s significant CCUS opportunity faces a formidable set of implementation
challenges. Efforts to date won’t offset much, and Beijing doesn’t yet show evidence
of a willingness to make the enormous investments needed to scale up storage
meaningfully—an endeavor that would take many years to reach a systemically
impactful scale.
Deep saline aquifers are a preferred CO2 sequestration option. China has them in
abundance, favorably located near the coal-rich zones toward which the country’s
coal-fired power plants are increasingly migrating. Research suggests that the Tarim
and Zhunggar basins in Xinjiang combined could sequester more than 300 billion
tonnes of CO2, the Ordos Basin nearly 130 billion tonnes, and the Qaidam Basin in
Qinghai roughly 125 billion tonnes.49
China’s Climate Cooperation Smokescreen | 25You can also read