REGIONAL OVERVIEW OF FOOD SECURITY AND NUTRITION - NEAR EAST AND NORTH AFRICA 2020
←
→
Page content transcription
If your browser does not render page correctly, please read the page content below
2020

NEAR EAST AND NORTH AFRICA
     REGIONAL
 OVERVIEW OF
FOOD SECURITY
AND NUTRITION
        ENHANCING RESILIENCE OF
           FOOD SYSTEMS IN THE
                   ARAB STATES
This flagship publication is part of Regional Overview of Food security and nutrition in the Near East and North Africa series of the
Food and Agriculture Organization of the United Nations.

Required citation:
FAO, IFAD, UNICEF, WFP, WHO and ESCWA. 2021. Regional Overview of Food Security and Nutrition in the Near East and North
Africa 2020 - Enhancing resilience of food systems in the Arab States. Cairo, FAO. https://doi.org/10.4060/cb4902en

The designations employed and the presentation of material in this information product do not imply the expression of any opinion whatsoever
on the part of the Food and Agriculture Organization of the United Nations (FAO), the International Fund for Agricultural Development (IFAD),
the United Nations Children’s Fund (UNICEF), the World Food Programme (WFP) or the World Health Organization (WHO) concerning the
legal or development status of any country, territory, city or area or of its authorities, or concerning the delimitation of its frontiers or boundaries.
The mention of specific companies or products of manufacturers, whether or not these have been patented, does not imply that these have been
endorsed or recommended by FAO, IFAD, UNICEF, WFP or WHO in preference to others of a similar nature that are not mentioned.

The designations employed and the presentation of material in the maps do not imply the expression of any opinion whatsoever on the part of
FAO, IFAD, WFP, UNICEF, WHO or ESCWA concerning the legal or constitutional status of any country, territory or sea area, or concerning
the delimitation of frontiers.

All reasonable precautions have been taken by FAO, IFAD, WFP, UNICEF, WHO and ESCWA to verify the information contained in this
publication. However, the published material is being distributed without warranty of any kind, either expressed or implied. The responsibility
for the interpretation and use of the material lies with the reader. In no event shall FAO, IFAD, WFP, UNICEF, WHO and ESCWA be liable for
damages arising from its use.

ISBN 978-92-5-134471-2 [FAO]

© FAO, 2021

Some rights reserved. This work is made available under the Creative Commons Attribution–NonCommercial–ShareAlike 3.0 IGO licence (CC
BY–NC–SA 3.0 IGO; https://creativecommons.org/licenses/by–nc–sa/3.0/igo).

Under the terms of this licence, this work may be copied, redistributed and adapted for non–commercial purposes, provided that the work is
appropriately cited. In any use of this work, there should be no suggestion that FAO endorses any specific organization, products or services.
The use of the FAO logo is not permitted. If the work is adapted, then it must be licensed under the same or equivalent Creative Commons
licence. If a translation of this work is created, it must include the following disclaimer along with the required citation: “This translation was
not created by the Food and Agriculture Organization of the United Nations (FAO). FAO is not responsible for the content or accuracy of this
translation. The original English edition shall be the authoritative edition.”

Any mediation relating to disputes arising under the licence shall be conducted in accordance with the Arbitration Rules of the United Nations
Commission on International Trade Law (UNCITRAL) as at present in force.

Third–party materials. Users wishing to reuse material from this work that is attributed to a third party, such as tables, figures or images, are
responsible for determining whether permission is needed for that reuse and for obtaining permission from the copyright holder. The risk of
claims resulting from infringement of any third–party–owned component in the work rests solely with the user.

Sales, rights and licensing. FAO information products are available on the FAO website
(www.fao.org/publications) and can be purchased through publications–sales@fao.org.
Requests for commercial use should be submitted via: www.fao.org/contact–us/licence–request.
Queries regarding rights and licensing should be submitted to: copyright@fao.org.

COVER PHOTOGRAPH ©FAO/ALESSANDRA BENEDETTI

SYRIA. Syrian women visit the goat cheese producer farm.
2020
     NEAR EAST AND NORTH AFRICA
        REGIONAL
    OVERVIEW OF
   FOOD SECURITY
   AND NUTRITION
                            ENHANCING RESILIENCE OF
                               FOOD SYSTEMS IN THE
                                       ARAB STATES

                          Published by
   the Food and Agriculture Organization of the United Nations
         International Fund for Agricultural Development
                 United Nations Children’s Fund
             United Nations World Food Programme
                   World Health Organization
                              and
United Nations Economic and Social Commission for Western Asia

                          Cairo, 2021
CONTENTS

FOREWORD                                            v              2.3. Analysis of major vulnerabilities and resilience
ACKNOWLEDGEMENTS                                  vii              capacities of food systems                           41
ACRONYMS AND ABBREVIATIONS                        viii                 2.3.1 Impact of shocks and stresses on Arab food
COUNTRY AND TERRITORY ABBREVIATIONS                 x                  supply chains                                 41
KEY MESSAGES                                       xi
                                                                       2.3.2 Impact of shocks and stresses on the Arab
                                                                       food environment                              43
PART 1
RECENT TRENDS IN HUNGER, FOOD INSECURITY AND                           2.3.3 Impact of shocks and stresses on consumer
MALNUTRITION                                        1                  behaviour influenced by individual filters   51
1.1 Progress towards hunger and food insecurity
targets                                             5              2.4 Analysis of policy responses to food systems’
                                                                   resilience in the Arab Region                     52
1.2 Progress towards global nutrition targets     11
                                                                       2.4.1 Which policies address food system
                                                                       resilience in the Arab Region?                 52
PART 2
ENHANCING THE RESILIENCE OF FOOD SYSTEMS IN THE                        2.4.2 Recommended policy approaches and
ARAB REGION                                    20                      actions                                 56
2.1 Conceptual framework for assessing food
                                                                   2.5 Overall conclusions: linking food security and
systems’ resilience                            22
                                                                   nutrition data with food systems and resilience
    2.1.1 Why a food systems approach? What are
                                                                   capacities                                         58
    the complex relationships between different food
    system components?                             22
                                                                   ANNEXES                                             60
    2.1.2 Food systems’ resilience: concept and
    indicators                                    24               REFERENCES                                          66

2.2 How shocks and stresses worsen food security
and nutrition in the Arab Region, contributing to
rising hunger and malnutrition                    27
    2.2.1 Shocks to Arab food systems: a review of
    evidence and impact                          28
    2.2.2 What are the main stresses in the Arab
    food system?                                 36

                                                         | iii |
TABLES, FIGURES AND BOXES

 TABLES                                      12 Travel and tourism, share of GDP           8 Health costs of various diets in the
                                             and change in international tourist           Arab Region                            47
1 SDG and WHA targets and                    arrivals, % over previous year      34
indicators                              3                                                  9 Predicted reduction by 2030 in the
                                             13 IMF estimates and projections for          social cost of GHG emissions from the
2 Prevalence of undernourishment in the      GDP growth in 2019, 2020 and 2021,            adoption of plant-based diets       48
Arab Region and sub-regions,                 % growth over previous year        35
2007/09-2017/19 and 2028/30
projection (%)                       7       14 Affordability of three reference diets
                                             in the Arab states, 2017             45       BOXES
3 Number of undernourished in the
Arab Region and sub-regions, 2007/09-        15 Projections of the annual cost of
                                                                                           1 The two main SDG 2 indicators of
2017/19 and 2028/30 projection               current diets in the Arab Region by
                                                                                           hunger and food security           4
(million)                          8         2030, USD billion                    49
                                                                                           2 Definitions and consequences of the
4 Prevalence of people affected by           16 Sustainability scores for 10 Arab
                                                                                           main nutritional status indicators for
food insecurity in the Arab Region and       countries plus New Zealand and the
                                                                                           children under 5                       13
sub-regions, 2014/16-2017/19 (%) 9           United States of America             50
                                                                                           3 Approaches for measuring food
5 Number of people affected by food                                                        system resilience               27
insecurity in the Arab Region and sub-
                                             FIGURES                                       4 Methodology for estimating the cost
regions, 2014/16-2017/19 (million) 10
                                                                                           of healthy diets                   44
6 Children’s nutritional status for Arab     1 Prevalence of undernourishment in the
                                                                                           5 An approach to estimating hidden
Region and public health significance,       Arab Region, 2000-02 to 2017-19, and
                                                                                           health and environmental costs of diet
latest year                             12   projection to 2028–30                6
                                                                                           patterns                             46
7 Selected WHA indicators of maternal        2 Histogram of adult obesity prevalence
                                                                                           6 Diets and health risks in GCC
and infant nutrition and non-                in the Arab Region, 2016            15
                                                                                           countries                            51
communicable disease for the Arab
                                             3 Conceptual framework of a food
Region latest estimates)          14
                                             system                           23
8 Prevalence of childhood stunting,
                                             4 Simplified model of resilience for food
wasting and overweight: latest year,
                                             systems showing the function of
WHA target and trend                 16
                                             resilience capacities                 25
9 Prevalence of anaemia in women of
                                             5 Resilience and sustainability:
reproductive age and adult obesity:
                                             complementary concepts (Tendall, et al.,
base year, WHA target and trend 17
                                             2015)                               26
10 Climate change effects in the Arab
                                             6 Wheat production, net imports and
Region: record maximum average
                                             self-sufficiency ratios in selected Arab
temperature years and warming since
                                             countries, 2015-17                       31
1960                               29
                                             7 Prices for United States of America
11 The impact of fluctuating oil prices
                                             hard red winter wheat and crude oil,
on government finances in the Arab
                                             real 2010 USD per tonne              32
Region                                33

                                                                | iv |
FOREWORD

The 2020 Regional Over view of Food Securit y                137 million people, did not have reg ular
and Nutrition in the Near East and North                     access to sufficient, safe and nutritious
Africa (NENA) Region provides an update                      food. Food insecurit y, affecting diet qualit y
on regional progress towards two targets of                  and quantit y, poses significant challenges
Sustainable Development Goal 2 (SDG 2):                      to achieving global nutrition targets.
Target 2.1, ending hunger and achieving food                 Many countries in the region still show high
securit y; and Target 2.2, on ending all forms               levels of stunting and overweight in children
of malnutrition. It is the result of collaboration           under 5 years of age. Though there are
between the Food and Agriculture                             insufficient data to establish clear childhood
Organization of the United Nations (FAO), the                malnutrition indicators in all countries, 2019
Economic and Social Commission for Western                   trends indicated that only a few countries are
Asia (ESCWA), the International Fund for                     likely to meet the SDG targets for 2030 on
Agricultural Development (IFAD), the United                  stunting (3 out of 22) and wasting (7 out of
Nations International Children’s Emergency                   22), while none are on track to fulfil the W H A
Fund (UNICEF), the World Food Programme                      ( World Health Assembly) targets for 2025.
( W FP) and the World Health Organization                    Furthermore, no countr y in the region is on
( W HO).                                                     track to meet 2025 W H A targets for anaemia in
                                                             women of reproductive age or adult obesit y.
This report examines data available prior
to the Covid-19 pandemic that affected the                   The above trends in hunger, food insecurit y
region and the world in 2020. By 2019, the                   and malnutrition have largely been driven by
Arab Region was already off track to achieve                 conf lict and violence in the region as well as
hunger and nutrition-related SDG targets                     the lack of capacit y for current food systems
by 2030. In fact, after good progress during                 to support healthy diets. Food securit y and
past decades, since 2015-17 the number of                    nutrition prospects in the region are likely to
undernourished people in the region has                      worsen in view of the overwhelming economic
been increasing steadily. In 2019, the number                disruptions caused by Covid-19, which has
of hungr y people stood at 51.4 million, or                  generated rising numbers of v ulnerable people
12.2 percent of the region’s population.                     with limited access to healthy, balanced
If such trends continue, even ignoring the                   diets. Given the large disparities among Arab
potential impact of Covid-19, the number                     Region countries in terms of their economic
of undernourished in the region will exceed                  and political situation, as well as resilience
75 million people by 2030.                                   capacities, Covid-19 has had varied impacts
                                                             on food securit y and nutrition. Countries with
The report also highlights that in 2019                      fragile economies and those in protracted crisis
nearly one-third of the region’s population,                 are the worst affected.

                                                     | v |
FOREWORD

This report examines the v ulnerabilit y of                       Ensuring ever yone has access to a healthy diet
Arab food systems to various shocks, natural                      requires sustainable, resilient food systems.
or human-induced, aggravated by stresses                          To move towards more resilient food systems
which limit their resilience capacit y and abilit y               across the Arab Region, this report identifies
to deliver sustainable, healthy diets for all.                    a set of policy directions for adoption while
As the analysis in this report suggests, more                     considering inter-system linkages and local
than half the region’s population cannot                          contexts. These policy directions aim to
afford a healthy diet. Diet qualit y has major                    bolster different food system components,
implications not only for food securit y and                      including food supply chains, the food
nutrition, but also for human health and the                      environment as well as consumer knowledge
environment. The report quantifies the hidden                     and behaviour, while focusing on healthy
costs of unsustainable diets related to health                    diets and their affordabilit y. We believe the
and climate change. The analysis emphasizes                       policy recommendations in this joint report
important linkages of SDG 2 (Zero hunger)                         offer countries of the Arab Region avenues to
with SDG 3 (Good health and well-being) and                       strengthen the sustainabilit y and resilience
SDG 13 (Climate action) and the need to take                      of their food systems and accelerate progress
a broad view of goals and targets to minimize                     towards achieving the goals of the 2030
potential trade-offs and enhance potential                        Agenda for Sustainable Development.
synergies between them.

      Abdulhakim Elwaer                               Dina Saleh                              Ted Chaiban
Assistant Director General/ Regional         Regional Director – IFAD                   Regional Director – UNICEF
        Representative – FAO              Near East, North Africa, Central          Middle East and North Africa Region
 Near East and North Africa Region          Asia and Europe Division

      Corinne Fleischer                      Ahmed Al-Mandhari                                 Rola Dashti
    Regional Director – WFP                  Regional Director – WHO                 Executive Secretary of the Economic
Middle East, North Africa, Central         Eastern Mediterranean Region              and Social Commission for Western
     Asia & Eastern Europe                                                                      Asia – ESCWA

                                                         | vi |
ACKNOWLEDGEMENTS

The Regional Over view of Food Securit y and Nutrition in the Near East and North Africa 2020 was
prepared by the Food and Agriculture Organization of the United Nations (FAO) in close collaboration
with the Economic and Social Commission for Western Asia (ESCWA) , the International Fund for
Agricultural Development (IFAD), the United Nations Children’s Fund (UNICEF), the World Food
Programme ( W FP) and the World Health Organization ( W HO).

Under the overall g uidance of Abdessalam OuldAhmed and Serge Nakouzi, the direction of the
publication was carried out by Jean-Marc Faurès and Richard Trenchard with the overall coordination
and written contribution from Tamara Nanitashvili, all from the FAO Regional Office for the Near East
and North Africa. Rami Zurayk, Professor at the American Universit y of Beirut and David Sedik, Senior
Food Policy Expert, are the principal authors of the report. Ali Chalak, Nathaniel Ferg uson and Joanne
Haddad from the American Universit y of Beirut prepared a background study for the report.

The development of the report was undertaken in close collaboration with representatives from the five
co-publishing partners: Reem Nejdawi and Fidele Byiringiro (ESCWA), Anirban Chatterjee (UNICEF,
Regional Office for Middle East and North Africa), Ayoub Al-Jawaldeh ( W HO, Regional Office for the
Eastern Mediterranean), Alessandra Garbero (IFAD, Near East, North Africa and Europe Division) and
Siemon Hollema ( W FP, Regional Bureau for Middle East, North Africa, Central Asia and Eastern Europe).

Valuable comments and input were provided by: Mohamed Ahmed, Giovanni CarrascoAzzini, Valentina
Conti, Juan Feng, May Hani, Cindy Holleman, Lourdes Orlando, Ahmed Raza, Ahmad Sadiddin, Marco
V. Sánchez Cantillo, Maximo-Torrero Cullen and Monika Tothova (FAO), Fidele Byiringiro (ESCWA),
Maya Atie (ESCWA), Muriel Calo ( W FP), Oscar Ekdahl ( W FP) and Siemon Hollema ( W FP).

The Communication Unit of the FAO Regional Office for the Near East and North Africa supported by
Mariam Hassanien, Angham Abdelmageed and led by Mohamed Alaidaroos coordinated the publishing
process with the support of Jessica Matthewson and other colleag ues. Report revision and proofreading
ser vices were provided by Ferg us Mulligan.

                                                  | vii |
ACRONYMS
AND ABBREVIATIONS

AFED      Arab Forum for Environment and                         GIEWS        Global Information and Early Warning
          Development                                                         System
CFS       Committee on World Food Security                       HLPE         High Level Panel of Experts on Food Security
                                                                              and Nutrition
DEC       dietary energy consumption                             IFAD         International Fund for Agricultural
                                                                              Development
ESCWA     Economic and Social Commission for                     IFPRI        International Food Policy Research Institute
          Western Asia
FAO       Food and Agriculture Organization of the               IMF          International Monetary Fund
          United Nations
FAO RNE   FAO Regional Office for the Near East and              IPCC         Intergovernmental Panel on Climate Change
          North Africa
FAOSTAT   Food and Agriculture Organization                      Kcal         kilocalorie
          Corporate Statistical Database
          Food and Agriculture Organization                      LDC          least developed country
          Corporate Statistical Database
                                                                 ICN2         Second International Conference on
FBDG      food-based dietary guidelines
                                                                              Nutrition

FBS       food balance sheets                                    MENA         Middle East and North Africa

FIES      food insecurity experience scale                       MtCO2-eq metric tonnes of carbon dioxide equivalent

FPMA      food price monitoring and analysis                     MDER         minimum dietary energy requirements

FSIN      Food Security Information Network                      NCD          non-communicable disease

GCC       Gulf Cooperation Council                               NENA         Near East and North Africa

GDP       gross domestic product                                 OECD         Organisation for Economic Co-operation
                                                                              and Development
GBV       gender-based violence                                  PoU          prevalence of undernourishment

GHG       greenhouse gas                                         PPPD         per person per day

                                                      | viii |
ACRONYMS AND ABBREVIATIONS
RIMA Resilience Index Measurement and Analysis UNOCHA United Nations Office for the Coordination
of Humanitarian Affairs
RP resilience principles UNSDG United Nations Sustainable Development
Group
SDG Sustainable Development Goal
UNWTO United Nations World Trade Organization
SFS sustainable food system
USD United States dollar
SSR self-sufficiency ratio
WB World Bank
SBA standby arrangement
WDI World Development Indicators
UNDESA United Nations Department of Economic
WEO World Economic Outlook
and Social Affairs
UNDP United Nations Development Programme WFP World Food Programme
UNHCR United Nations High Commissioner for WHA World Health Assembly
Refugees
UNICEF United Nations International Children's WHO World Health Organization
Emergency Fund
UNIFEM United Nations Development Fund for
Women
| ix |COUNTRY AND
TERRITORY ABBREVIATIONS
A list of countries and territories with names abbreviated in the text
Algeria People's Democratic Republic of Algeria Morocco Kingdom of Morocco
Bahrain Kingdom of Bahrain Oman Sultanate of Oman
Comoros Union of Comoros Qatar State of Qatar
Djibouti Republic of Djibouti Palestine State of Palestine
Egypt Arab Republic of Egypt Saudi Arabia Kingdom of Saudi Arabia
Iraq Republic of Iraq Somalia Somali Republic
Jordan Hashemite Kingdom of Jordan Sudan Republic of Sudan
Kuwait State of Kuwait Syria Syrian Arab Republic
Lebanon Lebanese Republic Tunisia Republic of Tunisia
Libya State of Libya UAE United Arab Emirates
Mauritania Islamic Republic of Mauritania Yemen Republic of Yemen
This year’s report covers a total of 22 Arab States that include 19 NENA countries as well as three additional Arab States: Djibouti, Comoros and
Somalia. Such coverage facilitates an analysis of the Arab States’ group and is consistent with the League of Arab States’ membership that includes
22 member states: Algeria, Bahrain, Comoros, Djibouti, Egypt, Iraq, Jordan, Kuwait, Lebanon, Libya, Mauritania, Morocco, Oman, Qatar, Palestine,
Saudi Arabia, Somalia, Sudan, Syria, Tunisia, United Arab Emirates and Yemen.
| x |KEY MESSAGES
è Since 2015–17 the number of people affected childhood overweight. No country in the region
by hunger in the Arab Region continues to rise. is on track to meet the WHA 2025 targets for
The 2019 estimates show that before the Covid–19 anaemia in women of reproductive age (reducing it
pandemic 51.4 million people were hungry or by half) or adult obesity (halt its rise).
12.2 percent of the population – an increase
of 1.1 million people from the previous period. è Conflict is the main factor behind the degrading
The numbers affected by moderate or severe food hunger situation, but slow progress on nutrition SDG
insecurity also showed an upward trend with an targets is also due to weaknesses in food systems
estimated 137 million people in 2019 who do across the region. Apart from conflict, the region’s
not have regular access to sufficient and nutritious food systems are also affected by other shocks such
food. The trend is mostly driven by an increase in as climate–related shocks, macroeconomic shocks
moderate food insecurity. (e.g. the food price crisis, fluctuating oil prices and
tourism revenues) as well as health–related shocks,
è The NENA Region is not on track to reach exemplified by the Covid–19 pandemic.
the SDG target of Zero Hunger. If recent trends
continue, the number of people affected by hunger è A number of stresses like water scarcity, food
will surpass 75 million by 2030. The impact of import dependency, inequalities including the
Covid–19 on the Region economy will further gender dimension, rapid population growth and
complicate the challenge of achieving the SDG 2.1 migration, and shifting diets associated with the
target to eliminate hunger. move from rural to urban settings exert negative
pressures on food systems and increase their
è The burden of malnutrition in all its forms remains vulnerability. The lack of resilience in food systems
a challenge. Recent estimates for 2019 are that exposed to various shocks and stresses multiplies
22.5 percent of children under 5 years of age the damage caused and negatively impacts on
were stunted, 9.2 percent wasted and 9.9 percent food security and nutrition.
were overweight. With 27 percent of the adult
population obese, the Arab Region ranked second è During the early stages of the Covid–19
in the world for obesity. Estimated anaemia in pandemic, the resilience responses of the region’s
women of reproductive age of 35 percent is a food systems to shocks were numerous and diverse
moderate public health issue in most countries of and have in large part allowed food systems to
the region. continue functioning. But these responses were
limited to the food supply chain, neglecting the
è Very few countries are on track to reach overall food environment and individual level
childhood nutrition targets by 2025 and 2030. filters, consumer choice and diets. These represent
For wasting, only seven countries are on track, a critical link between food security and nutrition
while only three are on track for stunting or outcomes of food systems.
| xi |KEY MESSAGES
è The affordability of healthy diet is a significant è According to estimates in this report, the
challenge given that it currently costs five times adoption of healthy diets in the Arab Region
more than one that only meets dietary energy including sustainability could lead to a 96 percent
needs through a starchy staple. Healthy diets are reduction in diet–related health costs according
unaffordable for more than 50 percent of the to current consumption and to 34–77 percent
region’s population, higher than the global average reduction in the diet–related social cost of GHG
of 38 percent. emissions in 2030. Thus, shifting to healthy diets
will create significant savings that could be invested
è All diets have hidden costs. While healthy now to lower the cost of nutritious foods.
diets are generally more expensive, their hidden
health costs linked to NCDs (non–communicable è Fixing resilience in a way that supports
diseases) as well as climate change costs linked sustainable healthy food systems across the region
to greenhouse gas (GHG) emissions are lower is imperative to end hunger, achieve food security
compared to current consumption patterns in the and improve nutrition. A careful analysis of complex
region. In fact, the full cost of current diets (USD intersystem linkages and their implications on
486 billion by 2030), accounting for hidden health food security and nutrition is critical to implement
and climate change costs, is 20 percent higher than a range of policy actions to shock proof food
that of healthy diets (USD 389.3 billion by 2030). systems and move towards healthier diets that are
affordable for everyone in the Arab Region.
| xii |SYRIA Retail Trader, is selling Tomatoes at Giza street market. ©FAO/Heba Khamis
PART 1
RECENT TRENDS IN
   HUNGER, FOOD
  INSECURITY AND
   MALNUTRITION
PART 1

RECENT TRENDS IN HUNGER,
FOOD INSECURITY AND
MALNUTRITION
In 2015 the world put forward a series of                                          2013. Previous editions of the Regional Over view
development goals designed to achieve a better                                     of Food Securit y and Nutrition in the Near East
and more sustainable future for all. SDG 2 calls                                   and North Africa have discussed extensively
for an end to hunger, achieving food securit y,                                    some of the reasons for the lack of progress on
improved nutrition and promoting sustainable                                       hunger and nutrition (FAO RNE, 2016, 2017,
agriculture by 2030. One–third of the way                                          2018, 2019). Part I.C discusses those targets in
towards the target year, according to current                                      the context of the evidence in Parts I.A and I.B
trends, the NENA region is unlikely to achieve                                     on progress towards SDG 2 hunger, food securit y
the first two SDG 2 targets: ending hunger                                         and nutrition targets.
(SDG Target 2.1) and all forms of malnutrition
(SDG Target 2.2).1 Not only are many countries                                     To implement SDG 2 the 2030 Agenda for
off track, but indicators are trending in the                                      Sustainable Development (UN SDG, 2015)
opposite direction from that needed to meet                                        outlined four indicators to measure fulfilment
those targets.                                                                     (Table 1). SDG Target 2.1 on ending hunger
                                                                                   specifies two indicators and SDG Target 2.2
Part I of the Regional Over view of Food Securit y                                 two indicators to assess fulfilment by 2030.
and Nutrition in the Near East and North Africa                                    In addition, the W H A set out intermediate
considers the latest available estimates of the                                    targets for 2025 on nutrition and NCDs,
SDG 2 indicators and assesses the possibilit y                                     outlined in two action plans on maternal, infant
or otherwise of the Arab Region meeting                                            and young child nutrition ( W HO, 2012) and
countr y–level targets under SDG 2. Part I.A                                       prevention and control of NCDs ( W HO, 2013). 2
considers progress towards SDG hunger and
food insecurit y targets, while Part I.B addresses
progress on global nutrition, including SDG
targets and those set by the W H A in 2012 and

1
  In this report the Arab Region includes the 22 member states of the Arab League: Algeria, Bahrain, Comoros, Djibouti, Egypt, Iraq, Jordan, Kuwait, Lebanon,
Libya, Mauritania, Morocco, Oman, Palestine, Qatar, Saudi Arabia, Somalia, Sudan, Syrian Arab Republic, Tunisia, United Arab Emirates and Yemen.
2
  The WHA is the decision–making and policy setting body of the WHO made up of delegations from all WHO Member States convening annually in Geneva,
Switzerland. The WHA endorsed a comprehensive implementation plan on maternal, infant and young child nutrition in 2012, and a Global Action Plan for
the Prevention and Control of NCDs in 2013.

                                                                           | 2 |
REGIONAL OVERVIEW OF FOOD SECURITY AND NUTRITION 2020
TABLE 1.
SDG AND WHA TARGETS AND INDICATORS
TARGETS INDICATORS TARGET AND YEAR
By 2030, end hunger and 2.1.1. Prevalence of undernourishment
Eliminate (PART 1 RECENT TRENDS IN HUNGER, FOOD INSECURITY AND MALNUTRITION This publication analyses the two SDG targets monitoring and disseminating the indicators on focusing on hunger (Target 2.1) and malnutrition achieving SDG Target 2.1. Indicator 2.1.1 is the (Target 2.2), as well as selected W H A targets traditional FAO measurement for prevalence of on nutrition and NCDs (Table 1). FAO is a undernourishment and 2.1.2 builds on a relatively custodian for SDG Target 2.1 on hunger and food new sur vey–based FIES indicator of moderate or insecurit y and is responsible for calculating, severe food insecurit y in the population (Box 1). BOX 1. THE TWO MAIN SDG 2 INDICATORS OF HUNGER AND FOOD SECURITY SDG Goal 2, Target 2.1, is measured through two independent indicators of hunger and food insecurity: the PoU and food insecurity measured by the FIES. The PoU measures the percentage of the population suffering caloric deprivation based on data from the food balance sheets (FBS) and other information. The FIES is a survey–based indicator of food insecurity based on answers to questions about limited access to food. The PoU is FAO’s indicator to monitor hunger using aggregate data on food available for human consumption from country FBS and surveys of food consumption. It compares the distribution of average, daily dietary energy consumption for each country with the distribution of dietary energy needs. The PoU returns an estimate of the percentage of individuals in the reference population that suffer caloric deprivation. The 2020 PoU indicator series should not be compared to previous editions as FAO produces a new series every year, often with improvements in methodology and data. To compute an estimate of the PoU in a population for any given country, the probability distribution of habitual dietary energy consumption (DEC) levels (measured in kcal per person per day) for the average individual is modelled as a parametric probability density function, f(x). The indicator is obtained as the cumulative probability that the habitual dietary energy consumption (x) is below the minimum dietary energy requirements (MDER)3. For the 2020 State of Food Security and Nutrition in the World FAO estimated the PoU for each region and for the world through 2028–30. This was based on separate estimates of the underlying parameters of the probability model for 2028–30, the MDER, the DEC and the coefficient of variation. Measuring the prevalence of food insecurity due to lack of money or other resources through the FIES is an estimate of individual or household food access. The severity of food insecurity is based on survey data using a set of eight questions which report conditions and experiences associated with limited access to food. Based on their responses to these questions, individuals or households are assigned to one of three groups: food secure or only marginally insecure; moderately food insecure; or severely food insecure. Calculations of prevalence of food insecurity result in two classes: (1) moderately to severely food insecure; and (2) severely food insecure. Moderate food insecurity means uncertainty about obtaining food, forcing individuals to reduce the quality or quantity of food during the year. It refers to a lack of consistent access to food, diminishing dietary quality with negative consequences for nutrition and health. People facing severe food insecurity are likely to have run out of food, experienced hunger and, in extreme circumstances, gone for days without eating, posing a grave risk to their health and life. Source: FAO, IFAD, UNICEF, WFP and WHO, 2020. 3 PoU estimation is based on the following formula: PoU = ∫x
REGIONAL OVERVIEW OF FOOD SECURITY AND NUTRITION 2020

1.1 PROGRESS TOWARDS                                                                started to rise. Figure 1 illustrates the reasons for

HUNGER AND FOOD                                                                     the fall and rise. In the Arab region there is a
                                                                                    wide gap in the prevalence of hunger between
INSECURITY TARGETS                                                                  countries embroiled in conf lict and those that
                                                                                    are not. 4 Undernourishment in non–conf lict
SDG Target 2.1 calls for the elimination of                                         countries has ranged between 5 and 8 percent
hunger and food insecurit y and is assessed                                         since 2000 – 02 and has since trended downward.
using the two FAO indicators for hunger and                                         This level is about two to three times that of most
food insecurit y: the PoU and the prevalence of                                     developed countries where undernourishment
food insecurit y based on the FIES. According to                                    is commonly less than 2.5 percent. Hunger in
current indicators, the average PoU for the region                                  conf lict countries has been much higher than
is trending upwards, meaning the region will                                        in non–conf lict countries, in the order of 24 to
not meet SDG Target 2.1 on hunger. The two                                          30 percent (Figure 1) and trended downward up to
FAO indicators on food insecurit y have also                                        2014–16, after which it began to rise.
been trending upwards, though 2017–19 saw a
halt in this rise, as both severe and moderate to                                   The prevalence of undernourishment for the
severe indicators of food insecurit y fell. It is not                               region in Figure 1 is a population–weighted
possible to say whether this indicates a new trend                                  average of the two series for conf lict and
or a temporar y respite. What is certain is that                                    non–conf lict countries. The average prevalence of
based on current trends, it would require a major                                   undernourishment was 12.2 percent in 2017–19,
reversal in both the hunger and food insecurit y                                    a slight increase from 2014–16. The rise in this
indicators for the region to meet SGD Target 2.1.                                   average indicator was caused nearly exclusively
                                                                                    by an increase in the PoU in the Arab conf lict
                                                                                    countries. Figure 1 also shows FAO’s projection of
SDG Indicator 2.1.1. Prevalence of                                                  the prevalence of undernourishment for the Arab
undernourishment                                                                    Region, for conf lict countries and non–conf lict
                                                                                    countries based on current trends. All three
Since at least 2000 – 02 there has been a sustained,                                indicators are projected to increase up to 2030
consistent decline in undernourishment in the                                       with prevalence in conf lict countries rising from
Arab countries. This downward trend came to a                                       25 to 30 percent.
halt in 2014–16, after which the indicator

4
 Conflict and non–conflict countries are identified on the basis of the Center for Systemic Peace data on Major Episodes of Political Violence, 2012–2018. The
cut–off of a minimum of ten episodes of all interstate and civil violence was applied for disaggregating countries into conflict/non–conflict categories. Six
countries in the region fell into the category of conflict countries: Iraq, Libya, Somalia, Sudan, Syria and Yemen (https://www.systemicpeace.org/inscrdata.
html).

                                                                            | 5 |
PART 1 RECENT TRENDS IN HUNGER, FOOD INSECURITY AND MALNUTRITION
FIGURE 1
PREVALENCE OF UNDERNOURISHMENT IN THE ARAB REGION, 2000-02 TO
2017-19, AND PROJECTION TO 2028-30
30
Arab conflict and non-conflict countries, PoU (%)
25
20
15
10
5
0
2000-02
2001-03
2002-04
2003-05
2004-06
2005-07
2006-08
2007-09
2008-10
2009-11
2010-12
2011-13
2012-14
2013-15
2014-16
2015-17
2016-18
2017-19
2028-30
Arab conflict countries Arab non-conflict countries Arab countries
Note: The conflict countries aggregate includes the six currently in conflict: Iraq, Libya, Somalia, Sudan, Syria and Yemen. The non–conflict aggregate includes the other 16 countries of
the Arab region in the note to Table 2.
Source: FAO FAOSTAT, 2020.
Table 2 shows the data underlying Figure 1 with countries (nine) are missing. One of the primar y
average prevalence of undernourishment trending reasons is prolonged conf lict and the difficulties
downward until 2014–16 and rising thereafter. in producing reliable undernourishment
This was driven by the pattern in conf lict estimates using pre–conf lict data on income
countries, which fell through 2013 –15 and distribution or food consumption (Libya,
rose thereafter, and the series for non–conf lict Somalia, Syria, Yemen). The other countries
countries which also fell through 2014–16 and lacking data are a mixture of high income
remained constant thereafter. The rising trend in (Bahrain and Qatar) and low or low–middle
the series drives the FAO projected increase in income countries (Comoros, Djibouti, Palestine).
undernourishment for 2028 –30. From the estimates in Table 2, the PoU is trending
down in 9 of the 13 countries listed. Iraq and
Proceeding to the individual countr y estimates Sudan are the only conf lict countries which FAO
of Table 2, there are currently 22 countries in the deems to have sufficiently reliable data to publish
region. Reliable data for nearly half of these undernourishment estimates, both exhibiting a
| 6 |REGIONAL OVERVIEW OF FOOD SECURITY AND NUTRITION 2020
decline until 2014–16 and 2015 –17 respectively, until 2015 –17, after which the fig ures level off.
followed by an increase. Other countries Because of its large population (36 percent of
where undernourishment is trending upwards the total population of non–conf lict countries
include Mauritania, Morocco and the United in 2020), the trend in Eg y pt had a large impact
Arab Emirates. Of the non–conf lict countries, on the overall trend for non–conf lict countries
Eg ypt, the most populous in the region, (UNDESA, 2020).
exhibits declining undernourishment trends
TABLE 2.
PREVALENCE OF UNDERNOURISHMENT IN THE ARAB REGION AND SUB–REGIONS, 2007/09–2017/19 AND
2028/30 PROJECTION (%)
2007–09 2009–11 2011–13 2013–15 2014–16 2015–17 2016–18 2017–19* 2028–2030**
Total Arab Region 13.7 13.1 12.7 11.9 11.7 12.1 12.2 12.2 14.5
ARAB SUB-REGIONS
Conflict
26.7 25.6 25.2 24.0 24.1 24.7 25.0 25.2 30.0
countries a
Non–conflict
6.4 6.1 5.8 5.3 5.1 5.2 5.3 5.2 8.2
countries b
COUNTRIES FOR WHICH RELIABLE DATA ARE AVAILABLE
Algeria 5.6 4.5 3.5 3.3 3.3 3.2 3.1 2.8
Egypt 5.7 5.4 5.2 4.8 4.8 4.7 4.7 4.7
Iraq 25.0 21.9 21.8 22.7 22.7 24.0 24.0 23.7
Jordan 6.7 7.2 8.6 9.0 9.0 8.6 8.7 8.5
KuwaitPART 1 RECENT TRENDS IN HUNGER, FOOD INSECURITY AND MALNUTRITION
The absolute number of undernourished in the into the future (Table 3) from 51 million in 2017–19
Arab Region has been increasing steadily since to 75 million by 2028 –30, with 92 percent of the
2015 –17 and that trend is projected to continue 2017–19 increase in conf lict countries.
TABLE 3.
NUMBER OF UNDERNOURISHED IN THE ARAB REGION AND SUB–REGIONS, 2007/09–2017/19 AND 2028/30
PROJECTION (MILLION)
2005–07 2007–09 2009–11 2011–13 2013–15 2015–17 2016–18 2017–19* 2028–30**
Total Arab
Region 45.6 46.4 46.5 47.1 46.2 48.7 50.3 51.4 75.3
ARAB SUB-REGIONS
Conflict
countries a 31.8 32.4 32.5 33.2 32.9 35.1 36.2 37.1 59.1
Non–
conflict
countries b 13.9 14.0 14.0 13.9 13.3 13.7 14.1 14.3 16.1
COUNTRIES FOR WHICH RELIABLE DATA ARE AVAILABLE
Algeria 2.2 2 1.6 1.3 1.3 1.3 1.3 1.2
Egypt 4.7 4.5 4.5 4.5 4.3 4.5 4.6 4.6
Iraq 6.9 7.1 6.5 7 7.8 8.8 9 9.1
Jordan 0.3 0.4 0.5 0.7 0.8 0.8 0.8 0.9
Kuwait n.r. n.r. n.r. n.r. n.r. n.r. n.r. n.r.
Lebanon 0.5 0.5 0.5 0.8 0.6 0.4 0.4 0.4
Mauritania 0.3 0.2 0.3 0.3 0.3 0.5 0.5 0.5
Morocco 1.8 1.8 1.8 1.6 1.4 1.3 1.4 1.6
Oman 0.3 0.3 0.3 0.3 0.3 0.4 0.4 0.4
Saudi
1.1 1.4 1.6 1.6 1.5 1.5 1.6 1.6
Arabia
Sudan 6.5 6.7 7.5 7.2 5.1 4.8 5 5.2
Tunisia 0.4 0.4 0.4 0.3 0.3 n.r. n.r. n.r.
United Arab
0.5 0.6 0.5 0.4 0.3 0.3 0.3 0.3
Emirates
Notes: *Projection. Reliable data for other countries are not available. Aggregates include imputed estimates for countries for which data
are unavailable: a. Iraq, Libya, Somalia, Sudan, Syria and Yemen; b. Algeria, Bahrain, Comoros, Djibouti, Egypt, Jordan, Kuwait, Lebanon,
Mauritania, Morocco, Oman, Palestine, Qatar, Saudi Arabia, Tunisia and United Arab Emirates.
** The projections up to 2030 do not reflect the potential impact of the Covid–19 pandemic.
Source: FAO FAOSTAT, 2020. Projections for 2028–30 are from the PoU projection tool at http://www.fao.org/publications/sofi/2020/en/.
| 8 |REGIONAL OVERVIEW OF FOOD SECURITY AND NUTRITION 2020
As Table 2 and Table 3 show, the Arab Region as a the PoU, growing since 2014–16, followed by a
whole is not on track to reach SDG Target 2.1 and slight decline (Table 4). The prevalence of both
eliminate hunger. In fact, FAO projects increased severe and moderate to severe food insecurit y in
undernourishment in the region from current conf lict countries rose ever y year since 2014–16.
levels in both conf lict and non–conf lict countries. In non–conf lict countries, food insecurit y rose
after 2014–16 and then slightly decreased.
Thus, the trends in food insecurit y, both severe
SDG indicator 2.1.2. Prevalence of moderate and moderate to severe, in the region have been
or severe food insecurity based on FIES roughly consistent with the undernourishment
trends in Table 2.
Average food insecurit y in the Arab region based
on the FIES exhibits a pattern similar to that of
TABLE 4.
PREVALENCE OF PEOPLE AFFECTED BY FOOD INSECURITY IN THE ARAB REGION AND SUB–REGIONS,
2014/16–2017/19 (%)
SEVERE MODERATE OR SEVERE
2014–2016 2015–2017 2016–2018 2017–2019 2014–2016 2015–2017 2016–2018 2017–2019
Total Arab
Region
11.0 11.5 11.7 11.4 30.1 31.8 32.8 32.6
ARAB SUB–REGIONS
Conflict
countries
14.8 15.9 16.6 16.9 39.2 41.0 42.1 42.8
Non–conflict
countries
9.0 9.1 9.0 8.4 25.2 26.9 27.8 27.1
COUNTRIES
Algeria 13.0 12.7 11.4 9.3 22.9 21.5 19.7 17.6
Egypt 8.4 9.0 8.9 7.8 27.8 33.0 36.0 34.2
Kuwait 4.9 4.9 4.9 4.9 12.6 12.4 12.3 12.3
Libya 11.2 12.4 14.3 16.8 29.1 30.9 33.2 35.9
Mauritania 14.2 18.7 22.1 22.4 31.6 37.6 42.5 44.8
Morocco n.a. n.a. n.a. n.a. n.a. n.a. n.a. 25.9
Palestine n.a. n.a. 4.4 4.4 n.a. n.a. 26.3 26.3
Tunisia 9.1 9.3 9.1 9.1 18.2 19.4 20.0 20.0
Sudan 13.4 14.4 15.4 16.4 41.4 43.9 46.4 48.9
Notes: n.a.: Not available. Reliable data for other countries are not available nor are there estimates for missing countries.
Source: FAO FAOSTAT, 2020.
| 9 |PART 1 RECENT TRENDS IN HUNGER, FOOD INSECURITY AND MALNUTRITION
TABLE 5.
NUMBER OF PEOPLE AFFECTED BY FOOD INSECURITY IN THE ARAB REGION AND SUB–REGIONS,
2014/16–2017/19 (MILLION)
SEVERE MODERATE OR SEVERE
2014–2016 2015–2017 2016–2018 2017–2019 2014–2016 2015–2017 2016–2018 2017–2019
Total Arab
43.7 46.4 48.1 47.8 119.4 128.7 135.2 137.0
Region
ARAB SUB-REGIONS
Conflict
20.7 22.6 24.0 25.0 54.6 58.1 60.8 63.2
countries
Non–conflict
23.0 23.8 24.1 22.9 64.7 70.6 74.3 73.8
countries
COUNTRIES
Algeria 5.2 5.1 4.7 3.9 9.1 8.7 8.2 7.4
Egypt 7.8 8.5 8.6 7.6 25.7 31.1 34.8 33.6
Kuwait 0.2 0.2 0.2 0.2 0.5 0.5 0.5 0.5
Libya 0.7 0.8 0.9 1.1 1.9 2.0 2.2 2.4
Mauritania 0.6 0.8 0.9 1.0 1.3 1.6 1.8 2.0
Morocco n.a. n.a. n.a. n.a. n.a. n.a. n.a. 9.3
Palestine n.a. n.a. 0.2 0.2 n.a. n.a. 1.3 1.3
Sudan 5.2 5.8 6.3 6.8 16.1 17.5 19.0 20.4
Tunisia 1.0 1.1 1.0 1.1 2.0 2.2 2.3 2.3
Notes: n.a.: Not available. Reliable data for other countries are not available nor are there estimates for missing countries.
Source: FAO FAOSTAT, 2020.
While the absolute number of the severely continues to increase in the region. The number
food insecure peaked in 2016 –18 and fell in of moderately or severely food insecure people
2017–19 (Table 5), uncertaint y about access to food continues to increase.
| 10 |REGIONAL OVERVIEW OF FOOD SECURITY AND NUTRITION 2020
1.2 PROGRESS TOWARDS to the W HO classification. The table is divided
into two parts, ref lecting the sur vey year of the
GLOBAL NUTRITION data, before and after 2010. The older estimates
in Table 6 have likely changed and are thus less
TARGETS reliable as an indicator of the current status of
child malnutrition. Box 2 defines and lists some of
the consequences of the main nutritional status
indicators for children under 5.
This section presents the latest estimates of
progress towards the following global nutrition Based on the W HO classification of malnutrition
targets: a) Target 2.2 of the SDGs to eliminate severit y as a public health problem, the Arab
all forms of malnutrition, to be achieved by States have relatively high levels of stunting
2030; b) Targets on maternal, infant and young and medium levels of overweight in children
child nutrition to be achieved by 2025, endorsed under 5. The conf lict countries, as expected,
by the W H A in 2012; and c) NCD targets to be show high levels of undernutrition (stunting
achieved by 2025, endorsed by the W H A in 2013. and wasting), while the non–conf lict countries
While W H A 2012 targets were initially to be show high levels of overweight and medium
achieved by 2025, some have been adjusted and levels of undernutrition. Some countries in
extended up to 2030 to align with the 2030 SDG the region (Comoros, Eg y pt, Libya and Syria)
agenda 5 . appear to be caught in a “double burden” of
malnutrition with high levels of stunting and
The trend analysis is provided only for selected overweight. Others (Iraq, Jordan, Kuwait,
W H A targets as listed in Table 1 above. Oman and Palestine) seem to have done
comparatively well on indicators of both
undernutrition and overweight. There seems to
SDG indicators 2.2.1 and 2.2.2 on child be only a weak correlation between the income
malnutrition status of the countries in these two categories.
The “double burden” countries are a mixture of
Table 6 shows the latest available estimates on the low, lower–middle and upper–middle–income
status of malnutrition of under 5 children for the countries, while the comparatively well–off
Arab Region published by the inter–agency team countries include lower–middle, upper–middle
at the UNICEF, W HO and the World Bank ( W B) and high–income countries.
(UNICEF–W HO –W B, 2020), as well as the public
health significance of those estimates according
5
The global nutrition targets to be achieved by 2030 are as follows: stunting children under 5 – 50 percent reduction; anaemia in women of reproductive
age – 50 per cent reduction; low birth weight – 30 per cent reduction; childhood overweight – less than 3 per cent; exclusive breastfeeding – up to at least 70
per cent; wasting – less than 3 per cent.
| 11 |PART 1 RECENT TRENDS IN HUNGER, FOOD INSECURITY AND MALNUTRITION
TABLE 6.
CHILDREN’S NUTRITIONAL STATUS FOR ARAB REGION AND PUBLIC HEALTH SIGNIFICANCE, LATEST YEAR
CHILDREN, 0–5, PREVALENCE, LATEST PUBLIC HEALTH SIGNIFICANCE
YEAR DATA SURVEY
WASTING OVERWEIGHT STUNTING YEAR
WASTING OVERWEIGHT STUNTING
(%) (%) (%)
Total Arab Region 9.2 9.9 22.5 Medium Medium High 2013
ARAB SUB-REGIONS
Conflict countries 11.8 6.6 30.3 High Medium Very High 2012
Non–conflict countries 7.2 12.4 16.6 Medium High Medium 2012
COUNTRIES, DATA AFTER 2010
Algeria 4.1 12.4 11.7 Low High Medium 2012–13
Comoros 11.2 10.6 31.1 High High Very high 2012
Djibouti 21.5 8.1 33.5 Very high Medium Very high 2012
Egypt 9.5 15.7 22.3 Medium Very high High 2014
Iraq 3.0 6.1 12.6 Low Medium Medium 2018
Jordan 2.4 4.7 7.8 Very low Low Low 2012
Kuwait 2.5 5.5 6.4 Low Medium Low 2017
Libya 10.2 29.6 38.1 High Very high Very high 2014
Mauritania 11.5 1.5 22.8 High Very low High 2018
Morocco 2.6 10.9 15.1 Low High Medium 2017–18
Oman 9.3 4.2 11.4 Medium Low Medium 2017
Palestine 1.2 8.2 7.4 Very low Medium Low 2014
Sudan 16.3 3.0 38.2 Very high Low Low 2014
Tunisia 2.1 17.2 8.4 Very low Very high Low 2018
Yemen 16.4 2.5 46.4 Very high Low Very high 2013
DATA BEFORE 2010
Bahrain 6.6 13.6 Medium Medium 1995
Lebanon 6.6 16.7 16.5 Medium Very high Medium 2004
Qatar 2.1 10.4 11.6 Very low High Medium 1995
Saudi Arabia 11.8 6.1 9.3 High Medium Low 2004–05
Somalia 14.3 3.0 25.3 High Low High 2009
Syria 11.5 17.9 27.9 High Very high High 2009–10
Source: UNICEF–WHO–WB, 2020; WHO, 2010.
| 12 |REGIONAL OVERVIEW OF FOOD SECURITY AND NUTRITION 2020 BOX 2. DEFINITIONS AND CONSEQUENCES OF THE MAIN NUTRITIONAL STATUS INDICATORS FOR CHILDREN UNDER 5 Stunting indicates that a child has not achieved their genetic potential for height (Golden, 2009). A child whose height is more than two deviations below the WHO standard is considered stunted (WHO Multicentre Growth Reference Study Group, 2006). Stunting may be caused by retarded intrauterine growth, inadequate nutrition to support the development of infants and young children and frequent infections during early life (Pendergast and Humphrey, 2014). Stunting usually reflects the persistent, cumulative effects of poor nutrition and other deficits that may span several generations and can adversely affect the cognitive and physical growth of children, making for poor performance in school and lower lifetime incomes. Prevalence cut–off values for public health significance for stunting are as follows: very low
PART 1 RECENT TRENDS IN HUNGER, FOOD INSECURITY AND MALNUTRITION

TABLE 7.
SELECTED WHA INDICATORS OF MATERNAL AND INFANT NUTRITION AND NON–COMMUNICABLE DISEASE FOR
THE ARAB REGION (LATEST ESTIMATES)
                               PREVALENCE OF ANAEMIA (%)                         EXCLUSIVE BREASTFEEDING (%)

                             AMONG WOMEN                                      AMONG INFANTS                                        PREVALENCE OF ADULT OBESITY
                                   OF
                                                       PUBLIC HEALTH
                                                                                FOR FIRST 6                                         (% OF POPULATION 18 YEARS
                              REPRODUCTIVE
                                                       SIGNIFICANCE
                                                                               MONTHS (% OF                SURVEY YEAR                   AND OLDER), 2016
                               AGE (15–49),                                    CHILDREN, 0–6
                                  2016                                           MONTHS)

Total Arab Region                             35.1        Moderate                             38.7                                                       27.0

                                                                                 COUNTRIES

Algeria                                       35.7        Moderate                             25.4                      2012                             27.4

Bahrain                                       42.0          Severe                               n.d.                                                     29.8

Comoros                                       29.3        Moderate                             11.4                      2012                              7.8

Djibouti                                      32.7        Moderate                             12.4                      2012                             13.5

Egypt                                         28.5        Moderate                             39.5                      2014                             32.0

Iraq                                          29.1        Moderate                             25.8                      2018                             30.4

Jordan                                        34.7        Moderate                             25.4                      2017                             35.5

Kuwait                                        23.8        Moderate                               n.d.                                                     37.9

Lebanon                                       31.2        Moderate                               n.d.                                                     32.0

Libya                                         32.5        Moderate                               n.d.                                                     32.5

Mauritania                                    37.2        Moderate                           40.33                       2018                             12.7

Morocco                                       36.9        Moderate                             35.0                      2017                             26.1

Oman                                          38.2        Moderate                             23.2                      2017                             27.0

Palestine                                      n.d.                                           38.1                     2014
Qatar                                         27.7        Moderate                             29.3                      2012                             35.1

Saudi Arabia                                  42.9          Severe                               n.d.                                                     35.4

Somalia                                       44.4          Severe                               5.3                     2009                              8.3

Sudan                                         30.7        Moderate                             54.6                      2014                             n.d.

Syria                                         33.6        Moderate                             42.6                      2009                             27.8

Tunisia                                       31.2        Moderate                             13.5                      2018                             26.9
United Arab
Emirates
                                              27.8        Moderate                               n.d.                                                    31.7
Yemen                                         69.6          Severe                               9.7                     2013                             17.1

Note: n.d. = No data.
Sources: WHO Global Health, 2020 (obesity); WHO Global Targets, 2020 (anaemia and breastfeeding); WHO, 2015 (anaemia public health significance).

                                                                                    | 14 |
REGIONAL OVERVIEW OF FOOD SECURITY AND NUTRITION 2020
W HO and UNICEF recommend initiation of ( W HO Global Health, 2020). Fort y–five percent
breastfeeding within one hour of birth, exclusive of the countries in the region had between 31
breastfeeding for the first six months of life, with and 40 percent obesit y and 30 percent had a
continued breastfeeding up to 2 years of age prevalence between 21 and 30 percent (Figure 2).
or beyond, accompanied by solid foods ( W HO, Obesit y is a risk factor for a wide range of health
2019). Based on meta–analyses of breastfeeding problems, such as t y pe 2 diabetes, high blood
outcomes in children and mothers, children who pressure, heart disease, strokes, certain t y pes of
are breastfed for longer have lower morbidit y cancer, osteoarthritis, liver and kidney disease
and mortalit y from infections compared to those (CDC, 2020) and represents one of the greatest
breastfed for shorter periods or not breastfed at health challenges in the region.
all ( Victora et al., 2016). The data in Table 7 are
therefore disappointing as they indicate less The centralit y of obesit y as a health risk factor in
than 40 percent of women exclusively breastfeed the Arab Region is worth underlining. While the
through the first six months of their child’s life. theme of this year’s Regional Overview is
Only a handful of countries in the region stand resilience, it is difficult to achieve food system
out, where between 40 and 50 percent of infants resilience without due attention to the need to
are breastfed for the first six months of life: transform the food system to ensure healthy diets
Eg ypt, Mauritania, Sudan and Syria. for all. The 2019 edition of the Regional Over view
(FAO –RNE et al, 2020) discussed measures for
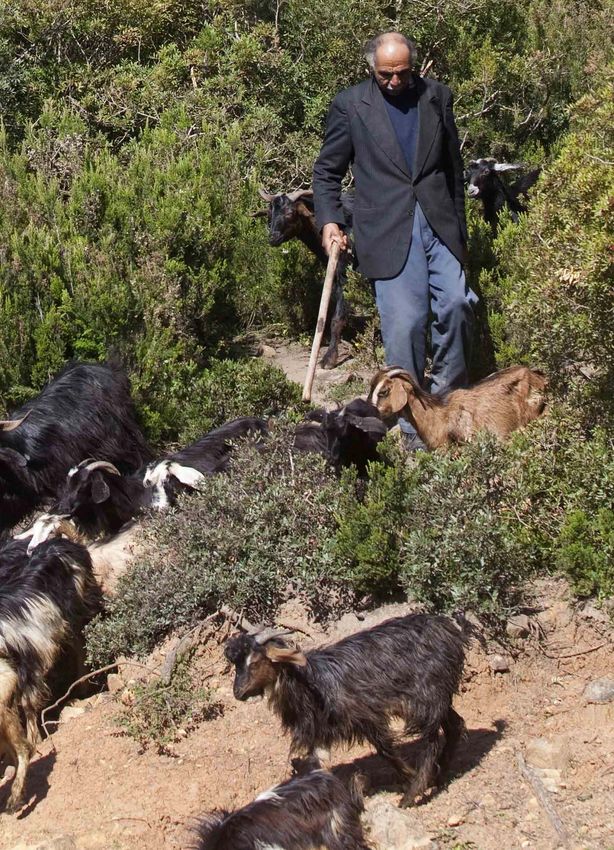
With 27 percent of the adult population obese, rethinking food systems to achieve healthy diets
the Arab region ranked second in the world for and improved nutrition in the region. See Figure 2,
obesit y after the Americas with 28.6 percent data based on Table 5.
FIGURE 2.
HISTOGRAM OF ADULT OBESITY PREVALENCE IN THE ARAB REGION, 2016
Meeting the 2025 WHA nutrition targets: are countries on track?
50
45
40
Percent of countries in range
35
30
25
20
15
10
5
0
0-10 11-20 21-30 31-40
Ranges for prevalence of adult obesity in Arab states (%), 2016
| 15 |PART 1 RECENT TRENDS IN HUNGER, FOOD INSECURITY AND MALNUTRITION
Progress in the Arab Region on the global For stunting, only 3 countries are on track, 7
nutrition targets has been slow and partial. countries are not on track, while 12 do not have
Ver y few of the countries of the region are the requisite data. For childhood overweight,
on track to reach W H A childhood nutrition only 3 countries are on track, 8 countries are not
targets by 2025 (Table 8). 6 For wasting, 7 out of 22 on track and 11 do not have the requisite data.
countries are on track, 11 countries are not on
track and 3 do not have the requisite data.
TABLE 8.
PREVALENCE OF CHILDHOOD STUNTING, WASTING AND OVERWEIGHT: LATEST YEAR, WHA TARGET AND TREND
CHILDHOOD WASTING (0–5) CHILDHOOD OVERWEIGHT
CHILDHOOD STUNTING (0–5) (%)
(%) (0–5) (%)
COUNTRY
LATEST 2025 TREND ON LATEST 2025 TREND ON LATEST 2025 TREND ON
YEAR TARGET TARGET? YEAR TARGET TARGET? YEAR TARGET TARGET?
Algeria 11.7 6.6 n.d. 4.1REGIONAL OVERVIEW OF FOOD SECURITY AND NUTRITION 2020
The W H A target for anaemia in women of track, since the W HO publishes the data ever y
reproductive age is to reduce it by half by 2025, year. However, none of the countries in the
while the adult obesit y target is to halt its rise. region are on track to meet W H A targets for
Information on these two indicators is easier to anaemia or obesit y by 2025 (Table 9).
TABLE 9.
PREVALENCE OF ANAEMIA IN WOMEN OF REPRODUCTIVE AGE AND ADULT OBESITY: BASE YEAR, WHA TARGET
AND TREND
PREVALENCE OF ANAEMIA IN WOMEN OF
PREVALENCE OF ADULT OBESITY (%)
REPRODUCTIVE AGE (%)
COUNTRY
BASE YEAR 2025 TREND ON BASE YEAR TREND ON
2025 TARGET
(2012) TARGET TARGET? (2012) TARGET?
Algeria 33.6 16.7 X 24.7 24.7 X
Bahrain 41.4 20.6 X 27.6 27.6 X
Comoros 27.6 13.8 X 6.7 6.7 X
Djibouti 30.9 15.4 X 12.3 12.3 X
Egypt 29.3 14.6 X 29.3 29.3 X
Iraq 29 14.5 X 28 28 X
Jordan 30.8 15.4 X 33.1 33.1 X
Kuwait 21 10.5 X 35.6 35.6 X
Lebanon 28.1 14 X 29.7 29.7 X
Libya 30.5 15.2 X 30 30 X
Mauritania 37.5 18.6 X 11 11 X
Morocco 34.2 17.1 X 23.4 23.4 X
Oman 36.3 18.1 X 24.3 24.3 X
Palestine 27.3 13.6 X n.d. n.d. X
Saudi Arabia 41.5 20.7 X 32.8 32.8 X
Somalia 43.5 21.7 X 7 7 X
Sudan 29.4 14.7 X n.d. n.d.
Syrian Arab Republic 31.7 15.8 X 25.1 25.1 X
Tunisia 28.1 14 X 24.6 24.6 X
United Arab Emirates 25.7 12.8 X 29 29 X
Yemen 65.5 32.7 X 14.6 14.6 X
Note: √=yes, X=no, n.d.= No data.
Source: WHO Global Targets, 2020; WHO Global Health, 2020.
| 17 |PART 1 RECENT TRENDS IN HUNGER, FOOD INSECURITY AND MALNUTRITION
CONCLUDING REMARK Food Securit y and Nutrition in the Near East and
North Africa (FAO –RNE, 2016, 2017, 2018, 2019).
Chief among the reasons for slower reduction
Part I of this Overview arg ued that the in undernourishment has been conf lict, though
average regionwide status of hunger improved food system weaknesses have also prevented
substantially between 2000 and 2014. the region from making progress on the
Though between 11 and 12 percent of the adult obesit y epidemic.
population still suffered from hunger and severe
food insecurit y, the direction of change in the The impact of Covid–19 on the Arab Region
region was still positive. economy will further complicate the challenge
of achieving the SDG target of Zero Hunger.
As the most recent estimates show, the The full impact of the pandemic on food securit y
improvement in the prevalence of hunger in the in the region is difficult to assess in this report,
Arab Region has now halted and reversed, and which ref lects the pre– COV ID–19 situation.
has entered a new trajector y that is incompatible However, the pandemic has further exposed
with meeting the SDG 2 targets. A look at regional v ulnerabilities, which are discussed
progress on SDG 2 since 2015 is disappointing. at length in Part 2. Disruptions to livelihoods,
Though there are insufficient data to establish job losses and successive disruptions in food
clear trends in all countries for all indicators, systems in terms of food price hikes and reduced
only a handful of countries now seem likely demand for nutritious food due to income losses
to meet the SDG targets for 2030 on stunting, will boost the numbers of the food insecure and
wasting and overweight, and none are on track undernourished in the region. Higher prices,
to reach W H A targets anaemia in women of especially for nutritious foods, and weakened
reproductive age and adult obesit y for 2025. purchasing power will negatively impact on
the quantit y, diversit y and qualit y of diets, and
Some of the reasons for the gradual reversal consequently increase the risk of malnutrition.
in the hunger target and slow progress on Most v ulnerable population groups in
malnutrition SDG targets have been discussed low–income countries and countries in protracted
in previous editions of the Regional Over view of crisis are likely to be hit the hardest.
| 18 |You can also read