The Renewable Energy Transition in Africa - Country Studies for Côte d'Ivoire, Ghana, South Africa, Morocco and Rwanda - International ...
←
→
Page content transcription
If your browser does not render page correctly, please read the page content below
The Renewable Energy
Transition in Africa
Country Studies for
Côte d’Ivoire, Ghana, South Africa, Morocco and Rwanda

Implemented by                               On behalf of the
Table of contents
List of figures 5
List of tables 6
List of abbreviations 9
1 Preamble to the five country studies 11
1.1 Context of the study 11
1.2 Structure of the five country studies 11
1.3 Methodologies for the five country studies 12
1.4 Findings common to all five countries 13
2 Côte d’Ivoire country analysis 19
2.1 Status quo of the power sector in Côte d’Ivoire 19
2.2 Prospects for renewable power towards 2040 22
2.3 Systemic innovation needs and opportunities 26
2.4 Conclusions and areas for further consideration 28
3 Ghana country analysis 31
3.1 Status quo of the power sector in Ghana 31
3.2 Prospects for renewable power towards 2040 36
3.3 Systemic innovation needs and opportunities 40
3.4 Conclusions and areas for further consideration 42
4 South Africa country analysis 45
4.1 Status quo of the power sector in South Africa 45
4.2 Prospects for renewable power towards 2040 49
4.3 Systemic innovation needs and opportunities 53
4.4 Conclusion and areas for further consideration 56
5 Morocco country analysis 59
5.1 Status quo of the power sector in Morocco 59
5.2 Prospects for renewable power towards 2040 62
5.3 Systemic innovation needs and opportunities 67
5.4 Conclusions and areas for further considerations 69
6 Rwanda country analysis 73
6.1 Status quo of the power sector in Rwanda 73
6.2 Prospects for renewable power towards 2040 77
6.3 Systemic innovation needs and opportunities 81
6.4 Conclusion and areas for further consideration 82
References 85
Disclaimer
© IRENA (2020)
Unless otherwise stated, material in this publication may be freely used, shared, copied, reproduced, printed and/or stored,
provided that appropriate acknowledgement is given of the Authors as the source and copyright holders. Material in this publica-
tion that is attributed to third parties may be subject to separate terms of use and restrictions, and appropriate permissions from
these third parties may need to be secured before any use of such material.
This publication and the material herein are provided “as is”. All reasonable precautions have been taken by the Authors to
verify the reliability of the material in this publication. However, neither the Authors nor any of its officials, agents, data or other
third-party content providers provides a warranty of any kind, either expressed or implied, and they accept no responsibility or
liability for any consequence of use of the publication or material herein.
The information contained herein does not necessarily represent the views of all countries analysed in the report. The mention
of specific companies or certain projects or products does not imply that they are endorsed or recommended by the Authors in
preference to others of a similar nature that are not mentioned. The designations employed, and the presentation of material
herein, do not imply the expression of any opinion on the part of the Authors concerning the legal status of any region, country,
territory, city or area or of its authorities, or concerning the delimitation of frontiers or boundaries.
2 The Renewable Energy Transition in Africa | Table of contents 3
List of figures

Figure 1      – Installed generation capacity between 2000 and 2019                                                       20
Figure 2      – Electricity demand projection in 2018 ECOWAS regional masterplan and IRENA analysis                       22
Figure 3      – Capacity mix in Côte d’Ivoire in the Reference and National Targets scenarios                             24
Figure 4      – Generation mix in Côte d’Ivoire in the Reference and National Target scenarios                            24
Figure 5      – Gross capacity additions in Côte d’Ivoire in the Reference and National Target scenarios                  25
Figure 6      – Annual system cost                                                                                        26
Figure 7      – Innovations to be considered for a future renewable power sector in Côte d’Ivoire                         27
Figure 8      – Installed generation capacity between 2000 and 2019                                                       32
Figure 9      – ‘Least regrets’ build plan under the IPSMP reference scenario (top) and high demand scenario (bottom)     34
Figure 10 – Electricity demand projection in 2018 ECOWAS regional masterplan and IRENA analysis                           36
Figure 11 – Capacity mix in Ghana in the Reference and National Targets scenarios                                         38
Figure 12 – Generation mix in Ghana in the Reference and National Target scenarios                                        38
Figure 13 – Gross capacity additions in Ghana in the Reference and National Target scenarios                              38
Figure 14 – Annual system costs                                                                                           40
Figure 15 – Innovations to be considered for a future renewable power sector in Ghana                                     41
Figure 16 – Installed generation capacity between 2000 and 2019                                                           46
Figure 17 – Generating capacities from the IRP‘s Emerging Long Term Plan                                                  48
Figure 18 – Solar PV and solar CSP zones                                                                                  50
Figure 19 – Generation, imports and capacity in the High RE and Regional Target scenarios                                 51
Figure 20 – Yearly system cost and cumulative lumpsum investment cost between 2020 and 2040                               53
Figure 21 – Cumulative patents filed for the power sector by South Africa (2000-2018)                                     54
Figure 22 – Innovations to be considered for a future renewable power sector in South Africa                              54
Figure 23 – Installed generation capacity between 2000 and 2019                                                           60
Figure 24 – Electricity demand projection 2020-2040                                                                       63
Figure 25 – Examples of solar PV and onshore wind zones in IRENA’s assessment for Morocco                                 63
Figure 26 – Installed capacity and peak load for the Reference (left) and Hydrogen Production scenarios (right) (in MW)   64
Figure 27 – Electricity generation for the Reference (left) and Hydrogen Production scenarios (right) (in GWh)            64
Figure 28 – Hydrogen production, electricity generation and additional solar PV, CSP and wind capacity 2025-2040          66
Figure 29 – Cumulative patents filed for the power sector by Morocco (2000-2017)                                          67
Figure 30 – Innovations to be considered for a future renewable power sector in Morocco                                   68
Figure 31 – Installed generation capacity, 2000-2019                                                                      74
Figure 32 – Solar PV zones with total levelised cost of electricity (USD/MWh)                                             77
Figure 33 – Generation, imports and capacity in the High RE and Regional Target scenarios                                 78
Figure 34 – system cost and cumulative lumpsum investment cost between 2020 and 2040                                      80
Figure 35 – Innovations to be considered for a future renewable power sector in Rwanda                                    80

The Renewable Energy Transition in Africa | List of figures                                                                5
List of tables

Table 1   – TPES in 2017 in PJ                                                                                                    19     Table 23 – Summary of IRENA’s assumptions in the SPLAT-ACEC model                                                  50
Table 2   – TFEC in 2017 in PJ                                                                                                    19     Table 24 – Capacity and generation mix in South Africa in the High RE and the Regional Target scenarios            52
Table 3   – Electricity generation and capacity                                                                                   20     Table 25 – Investment costs (million USD) of cross-border transmission between South Africa and
                                                                                                                                         		 neighbouring countries                                                                                          53
Table 4 – Renewable energy targets in Côte d’Ivoire PANER (in % of total installed capacity and
		 total electricity generation)                                                                                                  21     Table 26 – TPES in 2017 in PJ                                                                                      59
Table 5 – Key policy instruments, regulations and measures supporting national plans and                                                 Table 27 – TFEC in 2017 in PJ                                                                                      59
		 driving renewable energy deployment in the power sector                                                                        22     Table 28 – Electricity generation (in GWh/year)                                                                    60
Table 6   – Renewable energy resource potential                                                                                   23     Table 29 – Summary of key national emissions/renewable energy targets                                              61
Table 7   – Summary of IRENA’s assumptions in the SPLAT-W model                                                                   23     Table 30 – Summary of policy instruments, regulations and measures supporting national plans and
Table 8   – Capacity and generation mix in the Reference and National Target scenarios                                            25     		 driving renewable energy deployment in Morocco                                                                  62
Table 9   – TPES in 2017 in PJ                                                                                                    31     Table 31 – Summary of Morocco’s solar PV and onshore wind zones                                                    63
Table 10 – TFEC in 2017 in PJ                                                                                                     31     Table 32 – Summary of IRENA’s assumptions for Morocco’s SPLAT model                                                63
Table 11 – Electricity generation and capacity                                                                                    32     Table 33 – Main modelling results, 2020-2040                                                                       65
Table 12 – Key policy instruments, regulations and measures supporting national plans and                                                Table 34 – Investment needs for power generation and electrolyser capacity 2020–2040 (in billion 2015 USD)         67
		 driving renewable energy deployment                                                                                            35     Table 35 – TPES in 2017 in PJ                                                                                      73
Table 13 – Renewable energy resource potential                                                                                    36     Table 36 – TFEC in 2017 in PJ                                                                                      73
Table 14 – Summary of IRENA’s assumptions in the SPLAT-W model                                                                    37     Table 37 – Rwanda’s installed electricity generation capacity (MW) and generation (GWh)                            74
Table 15 – Capacity and generation mix in the Reference and National Target scenarios                                             39     Table 38 – Electricity access statistics                                                                           74
Table 16 – TPES in 2017 in PJ                                                                                                     45     Table 39 – Electricity generation in the LCDPD scenario in 2019 and 2030                                           76
Table 17 – TFEC in 2017 in PJ                                                                                                     45     Table 40 – Summary of key national emissions/renewable energy targets                                              76
Table 18 – Main state players in South Africa                                                                                     46     Table 41 – Summary of relevant renewable energy policy instruments, regulations and
Table 19 – South Africa’s installed electricity capacity and generation                                                           46     		 measures in Rwanda’s power sector                                                                               76
Table 20 – Summary of key national emissions and renewable energy targets                                                         48     Table 42 – Summary of IRENA’s assumptions in the SPLAT-ACEC model                                                  77
Table 21 – Summary of policy instruments, regulations and measures supporting national plans and                                         Table 43 – Capacity and generation mix in the High RE and the Regional target scenarios                            79
		 driving renewable energy deployment in the power sector in South Africa                                                        49     Table 44 – Investment costs (USD million) of cross-border transmission between Rwanda and neighbouring countries   80
Table 22 – Characteristics of project zones                                                                                       50

6                                                                           List of tables | The Renewable Energy Transition in Africa   The Renewable Energy Transition in Africa | List of tables                                                          7
List of abbreviations

ACEC          – Africa Clean Energy Corridor
AfDB          – African Development Bank
AU            – African Union
AUDA-
NEPAD         – African Union´s Development Agency
CAGR          – Compound Annual Growth Rate
CSP           – Concentrated Solar Power
CO2           – Carbon Dioxide
CwA           – Compact with Africa
EAPP          – Eastern Africa Power Pool
ECOWAS – Economic Community of West African States
EU            – European Union
GDP           – Gross Domestic Product
GIZ           – Deutsche Gesellschaft für Internationale Zusammenarbeit
GW            – Gigawatt
IEA           – International Energy Agency
IFC           – International Finance Corporation
IPP           – Independent Power Producer
IRENA         – International Renewable Energy Agency
kg            – Kilogram
kWh           – Kilowatt-Hour
LCOE          – Levelized Cost of Electricity
MW            – Megawatt
MWh           – Megawatt-Hour
NDC           – Nationally Determined Contributions
OECD          – Organisation for Economic Co-operation and Development
PPA           – Power Purchase Agreement
PSP          – Private Sector Participation
PV           – Photovoltaic
RE           – Renewable Energy
REFiT        – Renewable Energy Feed-In Tariff
SAPP         – Southern Africa Power Pool
SDG          – Sustainable Development Goals
SEforAll     – Sustainable Energy for All
T&D          – Transmission and Distribution
TWh          – Terawatt-Hour
UN           – United Nations
USD          – United Stated Dollar
WAPP         – West African Power Pool

The Renewable Energy Transition in Africa | List of abbreviations         9
1 Preamble to the five country studies
1.1 Context of the study 1.2 Structure of the five country studies
The global transition toward sustainable energy systems All country studies follow a unified structure, as presented below.
is gaining speed, driven both by the continuing drop in
renewable energy costs and improvements in performance, Section 1, the “Status quo of the power sector”, starts with a
and expedited by globally-agreed goals such as Sustainable brief overview of the supply and demand structure of energy
Development Goal 7 and the Paris Agreement. This transition commodities in the country (x.1.1), followed by a discussion of
presents enormous opportunities to transform and modernise key power sector characteristics (x.1.2) and a review of elect-
energy systems across the globe. African countries – many of ricity access in the country (x.1.3).
them rich in renewable resources – have much to gain from
this transition, particularly in terms of a resilient and affordable The two subsections that follow review ongoing government
low-carbon energy system development and universal access plans, targets and policies driving renewable energy deploy-
to electricity. It is also vital for all nations to accelerate their ment in the power sector. First, a summary of government
pace of decarbonisation in order to meet the Paris Agree- planning scenarios and the targets derived from those scena-
ment goals of achieving carbon neutrality by 2050 and limiting rios are reviewed and discussed (x.1.4). Second, the policies
the warming of the planet to well below 2°C (and if possible, and measures deployed in the country to incentivise rene-
1.5°C) compared to pre-industrial levels. wable energy deployment in the power sector are provided
(x.1.5).
Energy is the foundation of economic development, and
energy poverty is the greatest obstacle to that development. Section 2, “Prospects for renewable power towards 2040”,
Therefore, the goals of German development cooperation
discusses selected electricity system transition scenarios
in the energy sector are to reduce energy poverty and to drawn from the IRENA report series, Planning and prospects
promote economic and social development, while also decar- for renewable power. After briefly explaining methodologies
bonising the power sector and supporting partner countries and assumptions (x.2.1), IRENA electricity capacity expan-
in the transformation to a low-carbon economy. The solutions sion scenarios are presented (x.2.2), focusing on the deploy-
to achieving those goals, however, will usually vary between ment potential of renewable energy given projected electricity
countries, as well as among different sectors within countries, demand growth, and already-committed projects and measu-
from the household level to the industrial level. To ensure that res. Implications for decarbonisation are also discussed. The
energy meets the specific needs of a country or sector, it has section concludes with an assessment of investment needs to
to be available in the right amount, at the right time, in the right realise the renewable deployment potentials as identified in
place, in the right quality and at the right price. Special atten- the IRENA scenarios (x.2.3).
tion should be given to ensuring energy is used productively
to foster and kick-start local economic activity, thus stimulating Section 3, “Systemic innovation needs and opportunities”,
economic development and creating local employment. When argues that a systemic approach covering innovations in
that is done successfully, the energy sector acts as a driving power generating and enabling technologies, market de-
force for a comprehensive, sustainable transformation and sign, business models and system operation is needed to
contributes to the development of national economies. go beyond the potentials quantified in the previous section.
Adopting a systemic approach allows for even more ambiti-
The potential for an African energy transition is explored in ous targets such as 100 % renewable-based power systems.
the report, The Renewable Energy Transition in Africa, jointly The section explores innovations in support of a power sec-
prepared by Germany’s KfW Development Bank, Deutsche tor transformation towards a much higher share of renewable
Gesellschaft für Internationale Zusammenarbeit (GIZ), and the energy in two subsections: the first discusses innovations for
International Renewable Energy Agency (IRENA) on behalf of renewable power systems (x.3.1); the second examines inno-
the German Federal Ministry for Economic Cooperation and vations for renewable-based electrification of end-use sectors
Development (BMZ). (x.3.2).
The following analysis was prepared by IRENA to provide Section 4 provides conclusions and areas for further consi-
a basis for German development cooperation in Africa. The deration.
analysis supplements the joint report’s insights by providing
the country-specific power sector contexts of the African
Energy Transition in five priority countries identified by BMZ.
The selected countries are the members of the Compact with
Africa Initiative: Ghana, Ivory Coast (Côte d‘Ivoire), Morocco,
Rwanda and the G20 member South Africa.
The Renewable Energy Transition in Africa | Preamble to the five country studies 11
1.3 Methodologies for the five country studies In addition, among the countries studied in this report, some The results presented reflect those of the specific analyses Countries can take advantage of the abundance and
have been analysed extensively in other IRENA reports (e.g. carried out above, and should not be interpreted as the hig- competitiveness of renewables
The five country studies build on a number of recent IRENA Morocco and South Africa in analyses on renewable energy hest ambition for each country in terms of renewable energy
analyses. The sections below describe the methodologies auctions; and Ghana in a Renewables Readiness Assess- deployment. For example, all fossil fuel power projects that Large unused renewable electricity generation potential exists
used for the case studies, including references to key publica- ment) and this report includes some of the key findings from have come to financial closure are assumed to proceed as in all five countries. Based on resource assessments and
tions and data sources used. those analyses. planned, and all existing and pipeline projects are assumed zoning analyses of wind and solar energy sources, the theo-
to fulfil their expected life without early retirement. Renewa- retical potential among non-hydro renewables are generally
1.3.1 Statistics and data sources While IRENA’s policy framework for a just and inclusive transi- ble energy costs also continue to decline at a rapid pace, and largest for solar conversion technologies (PV and CSP) follo-
tion has been presented as a recommendation for all countries integrating the most up-to-date cost data in future long-term wed by onshore wind and biomass.
The information presented in section 1 summarises key studied, it should be noted that there is no standard policy mix modelling could result in even greater economic potential for
energy and electricity statistics. The World Energy Balances, that can simultaneously fulfil all the renewable objectives of renewable energy. What is more, system-wide innovations Existing capacities and current generation practices are not
issued by the IEA (IEA, 2019c), are used to provide metho- every country. Comprehensive policy packages must be tai- are emerging rapidly that could enable even higher shares of reflective of the techno-economic potentials of resources,
dologically-consistent insights into the supply and demand lored to each specific national and local context, following a renewables. Section 3 in each country case study provides particularly in the context of renewable energy. The speed at
structure of energy commodities. The latest data available for more detailed and comprehensive review of the existing policy an overview of innovation opportunities that could potentially which previous technical potentials have turned renewables
these balances are for 2017. As a result, that is the year most mix. boost renewable shares beyond the ambitions presented in into economically competitive contenders has outpaced the
frequently referenced when referring to “current” energy or IRENA scenario analyses. The UNFCCC Paris Agreement has rate of actual investments in deployment.
electricity structures of supply and demand. 1.3.3 IRENA scenarios for renewable prospects highlighted the need for such increased ambitions – scenarios
that meet ambitious action on climate change would also need Pathways that include large shares of renewables are not only
IRENA collects and publishes global renewable capacity and The forward-looking scenarios discussed in section 2 of the to expand upon this analysis by exploring much-diminished technically feasible and attainable but also offer the lowest
generation statistics, with more than 50 renewable techno- country studies are based on IRENA’s Planning and Prospects roles for oil-, gas- and coal-fired power.2 costs – indeed, despite countries’ varying demand outlooks
logies specified. These statistics are complemented by less for Renewable Power report series. In this work, IRENA ap- and resource endowments, significant shares of renewables
detailed non-renewable technology data in the IRENA statis- plied its in-house electricity capacity expansion model – the 1.3.4 Analysis of systemic innovation needs and are cost-competitive across all scenarios analysed.
tics database to complete the portfolio of electricity generation System Planning Test (SPLAT) model1 – to develop power opportunities
technologies used by country. Capacity and generation data in system scenarios of renewable prospects out to 2040 for five However, each country has different socio-economic starting
the case studies reflect the latest release of this IRENA data- African power pools and 47 countries within those pools. The assessment of key innovations to support the power points, political ambitions and levels of current dependence on
base (IRENA, 2020f), covering generation statistics until 2018 sector transformation, presented in section 3 of the country fossil fuels, so the pace and exact path of the energy transition
(with certain country generation data available for 2019) and The analysis provides a view of grid-level power system de- studies, is an application of the IRENA toolbox, Innovation will also be different in each country.
capacity statistics to 2019. velopment based on IRENA insights into renewable resource landscape for a renewable-powered future (IRENA, 2019e).
availability, technology costs and performance characteristics. The toolbox contains 30 key innovations that enable the integ- Countries can align ambitious renewable energy and
1.3.2 Analysis of targets and policies The retirement schedule of current generation capacity fleets, ration of high shares of variable renewable electricity in power climate change mitigation targets
as well as committed project pipelines at the time of the ana- systems. The innovation toolbox follows a systemic innovation
The renewable energy targets reported in section 1 of the lyses, are also taken into consideration. Beyond committed approach covering four dimensions: innovations in enabling The economically viable renewable potentials identified in the
country studies reflect the targets set in national energy plans retirements and deployments, the rest of the grid-level power technologies, regulation and market design, business models analyses can exceed current national expansion plans – often
(or strategies), as well as the commitments in countries’ system is optimised out to 2040 according to cost minimisation and system operation. Tailored, innovative power sector solu- considerably. Likewise, the submitted NDCs are often out of
Nationally Determined Contributions (NDCs). These data are principles, subject to the physical energy flow and operation tions result from combining innovations in these four dimen- sync with committed capacity expansion projects or project
collected by IRENA for almost 200 countries and are regularly constraints of a power system. Optimisation is performed at sions. For each country case, a portfolio of innovations has plans in the pipeline. Simply matching implementation efforts
updated to ensure accurate and timely information. It should the regional level, i.e. for a power pool with its member count- been devised with the aim of further exploring their potential to higher ambitions represented in NDCs and energy plans
be noted that while national targets provide an indication of ries treated as a homogeneous entity. The optimisation results and relevance to the country context. would generate considerable investment opportunities.
renewable energy deployment plans and their timelines, their may or may not be substantially different from the optimal
implementation requires clear strategies and supportive poli- power mix for a single country when trade is not considered. In addition to country-specific insights, there are naturally Countries can continue supporting the development of
cies (IRENA, 2015b). Non-renewable features of power system development were more generic opportunities for innovation that are valid across regional markets
calibrated according to official regional power pool master- the five countries included in this analysis. IRENA’s Innova-
In addition, the targets included in countries’ original NDCs plans, when available. tion landscape for a renewable-powered future report outlines Cross-border electricity trade can be a crucial element that
only represent snapshots of their commitments under the such opportunities in an eight-step innovation plan which is affects the timing and extent of renewable capacity expan-
Paris Agreement at a given point in time, in most cases at In this report, the scenarios for South Africa and Rwanda ref- used as the basis for some of the common findings presented sion. Regional electricity markets (i.e. regional power pools)
the moment of ratification of the agreement. As the “ratcheting lect the least-cost power sector optimisation of a combined in the following section of this introduction. based on cross-border market integration, transparent rules
mechanism” built into the Paris Agreement requires countries Southern and Eastern power pool region. A full description of and harmonised regulations across various borders help ba-
to submit progressively more ambitious NDCs over time, the the assumptions and results behind that analysis will be made 1.4 Findings common to all five countries lance generation surpluses and shortages in national power
first round of NDCs lays out minimum targets that represent available in a corresponding report, soon to be released by systems, as well as enable the matching of complementary
starting points from which to increase ambitions in the future. IRENA (IRENA, forthcoming). 1.4.1 Basic conclusions emerging from the analyses generation profiles of renewables. Regional integration can
increase the market for large-scale additions of solar PV and
The policies, regulations and measures in support of renewa- The scenarios for Ghana and Ivory Coast reflect the least-cost Each of the five country case studies contains specific con- wind, and result in lower overall generation system costs. A
ble energy deployment in the power sector in the five case optimisation of the Western African Power Pool. The scenarios clusions related to the level of ambition for renewables, the bottleneck affecting cross-border trade, as well as the large-
studies are either national or sub-national (not continental or were presented by IRENA (IRENA, 2018b) to 2030, and that framework for a just and inclusive transition, and innovation scale implementation of VRE, is the slow pace of infrastructure
regional) and reflect their status as of July 2020. These are horizon was extended to 2040 for this report. needs and opportunities. In addition, there are common con- investments in transmission, distribution and storage capaci-
collected in IRENA’s repository of knowledge on policies and clusions that emerge from the analyses, which are presented ties – countries can continue their concerted efforts to improve
measures. The scenarios for Morocco were developed as a single count- here in order to frame the country-specific discussions that this vital infrastructure.
ry model for this report. The Moroccan scenarios will be further follow.
developed as part of an overall update to IRENA’s North
African power pool modelling, to be featured in a future IRENA
publication.
1
The SPLAT model was developed using the modelling software MESSAGE, developed by the International Institute for Applied Systems Analysis (IIASA) and adapted by the International 2
More ambitious scenarios would also be well-aligned with goals of global partners, as reflected, for example, in the European Commission’s joint communication, “Towards a comprehensive
Atomic Energy Agency (IAEA) for national energy planning purposes (IAEA, 2017). strategy with Africa” (European Commission 2020b).
12 Preamble to the five country studies | The Renewable Energy Transition in Africa The Renewable Energy Transition in Africa | Preamble to the five country studies 13
Countries can leverage renewables and distributed energy Section 1.4.3 provides more detail on how future policy can Adopt a systemic approach to innovation
resources (DER) to achieve universal energy access 1. Develop far-sighted policy frameworks that anticipate build on those examples, but such policies are part of a
future power system needs. comprehensive package that connects deployment policies
Innovations do not emerge in isolation. By considering
Access to electricity has been expanding in all countries and with integrating and enabling policies. The latter include: innovations in a) generating and enabling technologies (like
universal access (Sustainable Development Goal 7) appears 2. Adopt a systemic approach, drawing together innova- 1) industrial policies that aim to leverage and enhance digital technologies, electric vehicle smart charging or rene-
within reach if centralised grid connections are supplemen- tions in technology, market design, business models domestic capabilities; 2) education and skills policies that wable-power-to-X technologies), b) regulatory frameworks,
ted with distributed energy resources (DER) and renewables. and operation. increase technical capacities and technological learning; c) business models and d) new system operational practices,
However, progress towards universal access has focused
3. Foster learning by doing through ongoing trial and 3) labour market policies that facilitate labour opportunities, policy makers can devise practical solutions for their national
mainly on providing electricity to private households. It is also demonstration. rights and mobility; 4) financial policies that encourage re- power sectors.
important to ensure access to levels of electricity that are venue streams that benefit more people; and 5) social pro-
higher than those generally required by households. Those 4. Account for changing roles and responsibilities in the tection measures that provide support for vulnerable workers Synergies can also be explored between multiple technolo-
higher amounts are required for productive uses – such as in operation of the power system. and their communities and prevent them from shouldering an gies by adopting “hybrid” approaches that combine several
agriculture, commerce and industry – that are vital for econo- 5. Make market design innovation a priority, as it fosters unfair burden during the energy transition. renewable generation technologies into practical solutions. For
mic development and job creation. Progress towards u niversal flexibility at relatively low cost. example, pumped hydropower plants can be equipped with
access should therefore include assessments of these pro- Countries can work to overcome common structural floating solar photovoltaic panels in Côte d’Ivoire, Morocco,
ductive user groups and their respective energy needs. 6. Create synergies between renewable power supply
barriers Rwanda and South Africa. That can reduce installation and
and electric mobility, heating and cooling.
operation costs since the existing grid connections can be
To meet this expanded view of universal access, there is con- 7. Turn smart innovations into smart solutions using IRENA’s analysis shows that there are a number of structu- shared. Similarly, decentralised energy resources – like be-
siderable potential for the rollout of innovative solutions like digital technologies. ral barriers to the energy transition that are common to many hind-the-meter batteries, distributed generation and demand
renewable mini-grids, solar home systems and micro turbines, African countries, including: a lack of capacity in key instituti- response – can contribute to the stability of the grid by provi-
8. Adopt an open and cooperative approach to innovation.
which can contribute to national climate and energy goals, ons; weak or missing regulatory and legal frameworks; electri- ding ancillary services, provided that a regulatory framework
and provide services to power system operators. However, city grids with high rates of loss and limited ability to integrate that allows them to do so is in place.
these DERs sometimes receive lower priority than large-scale Box 1 – IRENA innovation landscape report – Eight-step innovation plan high levels of variable renewable electricity; high costs for
projects in national plans, and could also be better represen- some distributed generation technologies like mini-grids; and At the same time, on- and off-grid strategies can be pursued in
ted in NDC pledges. A key requirement to ensure new innovations are well integra- grid operators and service providers that may not be able to parallel, and wire and non-wire solutions can be complemen-
ted into power systems is to develop and maintain long-term expand access or invest in decarbonisation solutions. As a tary. For example, grid congestion in Côte d’Ivoire and South
Electricity demand growth is also expected to continue beyond plans and planning practices that are tailored to country cir- result, there is a clear need for African countries, supported Africa could be tackled not only by the construction of new
the point of simply providing universal access to electricity. cumstances. For example, as elaborated in the case studies by their development partners, to address and work toward transmission lines, but also by energy storage systems and
Alongside measures that improve energy efficiency, countries of this report, the emergence of a global hydrogen economy removing these structural barriers. digital technology applications, like virtual power lines.
could consider how DERs can align with electricity demand could open long-term opportunities for countries in this analy-
increases due to demographic growth, higher living standards sis to make even greater use of low-cost renewable electricity. 1.4.2 IRENA’s eight-step innovation plan adapted Foster learning by doing
and further penetration of electricity-consuming devices and Major actors in Europe are already taking significant steps in for the five African countries studied
equipment, including electric vehicles (EVs). this area – both the European Commission and the German Given the importance of a reliable electricity supply, experi-
government, for example, have released hydrogen strategies. Here are the details of the eight-step innovation plan adapted menting with the power system can be challenging to defend
Countries can develop tailored power sector transforma- This early experience shows that a long-term plan is requi- from IRENA’s Innovation landscape for a renewable-powered publicly. However, regulatory “sandboxes” – frameworks that
tion plans based on a systemic innovation approach red to understand how new power demand could evolve, and future report (IRENA, 2019e) for Côte d’Ivoire, Ghana, allow stakeholders to experiment without restrictions in a
to identify the innovations required to ensure that generation Morocco, Rwanda and South Africa: given time frame or in a specific part of the grid – can prove
High shares of VRE in power systems across all countries will technology, social and technical regulations, and system ope- to be beneficial in the long term. For example, in Morocco, the
need to be accompanied by accelerated and systemic inno- ration evolve alongside it. Anticipate future power needs Akhawayn University is piloting the first hybrid fuel cell powe-
vation. While specific innovation needs will vary by country, red with wind electricity in Africa.
innovations are generally required in electricity generation Countries can build on policy frameworks for just and in- To achieve this, regularly updated national plans and planning
technologies, new enabling technologies, regulation and mar- clusive transitions processes can explore scenarios that consider the latest rene- Moreover, patent data available for Morocco and South Africa
ket design, business models and system operation practices. wable energy technology developments, including their con- show that those countries are already innovating significant-
IRENA’s Innovation landscape for a renewable-powered future The starting point and policy actions to support a just and tinuously falling costs, increased efficiencies and increased ly in the power sector – especially in CSP, thermal energy
report outlines an eight-step innovation plan to provide a better inclusive energy transition vary from country to country. They competitivity compared to conventional technologies. storage and hydrogen in the case of Morocco; and solar, bio-
sense of how such innovation can be fostered (see Box 1). depend on diverse country-specific factors, including socio- energy and hydrogen in South Africa. Such innovation can be
Section 1.4.2 goes into further detail on these opportunities for economic conditions, fossil fuel and other dependencies, in- Currently, at first sight, some technology-driven innovations sustained with supportive policies and regulatory sandboxes.
innovation across all five countries. stitutional frameworks and capabilities, investment patterns identified for the countries in this analysis might seem far-
and trade positions. For example, Morocco, which has rea- fetched today in the African context. However, after closer Account for changing roles and responsibilities
ched universal access to electricity, albeit with a low share of inspection – and while adopting a farsighted approach – these
renewables, faces different energy transition challenges to can be highly relevant in the medium- and long-term. African The energy transition calls for a shift away from the traditional
Rwanda, which has yet to provide electricity to all of its citi- countries can leapfrog development based on polluting fuels power system – in which generation follows inflexible demand
zens. Moving forward, policy design needs to be holistic and and fully embrace the energy transition based on renewables. – towards a system in which flexibility also is provided from
consider the impact of deployment policies not only on the For example, artificial intelligence (AI) and ‘big data’ might (existent or planned) interconnections and the demand side.
energy sector but also on society, the environment and the seem as unrealistic to apply in some African countries today, Therefore, roles and responsibilities are changing not only for
economy at large. In the non-access context, long-term sta- but Côte d’Ivoire is already testing them for use in grid main- the incumbents, but also for consumers, who can play more
ble deployment policies are needed to attract investments in tenance. active roles in the power sector. In the more highly-developed
renewables. However, such instruments need to continuously future power systems of the countries anticipated in this ana-
adapt to changing market conditions. Although some of the lysis, consumers will be able to react to price signals, provide
countries in the analysis have made important progress, more services to the grid via aggregators, and also generate their
efforts are needed to achieve the plans that have been set. own power, provided that the necessary frameworks are in
place and that consumer empowerment and awareness are
promoted.
14 Preamble to the five country studies | The Renewable Energy Transition in Africa The Renewable Energy Transition in Africa | Preamble to the five country studies 15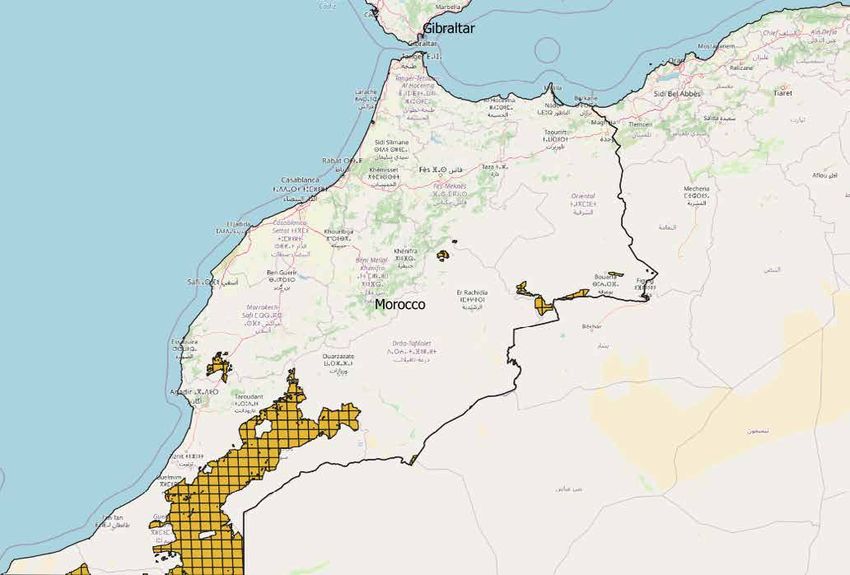
New business models like peer-to-peer electricity trading, For example, changes to the procurement rules for generation components and services were sourced locally and 70 percent Finally, it is crucial to tie energy supply to productive end-uses
community ownership models, aggregators, pay-as-you-go by municipalities in South Africa, or allowing more Indepen- of the workers are Moroccan, including many women. To crea- like agriculture and local manufacturing, and to public services
models and energy-as-a-service are all being tested in various dent Power Producers (IPPs) to enter various African power te a skilled labour force, government agencies trained people like water, healthcare and education in order to improve live-
African countries. However, to scale them up, policy makers sectors, could be cost efficient in the short and medium term, in the region to become electrical and mechanical technicians, lihoods and maximise the socio-economic benefits of energy
and independent regulators (where they exist) would need to with minimal public investments. Also, policies in support of solar field operators or mirror cleaning operators. access (IRENA, 2016b). Productive uses go beyond the con-
allow and promote these new models. They also need to seize renewable power should expand beyond increasing the instal- sumption of electricity in households. Therefore, broadening
the opportunities created by new technologies, which will at- led generation capacity, and also allow consumers to own and Similarly, South Africa’s local content requirement has boosted the understanding of electricity access needs in commercial
tract new actors into the power sector. operate community-owned renewable mini-grids. local manufacturing and helped create a small export indus- and industrial applications is crucial to maximise the producti-
try of solar PV and wind turbine components. South Africa’s vity of electricity at all stages of value chains. Work has been
Create synergies through sector coupling Turn smart innovations into smart solutions REIPPPP also projects that it will create more than 100 000 done to extend frameworks for measuring energy access to
job-years for local citizens and lead to more black-owned include such critical aspects, along with necessary reliability
New electrification strategies – either employing the direct use For policy makers to devise tailor-made, practical, implemen- businesses. and quality of supply (Fraunhofer ISI, 2018). Those access
of renewable sources or the indirect use of renewable power- table and “smart” innovative solutions, two aspects are key: strategies need also to advance other Sustainable Develop-
to-hydrogen and renewable power-to-heat technologies – can first, solutions need to combine several innovations across A just and inclusive energy transition would also provide ment Goals (SDGs), including gender, health and education
be beneficial not only for the power sector, but also for end-use various dimensions, such as enabling technologies, business support to communities affected by new developments. As (IEA, IRENA, UNSD, World Bank and WHO, 2020).
sectors like industry, transport and buildings. models, regulation and market design and system operation; compensation for the land lost to develop the Noor complex,
second, it is important to find the most suitable applications for for example, Morocco invested in basic amenities and social In sum, for Côte d’Ivoire, Ghana, Morocco, Rwanda and South
In industry in Rwanda, for example, renewable power could individual technologies. services in the surrounding community, such as drainage and Africa to achieve the ambitions set in their energy plans, their
be generated on-site for mining and quarrying, while on-farm irrigation channels, drinking water facilities, community cen- targets need to be translated into policies and measures that
biodigesters and solar pumping could be used for irrigation in For example, in more robust future energy systems, green tres and mobile health caravans. Indeed, social, health and can support deployment inclusively in all end-uses. Inevitably,
agriculture. Similarly, residues from sugar, palm oil and cotton hydrogen can be exported by Morocco and South Africa, and gender equality are important factors of a just and inclusive there will be trade-offs between achieving socio-economic ob-
operations in Côte d’Ivoire and other countries could be used at the same time can be used for the indigenous ammonia in- energy transition. jectives and procuring electricity at low prices in the short term.
to generate bioenergy, which would bring additional revenues dustry. South Africa could specialise in the manufacturing and But in the long run, the overall benefits of creating a more just
to the plant owners. In Ghana, aluminium production could be export of fuel cells, given that it has the world’s largest plati- Challenges still remain. Morocco and South Africa have lear- and inclusive transition far exceed the extra costs of short-
electrified with renewables in the future if enough reliable and num reserves, which are important in the production process. ned that it is difficult to achieve goals for increasing the par- term electricity prices.
very low-cost electricity is made available. ticipation of women in the energy sector, and South Africa is
Adopt an open and cooperative approach to innovation still working to create more long-term and meaningful jobs for
Some promising industrial initiatives and national strategies black citizens that go beyond meeting the short-term labour
include the hydrogen strategy in South Africa (HySA), as well An open and inclusive approach to innovation requires colla- requirements of developers.
as an upcoming hydrogen strategy in Morocco. Both count- boration and cooperation not only between the public and the
ries have significant potential to become green hydrogen private sectors, but also at the international level. Examples In addition, for countries that are working to provide univer-
producers. In Morocco, fishing, mining, green ammonia and include the partnership between Morocco and Côte d ’Ivoire sal access to electricity, it is necessary to have overarching
phosphate-based fertiliser production could greatly benefit within the pan-African Green Africa Innovation Network, as integrated plans that support all of the different electrification
from domestic renewables. Morocco could also switch from well as the German-Moroccan-Energy Partnership. Such modes – including grid extensions, mini-grids and stand-alo-
importing carbon-based ammonia to producing green ammo- exchanges of lessons learned should be actively pursued,
ne systems – and prevent conflicts among them. Such plans,
nia domestically. because these are beneficial to everyone in the long term. This like those adopted in Rwanda, then need to be combined with
is especially crucial, since the challenges faced by humanity, financing for both suppliers and end-users. End-users, in parti-
In transport, pilots to electrify transport, such as Côte d
’Ivoire’s like climate change, know no borders. cular, need innovative financing and business models to cover
adoption of three-wheeled electric vehicles, could be expanded connection costs, leasing or owning stand-alone systems and
into ambitious national plans that take advantage of increased 1.4.3 Deeper discussion and examples of policy purchasing appliances. Rwanda, for example, has secured
solar energy. Regulations that ban imports of older cars and opportunities common to all countries dedicated funds from organisations like the Climate Invest-
set strict emissions standards, like those in Morocco, can be ment Funds (CIF) and the Abu Dhabi Fund for Development.
adopted in other countries. The countries in this analysis have taken important steps
toward building policy frameworks that promote a just and
In the buildings sector, and especially in rural areas with no or inclusive energy transition. As the governments of these
poor access to electricity in Côte d’Ivoire, Ghana and Rwanda, countries continue to build on those frameworks, they can
renewable mini-grids and a higher uptake of solar water hea- draw upon a number of regional good practices and lessons
ters, solar water pumps, clean cooking stoves and solar home learned. It is important for governments to constantly adapt
systems for mobile charging and lighting could be especially to changing market conditions. Ghana, for example, shifted
beneficial. Morocco already has a “Green and Smart Building from an administratively-set tariff-based mechanism to a com-
Park” effort and a “Green Mosque Programme”. Other count- petitively-set mechanism to limit the cost of support. Moreover,
ries could implement similar programmes. Ghana adopted fiscal and financial incentives to reduce the
upfront costs of investment.
Make regulatory updates and improved market designs
higher priorities Morocco and South Africa are pioneers in designing policies
that maximise the socio-economic benefits of renewable
Until new capital-intensive transmission and generation energy deployment. Both Morocco’s Noor-Ouarzazate solar
capacities can be constructed, it is possible to make signifi- complex and South Africa’s Renewable Energy Independent
cant gains simply by updating existing regulatory frameworks Power Producer Procurement Programme (REIPPP) use re-
and adopting new market designs. One example is Ghana, newable energy auctions to promote socio-economic bene-
which has liberalised its power sector. It is also important to fits beyond procuring electricity at the lowest price (IRENA,
harmonise trading rules across borders, which would reduce 2019g). Morocco, for example, encouraged the use of local
system costs over the long term and lower bills for consumers. materials and labour; as a result, 30-35 percent of the project’s
16 Preamble to the five country studies | The Renewable Energy Transition in Africa The Renewable Energy Transition in Africa | Preamble to the five country studies 17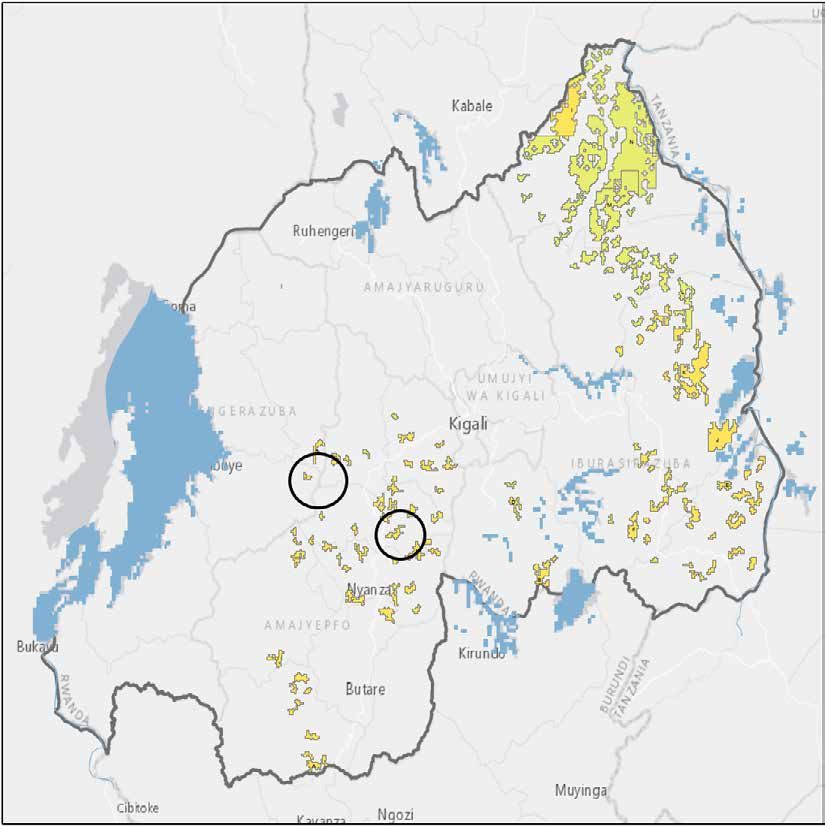
2 Côte d’Ivoire country analysis

                                                                                                   In 2017, total final energy consumption (TFEC) was 299 PJ.
     Key messages                                                                                  It was made up of biofuels (primary solid biofuels and char-
                                                                                                   coal at 61 %), petroleum products (27 %) and electricity (8 %),
     Côte d’Ivoire has significant opportunities to accelerate the                                 with the remainder from natural gas (Table 2). The biofuels are
     share of renewable electricity (mostly solar PV) in its power                                 used only in the buildings sector (residential and commercial).
     sector, to further strengthen its position as an electricity
     exporter in the region, and to provide electricity access to                                  The residential sector accounts for the majority of final energy
     the 67 percent of rural areas that currently lack it by both                                  consumption at 60 percent (Table 2). That dominance reflects
     expanding the grid and building solar PV mini-grids. In                                       the sector’s high dependence on biomass for cooking and
     any case, the energy supply should be linked to producti-                                     heating. These end-uses are less efficient than modern fuels
     ve end-uses, such as agriculture and local manufacturing,                                     like electricity or liquefied petroleum gas (LPG).
     and public services like water, healthcare and education to
     improve livelihoods and maximise the socio-economic be-                                       Electricity consumption in Côte d’Ivoire has grown at an ave-
     nefits of energy access. Adding coal capacity is not needed                                   rage growth rate of 5.8 percent per year since 1971. Elect-
     from an economic standpoint and should be reconsidered                                        ricity consumption in 2017 was split almost evenly between
     if Côte d’Ivoire aims to increase its ambitions to cut green-                                 the commerce and public services sector (35 %), the industry
     house gas emissions.                                                                          sector (33 %) and the residential sector (32 %). Electricity pro-
                                                                                                   vides only four percent of the energy in the residential sector.
2.1      Status quo of the power sector in Côte d’Ivoire                                           Electricity makes up 26 percent of the energy in the industry
                                                                                                   sector and 25 percent in the commercial and public service
2.1.1 Brief introduction of the overall energy landscape                                           sector. Compared to neighbouring countries, Côte d’Ivoire has
                                                                                                   a more reliable supply in terms of low blackout frequency and
In 2017, Côte d’Ivoire’s primary energy supply (TPES) was                                          duration.
438 PJ, dominated by primary solid biofuels3 (60 %), followed by
crude oil (35 %) and natural gas (18 %) (Table 1). The country                                    Total electricity consumption in 2017 was 6 617 GWh. In 2017,
produces crude oil and natural gas, and is a net exporter of oil                                  per capita consumption was 279 kWh per person per year
products. Crude oil (152 PJ) is mainly used in the refinery pro-                                  (IEA, 2019c). Greenhouse gas (GHG) emissions from fuel
cess and natural gas (79 PJ) is used for electricity generation.                                  combustion have risen from 8 Mt of CO2 in 2012 to 10 Mt in
                                                                                                  2017, with the most recent data showing roughly 4 Mt of CO2
In the same year, crude oil (oil and condensate) production was                                   emissions from natural gas and 6 Mt from oil in 2017 (IEA,
12.8 million barrels, with an average production of 35 126 bar-                                   2019c).
rels per day and 1 068 406 barrels per month (MPEER, 2020).
The country is also historically a net exporter of electricity.

                          Crude, NGL and                                                                                   Primary solid
                                                    Oil products            Natural gas                 Hydro                                         Electricity                Total
                            feedstocks                                                                                        biofuels
    Production                             86                        0                     79                        6                    264                           0                  435

    Net imports                            66                     -46                        0                       0                       0                      -7                      13

    Others                                   0                    -13                        0                       0                       0                          0                  -10

    TPES                                  152                     -57                      79                        6                    264                       -7                     438

Table 1 – TPES in 2017 in PJ                                                                                                                                                Source: (IEA, 2019c)

                                                                                             Primary solid
                                         Oil products               Natural gas                                          Charcoal                  Electricity                  Total
                                                                                                biofuels
    TFEC                                                  79                        13                      139                         45                       24                        299

    Industry                                              10                        13                         0                         0                          8                       30

    Transport                                             50                         0                         0                         0                          0                       50

    Residential                                            8                         0                      128                         36                          8                      179

    Commercial and public                                  5                         0                        11                         9                          8                       34
    services

    Agriculture/forestry                                   6                         0                         0                         0                          0                        6

                                                       26 %                       4%                       46 %                      15 %                        8%                      100 %

Table 2 – TFEC in 2017 in PJ                                                                                                                                                Source: (IEA, 2019c)

3
 Defined in IEA statistics as any plant matter used directly as fuel or converted into other forms before combustion. This covers a multitude of woody materials generated by industrial
processes or provided directly by forestry and agriculture (firewood, wood chips, bark, sawdust, shavings, chips, sulphite lyes also known as black liquor, animal materials/wastes and
other solid biofuels).

The Renewable Energy Transition in Africa | Côte d’Ivoire country analysis                                                                                                                   19
2.1.2 Electricity generation and use 2.1.4 National planning scenarios, NDC and key
emissions/renewable energy targets
Côte d’Ivoire has the third largest installed electricity capaci-
ty, after Nigeria and Ghana, in the West Africa Power Pool Government plans
(WAPP) (IRENA, 2018b). In 2017, the total was 2 185 mega-
watts (MW) (see Figure 1). Of this, thermal plants (largely Côte d’Ivoire launched a programme in 2011 to double installed igeria (though Ghana has dropped out of this discussion).
N
natural gas) accounted for 59.4 percent, with the remainder electricity generating capacity by 2020. From 2011 to 2017, the The recent update to the ECOWAS regional power system
coming from renewables – almost entirely hydropower country invested FCFA 7 trillion (more than USD 11 billion), ac- master plan has confirmed that further regional grid integration
(IRENA, 2020f). These sources generated 9 955 GWh in 2017, cording to data from the Ministry of Energy (MPEER, 2020). In is a top priority. It is a rational energy security and affordability
with natural gas dominating at 82.7 percent of the total. Hydro addition, in 2013, it launched the National Rural Electrification strategy under any future explored in the plan, and also redu-
was far behind at 14.9 percent, followed by biofuels at 1.7 per- Programme (PRONER) with a goal of electrifying of all localities ces the risks of curtailed hydropower generation during exten-
cent and oil at 0.7 percent. with more than 500 inhabitants (over 5 000 localities) by 2020. ded drought periods (MPE, 2016b; Tractebel, 2018).
As a result of increases in natural gas generation, CO2 emis- In terms of the capacity mix, the 2014 Master Plan for Hydro- The National Determined Contribution and key emissions
sions have been on the rise (IEA, 2019a). The future role of power aimed to double the country’s hydroelectric capacity to targets
natural gas is thus central to the discussion of reducing carbon 2 017 MW by 2030. CI-Energies has identified large-scale and
emissions, particularly in scenarios aligned with the ambitions small-scale hydro projects that can help reach the country’s In 2016, Côte d’Ivoire confirmed its Nationally Determined
of the Paris Agreement. targets. The government also plans to diversify the capacity Contribution (NDC) to the Paris Agreement with the UNFCCC.
Source: (IRENA, 2020e)
mix beyond natural gas and hydropower. It plans to add other The NDC targets for renewable energy reflect those of the
Between 2017 and 2018, no additional capacity has been Figure 1 – Installed generation capacity between 2000 and 2019 renewables (mainly solar PV5 and biomass), and is even con- country’s 2016 PANER, including a future generation mix of 26
recorded. Hydropower generation increased 3.0 TWh in 2018 sidering the construction of coal-fired power capacity. percent large hydropower (above 30 MW) and 16 percent other
due to the additional output of the newly-commissioned Sou- 2.1.3 Access to electricity renewables. The total share of renewables would thus amount
bré dam (in 2017),4 while the output from fossil-fuel-powered While an official power sector masterplan is currently under to 42 percent by 2030 (Republic of Côte d’Ivoire, 2015).
plants dropped to 7.0 TWh (IRENA, 2020e). The share of rene- Like other sub-Saharan African countries, Côte d’Ivoire has development and therefore not yet available, insights into the
wable energy in the generation mix increased from 21.5 per- been slow to increase access to electricity. Overall access of planned power sector development can be gained from the Despite this greater share of renewables in power generation,
cent in 2017 to 29.7 percent in 2018. According to the Ministry the population is only 67 percent. There also is a large dispari- country’s Nationally Determined Contribution (NDC) and the however, overall greenhouse gas emissions could still increase
of Petroleum, Energy and Renewable Energy (MPEER), this ty between urban areas, which have 100 percent access, and National Action Plan for Renewable Energy (PANER), which because of the country’s national socio-economic development
production in 2018 required the consumption of 1 776 million rural areas, at only 33 percent access (World Bank, 2020a). was released in 2016 and adopted by the government in 2019. aspirations and strong demographic growth. At an estimated
cubic metres of natural gas, estimated at FCFA 207.4 billion Table 4 summarises PANER’s renewable energy objectives gross domestic product (GDP) growth of 8.4 percent by 2030
(MPEER 2019). Providing universal access to electricity is a key goal of the (MPE, 2016b). (before the COVID-19 crisis), the NDC shows GHG emissions
Sustainable Development Goals (SDGs) and the Sustainable per capita potentially rising from 0.81 tCO2e to 1.17 tCO2e.
The MPEER is also focusing on reducing unmet load (“En- Energy for All (SE4ALL) Initiative. Under the umbrella of these As the 2014 Plan Directeur du Réseau de Transport d’Électri-
ergies Non Distribuées”) in the system, which has been initiatives, the Government of Côte d’Ivoire has launched the cité (Tractebel, 2014) acknowledges, the national grid is aging According to the NDC, the power sector in 2012 accounted for
significant in the past. Unmet load in 2018 was 20.8 GWh, a Programme Électricité Pour Tous (PEPT) and Programme and needs an upgrade and extensions to accommodate hig- 21.6 percent of all greenhouse gas emissions (16 MtCO2e), lar-
reduction of 2.1 percent from the 21.3 GWh in 2017 (MPEER, National d’Electrification Rurale (PRONER) to make universal her demand and higher shares of solar PV electricity. Invest- gely from natural gas use. In the NDC’s Low Carbon scenario,
2019). access a reality (JICA, 2019). ments in transmission and distribution are planned so that the power sector emissions would drop from about 11.9 MtCO2e
grid can accommodate more variable renewable energy and in a business-as-usual scenario to a little over 9.2 MtCO2e (re-
Côte d’Ivoire is a key exporter of electricity to other countries in Measures the government has pledged to increase access in- become more efficient (World Bank, 2017). presenting 37.5 percent of the country’s overall emissions) by
the region, exporting 10-20 percent of its electricity production clude lowering the cost of grid connections, providing service 2030. The power sector would contribute 27.6 percent of the
in recent years to Ghana, Burkina Faso, Mali, Benin, Togo and concessions to firms that offer off-grid solutions, and using The PANER also stresses the importance to Côte d’Ivoire of total emissions reductions in the Low Carbon scenario. The
Liberia (JICA, 2019). feed-in tariffs to encourage different energy sources (MPE, further expanding interconnections with neighbouring count- agricultural sector would contribute 24.1 percent of the reduc-
2016b). Off-grid electrification is a top policy priority (ECREEE, ries in the West African Power Pool (WAPP). These include tions, and the transport sector 20.3 percent.6 The power sector
2019), given that the low rural access rate has remained virtu- cross-border infrastructure such as the CLSG interconnection is, therefore, a key sector in Côte d’Ivoire’s plans to reduce
ally unchanged since 2008-2009. In one sign of progress, 326 with Liberia, Sierra Leone and Guinea, as well as an impro- emissions (Republic of Côte d’Ivoire, 2015).
communities were electrified in 2018 (MPEER 2019). ved connection with Ghana and by extension Benin, Togo and
Installed capacity (MW) 2010 2020 2030
Units MW % MW % MW %
2017 Latest data Renewable installed capacity 604 43 % 1 894 51 % 3 259 57 %
(including hydro ≥ 30 MW)
Generation (TWh) Capacity (MW) Generation (TWh) 2018 Capacity (MW) 2019 On-grid electricity generation (GWh) 2010 2020 2030
On-grid 10 2 178 10 2 178 Units GWh % GWh % GWh %
Natural gas 1 293 1 293 Electricity generated through renewable 273 8% 1 893 11 % 5 354 16 %
sources (excluding hydro ≥ 30 MW)
Fossil fuels n.e.s. 8 5 7 5
Electricity generated through middle and 1 345 20 % 3 292 23 % 6 380 26 %
Hydropower 2 879 3 879
large hydro capacity (≥ 30 MW)
Off-grid 0.007 8 0.007 8
Electricity generated through renewable 1 618 28 % 5 148 34 % 11 293 42 %
Off-grid Solar photovoltaic 0.007 8 0.007 8 sources
Table 3 – Electricity generation and capacity Source: (IRENA, 2020f) Table 4 – Renewable energy targets in Côte d’Ivoire PANER (in % of total installed capacity and total electricity generation)
4
There are also planned hydropower plants in Louga (280 MW) in cascade with the existing Buyo hydropower plant, Gribo-Popoli (112 MW), Singrobo (44 MW), etc. (CNP-PPP, n.d.). 5
Seven solar PV projects are already under development for a cumulative 258.5 MW, and additional 700 MW are planned by 2030 (JICA, 2019).
In addition, Côte d‘Ivoire plans a joint hydropower plant with Liberia in Tiboto (225 MW). 6
The emissions avoided cover the three main gasses carbon dioxide (CO2), methane (CH4), and nitrous oxide (N2O).
20 Côte d’Ivoire country analysis | The Renewable Energy Transition in Africa The Renewable Energy Transition in Africa | Côte d’Ivoire country analysis 21You can also read


