LATIN AMERICA AND CARIBBEAN - RENEWABLE ENERGY TENDERS AND COMMUNITY EM POWER MENT - REN21
←
→
Page content transcription
If your browser does not render page correctly, please read the page content below
RENEWABLE ENERGY TENDERS
AND COMMUNITY [EM]POWER[MENT]

            LATIN AMERICA
            AND CARIBBEAN
”
   REN21 is committed to tracking the development of
 renewables worldwide. In addition to its annual flagship
publication - the Renewables Global Status Report - REN21
   works with regional partners to shed further light on
   renewables development in different world regions.
ACKNOWLEDGEMENTS

This report was produced by the Renewable Energy Policy                         Alba Gamarra (Centro de Información de Energías Renovables –
Network for the 21st Century (REN21). More than 40 experts                      CINER, Bolivia)
and reviewers from across Latin America and the Caribbean and                   Henry García (Pontificia Universidad Católica, Peru)
elsewhere contributed to the report’s content.                                  Juan Carlos Gómez (Factor, Spain)
                                                                                Sebastian Goñi (VENTUS, Uruguay)
AUTHORSHIP                                                                      Alaide González (Guatemala)
Hugo Lucas (Factor)                                                             Stefan Gsänger (World Wind Energy Association – WWEA,
Anna Leidreiter (World Future Council)                                          Germany)
Miquel Muñoz Cabré (Factor)                                                     Gabriel Konzen (Energy Planning Agency, Brazil)
                                                                                Christine Lins (REN21, France)
PROJECT MANAGEMENT                                                              Nestor Luna (Ecuador)
                                                                                Riquel Mitma (OSINERGMIN, Peru)
Lea Ranalder (REN21)
                                                                                Adrián Moreno (Ecuador)
Laura E. Williamson (REN21)
                                                                                Luis Alfonso Muñozcano Alvarez (SENER, Mexico)
                                                                                Sergio Oceransky (Yansa, USA)
PRODUCTION
                                                                                Juan Esteban Pérez (Promigas, Colombia)
REN21 Secretariat, Paris                                                        Pep Puig (Ecoserveis, Spain)
                                                                                Michelle Ramirez (SENER, Mexico)
EDITING, DESIGN AND LAYOUT                                                      Lea Ranalder (REN21, France)
Lisa Mastny, editor                                                             Francis Raquet (VENTUS, Uruguay)
Formas do Possivel – Creative Studio, design                                    Jessica Susana Rodriguez Aguilar (SENER, Mexico)
(www.formasdopossivel.com)                                                      Oscar Ruiz Carmona (SENER, Mexico)
                                                                                Fabian Schenk (WWEA, Germany)
CONTRIBUTORS AND REVIEWERS                                                      Ramiro Trujillo (Transtech, Bolivia)
Francisco Acuña (InTrust Global Investments, USA)                               Thiago Vasconcellos Barral Ferreira (Energy Planning Agency, Brazil)
Rana Adib (REN21, France)                                                       Diego Villarreal Singer (SENER, Mexico)
Tabaré Arroyo (WWF Latin America & the Caribbean, Mexico)                       Laura E. Williamson (REN21, France)
João Bayão (Energy Planning Agency, Brazil)
Benjamin Bayer (Institute for Advanced Sustainability Studies,                  Funding for the report was provided by Germany’s Federal Ministry
Germany)                                                                        for Economic Affairs and Industry (BMWi).
Adriano Bonotto (Energy Planning Agency, Brazil)
Gonzalo Bravo (Fundación Bariloche, Argentina)                                  This report has benefited from the input of experts during two
Luis Camacho (Asia Pacific Energy Research Centre, Japan)                       regional workshops, May 2017: Mexico (hosted by WWF) and Peru.
Fidel Carrasco Gonzalez (Ministry of Energy – SENER, Mexico)
Sandra Chavez (Clean Energy Engineer, Mexico)
Juan Coronado (Auster Energy, Peru)                                             Report Citation: REN21, 2017. Renewable Energy Tenders and
Rafael Escobar (Practical Action, Peru)                                         Community [Em]power[ment]: Latin America and the Caribbean
Lukas Furlano (Fundación Bariloche, Argentina)                                  (Paris: REN21 Secretariat).

REN21 is the global renewable energy policy multi-stakeholder network that connects a wide range of key actors. REN21’s goal is to facilitate knowledge
exchange, policy development and joint actions towards a rapid global transition to renewable energy. REN21 brings together governments, non-
governmental organisations, research and academic institutions, international organisations and industry to learn from one another and build on successes
that advance renewable energy. To assist policy decision making, REN21 provides high-quality information, catalyses discussion and debate and supports
the development of thematic networks.
FOREWORD
    The main objective of Mexico’s Energy Reform was to open          of the Energy Regulatory Commission (CRE). This auction
    and modernise two sectors – hydrocarbon and electricity – that    represents an opportunity to learn from the previous tendering
    were constitutional monopolies and that were largely banned       experiences and, if appropriate, to put in place new approaches
    from private sector investment and innovation. The Energy         that combine the objective of obtaining cost-effective offers
    Reform also supports an energy transition aligned with the        with the aim of democratising energy and empowering citizens.
    promotion of clean energy and the achievement of Mexico’s
    ambitious targets on climate change. The Reform involves a        The present report, Renewable Energy Tenders and Community
    progressive reduction in polluting emissions from the energy      [Em]power[ment]: Latin America and the Caribbean, promoted
    sector, which is heavily dependent on fossil fuels. The Energy    by the Renewable Energy Policy Network for the 21st Century
    Reform also encouraged the inclusion in Mexico’s Constitution     (REN21), represents an extraordinary opportunity to explore
    of the concept of sustainability, which focuses on care for the   the best international experience to involve local communities
    environment, respect for human rights and the democratisation     in renewable energy tenders – a necessary element to ensure
    of energy to empower citizens through new sustainable energy      the success of new projects.
    projects.
                                                                      This publication offers a precise diagnosis of community and
    Following approval of the Energy Reform in 2013, Mexico           social participation in renewable energy projects in various
    started to design planning instruments and promotion tools        regions. In Europe and North America, renewable energy
    through secondary legislation such as the Electric Industry       projects already represent considerable empowerment for
    Act, the Geothermal Energy Act and the Energy Transition          citizens who generate their own energy or are organised in
    Act, which have made possible the issuance of public policies     co-operatives as sellers/suppliers. In Latin America and the
    and created a strong impulse for the use of renewable energy.     Caribbean, however, the existence of “community-driven”
    Today Mexico has a Strategy to Promote the Use of Cleaner         projects, where citizens own or participate in the control of the
    Technologies and Fuels as well as a Special Program for the       projects, is merely anecdotal.
    Energy Transition, where roadmaps have been established
    to achieve the goals set for 2018, 2021 and 2024 – of 25%,        Mexico, like other countries in Latin America, needs to
    30% and 35% clean energy in total electricity generation,         strengthen this component, encouraging an outcome where
    respectively – as well as a long-term target of 50% clean         the benefits of new renewable energy projects are distributed
    energy by 2050.                                                   locally and consequently guarantee broad support from the
                                                                      communities in which they are installed.
    The new Mexican electricity market has been tested with
    the launch of two long-term tendering processes aimed at
    attracting investment in clean energy. These have been very
    successful, resulting in investment commitments of more
    than USD 6 billion. They also represented an increase in new
    installed renewable energy capacity of more than 5,000 MW,
    mainly solar and wind power. In November 2017, a third tender     Efrain Villanueva A.
    will be set, and we hope it will have favourable results.         General Director of Clean Energies, SENER, Mexico

    Mexico already is preparing the design of a fourth tendering
    process, which will be under the leadership and responsibility

2
Renewable energy markets are evolving rapidly; in 2016                 to move beyond being consumers of electricity to also being
alone the global installed capacity of renewables totalled             energy producers and investors. Community-driven projects
161 gigawatts. Falling technology prices are also spurring             also can lead to increased social acceptance and to positive
uptake. Renewable energy policy support is evolving as well,           socio-economic developments.
with tenders being the most rapidly expanding form. REN21’s
Renewables 2017 Global Status Report documents that                    This report looks at the interface between the tendering
renewable energy tenders were held in 34 countries in 2016 –           process and the role that communities can play in renewable
more than double the year before.                                      energy uptake in the Latin America and the Caribbean region.
                                                                       It also proposes a mechanism to promote community-driven
The design of renewable energy tenders is becoming                     renewable energy projects in the context of renewable energy
increasingly sophisticated. In some cases, it now takes                tenders.
into account parameters such as local job creation and
local economic development, better integration of variable             REN21 provides real-time data on the development of
generation into the grid, greater geographic distribution, and         renewables regionally and globally. This includes tracking the
promoting a diversity of actors involved, such as communities.         evolution of markets and technologies as well as financial
Yet despite existing research on the optimal design of tender          markets and policy developments. We hope that this report will
schemes, little is known about how best to combine tenders             begin a discussion about how the tendering process, coupled
with community involvement and empowerment.                            with the concept of community-driven renewable energy
                                                                       projects, can offer a great unrealised opportunity both in Latin
Tenders have been a particularly popular mechanism in                  America and the Caribbean as well as globally.
Latin America and the Caribbean, attracting record-setting
participation. However, an unintended consequence of the
renewable energy tendering process has been the de facto
exclusion of a range of actors, including small business,
communities, indigenous people, local government, property
developers and farmers.
                                                                       Christine Lins
In parallel, renewable energy sources, with their inherently           Executive Secretary
distributed nature, modularity and adaptability, offer new             Renewable Energy Policy Network for the 21st Century (REN21)
avenues for community participation in the energy arena.
Community-driven renewable energy projects usually involve
local residents where (depending on the structure) they can
own, participate in or control the production and/or use of
sustainable energy. Typically the majority of the projects’ direct
benefits are distributed locally.

Combined with favourable regulations, innovative financial
mechanisms and rapidly maturing markets, the use of
renewable energy provides an opportunity for communities

                                                                     RENEWABLE ENERGY TENDERS AND COMMUNITY [EM]POWER[MENT]               3
TABLE OF CONTENTS

                                                          Foreword.................................................................................... 02
                                                          Executive Summary....................................................................06

    01   Introduction                                     ...................................................................................................08

    02
          Regional Overview                               Socio-economic overview...........................................................10
          of Latin America                                Renewable energy investment.................................................... 14
          and the Caribbean                               Renewable energy development................................................. 15

                                                          Social acceptance........................................................................ 18

    03
          The Social Dimension                            Benefit sharing............................................................................ 19
          of Renewable Energy                             Community-driven renewable energy projects........................... 21
          Deployment                                      Indigenous peoples and the use of renewable
                                                          energy sources........................................................................... 22

    04
                                                          Design elements......................................................................... 26
          Renewable Energy                                Regional trends.......................................................................... 29
          Tenders                                         Current status.............................................................................. 31

    05
                                                          Legal and conceptual context.................................................... 36
          Community Energy                                Elements of community-driven projects.................................... 38
          Projects                                        Challenges.................................................................................. 39
                                                          Current status............................................................................. 39

    06
          Community-driven Projects
          in the Context of Renewable
          Energy Tenders             ................................................................................................... 42

                                                          Setting targets for implementing community power................. 44

    07
          [Em]powering
                                                          Designing tenders to promote community-driven projects....... 44
          Communities Through
                                                          Selecting winning bids using a multi-criteria assessment......... 46
          Renewable Energy
          Tenders                                         Implementing an accession process........................................... 46
                                                          Establishing a community power authority............................... 47

                                                          List of abbreviations ................................................................. 49
                                                          Photo credits ............................................................................ 49
                                                          Glossary...................................................................................... 50
                                                          Endnotes.................................................................................... 52

4
FIGURES, TABLES AND SIDEBARS

Figure 1. Key statistics for focus countries in Latin America and the Caribbean, 2014/2016............................................................ 12
Figure 2. Key statistics for the Latin America and Caribbean region, 2014/2016.............................................................................. 13
Figure 3. Investments in renewable energy in Latin America and the Caribbean (excluding large hydropower), 2005-2015........... 14
Figure 4. Renewable installed capacity and power generation in Latin America and the Caribbean, 2015/2016............................. 15
Figure 5. Steps to ensure an effective “free, prior and informed consent” process...........................................................................23

Table 1. Main renewable energy tenders in Latin America and the Caribbean, 2006-2017............................................................... 30
Table 2. Main renewable energy tenders in Peru, 2009-2016.............................................................................................................34
Table 3. Design options to increase community-driven renewable energy projects in tenders......................................................... 45
Table 4. Multi-criteria assessment in renewable energy tenders........................................................................................................ 46

Sidebar 1. Renewables in the heating and transport sectors of Latin America and the Caribbean.................................................... 16
Sidebar 2. What do community-driven renewable energy projects bring?........................................................................................ 22
Sidebar 3. The Akwé: Kon guidelines.................................................................................................................................................. 24
Sidebar 4. Global experiences with community energy...................................................................................................................... 38
Sidebar 5. Moving beyond power....................................................................................................................................................... 39

                                                                                             RENEWABLE ENERGY TENDERS AND COMMUNITY [EM]POWER[MENT]                                        5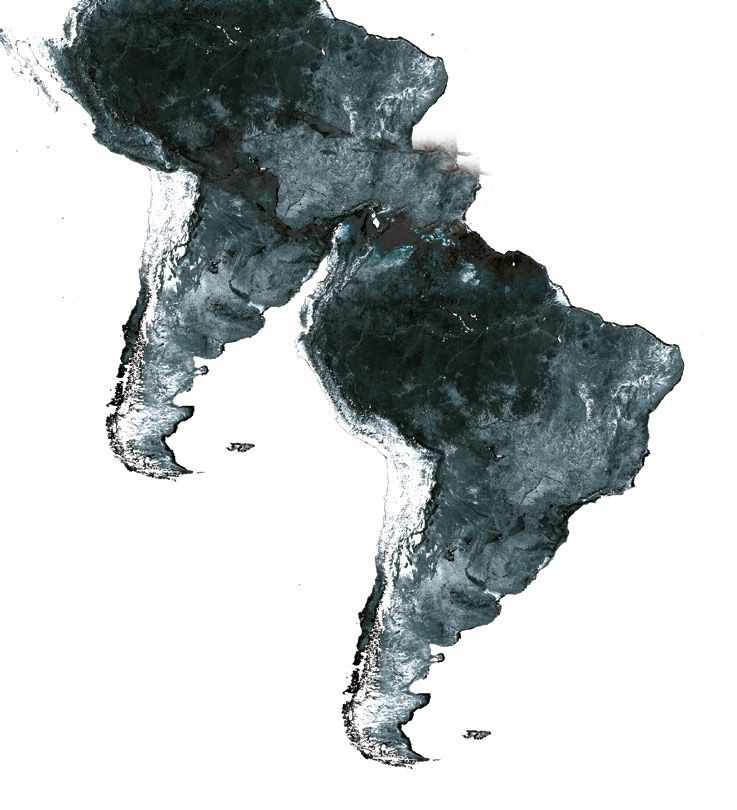
EXECUTIVE SUMMARY

                              ”
        Tenders can be modified to favour a diversity
         of actors and community-driven renewable
         energy projects through the use of various
                  tendering design options.

6
Renewable energy sources, with their inherently distributed                               against large developers, which can distribute the costs and risks
nature, modularity and adaptability, offer new avenues for direct                         of tendering to several projects.
citizen and community participation in the energy transition.
Combined with favourable regulations, innovative financial                                Tenders can be modified to favour a diversity of actors and
mechanisms and rapidly maturing markets for equipment and                                 community-driven renewable energy projects through the use of
service providers, renewable energy sources provide new roles for                         various tendering design options. Applying these design options
citizens and communities, not just as consumers of electricity, but                       often results in a trade-off between the primary objective –
also as producers (e.g., prosumers, community-driven projects), as                        contracting the cheapest electricity from renewables – and the
investors (e.g., green bonds, crowdfunding), and as distributers                          secondary objective of promoting a diversity of actors.
and sellers (e.g., co-operatives).

Community-driven renewable energy projects often are described
as comprising two main elements: 1) citizens and communities
from the region where the project is located own, participate in or                            Community-driven renewable
control the production of sustainable energy, and 2) the majority                         energy projects offer a so-far unexploited
of the project’s direct benefits are distributed locally. Community-                           opportunity in Latin America
driven projects bring the benefits of increasing social acceptance
and maximising the positive socio-economic impacts of renewable
                                                                                                    and the Caribbean.
energy projects, as well as minimising potential adverse social and
environmental impacts.

Throughout Europe and North America, there is a trend towards                             As one solution, in the accession process following the tender,
increased citizen involvement in developing new large-scale                               community-driven projects can be offered a power purchase
renewable energy projects. Co-operation and community-driven                              agreement at a tariff based on the result of the tender. The
renewable energy projects in these regions no longer can be                               accession process captures both the efficiency of tenders and
labelled as marginal, but rather resemble a “movement”.                                   the effectiveness of feed-in tariffs for community projects.
                                                                                          Setting limits, in time and quantity, for the implementation of the
Community-driven renewable energy projects offer a so-far                                 accession process is necessary to ensure its dynamic efficiency.
unexploited opportunity in Latin America and the Caribbean.
To date, there is no evidence of utility-scale, grid-connected                            The accession process would be greatly strengthened and accelerated
community-driven renewable energy projects in the region.                                 by the establishment of ambitious, but realistic, mid- and long-term
To realise such opportunity, a host of barriers hindering the                             targets for community-driven renewable energy projects.
development of such projects must be overcome. These barriers
range from legal frameworks, to the ideological approach towards                          Complementing the accession process, it is proposed that a
community empowerment, to the lack of local capabilities, to                              community power authority be established, with the roles of
underdeveloped renewable energy markets.                                                  providing technical, legal and business support; assigning official
                                                                                          “community project” status to initiatives that fulfil the agreed
The main renewable energy markets in Latin America and the                                requirements; overseeing the continued fulfilment of these
Caribbean are dominated by tendering processes, a trend that is                           requirements by projects that benefit from the accession process;
likely to continue in the coming yearsi. But whereas tenders are                          building capacities; and advocating for community power.
predicated on competition, community-driven projects are based
on collaboration. Participating in tendering processes – and                              Many of the regions of Latin America and the Caribbean that have
winning – requires, among others, significant expertise and access                        important renewable energy resources are inhabited by indigenous
to large reserves of capital, which smaller actors do not have to                         peoples that possess a strong collective identity and a deep
the same degree as large, specialist renewable energy developers.                         cultural relationship to their land and territory. A policy framework
Under the tendering process, even if their projects are financially                       that promotes community-led projects is particularly important in
viable, actors that take a one-project approach – including                               this context, as it can offer a constructive solution to potential
community-driven renewable energy projects – are penalised                                conflicts with these communities.

i Of the 42 countries in the Latin America and Caribbean region, only 12 currently use a renewable energy tendering process: Argentina, Belize, Brazil, Chile, Costa Rica, El
Salvador, Guatemala, Honduras, Mexico, Panama, Peru and Uruguay.

                                                                                      RENEWABLE ENERGY TENDERS AND COMMUNITY [EM]POWER[MENT]                                    7
01                   INTRODUCTION

    The global energy system is in transition. Growth in energy
    demand – along with current patterns of energy production
    and consumption, the imperative of addressing climate change,
    and the need to improve energy access – are driving a change
    in the energy paradigm in order to ensure sustainable long-term
    economic growth. The energy transition is based on maximising
    five pillars: energy efficiency, renewable energy, decentralised
    generation, coupling of energy uses, and smart energy systems.

    The movement towards sustainable energy systems involves
    co-evolutionary changes among technologies, infrastructures,
    institutions, citizens and communities. Whereas intense discussions
    have unfolded on issues of policy, finance and the integration of
    renewables into the energy system and markets, the role of citizens
    and communities in the energy transition has received relatively
    less attention.

    Citizens (as a group) and communities often are portrayed as a
    potential barrier to renewable energy market uptake, due to local
    opposition to renewable energy projects (often referred to as
    NIMBYism, or “not in my back yard”).1 Nevertheless, successful
    implementation of the energy transition requires people to play an
    important role at three levels: 1) to generate impetus for political
    action and increased social responsibility within companies and the
    larger business community; 2) to participate actively and directly
    in renewable energy projects; and 3) as a work force.2

    The inherent distributed nature of renewable energy, together
    with the modularity of renewable technologies, favourable
    regulations, and the development of innovative financial
    mechanisms, are all factors with a potential to create new roles
    for active and direct support from citizens towards renewable
    energy development. Increasingly, citizens are purchasing
    electricity from renewable sources, financing projects (e.g.,
    through green bonds and crowdfunding), producing renewable
    energy (e.g., as prosumersi and via community-driven projects)
    and supporting initiatives to distribute and sell renewable energy
                                                                                             Renewable energy markets are evolving very rapidly. Policy
    (e.g., through co-operatives).3
                                                                                             makers face the challenge of continuously adapting their market
                                                                                             deployment support mechanisms to new market conditions.
    Socio-economic benefits are gaining prominence as a key driver
                                                                                             Although the sharp decline in renewable energy costs is a
    for renewable energy deployment policies. Policy makers see the
                                                                                             positive trend, policy makers are challenged to ensure that
    potential for job creation, increased income and contribution to
                                                                                             support measures are kept effective and cost-efficient. When
    industrial development. Due to the re-investment of benefits
                                                                                             well designed, the price competition inherent to the tendering
    in the local economy, community-driven renewable energy
                                                                                             process increases cost efficiency and allows for price discoveryii of
    projects have been shown to generate about tenfold additional
                                                                                             renewable energy-based electricity, avoiding potential windfall
    employment and income impact compared with non-community-
                                                                                             profits and underpayments.5
    driven projects.4

    i Prosumers are energy consumers who also produce their own power.
    ii Price discovery is the general process used in determining market prices. These prices are dependent upon market conditions affecting supply and demand. For example, if the
    demand for a particular commodity is higher than its supply, the price typically will increase (and vice versa); see http://www.investopedia.com/terms/p/pricediscovery.asp.

8
deployment. In addition, the region traditionally has been a policy
innovator in the renewables sphere: it remains at the forefront
in the use of competitive bidding for renewable energy project
allocations, with tenders attracting record-setting participation.
To maximise the benefits from community-driven renewable energy
projects in the LAC region, there is a need to know how best to
combine tenders with community involvement and empowerment.
The region traditionally has been
a policy innovator in the renewables
sphere: it remains at the forefront
in the use of competitive bidding
for renewable energy project allocations,
with tenders attracting
record-setting participation.
As international experience with renewable electricity tenders
expands, the design of these processes is becoming increasingly
sophisticated, with aims to achieve secondary objectives such as
job creation and local economic development, better integration of
variable generation into the grid, greater geographic distribution,
and the involvement of more-diverse actors, such as local
communities.7 Yet despite existing research on the optimal design
of tender schemes, little is known about how best to combine
tenders with community involvement and empowerment.
The present report, Renewable Energy Tenders and Community
However, unintended outcomes of renewable energy tenders have [Em]power[ment]: Latin America and the Caribbean, looks at
been the de facto exclusion of a range of actors – including small community [em]power[ment] in the context of renewable energy
business, communities, indigenous people, local governments, tenders in the LAC region. Of the 42 countries comprising the
property developers and farmers – as well as the concentration of LAC region, only 12 currently use tenders. The report explores
projects in areas that have the most competitive renewable energy the current energy situation and status of tenders in Argentina,
resources, increasing pressures on communities living in these Belize, Brazil, Chile, Costa Rica, El Salvador, Guatemala, Honduras,
locations.6 Mexico, Panama, Peru and Uruguay. Examples of community
energy projects from the region are then explored, and an approach
The region of Latin America and the Caribbean (LAC) continues for how best to combine tenders with community involvement and
to have some of the world’s highest shares of renewable energy empowerment is proposed.
RENEWABLE ENERGY TENDERS AND COMMUNITY [EM]POWER[MENT] 902 REGIONAL OVERVIEW OF LATIN AMERICA
AND THE CARIBBEAN
The Latin America and Caribbean region comprises 42 countries,
dependent territories and overseas departmentsi, spanning a
total of 20.4 million square kilometres. With 8.3 million square
kilometres, Brazil covers almost half of the region, while the island
02
nation of Sint Maarten accounts for only 34 square kilometres.1
In 2016, the LAC region was home to approximately 637.6 million
people. Brazil has the largest population with about 207 million
people, and the British Virgin Islands has the smallest, with just
over 30,000 people (see figures 1 and 2).2
SOCIO-ECONOMIC OVERVIEW
The LAC region experienced overall population growth of 1% in
2016, with the fastest growth occurring in Sint Maarten (3%) and
the lowest in Puerto Rico (-1.8%).3 As the population has grown,
so has population densityii, which has increased to an average of
31.8 persons per square kilometre.4 Close to 80% of the total LAC
population lives in urban areas, representing one of the highest
urbanisation rates in the world.5
In the decade between 2006 and 2016, the gross domestic product
(GDP) of the LAC region nearly doubled – from USD 3.3 trillion
to USD 5.2 trillion – making it the fourth largest regional economy
worldwide after the European Union, the United States and
China.6 However, GDP varies widely across the region: three Group
of Twenty (G20) countries – Argentina, Brazil and Mexico – have a
collective GDP of USD 3.4 trillion, with Brazil accounting for nearly
one-third of the total GDP of the LAC region. Most of the region’s
small-island states have GDPs below USD 10 billion. After years of
significant GDP growth, 2015 and 2016 were the first consecutive
years of negative GDP growth since the 1980s.7
In parallel with rising GDP, per capita GDP has increased across
the LAC region, reaching USD 8,303 in 2016. However, the
regional average masks wide differences among countries. For
example, The Bahamas’ per capita GDP in 2016 was USD 23,124,
more than 31-fold that of Haiti (USD 739).8 Nevertheless, since
2002, 57 million people in the region have moved out of poverty;
168 million people remain below the poverty line, and 70 million
live in extreme poverty (for example, in Haiti and Honduras).9
Poverty reduction has stalled in recent years, related in part to
declining GDP growth.10
i The 42 countries in Latin America and the Caribbean are: Antigua and Barbuda, Argentina, Aruba, The Bahamas, Barbados, Belize, Bermuda, Bolivia, Brazil, British Virgin Islands,
Chile, Colombia, Costa Rica, Curaçao, Cuba, Dominica, Dominican Republic, Ecuador, El Salvador, Grenada, Guatemala, Guyana, Haiti, Honduras, Jamaica, Mexico, Nicaragua,
Panama, Paraguay, Peru, Puerto Rico, Saint Kitts and Nevis, Saint Lucia, Saint Martin (French part), Saint Vincent and the Grenadines, Sint Maarten (Dutch part), Suriname,
Trinidad and Tobago, Turks and Caicos Islands, Uruguay, Venezuela and Virgin Islands (U.S.)
ii Due to their smaller size, the Caribbean island states in particular have the highest population densities.
10Development levels in the LAC region also vary widely, as reflected
in the region’s rankings in the United Nations Development
Programme’s Human Development Index (HDI). Most LAC
countries are classified as having “high human development”.
Haiti has the lowest HDI in the region, ranking 163rd in the world,
whereas Chile and Argentina both classify as having “very high
human development”, ranking 38th and 45th, respectively.11
The region traditionally has been
Electrification rates in the LAC region are among the highest a policy innovator in the renewables
worldwide. On average 97% of the population has access to
electricity.12 Integration of regional electricity markets not only
sphere: it remains at the forefront
has contributed to high access rates, but also has improved grid in the use of competitive bidding
stability and the affordability of electricity. Most countries have for renewable energy project allocations,
achieved near-universal electricity access; the 22 million people with tenders attracting
without access are concentrated largely in five countries: Bolivia,
record-setting participation.
Colombia, Guatemala, Haiti and Peru.13 About 65 million people in
the region (14% of the population) do not have access to clean
forms of cooking.14 In Haiti, 92% of the population is dependent on
traditional cooking fuels and devices, and in Honduras, Guatemala
and Nicaragua, 50% or less of the population has access to clean
cooking solutions.15
RENEWABLE ENERGY TENDERS AND COMMUNITY [EM]POWER[MENT] 11LATIN AMERICA AND THE CARIBBEAN OVERVIEW
ey statistics for focus countries in
FIGURE 1. K
Latin America and the Caribbean,
2014/2016
Mexico
127.5 million
1,943.9 thousand km2 Guatemala
66 people/km2
16.6 million
1.3%
107.2 thousand km2
80%
155 people/km2
USD 1,046 billion
2%
USD 8,201
52%
99.2%
USD 68.8 billion
USD 4,146
85.5%
Costa Rica
El Salvador 4.9 million
51.1 thousand km2
6.3 million
95 people/km2
20.7 thousand km2
1%
306 people/km2
78%
0.5%
USD 57.4 billion
67%
USD 11,824
USD 26.8 billion
99.4%
USD 4,223
95.1%
Argentina
Peru 43.8 million
2,736.7 thousand km2
31.8 million
Chile 16 people/km2
1,280 thousand km2 1%
17.9 million
25 people/km2 92%
743.5 thousand km2
1.3% USD 545.8 billion
24 people/km2
79% USD 12,499
0.8%
USD 192.1 billion 100%
90%
USD 6,045
USD 247 billion
92.9%
USD 13,792
100%
Source: See endnote 2 for this chapter.
12Belize
0.37 million
22.8 thousand km2 Honduras
16 people/km 2
9.1 million
2.1%
111.9 thousand km2
Panama
44%
81 people/km2 4 million
USD 1.8 billion
1.7% 74.3 thousand km2
USD 4,810
55% 54 people/km2
92.5%
USD 21.5 billion 1.6%
USD 2,361 67%
88.7% USD 55.2 billion
USD 13,680
91.6%
Brazil
207.7 million
Uruguay 8,358.1 thousand km2
25 people/km2
3.4 million
0.8%
175 thousand km2
86%
20 people/km2
USD 1,796.2 billion
0.4%
USD 8,649
95%
99.7%
USD 52.4 billion
USD 15,220
99.7%
ey statistics for the Latin America and Caribbean
FIGURE 2. K
region, 2014/2016*
Total population 637.6 million
Land area 20,400 thousand km2
Population density 31.8 people/km2
Population growth 1%
Share of population
80.1%
living in urban areas
GDP 5,200 billion USD
GDP per capita USD 8,303
Electrification rate 97%
*Note: All data are for 2016 except for electrification data, which are for 2014.
Source: See endnote 2 for this chapter.
RENEWABLE ENERGY TENDERS AND COMMUNITY [EM]POWER[MENT] 13RENEWABLE ENERGY INVESTMENT
The LAC region has received significant investments in renewable
energy. During the five-year period from 2010 to 2015, more
than USD 80 billion was invested in renewables in the region,
excluding large hydropower. In 2015 alone the region received
USD 16.4 billion in renewable energy investment, with Brazil being
the major recipient at USD 7.1 billion (more than 40% of the total
Countries across the LAC region have
investment that year; see figure 3).16 achieved high shares of electricity
generation from renewable energy
According to the Climatescope 2015 report, the LAC region sources. The total renewable installed
is highly attractive for renewable energy investment.17 Of the
capacity (including large hydropower)
top 21 developing countries highlighted for renewable energy
investment, 11 are from the LAC regioni. This trend is confirmed grew 48.6% during the decade
by the Renewable Energy Country Attractiveness Index (RECAI), 2006-2016, from 151.6 gigawatts (GW)
which rates 40 renewable energy markets based on factors such to 225.4 GW.
as energy policy and the political and regulatory context of
renewables. In 2016 six LAC countries were included in the ranking,
with Chile coming in fourth, Mexico sixth and Brazil eighth.18
FIGURE 3. Investments in renewable energy in Latin America and the Caribbean
(excluding large hydropower), 2005-2015
4.6 6.8 12.7 15.0 10.4 13.1 13.1 12.4 10.4 15.0 16.4 USD billion
100%
80%
60%
40%
20%
0%
2005 2006 2007 2008 2009 2010 2011 2012 2013 2014 2015
Other Honduras Chile Brazil
Peru Uruguay Mexico
Source: see endnote 16 for this chapter.
i These countries are: Brazil (2nd after China), Chile (3rd), Mexico (7th), Uruguay (8th), Honduras (14th), Costa Rica (15th), Peru (16th), Guatemala (18th), Colombia (19th),
Argentina (20th) and Panama (21st).
14REGIONAL OVERVIEW OF LATIN
AMERICA AND THE CARIBBEAN 02
RENEWABLE ENERGY DEVELOPMENT
Countries across the LAC region have achieved high shares of In 2016 Brazil was third in the world for total installed renewable
electricity generation from renewable energy sources. The total power capacity (behind China and the United States).21 Costa Rica
renewable installed capacity (including large hydropower) grew and Uruguay generated 99% and 92.8%, respectively, of their
48.6% during the decade 2006-2016, from 151.6 gigawatts (GW) to electricity from renewable sources, out of which 10.5% and 22.8%,
225.4 GW (see figure 4)i.19 Solar photovoltaics (PV) has experienced respectively, were from wind energy alone.22 Honduras supplied
the fastest growth, increasing 18-fold over the past five years.20 9.8% of its electricity with solar PV.23
FIGURE 4. Renewable installed capacity and power generation
in Latin America and the Caribbean, 2015/2016
Installed Capacity (2016) Power Generation (2015)
Total Total
225.4 GW 818.4 TWh
8.8% 19.9 GW
8.2% 66.9 TWh
Hydropower
Bioenergy
8.1% 18.6 GW 4.9% 40.3 TWh
Wind energy
80% 0.7% 1.6 GW 85.2% 1.3% 10.5 TWh
Geothermal energy
182.0 GW 697.6 TWh
1.5% 3.3 GW 0.4% 3.1 TWh
Solar PV
Source: see endnote 19 for this chapter.
Hydropower is the LAC region’s main source of power generation, this, Brazil continued to lead the region in wind power and also
totalling 182 GW of installed capacity in 2016 and accounting for ranks in the global top 10 for wind generation.31 In 2016, Brazil
more than 85% of all electricity generated.24 Brazil increased its commissioned 2 GW for a total installed capacity exceeding
hydropower capacity by 5.3 GW in 2016, for a year-end total of 10.7 GW; the country met 5.7% of its electricity demand that
96.9 GW; the country added the most global capacity after China year from wind.32 Other countries in the region that added
and accounted for 9% of global hydropower capacity.25 Ecuador capacity included Chile (0.5 GW), which had a record year; Mexico
ranked third in the region for new hydropower additions, as (0.5 GW), which held its first auction in 2016; Uruguay (0.4 GW)
two newly operational large-scale projects nearly doubled the and Peru (0.1 GW).33 Both Chile and Uruguay passed the 1 GW
country’s hydropower capacity.26 The 1.5 GW Coca Codo facility mark for total capacity.34 Argentina brought no new capacity
and the 487 megawatt (MW) Sopladora plant are expected to online but built up a solid pipeline of more than 1.4 GW of projects
meet nearly half of Ecuador’s electricity needs and could allow over the year in response to tenders.35
the country to export electricity to neighbouring Colombia.27 To
the south, Peru also brought online two significant projects in Solar PV plays an important role in providing energy access in the
2016; the 525 MW Cherro del Aguila facility and the 456 MW LAC region, although most capacity installed to date has been in
Chaglla plant expanded the country’s hydropower capacity by large-scale projects. As of 2016, the region had a total installed
almost one-quarter, to 5.2 GW.28 capacity of 3.3 GW.36 Chile was the region’s top installer and
ranked tenth globally for newly added capacity; the country added
For wind power, eight LAC countries together added more than more than 0.7 GW in 2016 for a year-end total of 1.6 GW.37 Mexico
3.5 GW of capacity in 2016, bringing the region’s total capacity followed, adding about 150 MW for a total of 0.3 GW.38 Mexico’s
to 18.6 GW at year’s end.29 Additions were lower than in 2015 solar PV market was driven largely by the country’s first tenders,
(4.4 GW) due mainly to reductions in Brazil and Mexico.30 Despite although distributed systems accounted for at least one-third of
i Installed capacity data are from IRENA’s Renewable Market Analysis Report (2016); added capacity data for 2016 are from REN21’s Renewables 2017 Global Status Report.
RENEWABLE ENERGY TENDERS AND COMMUNITY [EM]POWER[MENT] 15additions in response to rising electric tariffs for large consumers
combined with falling solar PV prices. Argentina also held its first
solar PV tender in 2016.
Geothermal energy in the LAC region had a total installed
On a policy level, the LAC region capacity of 1.6 GW in 2016.39 Mexico is the region’s forerunner: it
remains at the forefront in the use of added 15 MW in 2016, bringing its total capacity to about 950 MW
competitive bidding for renewable and ranking it fifth worldwide for geothermal power capacity.40
Costa Rica has 206.7 MW of geothermal energy capacity.41
energy project allocations,
with many tenders attracting Renewable energy sources also are becoming increasingly important
record-setting participation. in the region’s heating and transport sectors (see sidebar 1).42
On a policy level, the LAC region remains at the forefront in the use
of competitive bidding for renewable energy project allocations,
with many tenders attracting record-setting participation. Several
SIDEBAR 1.
Renewables in the heating and transport
sectors of Latin America and the Caribbean
Although the power sector enjoys the highest
penetration of renewables in the LAC region, renewables
also are being used in both the heating and transport
sectors.
In the heating sector, renewable energy supplied 35%
of regional heat demand in 2016, nearly one-quarter of
which was met with traditional biomass (concentrated
mainly in Bolivia, Colombia, El Salvador, Guatemala,
Honduras, Nicaragua, Paraguay and Peru), with
significant variations across countries. A few countries
in the region rely heavily on renewable sources for
industrial heat (largely solid biomass fuels such as
bagasse and charcoal), including Paraguay (90%
renewable), Uruguay (80%), Costa Rica (63%) and
Brazil (54%). Solar thermal use in industry is growing
rapidly in Mexico, where 95 process heat plants had
been installed by the end of 2016.
For the transport sector, Brazil is the world’s second
largest producer of biofuels (after the United States)
and saw declines in both ethanol and biodiesel
production in 2016, reversing the increase in 2015.
Colombia and Peru also saw decreases in both ethanol
and biodiesel production during the year. Countering
this decline, production of both biofuels increased in
Argentina, while in Mexico ethanol production increased
from near zero in previous years to 20 million litres. The
electric vehicle market in Latin America is still in its
infancy but is seeing early developments, particularly in
Costa Rica and Colombia.
Source: see endnote 42 for this chapter.
16REGIONAL OVERVIEW OF LATIN
AMERICA AND THE CARIBBEAN 02
countries – including Argentina, Brazil, Chile, Mexico and Peru –
held successful tenders in 2016, resulting in some of the world’s
lowest bid prices due in part to the region’s vast renewable energy
resources.43 In Brazil, the only renewable energy tender scheduled
for 2016 was cancelled, and most projects that had been awarded
contracts via tenders in 2015 were stalled by a variety of factors, Several countries – including Brazil,
including high costs associated with local content rules and Chile, Mexico and Peru – held successful
difficulty obtaining affordable financing.44
tenders in 2015 and early 2016, resulting
Apart from tenders, a number of amendments were made to net in some of the world’s lowest bid
metering policies in 2016. Brazil’s net metering revision, which prices due in part to the region’s vast
provides financial incentives to small-scale distributed solar renewable energy resources.
PV systems, was adopted in 2015 and came into force in 2016.
Costa Rica enacted a new net metering price structure designed
to encourage businesses and homeowners to generate solar
electricity.45
RENEWABLE ENERGY TENDERS AND COMMUNITY [EM]POWER[MENT] 1703 THE SOCIAL DIMENSION OF
RENEWABLE ENERGY DEPLOYMENT
Social acceptance can determine the level of success in deploying
energy technologies. Traditionally, citizens and communities in
Latin America and the Caribbean have played two general roles
in the deployment of energy systems: 1) as captive, passive
consumers, and 2) as barriers to specific projects due to their
opposition (resulting from the NIMBY, or “not in my back yard”,
Citizens and communities in the
effect and, in some rural settings, a high dependence on land
for subsistence).1 Renewable energy technologies provide new LAC region can play new, constructive
opportunities for citizens and communities to play an active role in roles as are being experienced in other
the region’s energy transitioni. world regions: as conscious purchasers
of renewable electricity, as financiers
Renewable energy technologies can suffer from local opposition
of projects, and as producers
to specific projects or to large-scale deployment of renewables.
As citizens understand what renewable energy technologies can (prosumers and participants
bring – in particular, the associated environmental and socio- in community-driven projects).
economic benefits – there often is a parallel increase in demand
to participate and to enjoy the benefit sharing from renewables
deployment. Citizens and communities in the LAC region can
play new, constructive roles as are being experienced in other
world regions: as conscious purchasers of renewable electricity,
as financiers of projects, and as producers (prosumers and (cultural heritage), policy and spatial planning, and economics
participants in community-driven projects). (distribution of costs and benefits).5
A particular feature of community acceptance is that it has a time
SOCIAL ACCEPTANCE dimension. The typical pattern of local acceptance before, during
and after a project follows a u-curve, going from high acceptance
Project developers, investors, governments, utilities and other during the planning phase to (relatively) low acceptance during
players often have relegated social acceptance of renewable the siting phase (usually still positive on average), then back up
energy to a secondary or non-major factor in deployment.2 This to a higher level of acceptance once a project is up and running.6
attitude has proved mistaken, however, as many renewable energy
project developers have faced protests and scepticism from local There is increasing experience on approaches, measures and tools
communities.3 to facilitate social acceptance for the uptake of new technologies
by citizens. Among the best practices influencing community
In the LAC region, local resistance to the deployment of renewable acceptance of renewable energy technologies are:7
energy projects has been particularly high in regions that have
abundant renewable energy resources and that are inhabited by • Provide opportunities to communities to engage during land
indigenous groups with strong cultural and spiritual relations to spatial development planning and take into account their
their land and resources. These communities often have rejected concerns to minimise the potential impact of renewable energy
any project that involves a transfer of land rights or a loss of deployment during this phase.
territorial control, such as the land-lease contracts that form the
basis for conventional renewable energy projects.4 • Seek to uphold “procedural justice” by ensuring that all those
involved in the decision-making process have adequate
Social acceptance involves a wide range of stakeholders, including opportunities to have a say, are provided with appropriate
the general public, citizens of communities hosting projects, information and are treated with respect. Open and transparent
various institutions and associations, project developers and decision-making processes can result in a “fair process effect”
financiers. Social acceptance also touches many disciplines, where people have been shown to accept certain negative
including health and psychology (aspects of well-being), biology consequences if they perceive that the decision has been made
(ecosystem effects), sociology (procedural fairness), anthropology in a fair way.
i Studies suggest that a key impact of community-driven renewable energy projects is social acceptance for renewable energy in general, and for specific projects in particular.
Community-driven renewable energy projects reduce usual concerns about infrastructure projects by working to maximise local benefits and to improve the distribution of costs
and benefits.
18• Engage the local community early and often throughout the
development process in order to build trust, communicate
ongoing efforts and plans, and thereby maximise transparency.
Open, democratic, multi-stakeholder and participatory processes
are particularly critical because increased local participation
tends to enhance knowledge and understanding of the project,
both among citizens and those developing the project.
• Provide opportunities for host community residents to access
direct project-related material benefits such as:
Facilitating opportunities for low-threshold financial
participation by local stakeholders,
Offering material compensation, such as a development fund
or cheaper electricity, and
Involving local businesses as much as possible in planning,
construction and maintenance of the facility.
• Apply internationally recognised guidelines for cultural,
environmental and social impact assessments on sites traditionally
occupied by local communities.
• Apply best practices on minimising potential environmental
impacts of renewable energy projects. In countries with social A key issue for social acceptance of
acceptance regulations, ensure enforcement of such regulations.
a renewable energy technology and
related projects is the additional benefits
BENEFIT SHARING arising from the technology’s adoption.
A key issue for social acceptance of a renewable energy technology
and related projects is the additional benefits arising from the
technology’s adoption.8 Of particular interest is how the direct
economic profits from a renewable energy project accrue to the in place local tax exemption to support renewable energy projects.
surrounding community, also referred to as benefit sharing. This Several countries in the region also include exemption from local
is different from rent for the land owners and different from the taxes as part of their national incentives for renewable energy, as
indirect benefits of renewable energy projects such as job creation has occurred in the national or sub-national policies of Argentina,
and local development. There are several models for benefit Bolivia, Brazil, Colombia, Mexico, Nicaragua and Panama.9
sharing, as detailed below.
Sharing of proceeds. Another option is mandating that a
Local taxation. The most direct method of benefit sharing is percentage of the proceeds be invested in the local community.
through local taxation that diverts part of a project's revenue into In El Salvador, for example, the 2014 tender for 100 MW of solar
local-level public spending. Local taxation, however, is largely and wind power required that developers invest 3% of revenue in
contingent on the regulatory framework of each jurisdiction, and social projects in the adjacent communities.10 In Ecuador, as part
often is not possible or is severely constrained. Another drawback of the country’s previous feed-in tariff, renewable energy projects
is that in many municipalities, a disconnect (physical, socio- receiving the tariff had to contributei an amount (per kilowatt-
economic or otherwise) may exist between the communities that hour) to social and community development projects.11 When
are affected by the renewable energy project to be taxed and the allocating a percentage of proceeds to local communities, it is
decision makers who are deciding how to allocate the revenue important to establish a clear decision-making process on how the
collected from such projects. In addition, fiscal measures could also collected money will be invested in the community, preferably in a
be used to attract projects. Many countries in Latin America put way that involves community members themselves.
i In 2014 this amounted to approximately one-fourth of the feed-in tariff.
RENEWABLE ENERGY TENDERS AND COMMUNITY [EM]POWER[MENT] 19Dedicated funds and other instruments. Renewable energy
projects also can engage in benefit sharing through dedicated
funds, foundations or other instruments not directly linked to their
revenue stream. This can be part of a company’s corporate social
responsibility strategy or philanthropy, or it can be employee-
driven, politically driven (especially in the case of publicly
owned projects) or mandated. In El Salvador, LaGeo's Berlin and
Ahuachapan geothermal plants have funded activities in the
community for over a decade, through the foundation FundaGeo.
Each year, the neighbouring communities, which encompass
nearly 75,000 inhabitants, present proposals for local development
projects. Community associations that include assembly-elected
representatives from the communities then vote on the proposals
and decide which ones to implement.12 There is a strong gender
component in the decision-making and implementation of
projects.13
Carbon revenue. Although carbon revenue is not currently a
major or reliable source of project income, this could change in
the future, including through linkages to voluntary, national and
sub-national carbon markets. Mandated, incentivised or voluntary
allocation of carbon revenues are options for benefit sharing.
For example, in the past Colombia encouraged investment of
carbon revenue in communities by providing a 15-year income tax
exemption for wind and biomass projects that invested at least
50% of carbon credits revenue in social projects.14 In El Salvador,
the FundaGeo funding for local communities used revenue from
the Clean Development Mechanism to finance its activities in
some years.15
Stake in equity. Through this somewhat different approach
towards benefit sharing, the community shares both the risks and
the profits. While there are many models for equity sharing, two
may be of particular interest in the region: subscription and equity
partnership.
• Under a subscription model, developers open a portion of the
project’s equity to subscription by individuals or communities. If
subscriptions are allowed for small amounts, this may be a very
effective method for individuals in the community to partake in • An equity partnership is a proposed model where the community
renewable energy projects. The subscription approach generally and investors partner for a renewable energy project. Investors
allows for participation in the benefits (and risks) of the project, contribute capital, and the community contributes land, rights
but less in the decision-making process. An example can be and social support. In lieu of rent for the land and community
found in Uruguay, where the public utility UTE created three payments, the community gets a share in the equity of the project.
successive funds to finance the wind power projects of Arias While there are no examples of completed projects under this
(70 MW), Pampa (147.5 MW) and Valentines (70 MW). Eighty model in the LAC region, projects under development using the
percent of the equity was reserved for small and institutional equity partnership approach have been identified in Mexico
investors with investments ranging from USD 100 to USD 2,000. and Chile.18 Equity partnerships could be considered, for
The shares, which are publicly tradeable, were oversubscribed, example, in those projects and jurisdictions where communal
and the model is likely to be adopted in other places.16 land is involved.
Subscription schemes can have undesired effects when There is no regulation and little debate on rules to promote benefit
implemented in economies with highly unequal distribution of sharing in renewable energy projects in the LAC region. Chile has
wealth. In such cases, subscription could reinforce existing social produced a number of tools related to benefit sharing, but they are
inequities and increase the rejection by persons who have no voluntary, not mandatory. Tenders seek to achieve low electricity
funds to invest.17 prices, thus penalising projects with benefit sharing plans.19
20THE SOCIAL DIMENSION OF
RENEWABLE ENERGY DEPLOYMENT 03
COMMUNITY-DRIVEN RENEWABLE
ENERGY PROJECTS
The rapid deployment of renewable energy has numerous positive
drivers, including advancing economic development, improving
energy security, enhancing energy access and mitigating climate
change.20 While these benefits are widely cited in political and
energy debates, documented evidence of them in the particular
case of community-driven renewable energy projects remains
limited. Reasons for this include a lack of adequate conceptual
frameworks, methodological challenges and limited access to
relevant data.21
Surveys and impact analyses of some projects show that local
ownership promotes re-investment of energy incomes and helps
keep profits in a community. Therefore, local ownership can be
an important tool for local socio-economic development.22 Local
value creation is realised through the use of local services, tax
revenue, and other returns, for a total value-added that likely is
greater than in the absence of local renewable energy production.
Analyses suggest a positive impact in local job creation and
skills acquisition, particularly for those projects that would not
materialise if they were not citizen-owned.23 Jobs can be created
indirectly as well, through the value-added effect that results from
reduced capital outflow.24
Especially in areas with indigenous groups, community-driven
renewable energy projects are an opportunity to promote local
development, self-determination and identity, while ensuring
communities’ control over the mitigation and management of
local environmental impacts.25
Beyond that, citizen participation helps to build awareness and
capacities about energy issues and the importance of energy
efficiency improvements, and therefore can lead to a reduction in
total energy consumption (see sidebar 2).26
Which impacts play out most and are in fact the drivers of a
community-driven renewable energy project may depend on
the legal and conceptual context (see chapter 5). In some cases,
environmental and political impacts may dominate the return
motive.27 In other cases, community energy is more economically
Especially in areas with indigenous or profit-orientated.28
groups, community-driven renewable
energy projects are an opportunity
to promote local development, self-
determination and identity, while
ensuring communities’ control over the
mitigation and management of local
environmental impacts.
RENEWABLE ENERGY TENDERS AND COMMUNITY [EM]POWER[MENT] 21You can also read