CONCENTRATING SOLAR POWER - CLEAN POWER ON DEMAND 24/7 - Pubdocs.worldbank.org.
←
→
Page content transcription
If your browser does not render page correctly, please read the page content below
CONCENTRATING SOLAR POWER
CLEAN POWER ON DEMAND 24/7

CONCENTRATING SOLAR POWER: CLEAN POWER ON DEMAND 24/7

© 2020 International Bank for Reconstruction and Development /
The World Bank 1818 H Street NW | Washington DC 20433 | USA
202-473-1000 | www.worldbank.org
This work is a product of the staff of the World Bank with external contributions. The findings,
interpretations, and conclusions expressed in this work do not necessarily reflect the views of
the World Bank, its Board of Executive Directors, or the governments they represent. The World
Bank does not guarantee the accuracy of the data included in this work. The boundaries, colors,
denominations, and other information shown on any map in this work do not imply any judgment
on the part of the World Bank concerning the legal status of any territory or the endorsement or
acceptance of such boundaries

Rights and Permissions
The material in this work is subject to copyright. Because the World Bank encourages dissemination
of its knowledge, this work may be reproduced, in whole or in part, for non-commercial purposes as
long as full attribution to this work is given.
Any queries on rights and licenses, including subsidiary rights, should be addressed to World Bank
Publications, World Bank Group, 1818 H Street NW, Washington, DC 20433, USA; fax: 202-522-2625;
pubrights@worldbank.org.
All images remain the sole property of their source and may not be used for any purpose without
written permission from the source.
Attribution—Please cite the work as follows:
World Bank. 2021. Concentrating Solar Power: Clean Power on Demand 24/7. Washington, DC:
World Bank.
Front Cover: ©Masen

                                                                                                                         2
CONCENTRATING SOLAR POWER: CLEAN POWER ON DEMAND 24/7

CONTENTS

Acknowledgements .  .  .  .  .  .  .  .  .  .  .  .  .  .  .  .  .  .  .  .  .  .  .  .  .  .  .  .  .  .  .  .  .  .  .  .  .  .  .  .  .  .  .  .  .  .  .  .  .  .  .  .  .  .  .  .  .  .  .  .  .  .  .  .  .  .  .  .  .  .  .  .  .  .  .  .  .  .  .  .  .  .  .  .  .  .  .  .  .  .  .  .  .  .  .  .  .  .  .  .  .  .  .  .  .  .  .  .  .  .  .  .  .  .  .  . 6
Acronyms and abbreviations .  .  .  .  .  .  .  .  .  .  .  .  .  .  .  .  .  .  .  .  .  .  .  .  .  .  .  .  .  .  .  .  .  .  .  .  .  .  .  .  .  .  .  .  .  .  .  .  .  .  .  .  .  .  .  .  .  .  .  .  .  .  .  .  .  .  .  .  .  .  .  .  .  .  .  .  .  .  .  .  .  .  .  .  .  .  .  .  .  .  .  .  .  .  .  .  .  .  .  .  .  .  .  .  . 7
Executive summary .  .  .  .  .  .  .  .  .  .  .  .  .  .  .  .  .  .  .  .  .  .  .  .  .  .  .  .  .  .  .  .  .  .  .  .  .  .  .  .  .  .  .  .  .  .  .  .  .  .  .  .  .  .  .  .  .  .  .  .  .  .  .  .  .  .  .  .  .  .  .  .  .  .  .  .  .  .  .  .  .  .  .  .  .  .  .  .  .  .  .  .  .  .  .  .  .  .  .  .  .  .  .  .  .  .  .  .  .  .  .  .  .  .  .  .  . 8
1.                      Why concentrating solar power? .  .  .  .  .  .  .  .  .  .  .  .  .  .  .  .  .  .  .  .  .  .  .  .  .  .  .  .  .  .  .  .  .  .  .  .  .  .  .  .  .  .  .  .  .  .  .  .  .  .  .  .  .  .  .  .  .  .  .  .  .  .  .  .  .  .  .  .  .  .  .  .  .  .  .  .  .  .  .  .  .  .  .  .  .  .  .  .  . 12
                        1.1                      CSP explained .  .  .  .  .  .  .  .  .  .  .  .  .  .  .  .  .  .  .  .  .  .  .  .  .  .  .  .  .  .  .  .  .  .  .  .  .  .  .  .  .  .  .  .  .  .  .  .  .  .  .  .  .  .  .  .  .  .  .  .  .  .  .  .  .  .  .  .  .  .  .  .  .  .  .  .  .  .  .  .  .  .  .  .  .  .  .  .  .  .  .  .  .  .  .  .  .  .  .  .  .  .  .  . 12
                        1.2                      The value of CSP .  .  .  .  .  .  .  .  .  .  .  .  .  .  .  .  .  .  .  .  .  .  .  .  .  .  .  .  .  .  .  .  .  .  .  .  .  .  .  .  .  .  .  .  .  .  .  .  .  .  .  .  .  .  .  .  .  .  .  .  .  .  .  .  .  .  .  .  .  .  .  .  .  .  .  .  .  .  .  .  .  .  .  .  .  .  .  .  .  .  .  .  .  .  .  .  .  .  .  .  . 13
2.                      Global market and outlook for concentrating solar power  .  .  .  .  .  .  .  .  .  .  .  .  .  .  .  .  .  .  .  .  .  .  .  .  .  .  .  .  .  .  .  .  .  .  .  .  .  .  .  .  .  .  .  .  .  .  .  .  .  .  .  .  .  .  .  . 20
                        2.1                      A brief history of CSP .  .  .  .  .  .  .  .  .  .  .  .  .  .  .  .  .  .  .  .  .  .  .  .  .  .  .  .  .  .  .  .  .  .  .  .  .  .  .  .  .  .  .  .  .  .  .  .  .  .  .  .  .  .  .  .  .  .  .  .  .  .  .  .  .  .  .  .  .  .  .  .  .  .  .  .  .  .  .  .  .  .  .  .  .  .  .  .  .  .  .  .  .  .  . 20
                        2.2                      Status of markets .  .  .  .  .  .  .  .  .  .  .  .  .  .  .  .  .  .  .  .  .  .  .  .  .  .  .  .  .  .  .  .  .  .  .  .  .  .  .  .  .  .  .  .  .  .  .  .  .  .  .  .  .  .  .  .  .  .  .  .  .  .  .  .  .  .  .  .  .  .  .  .  .  .  .  .  .  .  .  .  .  .  .  .  .  .  .  .  .  .  .  .  .  .  .  .  .  .  .  . 20
                        2.3                      CSP market trends: Falling costs, increasing scale .  .  .  .  .  .  .  .  .  .  .  .  .  .  .  .  .  .  .  .  .  .  .  .  .  .  .  .  .  .  .  .  .  .  .  .  .  .  .  .  .  .  .  .  .  .  .  .  .  .  .  .  .  .  .  .  .  .  . 26
3.                      Frameworks for the deployment of concentrating solar power  .  .  .  .  .  .  .  .  .  .  .  .  .  .  .  .  .  .  .  .  .  .  .  .  .  .  .  .  .  .  .  .  .  .  .  .  .  .  .  .  .  .  .  .  .  .  .  .  .  . 29
                        3.1                      Overview .  .  .  .  .  .  .  .  .  .  .  .  .  .  .  .  .  .  .  .  .  .  .  .  .  .  .  .  .  .  .  .  .  .  .  .  .  .  .  .  .  .  .  .  .  .  .  .  .  .  .  .  .  .  .  .  .  .  .  .  .  .  .  .  .  .  .  .  .  .  .  .  .  .  .  .  .  .  .  .  .  .  .  .  .  .  .  .  .  .  .  .  .  .  .  .  .  .  .  .  .  .  .  .  .  .  .  .  .  . 29
                        3.2                      Types of support mechanisms .  .  .  .  .  .  .  .  .  .  .  .  .  .  .  .  .  .  .  .  .  .  .  .  .  .  .  .  .  .  .  .  .  .  .  .  .  .  .  .  .  .  .  .  .  .  .  .  .  .  .  .  .  .  .  .  .  .  .  .  .  .  .  .  .  .  .  .  .  .  .  .  .  .  .  .  .  .  .  .  .  .  . 29
                        3.3                      Support mechanisms in practice .  .  .  .  .  .  .  .  .  .  .  .  .  .  .  .  .  .  .  .  .  .  .  .  .  .  .  .  .  .  .  .  .  .  .  .  .  .  .  .  .  .  .  .  .  .  .  .  .  .  .  .  .  .  .  .  .  .  .  .  .  .  .  .  .  .  .  .  .  .  .  .  .  .  .  .  .  .  .  . 31
                        3.4                      Financing CSP projects  .  .  .  .  .  .  .  .  .  .  .  .  .  .  .  .  .  .  .  .  .  .  .  .  .  .  .  .  .  .  .  .  .  .  .  .  .  .  .  .  .  .  .  .  .  .  .  .  .  .  .  .  .  .  .  .  .  .  .  .  .  .  .  .  .  .  .  .  .  .  .  .  .  .  .  .  .  .  .  .  .  .  .  .  .  .  .  .  .  .  .  . 34
References  .  .  .  .  .  .  .  .  .  .  .  .  .  .  .  .  .  .  .  .  .  .  .  .  .  .  .  .  .  .  .  .  .  .  .  .  .  .  .  .  .  .  .  .  .  .  .  .  .  .  .  .  .  .  .  .  .  .  .  .  .  .  .  .  .  .  .  .  .  .  .  .  .  .  .  .  .  .  .  .  .  .  .  .  .  .  .  .  .  .  .  .  .  .  .  .  .  .  .  .  .  .  .  .  .  .  .  .  .  .  .  .  .  .  .  .  .  .  .  .  .  .  .  .  .  . 37
Annex A. Further reflections on concentrating solar power technology  .  .  .  .  .  .  .  .  .  .  .  .  .  .  .  .  .  .  .  .  .  .  .  .  .  .  .  .  .  .  .  .  .  .  .  .  .  .  .  .  .  .  .  .  .  .  .  . 41
A.1                     Solar resources .  .  .  .  .  .  .  .  .  .  .  .  .  .  .  .  .  .  .  .  .  .  .  .  .  .  .  .  .  .  .  .  .  .  .  .  .  .  .  .  .  .  .  .  .  .  .  .  .  .  .  .  .  .  .  .  .  .  .  .  .  .  .  .  .  .  .  .  .  .  .  .  .  .  .  .  .  .  .  .  .  .  .  .  .  .  .  .  .  .  .  .  .  .  .  .  .  .  .  .  .  .  .  .  .  .  .  .  .  .  .  . 41
A.2                     Solar heat generation and utilization  .  .  .  .  .  .  .  .  .  .  .  .  .  .  .  .  .  .  .  .  .  .  .  .  .  .  .  .  .  .  .  .  .  .  .  .  .  .  .  .  .  .  .  .  .  .  .  .  .  .  .  .  .  .  .  .  .  .  .  .  .  .  .  .  .  .  .  .  .  .  .  .  .  .  .  .  .  .  .  .  .  .  . 41
A.3                     Types of CSP power plants .  .  .  .  .  .  .  .  .  .  .  .  .  .  .  .  .  .  .  .  .  .  .  .  .  .  .  .  .  .  .  .  .  .  .  .  .  .  .  .  .  .  .  .  .  .  .  .  .  .  .  .  .  .  .  .  .  .  .  .  .  .  .  .  .  .  .  .  .  .  .  .  .  .  .  .  .  .  .  .  .  .  .  .  .  .  .  .  .  .  .  .  .  .  .  .  . 42
A.4                     Summary of CSP plant technologies  .  .  .  .  .  .  .  .  .  .  .  .  .  .  .  .  .  .  .  .  .  .  .  .  .  .  .  .  .  .  .  .  .  .  .  .  .  .  .  .  .  .  .  .  .  .  .  .  .  .  .  .  .  .  .  .  .  .  .  .  .  .  .  .  .  .  .  .  .  .  .  .  .  .  .  .  .  .  .  .  .  .  .  . 46
A.5                     Thermal energy storage .  .  .  .  .  .  .  .  .  .  .  .  .  .  .  .  .  .  .  .  .  .  .  .  .  .  .  .  .  .  .  .  .  .  .  .  .  .  .  .  .  .  .  .  .  .  .  .  .  .  .  .  .  .  .  .  .  .  .  .  .  .  .  .  .  .  .  .  .  .  .  .  .  .  .  .  .  .  .  .  .  .  .  .  .  .  .  .  .  .  .  .  .  .  .  .  .  .  .  . 46
A.6                     Technical challenges and trends to overcome them  .  .  .  .  .  .  .  .  .  .  .  .  .  .  .  .  .  .  .  .  .  .  .  .  .  .  .  .  .  .  .  .  .  .  .  .  .  .  .  .  .  .  .  .  .  .  .  .  .  .  .  .  .  .  .  .  .  .  .  .  .  .  .  . 48
A.7                     Power block  .  .  .  .  .  .  .  .  .  .  .  .  .  .  .  .  .  .  .  .  .  .  .  .  .  .  .  .  .  .  .  .  .  .  .  .  .  .  .  .  .  .  .  .  .  .  .  .  .  .  .  .  .  .  .  .  .  .  .  .  .  .  .  .  .  .  .  .  .  .  .  .  .  .  .  .  .  .  .  .  .  .  .  .  .  .  .  .  .  .  .  .  .  .  .  .  .  .  .  .  .  .  .  .  .  .  .  .  .  .  .  .  .  .  . 50
A.8                     Heat transfer fluid .  .  .  .  .  .  .  .  .  .  .  .  .  .  .  .  .  .  .  .  .  .  .  .  .  .  .  .  .  .  .  .  .  .  .  .  .  .  .  .  .  .  .  .  .  .  .  .  .  .  .  .  .  .  .  .  .  .  .  .  .  .  .  .  .  .  .  .  .  .  .  .  .  .  .  .  .  .  .  .  .  .  .  .  .  .  .  .  .  .  .  .  .  .  .  .  .  .  .  .  .  .  .  .  .  .  .  . 51
A.9                     Mirrors .  .  .  .  .  .  .  .  .  .  .  .  .  .  .  .  .  .  .  .  .  .  .  .  .  .  .  .  .  .  .  .  .  .  .  .  .  .  .  .  .  .  .  .  .  .  .  .  .  .  .  .  .  .  .  .  .  .  .  .  .  .  .  .  .  .  .  .  .  .  .  .  .  .  .  .  .  .  .  .  .  .  .  .  .  .  .  .  .  .  .  .  .  .  .  .  .  .  .  .  .  .  .  .  .  .  .  .  .  .  .  .  .  .  .  .  .  .  .  .  .  . 52
A.10 Frames, supports, and trackers  .  .  .  .  .  .  .  .  .  .  .  .  .  .  .  .  .  .  .  .  .  .  .  .  .  .  .  .  .  .  .  .  .  .  .  .  .  .  .  .  .  .  .  .  .  .  .  .  .  .  .  .  .  .  .  .  .  .  .  .  .  .  .  .  .  .  .  .  .  .  .  .  .  .  .  .  .  .  .  .  .  .  .  .  .  .  .  .  .  .  . 52
A.11 Receiver  .  .  .  .  .  .  .  .  .  .  .  .  .  .  .  .  .  .  .  .  .  .  .  .  .  .  .  .  .  .  .  .  .  .  .  .  .  .  .  .  .  .  .  .  .  .  .  .  .  .  .  .  .  .  .  .  .  .  .  .  .  .  .  .  .  .  .  .  .  .  .  .  .  .  .  .  .  .  .  .  .  .  .  .  .  .  .  .  .  .  .  .  .  .  .  .  .  .  .  .  .  .  .  .  .  .  .  .  .  .  .  .  .  .  .  .  .  .  .  . 53
A.12 Thermal storage system .  .  .  .  .  .  .  .  .  .  .  .  .  .  .  .  .  .  .  .  .  .  .  .  .  .  .  .  .  .  .  .  .  .  .  .  .  .  .  .  .  .  .  .  .  .  .  .  .  .  .  .  .  .  .  .  .  .  .  .  .  .  .  .  .  .  .  .  .  .  .  .  .  .  .  .  .  .  .  .  .  .  .  .  .  .  .  .  .  .  .  .  .  .  .  .  .  .  .  . 53
A.13 Hybrid systems  .  .  .  .  .  .  .  .  .  .  .  .  .  .  .  .  .  .  .  .  .  .  .  .  .  .  .  .  .  .  .  .  .  .  .  .  .  .  .  .  .  .  .  .  .  .  .  .  .  .  .  .  .  .  .  .  .  .  .  .  .  .  .  .  .  .  .  .  .  .  .  .  .  .  .  .  .  .  .  .  .  .  .  .  .  .  .  .  .  .  .  .  .  .  .  .  .  .  .  .  .  .  .  .  .  .  .  .  .  .  . 54
Annex B. Development phases, component suppliers, and service providers involved in CSP projects .  .  .  .  .  .  .  .  . 57
Annex C. CSP Plants in Operation and Under Construction  .  .  .  .  .  .  .  .  .  .  .  .  .  .  .  .  .  .  .  .  .  .  .  .  .  .  .  .  .  .  .  .  .  .  .  .  .  .  .  .  .  .  .  .  .  .  .  .  .  .  .  .  .  .  .  .  .  .  .  .  .  .  .  . 64

                                                                                                                                                                                                                                                                                                                                                                                                                  3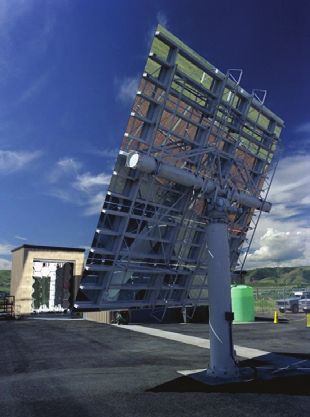
CONCENTRATING SOLAR POWER: CLEAN POWER ON DEMAND 24/7
LIST OF FIGURES
Figure ES.1 World map of direct normal irradiation (DNI) . . . . . . . . . . . . . . . . . . . . . . . . . . . . . . . . . . . . . . . . . . . . . . . . . . . . . . . . . . . . . . . . 8
Figure ES.2 Global weighted average LCOE and auction/PPA prices for CSP, onshore
and offshore wind, and solar . . . . . . . . . . . . . . . . . . . . . . . . . . . . . . . . . . . . . . . . . . . . . . . . . . . . . . . . . . . . . . . . . . . . . . . . . . . . . . . . . . . . . 9
Figure ES.3 Key benefits of CSP technology . . . . . . . . . . . . . . . . . . . . . . . . . . . . . . . . . . . . . . . . . . . . . . . . . . . . . . . . . . . . . . . . . . . . . . . . . . . . . . . . 10
Figure 1.1 Four types of concentrating solar power technologies . . . . . . . . . . . . . . . . . . . . . . . . . . . . . . . . . . . . . . . . . . . . . . . . . . 12
Figure 1.2 Parabolic trough collectors (left) and CSP tower (right) . . . . . . . . . . . . . . . . . . . . . . . . . . . . . . . . . . . . . . . . . . . . . . . . . . 12
Figure 1.3 World map of direct normal irradiation (DNI) . . . . . . . . . . . . . . . . . . . . . . . . . . . . . . . . . . . . . . . . . . . . . . . . . . . . . . . . . . . . . . 13
Figure 1.4 Marginal curtailment in California due to overgeneration as the penetration of solar
photovoltaics increases . . . . . . . . . . . . . . . . . . . . . . . . . . . . . . . . . . . . . . . . . . . . . . . . . . . . . . . . . . . . . . . . . . . . . . . . . . . . . . . . . . . . . . . . . . 15
Figure 1.5 Peak times of daily net electricity load (after solar PV): California’s “duck curve” . . . . . . . . . . . . . . . . . . .16
Figure 1.6 The energy flows underpinning sustained solar electricity generation throughout the day . . . 16
Figure 1.7 Key characteristics of available energy storage technologies . . . . . . . . . . . . . . . . . . . . . . . . . . . . . . . . . . . . . . . . . . 17
Figure 1.8 A comparison of the levelized cost of electricity: CSP versus PV (both with nine
hours of storage), 2015–30 . . . . . . . . . . . . . . . . . . . . . . . . . . . . . . . . . . . . . . . . . . . . . . . . . . . . . . . . . . . . . . . . . . . . . . . . . . . . . . . . . . . . . .17
Figure 1.9 La Africana parabolic trough plant in Córdoba, Spain . . . . . . . . . . . . . . . . . . . . . . . . . . . . . . . . . . . . . . . . . . . . . . . . . . . . 18
Figure 2.1 Cumulative renewable energy capacity in Chile between January 2008 and February 2020 . . . 23
Figure 2.2 Global weighted average LCOE and auction/PPA prices for CSP,
onshore and offshore wind, and solar . . . . . . . . . . . . . . . . . . . . . . . . . . . . . . . . . . . . . . . . . . . . . . . . . . . . . . . . . . . . . . . . . . . . . . . . 26
Figure 2.3 Global cumulative installed CSP capacity, 2006–May 2020 . . . . . . . . . . . . . . . . . . . . . . . . . . . . . . . . . . . . . . . . . . . . . 27
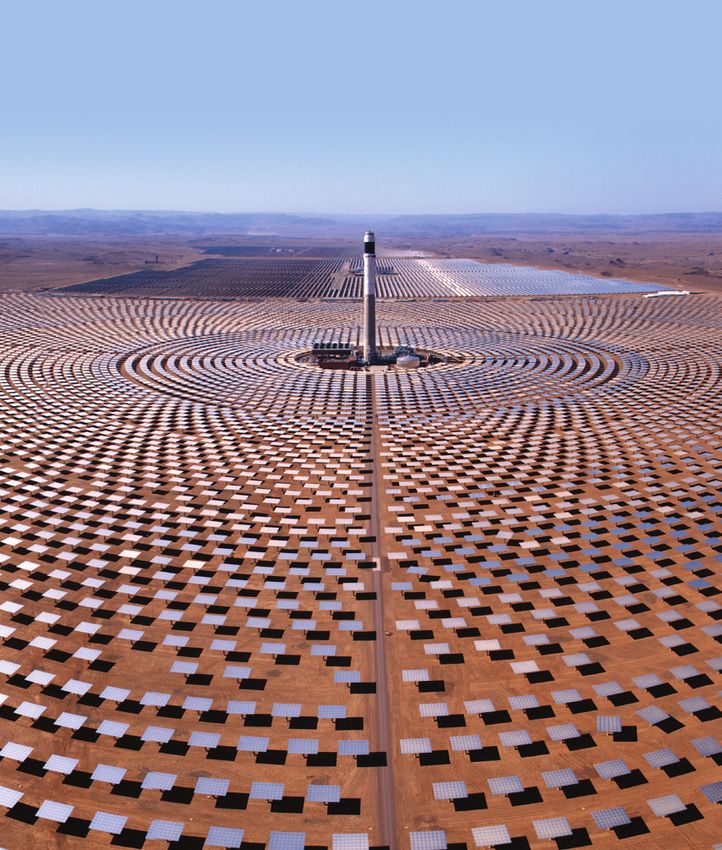
Figure 3.1 Solar tower at Noor III in Ouarzazate, Morocco . . . . . . . . . . . . . . . . . . . . . . . . . . . . . . . . . . . . . . . . . . . . . . . . . . . . . . . . . . . . 32
Figure 3.2 Noor Ouarzazate Solar Complex . . . . . . . . . . . . . . . . . . . . . . . . . . . . . . . . . . . . . . . . . . . . . . . . . . . . . . . . . . . . . . . . . . . . . . . . . . . . . . 33
Figure B 3.2.1 How the Moroccan Agency for Solar Energy steered the development of CSP plants . . . . . . . . . . . 36
Figure A.1 Solar radiation components resulting from interactions with the atmosphere . . . . . . . . . . . . . . . . . . . . 41
Figure A.2 Parabolic trough design . . . . . . . . . . . . . . . . . . . . . . . . . . . . . . . . . . . . . . . . . . . . . . . . . . . . . . . . . . . . . . . . . . . . . . . . . . . . . . . . . . . . . . . . . 42
Figure A.3 Physical principles of a parabolic trough collector . . . . . . . . . . . . . . . . . . . . . . . . . . . . . . . . . . . . . . . . . . . . . . . . . . . . . . . . 43
Figure A.4 Parabolic trough collectors at “La Africana” Spain . . . . . . . . . . . . . . . . . . . . . . . . . . . . . . . . . . . . . . . . . . . . . . . . . . . . . . . . . 43
Figure A.5 Tower design . . . . . . . . . . . . . . . . . . . . . . . . . . . . . . . . . . . . . . . . . . . . . . . . . . . . . . . . . . . . . . . . . . . . . . . . . . . . . . . . . . . . . . . . . . . . . . . . . . . . . . . 44
Figure A.6 Components of a heliostat . . . . . . . . . . . . . . . . . . . . . . . . . . . . . . . . . . . . . . . . . . . . . . . . . . . . . . . . . . . . . . . . . . . . . . . . . . . . . . . . . . . . . . 44
Figure A.7 A Linear Fresnel power plant . . . . . . . . . . . . . . . . . . . . . . . . . . . . . . . . . . . . . . . . . . . . . . . . . . . . . . . . . . . . . . . . . . . . . . . . . . . . . . . . . . . 45
Figure A.8 Two-tank direct storage system . . . . . . . . . . . . . . . . . . . . . . . . . . . . . . . . . . . . . . . . . . . . . . . . . . . . . . . . . . . . . . . . . . . . . . . . . . . . . . . 47
Figure A.9 Two-tank indirect storage system . . . . . . . . . . . . . . . . . . . . . . . . . . . . . . . . . . . . . . . . . . . . . . . . . . . . . . . . . . . . . . . . . . . . . . . . . . . . . 47
Figure A.10 Single-tank thermocline storage system . . . . . . . . . . . . . . . . . . . . . . . . . . . . . . . . . . . . . . . . . . . . . . . . . . . . . . . . . . . . . . . . . . . . 48
Figure A.11 Steam accumulator . . . . . . . . . . . . . . . . . . . . . . . . . . . . . . . . . . . . . . . . . . . . . . . . . . . . . . . . . . . . . . . . . . . . . . . . . . . . . . . . . . . . . . . . . . . . . . . 48
Figure A.12 Decoupled solar combined cycle system using central tower receiver . . . . . . . . . . . . . . . . . . . . . . . . . . . . . . 54
Figure A.13 Schematic of CAPTure power plant . . . . . . . . . . . . . . . . . . . . . . . . . . . . . . . . . . . . . . . . . . . . . . . . . . . . . . . . . . . . . . . . . . . . . . . . . . . 55
4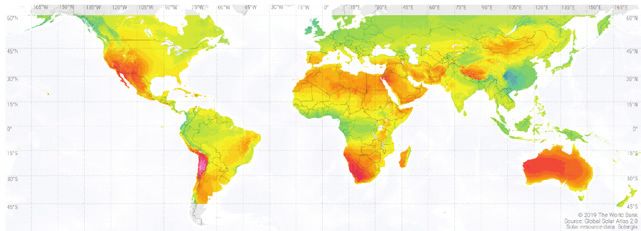
CONCENTRATING SOLAR POWER: CLEAN POWER ON DEMAND 24/7

LIST OF TABLES

Table 2.1   CSP plants operating in MENA .  .  .  .  .  .  .  .  .  .  .  .  .  .  .  .  .  .  .  .  .  .  .  .  .  .  .  .  .  .  .  .  .  .  .  .  .  .  .  .  .  .  .  .  .  .  .  .  .  .  .  .  .  .  .  .  .  .  .  .  .  .  .  .  .  .  .  .  .  .  .  .  .  .  .  .  .  .  .  .  .  .  . 21
Table 2.2   Pipeline of CSP projects in MENA  .  .  .  .  .  .  .  .  .  .  .  .  .  .  .  .  .  .  .  .  .  .  .  .  .  .  .  .  .  .  .  .  .  .  .  .  .  .  .  .  .  .  .  .  .  .  .  .  .  .  .  .  .  .  .  .  .  .  .  .  .  .  .  .  .  .  .  .  .  .  .  .  .  .  .  .  .  .  . 21
Table 2.3   CSP projects in China  .  .  .  .  .  .  .  .  .  .  .  .  .  .  .  .  .  .  .  .  .  .  .  .  .  .  .  .  .  .  .  .  .  .  .  .  .  .  .  .  .  .  .  .  .  .  .  .  .  .  .  .  .  .  .  .  .  .  .  .  .  .  .  .  .  .  .  .  .  .  .  .  .  .  .  .  .  .  .  .  .  .  .  .  .  .  .  .  .  .  .  .  .  . 24
Table 2.4   Summary of South Africa’s Renewable Energy Independent Power Producer Procurement
            Programme (REIPPPP) .  .  .  .  .  .  .  .  .  .  .  .  .  .  .  .  .  .  .  .  .  .  .  .  .  .  .  .  .  .  .  .  .  .  .  .  .  .  .  .  .  .  .  .  .  .  .  .  .  .  .  .  .  .  .  .  .  .  .  .  .  .  .  .  .  .  .  .  .  .  .  .  .  .  .  .  .  .  .  .  .  .  .  .  .  .  .  .  .  .  .  .  .  . 25
Table 2.5   CSP projects in South Africa .  .  .  .  .  .  .  .  .  .  .  .  .  .  .  .  .  .  .  .  .  .  .  .  .  .  .  .  .  .  .  .  .  .  .  .  .  .  .  .  .  .  .  .  .  .  .  .  .  .  .  .  .  .  .  .  .  .  .  .  .  .  .  .  .  .  .  .  .  .  .  .  .  .  .  .  .  .  .  .  .  .  .  .  .  . 25
Table 3.1   Incentives and support mechanisms for the commercial development of CSP, by country  .  .  .  .  .  . 33
Table A.1   Comparison of concentrating solar power technologies .  .  .  .  .  .  .  .  .  .  .  .  .  .  .  .  .  .  .  .  .  .  .  .  .  .  .  .  .  .  .  .  .  .  .  .  .  .  .  .  .  .  .  .  .  .  .  .  .  . 46
Table A.2   Concentrating solar power: Technical challenges and efforts to overcome them .  .  .  .  .  .  .  .  .  .  .  .  .  .  .  .  .  .  . 49
Table A.3   Material costs of thermal storage media  .  .  .  .  .  .  .  .  .  .  .  .  .  .  .  .  .  .  .  .  .  .  .  .  .  .  .  .  .  .  .  .  .  .  .  .  .  .  .  .  .  .  .  .  .  .  .  .  .  .  .  .  .  .  .  .  .  .  .  .  .  .  .  .  .  .  .  .  .  . 54
Table B.1   Companies involved in the construction of CSP plants, by type and project phase  .  .  .  .  .  .  .  .  .  .  .  .  .  .  .  . 57
Table B.2   CSP component suppliers and service providers .  .  .  .  .  .  .  .  .  .  .  .  .  .  .  .  .  .  .  .  .  .  .  .  .  .  .  .  .  .  .  .  .  .  .  .  .  .  .  .  .  .  .  .  .  .  .  .  .  .  .  .  .  .  .  .  .  .  .  . 58
Table B.3   New potential suppliers emerging from the Chinese CSP demonstration program .  .  .  .  .  .  .  .  .  .  .  .  .  .  .  . 63

LIST OF BOXES

Box 1.1     Country plans to reduce greenhouse gas emissions  .  .  .  .  .  .  .  .  .  .  .  .  .  .  .  .  .  .  .  .  .  .  .  .  .  .  .  .  .  .  .  .  .  .  .  .  .  .  .  .  .  .  .  .  .  .  .  .  .  .  .  .  .  .  . 18
Box 2.1     The DEWA IV 950 MW CSP/PV solar hybrid project  .  .  .  .  .  .  .  .  .  .  .  .  .  .  .  .  .  .  .  .  .  .  .  .  .  .  .  .  .  .  .  .  .  .  .  .  .  .  .  .  .  .  .  .  .  .  .  .  .  .  .  .  .  .  .  .  . 22
Box 2.2     CSP project development and operational best practices  .  .  .  .  .  .  .  .  .  .  .  .  .  .  .  .  .  .  .  .  .  .  .  .  .  .  .  .  .  .  .  .  .  .  .  .  .  .  .  .  .  .  .  .  .  .  .  . 28
Box 3.1     CSP project structure models  .  .  .  .  .  .  .  .  .  .  .  .  .  .  .  .  .  .  .  .  .  .  .  .  .  .  .  .  .  .  .  .  .  .  .  .  .  .  .  .  .  .  .  .  .  .  .  .  .  .  .  .  .  .  .  .  .  .  .  .  .  .  .  .  .  .  .  .  .  .  .  .  .  .  .  .  .  .  .  .  .  .  .  . 31
Box 3.2     Morocco: The Noor Ouarzazate CSP Project  .  .  .  .  .  .  .  .  .  .  .  .  .  .  .  .  .  .  .  .  .  .  .  .  .  .  .  .  .  .  .  .  .  .  .  .  .  .  .  .  .  .  .  .  .  .  .  .  .  .  .  .  .  .  .  .  .  .  .  .  .  .  .  .  .  . 36
Box A.1     Increasing generation flexibility: Thermal energy storage in decoupled solar
            combined cycle configurations .  .  .  .  .  .  .  .  .  .  .  .  .  .  .  .  .  .  .  .  .  .  .  .  .  .  .  .  .  .  .  .  .  .  .  .  .  .  .  .  .  .  .  .  .  .  .  .  .  .  .  .  .  .  .  .  .  .  .  .  .  .  .  .  .  .  .  .  .  .  .  .  .  .  .  .  .  .  .  .  .  . 69

                                                                                                                                                                                                                                                                                                                                 5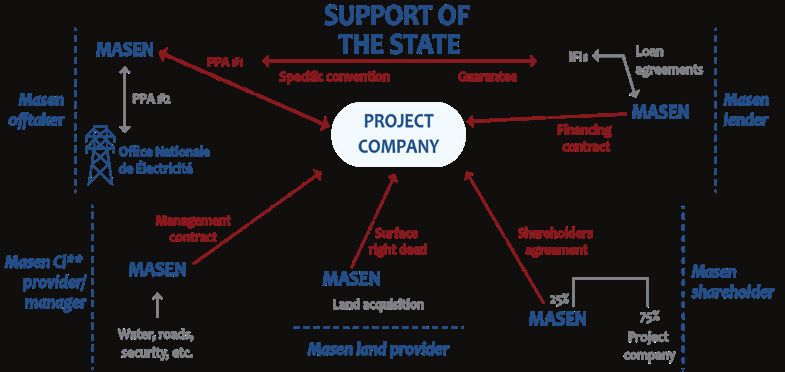
CONCENTRATING SOLAR POWER: CLEAN POWER ON DEMAND 24/7

ACKNOWLEDGEMENTS

This report provides an overview of the development of Concentrating Solar Power and its potential
contribution in furthering cleaner and more robust energy systems in regions with high levels of direct normal
irradiation (DNI). This work has been carried out under the Middle East and North Africa Concentrating Solar
Power Knowledge and Innovation Program (MENA CSP KIP) with funding from the Clean Technology Fund of
the Climate Investment Funds. Preparation of this report was managed by a World Bank team led by Jonathan
Edwards Sinton and Elena Cuadros.

An early draft of this report was prepared by Jorge Servert, José Manuel Nieto and Diego López of Solar
Technical Advisors (STA). This report was thoroughly reviewed by a panel of experts, chaired by Erik Fernstrom
(World Bank) and which included Pierre Audinet (World Bank), Luis Crespo (European Solar Thermal Electricity
Association), Cédric Philibert (then at the International Energy Agency) and Dana Younger (then at IFC).
In response to the feedback of this panel, a new draft was produced in collaboration with Pablo Ralon (IRENA)
and Michael Taylor (IRENA). World Bank Group staff and consultants contributed in numerous ways, and
included: Zuzana Dobrotková, Gabriela Elizondo Azuela, Therese Fernlund, Chris Edward Jackson, Vanessa
Janik, Elisabeth Maier, Angeline Mani, Manuel Millan Sanchez, Deger Saygin, Yanqin Song, Nadia Taobane,
Efstratios Tavoulareas, Dana Younger, Alexis Gazzo, Christoph Kost, Silvia Pariente-David, Jonathan Walters and
Frank Wouters.

This final report was reviewed, updated and edited by Carlos Márquez (ATA Insights). Alejandro Barón (ATA
Renewables) provided feedback on technical aspects of the report. Xavier Lara (AELIUSEC), Andrea Lovato
(ACWA) and Mark Mehos (NREL) provided feedback on specific sections of the report. Faye Makeig proof-read
and copy-edited the final report, augmenting work on an earlier version by Steven Kennedy. Henrik Williams
was responsible for typesetting and design.

                                                                                                                  6
CONCENTRATING SOLAR POWER: CLEAN POWER ON DEMAND 24/7

ACRONYMS AND ABBREVIATIONS

CO2         carbon dioxide
CSP         concentrating solar power
CTF         Clean Technology Fund
DEWA        Dubai Electricity and Water Authority
DSCC        decoupled solar combined cycle
DNI         direct normal irradiation
EPC         engineering, procurement, and construction
GHG         greenhouse gas
GW          gigawatt
HTF         heat transfer fluid
IFI         international financial institution
IPP         independent power producer
ISCC        integrated solar combined cycle
kWh         kilowatt-hour
kWh/m   2
            kilowatt-hour per square meter
LCOE        levelized cost of electricity
m 2
            square meter
MASEN       Moroccan Agency for Solar Energy
MENA        Middle East and North Africa
MW          megawatt
MWe         megawatt electric
OECD        Organisation for Economic Co-operation and Development
OPEX        operational expenditure
O&M         operations and maintenance
PPA         power purchase agreement
PPP         public-private partnership
PV          photovoltaic
REFIT       renewable energy feed-in tariff
UAE         United Arab Emirates

                                                                                                            7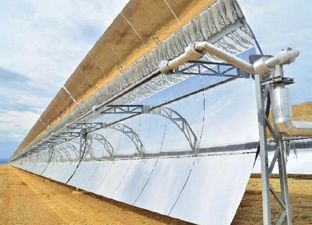
CONCENTRATING SOLAR POWER: CLEAN POWER ON DEMAND 24/7

EXECUTIVE SUMMARY

Concentrating solar power (CSP) with thermal                 solar photovoltaic (PV). Recent bids for large-scale PV
energy storage can provide flexible, renewable               projects in the Middle East and North Africa (MENA)
energy, 24/7, in regions with excellent direct solar         region have shown that prices between $0.02 and
resources                                                    $0.03 per kilowatt-hour (kWh) are achievable in a wide
CSP with thermal energy storage is capable of                range of contexts, suggesting that PV is the cheapest
storing energy in the form of heat, at utility scale,        way to generate electricity in this part of the world.
for days with minimal losses. Stored heat can then
be converted into electricity and dispatched as              However, using inexpensive PV to achieve the lowest-
required by demand, even at night or during cloudy           cost energy mix requires flexible generation assets
periods of the day. CSP plants can be designed to            or low-cost storage to meet electricity demand 24
work as baseload power generation assets, providing          hours a day. One way to achieve this flexibility via
renewable power 24/7. CSP is also flexible, meaning          renewables is to combine CSP with thermal energy
that it can quickly ramp up or down as required by           storage and/or hydropower, depending on availability.
the grid. When ramping down, the output is not               To simply add wind or PV capacity without mitigating
wasted; instead, it can be stored as heat in molten          variability is likely to lead to high levels of marginal
salt tanks and deployed hours or even days later.            curtailment, making each additional unit of PV or
                                                             wind effectively more expensive because less and less
CSP with thermal energy storage can lower the                additional output can be used. A study that modelled
cost of rapidly expanding renewable energy                   grid conditions in California estimates that deploying
In places with high levels of direct normal irradiation      CSP with thermal energy storage can drastically
(DNI), which abound in the Middle East, northern and         reduce PV curtailment and therefore reduce overall
southern Africa, and several other regions around the        system costs (Denholm, Clark, and O’Connell 2016).
world (figure ES.1), CSP with thermal energy storage
can enable the lowest-cost energy mix at the country         CSP’s capacity to reduce curtailment is important
level by allowing the grid to absorb larger amounts          because it enables grid systems to realize the full
of energy from cheap variable renewables, such as            value of PV and wind investments and to replace

FIGURE ES.1 World map of direct normal irradiation (DNI)

Source: Global Solar Atlas (ESMAP 2019).
Note: kWh/m2 = kilowatt-hour per square meter.

                                                                                                                        8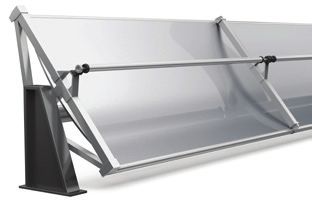
CONCENTRATING SOLAR POWER: CLEAN POWER ON DEMAND 24/7
a larger share of fossil fuels in the energy mix. in Spain between 2008 and 2012 received a feed-
Power generation systems can be made more in tariff (FiT) of around $0.40/kWh. By contrast, the
robust, resilient, and affordable by deploying these electricity price for Noor Ouarzazate III, awarded in
complementary renewable power generation 2015, was $0.16/kWh. More recently, a 950 MW CSP-
technologies. Depending on resource availability, PV hybrid plant by the Dubai Electricity and Water
such a portfolio may include large amounts of Authority (DEWA) in the United Arab Emirates was
variable renewables such as PV and wind, storage awarded a price of $0.073/kWh1.
technologies such as batteries and pumped hydro,
demand response measures, and dispatchable Given the trends observed since 2007, it is expected
renewable energy sources such as CSP with thermal that PPA prices will continue to decline in the
energy storage and hydropower dams. coming years if deployments continue to scale.
Further deployments will incorporate technological
CSP costs have fallen significantly over the past 10 improvements, improve economies of scale and
years unlock efficiencies in both the construction and
Electricity prices awarded to new CSP plants under operation of CSP plants.
power purchase agreements (PPAs) have declined
significantly in the past decade (figure ES.2). For the Concessional financing plays a key role in reducing
Nevada Solar One plant in the United States, the financial risks and lowering the cost of CSP
power purchase price was around $0.30/kWh when Despite promising developments in the overall
the plant was first commissioned in 2007. Plants built cost of CSP technologies, their relatively high up-
FIGURE ES.2 Global weighted average LCOE and auction/PPA prices for CSP, onshore and offshore wind,
and solar
Solar photovoltaic Concentrating solar power Onshore wind Offshore wind
0.4 0.378
0.346
0.3
0.259
2019 USD/kWh
0.2
0.182
0.161
0.1 0.086
0.08
0.075
Fossil fuel cost range
0.039 0.043
0.0
2010
2011
2012
2013
2014
2015
2016
2017
2018
2019
2020
2021
2010
2011
2012
2013
2014
2015
2016
2017
2018
2019
2020
2021
2010
2011
2012
2013
2014
2015
2016
2017
2018
2019
2020
2021
2010
2011
2012
2013
2014
2015
2016
2017
2018
2019
2020
2021
2022
2023
n Auction database n LCOE database
Source: IRENA 2020.
Note: The thick lines are the global weighted average LCOE, or auction values, by year. The gray bands, which vary by year, are the cost/price range for the 5th and
95th percentiles of projects. For the LCOE data, the real weighted average cost of capital is 7.5% for China and members of the Organisation for Economic Co-
operation and Development, and 10% for the rest of the world. The band that crosses the entire chart represents the fossil-fuel-fired power generation cost range.
For CSP, the dashed blue bar in 2019 shows the weighted average value including projects in Israel.
CSP = concentrating solar power; LCOE = levelized cost of electricity; PPA = power purchase agreement; USD/kWh = US dollars per kilowatt-hour.
1
These prices are quoted in nominal terms.
9CONCENTRATING SOLAR POWER: CLEAN POWER ON DEMAND 24/7
front investment costs remain a barrier to their Most of the world’s newest CSP plants have been
deployment. But international financial institutions built in Chile, China, Morocco, and the United
(IFIs) and multilateral development institutions, as Arab Emirates. There are around 6 gigawatts (GW)
well as national governments, can play an important of operating CSP plants worldwide, which are
role in addressing this barrier. By supplying longer- concentrated in Spain (2.3 GW), the United States (1.6
duration, lower-interest financing to CSP plant GW), Morocco (0.5 GW), China (0.5 GW), and South
developers, these entities can help to lower the Africa (0.5 GW). The MENA region is at the forefront of
costs of initial market development. This will, in the most recent wave of construction projects, with
turn, foster more diverse and competitive supply Morocco and the United Arab Emirates being the
chain for CSP and continue to drive down costs. most active markets in the region.
Reducing perceived financing risks is particularly
important when no entities, whether public or Recently, the lowest PPA for a CSP project was
private, are willing to shoulder the full costs of a granted in Dubai (United Arab Emirates) at $0.073/
project on their own. Meanwhile, international kWh for the DEWA 950 MW CSP-PV hybrid project.
financial institutions can provide capacity building The CSP part of this complex comprises three
and knowledge transfer to local and international parabolic trough plants (200 MW each with 12.5
stakeholders in the project. hours storage) and one tower plant (100 MW,
15 hours storage). The project is designed to
One of the largest individual financial contributors provide electricity during the evening and is being
to global CSP developments is the Clean Technology built alongside a 250 MW PV plant; this hybrid
Fund (CTF), which has supported numerous projects, design allows it to combine the strengths of both
including: technologies to provide clean power 24/7.
z Noor Ouarzazate I, II, and III (510 megawatts Morocco is home to the largest operating CSP complex
[MW] CSP), Morocco. Along with various in the world: Noor Ouarzazate, which comprises 510
international financial institutions, the fund MW of CSP and a 72 MW PV plant. Subsequently, the
provided low-cost debt that decreased project Noor Midelt 1 project (800 MW, CSP-PV hybrid) was
costs by 25 percent, thereby decreasing the awarded, and stands as the first project in which output
subsidy needed from the government of Morocco from both PV and CSP will be stored as heat in molten
from $60 million to $20 million annually. Also, salt tanks (Kramer 2020). The Midelt solar complex will
$435 million was awarded by the CTF. have further phases, so it is possible that there will be
z Noor Midelt (800 MW CSP-PV hybrid), Morocco. additional CSP plants in Morocco.
In 2017, a loan of $25 million was announced for this
solar project, which combines solar thermal and PV. Other countries in the region that are actively
z Cerro Dominador (110 MW CSP), Chile. Fund considering the deployment of CSP include Jordan,
support was critical to the launch of bidding Lebanon, and Tunisia. Outside MENA, the country to
for South America’s first CSP plant. Through the watch is China, where 500 MW of CSP have already
Inter-American Development Bank, the fund being deployed, 414 MW are being developed, and
attracted the interest of other donors, including 100 MW are under construction. Most of this activity
the European Union and KfW. This allowed an is happening under a government-sponsored set of
incentives package comprising grants and soft initial CSP pilot projects.
loans to be put together, closing the gap between
CSP and other alternatives. Some of the key benefits of CSP—which, combined
with thermal energy storage, can be used to generate
electricity 24 hours a day—are presented in figure ES.3.
10CONCENTRATING SOLAR POWER: CLEAN POWER ON DEMAND 24/7
FIGURE ES.3 Key benefits of CSP technology
World's most abundant
renewable energy source:
the sun
Energy security: domestic Dispatchable energy: firm
resource capacity to meet peaks
Increasing level of
deployment: new plants in 24 HR SOLAR Ancillary services to
the grid: eg. frequency
emerging economies regulation
Higher develoyment of PV
Local content: 30% local
and wind: CSP's flexibility
content in new projects
enables grid to absorb
operating in MENA
more variable RE
Sustainable energy Competitive price:
storage: No rare earth or 24-hour solar energy
special minerals needed CSP starting to match gas
Job creation: Up to Efficient, long-lived
20 jobs/MW during storage: Minimal losses,
construction 25+ year lifetimes
No CO2 emissions in
operation
Note: CO2 = carbon dioxide; CSP = concentrating solar power; h = hour; MENA = Middle East and North Africa; MW = megawatt; PV = photovoltaic; RE =
renewable energy.
11CONCENTRATING SOLAR POWER: CLEAN POWER ON DEMAND 24/7
1
1.1 CSP explained
WHY CONCENTRATING SOLAR POWER?
of photons from the sun directly to electricity with a
Concentrating solar power (CSP) is a renewable silicon-based semiconductor.
energy technology that uses mirrors to focus direct
solar radiation on a fluid-filled receiver, typically There are four CSP technologies: parabolic trough,
thermal oil or molten salts. This fluid, commonly solar tower, linear Fresnel, and parabolic dish
referred to as heat transfer fluid (HTF), then (figure 1.1). With an 81 percent market share, the
conducts heat that is used to generate electricity parabolic trough (figure 1.2, left) is the predominant
via a steam turbine generator similar to that used in technology of CSP plants deployed to date. Most
conventional thermal power plants. By contrast, solar of the remaining plants are solar towers (figure 1.2,
photovoltaic (PV) technology converts the energy right), while Fresnel and parabolic dish systems
Figure 1.1 Four types of concentrating solar power technologies
Parabolic trough Linear fresnel reflector (LFR)
Absorber tube Curved mirrors
Reflector
LINEAR FOCUS
Solar field piping
Absorber tube
and reconcentrator
Parabolic dish Central receiver
Receiver/engine Solar tower
POINT FOCUS
Reflector
Heliostats
Figure 1.2 Parabolic trough collectors (left) and CSP tower (right)
Sources: Cuadros Fernández 2017; ACWA Power 2018.
Note: CSP = concentrating solar power.
12CONCENTRATING SOLAR POWER: CLEAN POWER ON DEMAND 24/7
FIGURE 1.3 World map of direct normal irradiation (DNI)
Source: Global Solar Atlas (ESMAP 2019).
Note: kWh/m2 = kilowatt-hour per square meter.
represent a very small fraction of current installed by the solar field and stored in tanks for hours or
capacity. (See Annex C. CSP Plants in Operation and even days. If the solar field and storage capacity are
Under Construction). sufficiently large, operators may dispatch electricity
generated by the plant up to 24 hours per day.
The primary driver of a CSP plant’s performance is
the level of direct normal irradiance (DNI), or direct More details on CSP technology are presented in
sunlight, available at a given site. To be economic, annex A.
developers typically require an annual DNI threshold
of between 1,900 and 2,100 kilowatt-hours per 1.2 The value of CSP
square meter (kWh/m2). CSP offers a diverse array of services and benefits
that complement other generation options to meet
Sites with suitable DNI for CSP are found in arid growing demand for affordable, secure, and clean
and semi-arid areas with reliably clear skies and power while offering opportunities for domestic
low aerosol optical depths, typically at subtropical industrial and social development.
latitudes 15° to 40° north or south (figure 1.3). Sites
with these characteristics can be found in: As a renewable energy technology, CSP is also an
essential component of the transition to an energy
z Australia system that is less damaging to the environment and
z Chile and Peru health of the population, and that provides greater
z Middle East and North Africa (MENA) energy security. Generating electricity with CSP uses
z Northwestern India a local, free energy source: the sun. In addition, using
z Southern Africa sunlight instead of depending on purchased fuel can
z Southwestern United States and northern Mexico significantly reduce the fiscal pressures on countries
z Western China that rely on imported fossil fuels, while improving their
balance of payments. This can help to improve access
CSP plants today are typically coupled with thermal to financing and reduce the overall system costs of all
energy storage, as this reduces the cost of electricity locally generated power, by reducing the uncertainty
and provides increased generation flexibility. Storage of future generation costs. CSP with thermal energy
is achieved by using thermal oil or molten salt heated storage can increase the security of an energy system
13CONCENTRATING SOLAR POWER: CLEAN POWER ON DEMAND 24/7
by operating flexibly and for longer load hours than deployed whenever it is needed, even at night. In this
solar photovoltaics. Dry-cooled CSP plants also use respect, CSP and solar PV are complementary.
relatively little water, especially compared with wet-
cooled nuclear, coal, and natural gas facilities (NREL Countries seeking affordable clean energy to
2015), reducing water-stress in arid areas. replace fossil fuels would benefit from deploying a
combination of low-cost variable renewable sources,
The following sections elaborate on the key such as wind and solar PV, alongside dispatchable
characteristics of CSP. clean energy sources, such as CSP, biomass, and hydro,
and flexible auxiliary assets like electrochemical
CSP is a flexible source of renewable power that storage (batteries) and demand-side management.
enhances grid reliability
CSP with energy storage is a flexible renewable resource CSP enables grids to incorporate a larger share
that can quickly ramp up and down in response to of variable renewable energy and reduces
demand and the needs of the grid operator. curtailment
Where the penetration of variable renewables is
The rise of wind and solar PV has highlighted the high, and in the absence of flexible generation
need for renewable assets that can assist the flexible assets or energy storage systems, a lot of variable
operation of power systems to ensure the reliability renewable energy output could go to waste. This
of electricity supply and the value premium these is known as curtailment. CSP with thermal energy
flexible assets can command. This is because wind and storage helps reduce the curtailment of variable
solar PV are variable, which means that their output renewables and, in doing so, enables the grid to
fluctuates depending on the availability of sunshine incorporate more renewables.
and wind, respectively. PV output, for example, tends
to peak at around midday, when solar radiation Reducing curtailment is particularly important for
reaches its highest point, and then falls steadily over the delivery of affordable clean energy in the MENA
the course of the day until it reaches zero at nightfall. region. Recent bids for large-scale PV projects in
Additionally, as the share of variable renewable energy MENA have shown that prices between and $0.02/
rises the need to balance hourly fluctuations in their kWh and $0.03/kWh are achievable in a wide range
output also becomes more important. of contexts in the coming years, suggesting that PV
is the cheapest way to generate electricity in this
The fluctuations in output from variable renewables part of the world. However, simply adding more PV
require careful management and, at a high rate of without taking any other measures would, eventually,
penetration, could compromise grid reliability, if lead to high levels of curtailment.
not properly planned for, potentially leading to
brownouts and blackouts. As shown by a study carried out in California
(Denholm, Clark, and O’Connell 2016), simply
CSP with thermal energy storage offers a solution by adding PV capacity without mitigating variability
allowing plant operators to store solar power and then, leads to high levels of marginal curtailment,
upon receiving instructions from the grid operator, making each additional unit of PV effectively
dispatch electricity at short notice to complement more expensive because less and less additional
fluctuations in output from variable renewables. The output can be used. The same study shows that
most evident example of this is when PV output falls adding CSP with thermal energy storage to the
in the late afternoon and CSP with thermal energy generation mix enables greater utilization of PV
storage deploys stored energy to meet demand. But by reducing curtailment. Figure 1.4 shows the
CSP can also do the opposite. As PV output peaks, level of solar PV production that would need to
CSP can stop evacuating electricity while storing be curtailed under three conditions of system
the energy in the form of heat, which can then be flexibility, as solar energy penetration increases.
14CONCENTRATING SOLAR POWER: CLEAN POWER ON DEMAND 24/7
FIGURE 1.4 Marginal curtailment in California due to overgeneration as the penetration of solar
photovoltaics increases
70%
60%
Marginal annual solar curtailment
50%
40%
30%
20%
10%
0%
6% 8% 10% 12% 14% 16% 18% 20% 22% 24% 26% 28% 30% 32% 34%
Annual solar energy penetration
n Added PV (limited flexibility) n Added PV (enhanced flexibility) n Added CSP/TES
Source: Denholm, Clark, and O’Connell 2016.
Note: CSP = concentrating solar power; PV = photovoltaic; TES = thermal energy storage.
Where solar PV penetration reaches around 20 with enhanced measures, when PV meets 28.4
percent, almost 50 percent of marginal solar PV percent of total demand, marginal curtailment rises
generation needs to be curtailed in an inflexible to 30 percent. In these circumstances, deploying
power system. Enhancing system flexibility with one CSP unit, with six hours of thermal energy
a variety of measures enables the grid to absorb storage and enough capacity to supply 1 percent
much more PV generation, keeping marginal PV of additional solar generation, would reduce
curtailment below 10 percent at a PV penetration marginal curtailment from 30 percent to 10 percent
of 20 percent (see the red line in figure 1.4). Even (Denholm, Clark, and O’Connell 2016).
FIGURE 1.5 Peak times of daily net electricity load (after solar PV): California’s “duck curve”
34,000
Stop
32,000
Stop
30,000
28,000
2012 (actual)
Megawatts
26,000
2013
Start 2014
24,000 2015
2016
2017
22,000 2018
2019 Start
2020
20,000
18,000
12am 3am 6am 9am 12pm 3pm 6pm 9pm
Hour of day
Source: CAISO 2016.
15CONCENTRATING SOLAR POWER: CLEAN POWER ON DEMAND 24/7
FIGURE 1.6 The energy flows underpinning sustained solar electricity generation throughout the day
100%
90%
80%
70%
60%
Percentage
50%
40%
30%
20%
10%
0%
7 8 9 10 11 12 13 14 15 16 17 18 19 20 21 22 23 0 1 2 3 4 5 6
Hour of day
n System electricity generation (A+B) n A Generation from solar field n B Generation from thermal storage
n Fraction of thermal energy to storage n Fraction of maximum DNI
Source: Based on Protermosolar (2018). Note: DNI = Direct normal irradiation.
This combination of solar PV and CSP with thermal CSP helps systems adapt to changing electricity
energy storage also reduces the consumption of demand profiles
fossil fuels such as natural gas in peaking plants by In most parts of the world, electricity load profiles
providing a comparable, but renewable, dispatchable are changing, especially as demand for electricity
power source over the same hourly peaks. Thus, CSP continues to increase. This change is most prominent
can reduce the need for support from fossil-fuel in the evening hours, when peaks are becoming
generation and enable the further deployment of sharper. This means that as solar PV production
solar PV. starts to decline in the early evening, new capacity
FIGURE 1.7 Key characteristics of available energy storage technologies
Uninterruptible Power Supply & Power Quality Transmission & Distribution Grid Support and Load Shifting Bulk Power Management
Pumped Hydro
Molten Salt Thermal Energy
Storage
Hours
CAES
Flow Batteries
NaS Batteries
Discharge time at rated power
High Energy Supercapacitors Advanced Lead Acid Batteries
NaNiCl Battery
Minutes
Lithium Ion Batteries
Lead Acid Batteries
NiCd
NiMH
Seconds
High Powered Flywheels
High Power Supercapacitors SMES
1kW 10kW 100kW 1MW 10MW 100MW 1GW
Source: Adapted from DOE/EPRI (2013).
Note: CAES = compressed air energy storage; GW = gigawatt; kW = kilowatt; MW = megawatt; NaNiCl = sodium nickel chloride; NaS = sodium sulfur; NiMH =
nickel metal hydride; NiCd = nickel cadmium; SMES = superconducting magnetic energy storage.
16CONCENTRATING SOLAR POWER: CLEAN POWER ON DEMAND 24/7
FIGURE 1.8 A comparison of the levelized cost of electricity: CSP versus PV (both with nine hours of
storage), 2015–30
n CSP n PV+10-yr battery n PV+15-yr battery
$0.24
$0.22
$0.20
$0.18
$0.16
LCOE ($/kWh)
$0.14
$0.12
$0.10
$0.08
$0.06
$0.04
2015 2020 2025 2030 2015 2020 2025 2030
Experience curve Projections
Source: NREL and US DOE 2016.
Note: $/kWh = US dollars per kilowatt-hour; CSP = concentrating solar power; LCOE = levelized cost of electricity; PV = photovoltaic.
Whilst it is true that cost reduction for solar PV has been steeper than anticipated in this study, the broad conclusion, that CSP retains a cost advantage for
long duration storage, remains valid.
needs to be brought online to compensate for lower Thermal energy storage is best suited to storing
solar PV output. The well-known case of California energy in bulk, from tens to hundreds of megawatts,
is shown in figure 1.5: the projected midday load and for many hours, even days. Other technologies,
on the grid is falling over time, in part owing to such as the popular lithium-ion batteries, are best
the deployment of rooftop PV, while morning and deployed to store relatively less energy and for
evening peaks are rising. shorter periods of time.
Sharper morning and evening peaks leave Simulations of a 100 MW CSP plant with nine hours
progressively shorter ramping times for generation of thermal energy storage compared to a 100 MW
to meet demand. This strains the grid and can lead PV plant with a Li-ion battery energy storage system
to significant additional costs. In this situation, CSP (BESS) with equivalent storage capacity, show that at
with thermal storage is particularly valuable, as it this scale CSP is more cost competitive under most
can ramp quickly, shifting generation from the hours conditions and would remain so until 2030 (figure 1.8).
when the sun is shining to the hours when it is most
needed, covering early morning and evening peaks CSP can contribute to the integration of regional
in demand, and supporting higher shares of solar electricity markets
energy in the grid (figure 1.6). Integrating regional electricity markets offers
multiple benefits for grid operators and utilities.
1.2.1 CSP with thermal energy storage compared Coupling electricity markets provides efficiency gains
with batteries and other storage technologies to both consumers and suppliers, since it reduces
Thermal energy storage is not the only storage the need for additional generation capacity with low
technology available today (figure 1.7). All available utilization rates. CSP with thermal energy storage, as
options are expected to contribute in adding a source of flexibility, can reduce overall electricity
flexibility to the energy system and enabling a larger costs while allowing burden-sharing to manage
share of renewable energy into the grid at the lowest fluctuations in power output levels and demand
possible cost. spikes. This is especially useful for grids that are
17CONCENTRATING SOLAR POWER: CLEAN POWER ON DEMAND 24/7
BOX 1.1
Country plans to reduce greenhouse gas emissions
Under the United Nations Framework Convention on Climate Change (UNFCCC) to reduce greenhouse gas (GHG
emissions, signatory countries of the Paris Agreement agreed to publish their “intended nationally determined
contributions” in the leadup to the United Nations Climate Change Conference held in Paris, France, in December 2015.
According to Article 4 paragraph 2 of the agreement:
“Each Party shall prepare, communicate and maintain successive nationally determined contributions that it intends to
achieve. Parties shall pursue domestic mitigation measures, with the aim of achieving the objectives of such contributions.”
Major emitters include China, which targeted a 60–65 percent reduction in GHG emissions per unit of gross domestic
product by 2030; the United States, which targeted a 26–28 percent reduction by 2025; and the European Union, which
targeted a 40 percent reduction of 1990 levels by 2030. India committed to a target of 33–35 percent per unit of gross
domestic product as long as developed countries make financing available for this purpose.
seeing rising penetration rates of variable renewable share, followed by gas and, finally, oil. The extraction
energy generation. and combustion of fossil fuels release various types
of air pollutants, with local impacts such as damage
CSP’s grid services can make an important to the health of the population and to the flora and
contribution to the integration of regional electricity fauna. While the use of coal for electricity generation
markets. This has already been recognized in the MENA region is not as high as in the rest of
internationally, in the Roadmap for Sustainable the world, oil and gas usage is significant. Oil-fired
Electricity Trade that was signed by the governments electricity generation is especially damaging, as it
of France, Germany, Morocco, Portugal, and Spain releases significant air pollutants into the environment
during the 22nd Conference of Parties in Marrakesh, that could be reduced by using renewable energy
Morocco, convened in 2016. The roadmap aims technologies such as CSP instead.
to analyze the benefits of increased renewable
electricity exchanges resulting from electricity An increase in the use of CSP technologies can help
market integration; identify investments, processes, countries not only reduce local air pollution from the
and procedures to enable sustainable electricity use of fossil fuels, but also contribute toward realizing
trade between the five signatories; and formulate an their goals for reducing GHG emissions (box 1.1). The
implementation pathway. With high utilization rates recent pledges made by some MENA countries are
of capacity, and the technical possibility of shifting especially important because the region has some
output to meet changing load profiles and cut down of the highest per capita emissions rates in the world,
on curtailment, CSP offers significant opportunities and demand for electricity is growing fast. Prompt
for market integration. action is required to stop the exponential growth of
negative impacts. However, to reap the full benefits
CSP can offer similar benefits in the MENA region by of CSP in the region, efforts should focus on reducing
complementing grid supply in different interconnected costs and ensuring that grids are sufficiently modern
countries in the region and beyond. In the future, with to accommodate the full stack of grid services that
even greater interconnection, CSP from the MENA CSP can offer, including flexible power output, peak
region could provide electricity for Europe. shifting, and energy storage.
CSP supports the achievement of environmental CSP supports domestic industrial and
goals socioeconomic development
As a renewable energy technology, CSP can bring According to the latest statistics from the
multiple environmental benefits. Fossil fuels provided International Renewable Energy Agency (IRENA
around 73% of total global electricity generation in 2018b), around 34,000 people are employed in
2019 (REN21, 2020), with coal representing the largest the CSP sector globally. A study on jobs supported
18CONCENTRATING SOLAR POWER: CLEAN POWER ON DEMAND 24/7
FIGURE 1.9 La Africana parabolic trough plant in The arrival of a large electricity infrastructure project
Córdoba, Spain can bring significant benefits to local labor markets.
This is especially notable in the case of CSP. The
scale and complexity of a CSP project—along with
variables related to local economic development,
labor market conditions, governance structures,
and social norms—will influence how much local
labor can be employed, as well as any spillover
effects. Typically, short-term demand for local labor
for construction, management, and coordination
increases. Additionally, the ongoing operations and
maintenance activities of a CSP plant will support
local jobs and businesses directly and indirectly
over the life of the project.
Indirectly, increased demand for services associated
with a CSP project may generate jobs for new or
existing firms as well as self-employed individuals. In
cases where connectivity to communities outside the
Source: Cuadros Fernández 2018.
project-affected area expands, new job opportunities
by CSP projects during the construction phase, may benefit workers from either the project-affected
estimates that these projects create up to 18 job- area or those from other towns and areas, depending
years per MW installed (Meyer et al, 2014). on what specific skills are required.
19CONCENTRATING SOLAR POWER: CLEAN POWER ON DEMAND 24/7
2 GLOBAL MARKET AND OUTLOOK FOR CONCENTRATING SOLAR POWER
2.1 A brief history of CSP second generation of commercial CSP plants was
Although the first modern commercial CSP plants built, predominantly in the United States and Spain.
were built in the 1980s, CSP has a long history going In the United States, renewed interest was driven
back to the late 1800s, when it was used to power by a combination of the Investment Tax Credit (ITC),
the first solar steam engine. Given the excellent PURPA reforms, and Renewable Portfolio Standards
solar resources in the Middle East and North Africa (RPS). In Spain, a generous government-backed
(MENA) region, it is not surprising to learn that the feed-in tariff encouraged developers to start CSP
first parabolic trough systems were installed there projects, eventually making Spain the global leader
in 1912, near Cairo, Egypt. The system was designed in deployed CSP capacity. New CSP deployments
to generate steam for a pump, delivering 2,000 cubic stalled, however, when Spain scaled back and
meters per hour (m3/h) of water for irrigation. Notably, amended the tariff.
even in 1912 CSP plant technology was regionally
competitive with coal-fired installations for generating 2.2 Status of markets
steam (Müller-Steinhagen and Trieb 2004). There are around 6 gigawatts (GW) of operating CSP
plants worldwide, which are concentrated in Spain
Despite its origins in the MENA region, present- (2.3 GW), the United States (1.6 GW), Morocco (0.53
day CSP technology can be traced to research GW), China (0.5 GW), and South Africa (0.5 GW). The
in the United States conducted under the Nixon following subsections provide an overview of the
administration. When the United States became a markets where CSP projects are being planned or built.
net energy importer in 1971, President Richard M.
Nixon established 16 research panels to examine CSP in Middle Eastern and North African countries
the potential for new energy technologies to In the MENA region, countries such as Morocco and
return the United States to a situation of energy the United Arab Emirates have embraced large-scale
surplus. In 1972 the Federal Council for Science and CSP, and many others are actively considering adding
Technology concluded that solar thermal energy CSP with thermal energy storage to their grids.
generation technologies could provide 20 percent
of the country’s energy needs by 2020. Given the Public-private partnerships (PPPs) have been the
prohibitively high costs of solar photovoltaic (PV) model of choice for MENA, where many governments
technology at the time, it was assumed that all solar have shown that they consider CSP with thermal
energy would be thermal. energy storage as an integral part of their long-term
generation capacity. PPPs combine the efficiencies
The US federal research budget for CSP tripled after of the private sector with the lower capital costs
the 1973 oil crisis. It was this research—combined of the public sector, making the economics of
with reforms connected with the Public Utility CSP plants more attractive. In this region, support
Regulatory Policies Act (PURPA) and a series of from multilateral institutions has been key in the
incentives offered by policy makers in the state of development of new plant capacity.
California—that led to the construction of the first
commercial CSP plant. But as oil prices declined With many suitable sites with direct normal
in the 1980s and Reagan-era budget cuts reduced irradiation (DNI) values between 2,000 and 3,000
CSP research and development (R&D), the sector kilowatt-hours per square meter (kWh/m2) a year, the
stagnated until the early 2000s. At this time, a MENA region has one of the highest levels of DNI in
20CONCENTRATING SOLAR POWER: CLEAN POWER ON DEMAND 24/7
the world. Northwestern Saudi Arabia and the Sahara in solar resources and CSP can make a country’s
report the highest DNI levels within the region. energy supply more secure and play a crucial role
in integrating variable renewable technologies—
The region could benefit in various ways from such as solar PV and wind—into national or even
further CSP deployments. The MENA region is regional power grids.
marked by stark differences in fossil fuel resources
Only a few of the region’s countries have the Table 2.1 provides an overview of the CSP plants
fossil-fuel resources needed to meet demand operating in the MENA region, which have a total
for more energy, with most relying on imports. installed capacity of 770 megawatts (MW). Most
However, the region is, almost universally, rich plants involve parabolic trough technology; since
TABLE 2.1 CSP plants operating in MENA
Title Country Developers Engineering, Gross Technology Storage Year Tariff type Rate
procurement, capacity hours operations
and (MW) started
construction
Hassi-R’mel Algeria Abener Abener 20 (155 CC) Parabolic 0 2011 PPA N/A
ISCC trough
Kuraymat Egypt New and Orascom 20 (140 CC) Parabolic 0 2011 N/A N/A
ISCC Renewable trough
Energy
Authority
Ain-Beni- Morocco Airlight Abener 20 (470 CC) Parabolic 0 2011 PPA (25 N/A
Mathar ISCC Energy trough years)
Noor I Morocco ACWA Power Acciona Sener 160 Parabolic 3 December PPA (25 $0.19/kWh
Aries TSK trough 2015 years)
TSK Tariff date:
November
19, 2012
Noor II Morocco ACWA Power Sener– 200 Parabolic 7 2018 PPA (25 $0.15/kWh
SEPCOIII trough years)
Noor III Morocco ACWA Power Sener–SEPCO 150 Tower 8 2019 PPA $0.16/kWh
III
Waad Al Saudi Arabia Saudi General 50 Parabolic 0 2019 N/A N/A
Shamal Electricity Electric (1,390 CC) trough
Power Plant Company
ISCC
Shagaya Kuwait Kuwait TSK 50 Parabolic 9 2019 N/A $0.16/kWh
Institute for trough
Scientific
Research
(KISR)
Shams 1 United Arab Masdar Abener 100 Parabolic 0 2013 PPA N/A
Emirates Total Teyma trough
Abengoa
Solar
Source: NREL Solar PACES, 2019.
Note: CC = combined cycle; CSP = concentrating solar power; ISCC = integrated solar combined cycle; MENA = Middle East and North Africa; MW = megawatt;
N/A = not applicable; PPA = power purchase agreement; $/kWh = US dollars per kilowatt-hour.
TABLE 2.2 Pipeline of CSP projects in MENA
Title Country Developers Engineering, Gross capacity Technology Storage hours Year of Tariff type
procurement, (MW) planned
and operational
construction start
DEWA CSP United Arab ACWA Power Shanghai 600 Parabolic 12.5 2021 PPA (35 years)
Trough Project Emirates Electric trough
DEWA CSP United Arab ACWA Power Shanghai 100 Tower 15 2021 PPA (35 years)
Tower Project Emirates Electric
Duba 1 ISCC Saudi Arabia Saudi Initec Energia 43 (605) Parabolic 0 N/A N/A
Electricity trough
Company
Midelt Morocco EDF Not disclosed 200 (800) * Not disclosed Not disclosed Not disclosed PPA
(PV+CSP) Renewables
Source: NREL SolarPACES 2019.
Note: CSP = concentrating solar power; ISCC = integrated solar combined cycle; MENA = Middle East and North Africa; MW = megawatt; N/A = not applicable;
PPA = power purchase agreement; PV = photovoltaic; $/kWh = US dollars per kilowatt-hour.
* The exact share of CSP and PV in the Midelt project is still undisclosed
21CONCENTRATING SOLAR POWER: CLEAN POWER ON DEMAND 24/7
2011, the main business model for installed capacity from renewable sources, with an additional capacity
has been power purchase agreements (PPAs). Table of 6 GW (MASEN 2020).
2.2 provides the list of plants in the pipeline for the
region, with total capacity of around 550 MW. Morocco is home to the largest operating CSP
complex in the world: Noor Ouarzazate, which
In the MENA region, two countries stand out for comprises 510 MW of CSP and a 72 MW PV plant.
being home to large-scale CSP projects, Morocco and Subsequently, the Noor Midelt 1 project (800 MW,
the United Arab Emirates. CSP-PV hybrid) was awarded, and will be the first
project in which output from both PV and CSP will
Morocco be stored as heat in molten salt tanks (Kramer 2020).
Morocco has been one of the most active CSP The Midelt solar complex will have further phases, so
markets in the last five years and is, arguably, the it is possible that there will be additional CSP plants
North African country that has pursued its renewable in Morocco.
energy targets with the most energy and success.
Morocco is on track to meet its target of producing United Arab Emirates
42 percent of electricity from renewables by 2020 The United Arab Emirates has set itself a target to
and is continuing to develop capacity to meet its deploy 2.7 GW of clean energy by 2021 as part of
2030 targets of producing 52 percent of its electricity its commitment to global efforts to combat climate
BOX 2.1
The DEWA IV 950 MW CSP/PV solar hybrid project
The Dubai Electricity and Water Authority (DEWA) IV Official name Noor Energy 1—DEWA 700 MW CSP and 250
MW PV Hybrid IPP Phase IV
950 megawatt (MW) hybrid project consists of 700
MW of concentrating solar power (CSP) and 250 MW of Location Mohammed Bin Rashid Al Maktoum Solar
photovoltaic (PV). The CSP component comprises four Park, Dubai
plants: a 100 MW tower plant with 15 hours of thermal Total capacity 950 megawatts electric (MWe)
energy storage and three 200 MW parabolic trough Breakdown Parabolic trough 3 x 200 MW; 12.5 hours
plants with 12.5 hours of thermal energy storage each. thermal energy storage
Tower 1 x 100 MW; 15 hours thermal energy
This project holds the record for the lowest-priced CSP storage
PV 1 x 250 MWac
plant at $0.073 per kilowatt-hour (kWh) under a 35-year
power purchase agreement (PPA), showing how far CSP Cooling type Air-cooled condensers
costs have come down. In contrast, the 50 MW Bokpoort Plant commercial December 22, 2022
project came online in South Africa in 2016 at $0.21/kWh. operations date (COD)
Even though these projects are very different, and despite PPA duration 35 years from plant COD
the United Arab Emirates’ excellent financing conditions, PPA ($/kWh) $0.073
the cost difference reflects many trends seen in the CSP
Total investment costs $4.3 billion
industry at large. First, it shows that developers have
applied the knowledge garnered in the development Lenders Agricultural Bank of China
and construction of previous projects. Second, it Bank of China
China Everbright Bank
demonstrates that larger projects bring economies of China Minsheng Banking Corporation
scale into play. Third, it highlights the importance of Commercial Bank International
Commercial Bank of Dubai
long-duration thermal energy storage, hybridization, and Industrial and Commercial Bank of China
longer PPAs in reducing costs per kilowatt-hour. Natixis Bank
Standard Chartered Bank
This project is designed to provide clean energy 24/7. The Union National Bank
250 MW PV plant caters to demand during the daylight Ownership DEWA (51%); ACWA Power (24.99%); Silk Road
hours whereas the CSP with thermal energy storage Fund (24.01%)
plants serve demand during the evening and night. This Scope Develop, build, own, operate (BOO)
suits the United Arab Emirates’ load profile, which has a Developer ACWA
pronounced evening peak.
EPC contractor Shanghai Electric
The DEWA IV 950 CSP/PV hybrid is the largest renewable O&M contractor Nomac
energy project in terms of investment, at $4.3 billion, and will
Off-taker Dubai Electricity and Water Authority (DEWA)
be the largest CSP complex in the world in terms of capacity.
Source: DEWA 2017.
22You can also read