Solar Energy Mapping the road ahead - October 2019 - NET
←
→
Page content transcription
If your browser does not render page correctly, please read the page content below
Solar Energy
Mapping the road ahead

October 2019

Solar Energy: Mapping the Road Ahead                                                                  Abstract

Abstract

           Solar Energy: Mapping the Road Ahead is a collaborative effort of the International Energy Agency
           (IEA) and the International Solar Alliance (ISA) to provide government, industry and civil society
           stakeholders with the methodology and tools to plan and implement national and regional solar
           energy roadmaps. Despite plummeting costs, solar energy expansion still depends largely on
           policy makers setting ambitious targets and implementing sound policies, market designs and
           regulatory frameworks, including for technological research, development and deployment. This
           guide for policy makers addresses all solar technologies – solar photovoltaic (PV) electricity,
           concentrating solar power (CSP, or solar thermal electricity [STE]), and solar heating and cooling
           (SHC). As well, it looks at applications such as utility-scale PV and CSP power generation; on- and
           off-grid distributed electricity generation; solar thermal water/space heating and cooling; solar
           heat for industry; solar cooking; and solar fuels.

           Sound knowledge of solar energy resources, its constituents (direct and diffuse radiation) and
           variations across time scales is a prerequisite. Solar resources must be analysed together with
           energy demand, its elements (electricity, heat, transport, fuel) and its variations from one time
           period to another. Importantly, this guide also addresses resource variability and key energy
           access concerns.

           Designed for decision makers in developing and emerging as well as developed economies, this
           guide does not cover every aspect of solar energy technology, policy and deployment. Rather, it
           aims to provide a comprehensive list of steps and issues for each phase of solar energy
           roadmapping and deployment. Selected case studies encapsulate the wide array of existing
           applications, and discussions of deployment drivers and barriers are accompanied by realistic
           recommendations for actions, tools, and useful information.

                                                    PAGE | 1
Solar Energy: Mapping the Road Ahead                                                         Acknowledgments

Acknowledgements

           This publication was prepared by the International Energy Agency in co-operation with the
           International Solar Alliance. Cédric Philibert of the Renewable Energy Division of the IEA oversaw
           the project and is the principal author. Karolina Daszkiewicz, Simone Landolina and Tobias Rinke,
           of the IEA, and Mohua Mukherjee, of the ISA, provided key contributions. Paolo Frankl, Head of
           the Renewable Energy Division, provided strategic guidance. Keisuke Sadamori, Director of
           Energy Markets and Security reviewed the document and provided expert advice.

           Manuel Collares Pereira (Evora University), Luis Crespo (Protermosolar), Edwin Haesen (IEA),
           Philippe Malbranche (Institut National de l’Energie Solaire), Daniel Mugnier (SHC TCP) and
           Stefan Nowak (PVPS TCP) provided invaluable insights. Renate Egan (Autralian Photovoltaic
           Institute), Sarah Grettve (Swedish Energy Agency), , Moira Torres Aguilar, Julien Mas and Cécile
           Martin-Phipps (ISA), Christoph Richter (SolarPaces TCP), and Mamoru Terakado (NEDO)
           provided useful comments.

           The Communications and Digital Office of the IEA has provided strong support for the publication
           and distribution of this report, with special thanks to the Acting Director, Jad Mouawad, and to
           Astrid Dumond, Clara Vallois and Therese Walsh for production and editorial co-ordination.
           Thanks to Kristine Douaud for editing the report.

           This work was made possible by financial support from the French government through ADEME,
           and from the German government.

                                                   PAGE | 2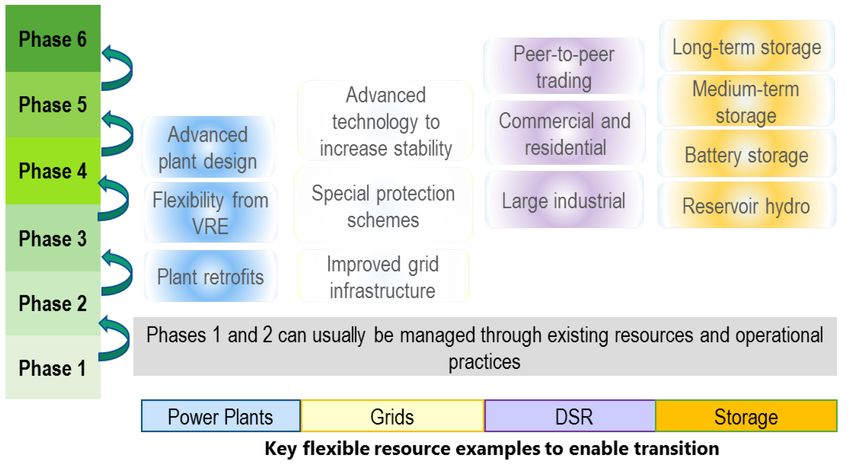
Solar Energy: Mapping the Road Ahead                                                                     Foreword

Foreword

           The potential of solar energy is huge, with enough sunlight striking the earth every two hours to
           provide the entire planet's energy needs for a whole year. Combined with rapid technological
           progress and cost declines, solar energy holds the promise to be a very large contributor of clean
           and affordable energy, in particular for the 7 billion people expected to live in our planet’s sunbelt
           by mid-century.

           Technology costs have massively diminished in the past decade, especially for photovoltaic
           energy. Solar PV is the fastest growing power source around the world, and this will continue. But
           progress is uneven across countries and related technologies such as solar thermal and
           concentrating solar are lagging behind. Stronger policies are needed to put solar energy in line
           with the world’s ambitions to achieve energy access for all, tackle climate change and reduce air
           pollution.

           The International Energy Agency (IEA) and the International Solar Alliance (ISA) are working
           together to accelerate solar deployment in many different areas, thanks to our complementary
           resources and work programmes. In some countries, policy makers are mainly concerned with
           smoothly integrating solar into energy systems, including for buildings, industry, and mobility.
           This is an area where the IEA has considerable experience and is playing a leading role. Other
           countries are still at an earlier stage and show considerable interest in the ISA programme of work
           regarding, for example, scaling solar applications for agriculture, solar mini-grids and rooftop
           solar. For all, affordable finance at scale will prove decisive.

           This Guide for Policymakers was produced jointly by the IEA and the ISA. Its aim is to inform policy
           makers, industry, and civil society on how to develop national and regional roadmaps for
           deploying solar energy at all scales, using all technologies, responding to all sorts of energy needs
           and taking into account local specific contexts. We trust it provides the necessary information
           and methodological tools to make solar road mapping a success. We believe it will help all
           countries reap the magnitude of benefits that would come with an accelerated deployment of
           solar energy: improved access to energy, increased energy security and affordability, more
           inclusive and sustainable economic growth, cleaner air in cities and homes, and an invaluable
           contribution to mitigating climate change.

           Dr Fatih Birol, Executive Director                             Upendra Tripathy, General Director

           International Energy Agency                                    International Solar Alliance

                                                     PAGE | 3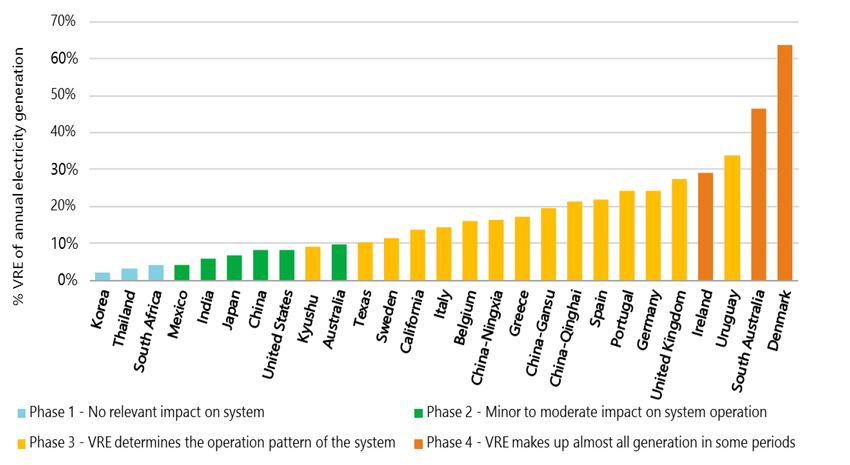
Solar Energy: Mapping the Road Ahead                                                                   Highlights

Highlights

              Sound knowledge of solar energy resources, its constituents (direct and diffuse radiation)
              and variations across time scales is a prerequisite. Solar resources must be analysed
              together with energy demand, its elements (electricity, heat, transport, fuel) and its
              variations from one time period to another.

              Solar technologies use the radiative energy of sunshine in a wide spectrum of applications
              to provide electricity, heat and cold, and even fuel. Rather than assessing them separately,
              photovoltaic (PV) energy, concentrating solar power (CSP) and solar thermal heating and
              cooling (SHC) should be considered as complementary technologies.

              PV technology is unique in its extreme scalability, ranging from watt-scale individual
              systems to kilowatt- and megawatt-scale distributed domestic and industrial power
              systems and to power plants of hundreds of megawatts. It can thus provide off-grid
              electricity access as well as power micro- and mini-grids, strengthen grids at their fringes,
              and deliver significant power to fully developed existing networks.

              PV and CSP are the two main technologies for generating electricity from sunshine. While
              PV is less expensive, CSP with built-in thermal storage can improve power system
              flexibility and stability, increase the solar share and integrate more variable renewable
              energy. Solar power can also be used to produce and export hydrogen-rich chemicals and
              fuels.

              The portfolio of SHC options is even larger, with solar thermal systems offering highly
              efficient solutions at various temperatures and for different applications (domestic hot
              water, space heating, district heating, process heat and even thermally driven cooling) in
              addition to solar electricity-driven heating and cooling devices. While solar thermal energy
              is currently used primarily for domestic water heating, it has considerable potential to
              generate process heat in the future.

              Elaborating and implementing roadmaps would help ensure successive deployment. The
              process is as important as the content of the documents, and it should associate all
              stakeholders, and ensure the collaboration of many ministerial departments at the higher
              possible level.

                                                     PAGE | 4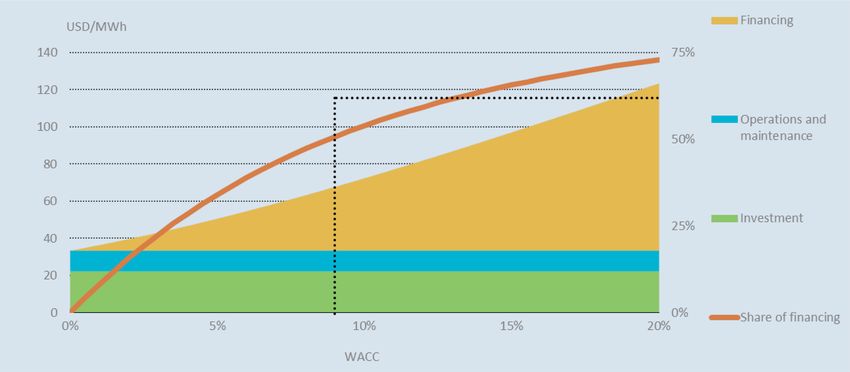
Solar Energy: Mapping the Road Ahead                                                                                                               Table of contents

Table of contents

Executive summary..................................................................................................................................... 7
   Removing barriers to investment ......................................................................................................................... 7
   A guide for policy makers .................................................................................................................................... 8
Findings and recommendations .................................................................................................................. 9
   Policy recommendations ..................................................................................................................................... 9
   Three families of technologies ............................................................................................................................. 9
   Market and policy trends ................................................................................................................................... 13
   Enabling technologies and system integration ................................................................................................... 15
   Designing and implementing roadmaps............................................................................................................. 17
   Useful online resources ...................................................................................................................................... 20
Introduction ............................................................................................................................................. 21
    About technology roadmaps ............................................................................................................................. 21
    About this guide ................................................................................................................................................ 21
    Guide structure and roadmapping process ......................................................................................................... 22
    About solar energy technologies........................................................................................................................ 23
    Enabling technologies and system integration ................................................................................................... 32
    Market overview and trends .............................................................................................................................. 36
References ............................................................................................................................................... 43
Phase 1: Planning and preparation ............................................................................................................. 45
   Conducting baseline research ............................................................................................................................ 46
   Technology situation analysis ............................................................................................................................ 47
   Identifying solar stakeholders ............................................................................................................................ 49
Phase 2: Visioning ..................................................................................................................................... 51
   Drivers of solar energy expansion ...................................................................................................................... 52
   Deployment targets .......................................................................................................................................... 54
Phase 3: Roadmap development ................................................................................................................ 55
   Solar technology, project delivery and workforce barriers .................................................................................. 56
   Barriers to integrating solar projects into the energy system .............................................................................. 57
   Considerations for the enabling framework ....................................................................................................... 59
   Research, development and demonstration support .......................................................................................... 63
Phase 4: Implementation, monitoring and revision ...................................................................................... 64
   Setting the timeline and milestones................................................................................................................... 64
   Monitoring roadmap implementation ................................................................................................................ 64
   International collaboration ................................................................................................................................ 66
References ............................................................................................................................................... 70
Annex A. Overview of policy instruments to promote solar uptake ............................................................... 71
   Power sector ..................................................................................................................................................... 71
   Price-finding mechanisms ................................................................................................................................. 72
References ............................................................................................................................................... 76
Annex B. Acronyms and abbreviations ....................................................................................................... 77
   Acronyms and abbreviations ..............................................................................................................................77
   Units of measure ............................................................................................................................................... 78

List of figures
Figure 1.            Energy supplies from the three solar technology families (top) and global solar PV annual additions by
                     segment, 2013-24 (bottom) ............................................................................................................... 10
Figure 2.            Average auction price by project commissioning date ......................................................................... 11
Figure 3.            Conceptual daily energy mix with PV and CSP, medium term (left) and long term (right) .................... 12
Figure 4.            VRE shares in total electricity generation by selected region, 2018 ...................................................... 16

                                                                               PAGE | 5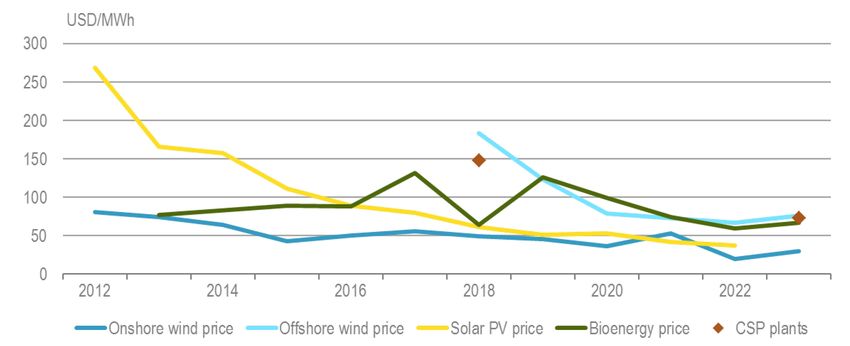
Solar Energy: Mapping the Road Ahead                                                                                                               Table of contents

Figure 5.      The six phases of VRE integration and the four pillars of flexibility ...................................................... 17
Figure 6.      The roadmap development process .................................................................................................... 18
Figure 7.      PV and CSP generation in the Sustainable Development Scenario ...................................................... 19
Figure 8.      The roadmap development process ....................................................................................................22
Figure 9.      Global horizontal irradiation ...............................................................................................................24
Figure 10.     Photovoltaic electricity output............................................................................................................ 25
Figure 11.     Individual solar thermosiphon system (left) and pumped circulation system (right) ............................. 27
Figure 12.     Direct normal irradiance ..................................................................................................................... 30
Figure 13.     Main CSP technologies ....................................................................................................................... 31
Figure 14.     Conceptual daily energy mix with PV and CSP, medium term (left) and long term (right) .................... 32
Figure 15.     VRE shares in total electricity generation by region, 2018 ................................................................... 32
Figure 16.     The six phases of VRE integration and the four pillars of flexibility ...................................................... 33
Figure 17.     California’s ‘duck curve’ as PV electricity shares expand ...................................................................... 34
Figure 18.     Global solar PV annual additions by segment, 2013-24 ........................................................................ 36
Figure 19.     Installed PV capacity in sub-Saharan Africa, 2014-23........................................................................... 38
Figure 20.     Gross solar thermal capacity additions, 2008-17 (left), and estimated consumption growth 2018-23
                (right) ................................................................................................................................................ 39
Figure 21.     Forecast of CSP capacity by region (left), and of generation by technology (right)............................... 40
Figure 22.     Remuneration-setting for utility-scale renewable projects ..................................................................42
Figure 23.     Planning and preparation phase ......................................................................................................... 45
Figure 24.     Visioning phase .................................................................................................................................. 51
Figure 25.     PV and CSP generation in the Sustainable Development Scenario ...................................................... 54
Figure 26.     Roadmap development ...................................................................................................................... 55
Figure 27.     Implementation, monitoring and revision phase .................................................................................64
Figure 28.     Classification of power sector policies ................................................................................................. 72

List of boxes
Box 1.         Solar potential and resources.............................................................................................................. 12
Box 2.         Off-grid solar ...................................................................................................................................... 14
Box 3.         The importance of the cost of capital for solar projects ....................................................................... 15
Box 4.         Solar Cooling ......................................................................................................................................28
Box 5.         The importance of the cost of capital for solar projects ....................................................................... 35
Box 6.         Floating solar PV ................................................................................................................................ 36
Box 7.         Off-grid solar appliances ..................................................................................................................... 39
Box 8.         Thought for food: Solar cooling and cooking, a Nigerian example .......................................................42
Box 9.         Dispersion facilitates variable solar integration ................................................................................... 50
Box 10.        Leveraging local capacity for solar energy........................................................................................... 53
Box 11.        When the power sector is not credit-worthy: India’s UDAY scheme ..................................................... 58

List of tables
Table 1.       Key questions for baseline research ....................................................................................................46
Table 2.       Key questions for solar technology situation assessment .................................................................... 47
Table 3.       Potential stakeholders in solar technology roadmap development......................................................49
Table 4.       Typical drivers of solar technology deployment .................................................................................. 52
Table 5.       Overview of solar technology, project delivery and workforce barriers ................................................ 56
Table 6.       Overview of energy infrastructure barriers and action options ............................................................ 59
Table 7.       Overview of policy, regulatory and market framework barriers and action options ..............................60
Table 8.       Overview of non-economic barriers .................................................................................................... 61
Table 9.       Overview of financing barriers and action options for solar energy projects.........................................62
Table 10.      Quantitative and qualitative indicators for monitoring progress .......................................................... 65

                                                                            PAGE | 6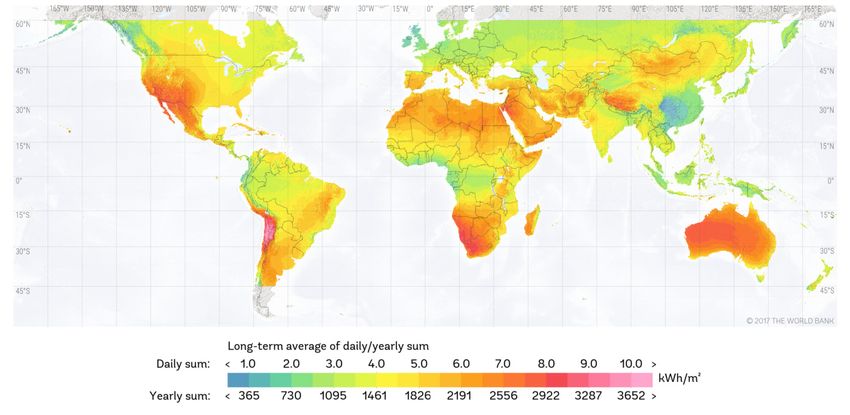
Solar Energy: Mapping the Road Ahead                                                        Executive summary

Executive summary

           The International Energy Agency and the International Solar Alliance have joined forces to
           produce this guide providing policy makers, industry, civil society and other stakeholders with
           the technological information and methodological tools to map a course towards robust,
           accelerated solar energy deployment. Despite plummeting costs, solar energy expansion still
           depends largely on policy makers setting ambitious targets and implementing sound policies,
           market designs and regulatory frameworks, including for technological research, development
           and deployment. This guide aims to provide a comprehensive list of steps and concerns for each
           phase of solar energy roadmap design and implementation; an overview of deployment drivers
           and barriers; realistic recommendations for actions and tools; and useful information sources.

           The IEA approach to roadmap development involves two streams of activities (analysis and
           consensus-building) in four phases (planning and preparation; visioning; roadmap development
           and implementation; and monitoring and revision).

           Unprecedented deployment and cost reductions have taken place in the past ten years:
           photovoltaics (PV), initially one of the most expensive electricity-generating technologies, has
           become one of the most affordable. Dispatchable power from hybrid PV-concentrating solar
           power (CSP) plants was highly competitive in the most recent auctions, and solar thermal
           technologies are penetrating new markets for industrial processes and district heating networks.

           Progress across countries and technologies is uneven, however, and despite plummeting costs
           and 20 years of uninterrupted global growth, the amount of new solar technology additions in
           2018 was similar to the previous year (PV additions remained below 100 gigawatts [GW]). Even
           worse, the solar heat market has been shrinking continuously since 2013 and is not being
           counterbalanced by the ongoing renaissance of the much smaller CSP market.

           This paradox reveals that numerous barriers – fossil fuel subsidies, administrative obstacles,
           economic difficulties for grid operators and absent or weak support policies and targets – still
           impede widespread solar energy deployment. Predictable polices based on clear, long-term
           targets remain essential to cost-effectively unlock the immense potential of solar energy.

           Policy makers in most jurisdictions must therefore set targets consistent with their needs and
           circumstances, framing policies accordingly and designing regulatory and market frameworks
           conducive to investment. Together with the energy ministry, the implication at the highest
           possible level of many other ministerial departments is important to set objectives in their
           respective sectors, to remove barriers to investment and achieve successful deployment.

Removing barriers to investment
           Investment barriers are not the same for all technologies. Although PV efficiency is continuing to
           improve rapidly, its costs are falling quickly and it is a mature technology, upfront investment
           costs remain high for many potential solar customers. Money for safe, long-term investments is
           available, but market and policy risks for solar technologies need to be minimised.

           For utility-scale projects, distribution companies’ finances are often an issue in developing
           economies, so decisive policies must be enacted (as in India). Grid integration issues are often

                                                   PAGE | 7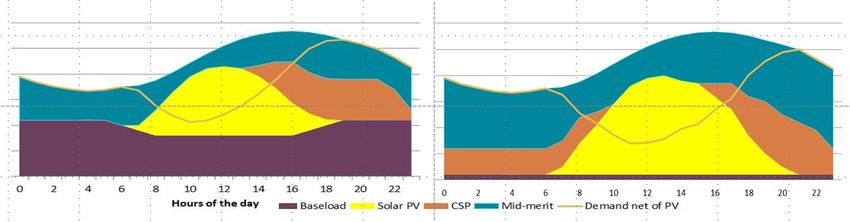
Solar Energy: Mapping the Road Ahead                                                            Executive summary

           feared unnecessarily, so it would help if the experiences of countries that already use significant
           shares of variable renewables were more widely shared – although it is important to highlight
           contextual differences. In hot, humid countries, combining solar energy with hydropower can
           often be a straightforward means of supplying power on demand.

           New business models support expanded on- and off-grid PV self-consumption at various scales,
           for agricultural, extraction, industrial and service sector production to home systems and small
           appliances. The extreme scalability of solar PV makes it a great asset for achieving universal
           energy access. Clean cooking, already being experimented with in India, may be the next step.

           CSP combines well-proven technologies (commercialised in the 1980s) with more recent
           concepts. In hot, dry countries, its use is likely to increase as PV electricity saturates daytime
           demand, initially to respond to demand peaks after sunset (as in Morocco) and then to deliver
           power around the clock (as in the United Arab Emirates). Lead times for development are long
           and capital needs are high, and only resolute policies will overcome these obstacles. The
           involvement of bilateral and multilateral development banks is often necessary.

           Solar heating and cooling (SHC) technology success has been mixed. Space heating applications
           are becoming more common for large-scale district heating systems and are increasingly being
           integrated into building designs. Industrial heat applications are also expanding, though from a
           small base. Although solar thermal cooling technology benefits from a good match between
           demand and resource availability, it is in direct competition with PV systems. Meanwhile, the
           market for the most mature technology – domestic water heating – is shrinking. Temperate
           countries should review and strengthen their renewable heat policies (especially for solar heat),
           as they often lag behind those for electricity.

A guide for policy makers
           The process of devising a roadmap is as important as the roadmap itself for ensuring the success
           of solar energy technologies. The first phase of roadmapping – identifying all stakeholders and
           engaging in extensive dialogue – is decisive. It leads to the second phase, the building of a
           common vision.

           Elaborating a vision requires that the energy needs of the economy and the population be
           analysed in their complexity of forms (e.g. electricity vs. heat) and variability, together with solar
           resources (including temporal and locational variations) and other available energy resources.

           Then, the most relevant technology options to harness solar energy for either electricity (PV and
           CSP) or heat (SHC, or even solar fuels, can be identified. It is crucial to take a holistic approach,
           and clear, long-term targets must be set. The next step in the process is to identify barriers and
           ways to overcome them, and to assign responsibilities.

           Monitoring implementation is the fourth phase. It may require policy-strengthening, but targets
           may also be updated and upgraded as problems are solved and costs continue to fall.

                                                     PAGE | 8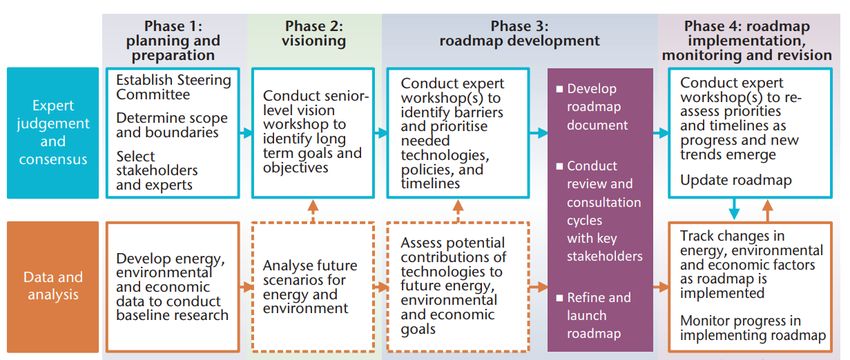
Solar Energy: Mapping the Road Ahead                                               Findings and recommendations

Findings and recommendations

  Policy recommendations
              Governments should develop solar power roadmaps based on analyses of both their
              energy needs and the heat and electricity opportunities offered by various technologies.

              The process of developing and implementing a roadmap is as important as the document
              itself, and it should associate a wide array of stakeholders and interests. Roadmaps should
              present a vision, delineate targets and define actions to overcome deployment barriers.

              Reducing investment risks appears to be crucial for solar technology deployment now that
              falling costs offer numerous opportunities for profit. Policy makers and regulators are
              responsible for defining and implementing regulatory frameworks as well as market
              designs conducive to investment (and for rapidly connecting solar technologies to the grid
              when appropriate).

              Although financial support for solar technologies may still be needed to jumpstart
              deployment in new markets, excessive profitability is not a remedy for non-economic
              barriers, so total support costs should be carefully monitored. At least for large-scale
              plants, incentives should be rapidly steered towards competitive auctions for long-term
              power purchase agreements, possibly with some forms of energy management options
              (curtailment, storage, etc.) and time-based pricing facilitating system integration.

              Solar roadmaps should not be undertaken by the energy administration alone. Virtually all
              other ministerial departments can be interested (if only as energy customers in their day-
              to-day work) and many would need to be involved as well.

              Policy makers are not alone, and can request help from an array of international
              organisations. The International Solar Alliance, as well as multilateral and bilateral
              development banks and agencies, offers help and a variety of tools, including financing.

Three families of technologies
           Three main technology types are used to harness energy from the sun: photovoltaic (PV), which
           directly converts light into electricity; solar thermal, or solar heating and cooling [SHC], which
           uses using solar radiation to deliver heat; and concentrating solar power (CSP), which converts
           concentrated light into heat to drive a heat engine connected to a generator. PV energy, for
           which cost reductions in the last ten years have been impressive, currently constitutes the most
           dynamic global market, but the significant possibilities offered by the other technology families
           must also be considered when laying out a pathway for full-scale solar energy use.

           PV cells and modules directly convert solar energy into electricity, using both direct and diffuse
           radiation. PV technology can be used on the grid or in off-grid applications at capacities ranging

                                                    PAGE | 9
Solar Energy: Mapping the Road Ahead Findings and recommendations
from less than 1 watt (W) to gigawatts (GW). On-grid residential systems, often rooftop
installations, typically reach the kilowatt (kW) scale; commercial systems, often installed on
flat roofs or over parking lots, are in the order of megawatts (MW); and ground-based plants
for utilities range from tens to hundreds of megawatts. Grid-connected systems require
inverters to transform direct current (DC) power into alternating current (AC). Installations can
be fixed or track the sun, usually on one axis only. Off-grid applications range from several
watts for initial energy services to mini-grid applications with battery backup, or hybrid designs
that complement diesel generators. Although PV was an expensive electricity-generating
technology only ten years ago, it is rapidly becoming one of the most affordable. It has
overtaken SHC energy supply by 2018 (Figure 1). In the next five years, annual capacity
additions will grow from 115 GW to about 130 GW. The total cumulative capacity will reach
1 TW by 2023 at the latest, and 1195 to 1375 GW by end 2024 depending on the case.
Figure 1. Energy supplies from the three solar technology families (top) and global solar PV
annual additions by segment, 2013-24 (bottom)
700
TWh
600
500
400
300
200
100
0
SHC PV CSP SHC PV CSP SHC PV CSP
2000 2010 2018
180
Accelerated
GW
160
140
Off-grid PV
120
100
PV Residential
80
60
PV
40 Commercial
20
PV Utility
0
2013 2014 2015 2016 2017 2018 2019 2020 2021 2022 2023 2024
IEA 2019. All rights reserved.
Note: TWh = terawatt hour.
In just ten years, PV has overtaken SHC as the lead solar supplier of energy.
PAGE | 10Solar Energy: Mapping the Road Ahead Findings and recommendations
PV modules usually face the equator, with the tilt determined primarily by latitude, but it can
also be adjusted to adapt to the ratio of diffuse vs. direct irradiance, or for economic reasons.
The tilt tends to equalise electrical outputs despite differing solar resource abundance among
regions. A growing proportion of utility-scale plants are also using one-axis trackers to further
augment output. The introduction of bifacial technologies may offer additional flexibilities in
the overall system design.
Solar light can be captured and transformed by a variety of solar thermal technologies and
utilised as heat in numerous applications, from domestic hot water to space heating at the
individual and collective (district heating) level, as well as for agriculture and industry. Solar air
conditioning and industrial cooling can be provided by solar thermal technologies or by PV-run
devices. Technologies to store cold can improve the already good match between sunshine and
cooling needs, whereas concentration technologies can provide high-grade heat or steam for
industrial processes and offer more cost-effective heat storage options. Several large-scale
solar concentrating steam plants are under construction in the Middle East and the United
States to replace gas-fired ones for enhanced oil recovery operations.
Figure 2. Average auction price by project commissioning date
Note: MWh = megawatt hour.
Source: Adapted from IEA (2018b), Renewables 2018.
PV electricity cost reductions have been rapid and sharp in a strongly competitive environment.
CSP technology concentrates solar rays to heat a fluid that then directly or indirectly runs a turbine
and an electricity generator. The predominant CSP technologies are parabolic troughs (PTs) and
solar towers. Unlike PV systems, CSP plants use only direct irradiation and therefore need a daily
minimum of sunshine to produce electricity. This limits their use to hot, dry areas with clear skies
and reduced dust.
PAGE | 11Solar Energy: Mapping the Road Ahead Findings and recommendations
Solar thermal electricity costs more than PV electricity, but it also offers more: CSP plants can
integrate thermal storage to deliver electricity on demand, and they contribute to power
system stability and flexibility by making it possible to integrate more solar PV and wind power.
Different combinations of solar field size, storage tank size and electricity capacities provide
great flexibility in CSP plant design. Solar thermal electricity is currently most valuable when
generation is shifted to after sunset to complement PV electricity; in the not-too-distant
future, all-night generation will be required to further increase the solar share in total electricity
generation and reduce the use of fossil fuels (Figure 3).
Figure 3. Conceptual daily energy mix with PV and CSP, medium term (left) and long term (right)
IEA 2019. All rights reserved.
The amount of CSP in the electricity mix will increase as PV saturates daytime production and power
systems approach full decarbonisation.
Box 1. Solar potential and resources
Solar irradiation consists of direct and diffuse radiation. Direct (or beam) radiation experienced as
‘sunshine’ comes directly from the sun’s disk, whereas the diffuse radiation experienced as
‘daylight’ comes from numerous directions. Because solar resources vary daily and seasonally, it
is important to consider the extent to which resource availability matches heat and power
demand variations, as their correspondence will determine the type of facility required and can
signal possible difficulties in deploying solar energy technologies to satisfy energy needs.
PAGE | 12Solar Energy: Mapping the Road Ahead Findings and recommendations
Global horizontal irradiance
This map is without prejudice to the status of or sovereignty over any territory, to the delimitation of international frontiers and
boundaries and to the name of any territory, city or area.
Source: World Bank Group, ESMAP and Solargis (2019), Global Solar Atlas, http://globalsolaratlas.info.
Global horizontal irradiance (GHI) measures the density of solar resources available per horizontal
surface area, including both direct and diffuse radiations. Other measures of resource availability
also need to be considered, depending on the technology to be deployed. For concentrating solar
technologies for power or industrial heat particularly, the relevant metric is direct normal
irradiance (DNI).
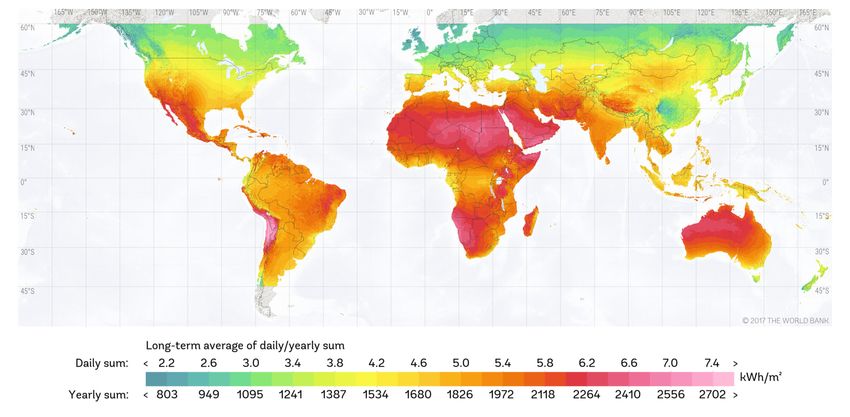
Direct normal irradiance
This map is without prejudice to the status of or sovereignty over any territory, to the delimitation of international frontiers and
boundaries and to the name of any territory, city or area.
Source: World Bank Group, ESMAP and Solargis, Global Solar Atlas, http://globalsolaratlas.info.
Market and policy trends
Record-level PV capacity growth has dominated renewable energy expansion in recent years, and
prices have fallen drastically since 2010 – by four-fifths for modules and by almost two-thirds for
residential systems. Although growth of PV installation stalled for the first time in 2018,
remaining below 100 GW of new PV capacity, growth resumed in 2019 reaching a record 115 GW
PAGE | 13Solar Energy: Mapping the Road Ahead Findings and recommendations
(estimated) installed in over 110 countries. Cumulative global capacity reaches 609 GW, far
surpassing CSP capacity estimated at 6.5 GW by end 2019. In 2018 PV exceeded cumulative solar
thermal panel capacity (then 480 gigawatts thermal [GWth]) for the first time.
Owing to significant cost reductions as well as private sector and government initiatives, off-grid
solar PV applications have begun to bridge the electrification gap in Asia and sub-Saharan Africa.
Mini-grids as well as industrial, agricultural and commercial applications and solar home systems
(SHSs) can provide an immediate solution for initial or improved electricity access for households,
small businesses and industries.
Box 2. Off-grid solar
The private sector’s market-led solar appliance revolution of recent years resulted from the
ability of a single solar PV panel to supply DC electricity to a distinct solar appliance. Appliances
such as portable lanterns, fixed LEDs, phone chargers, fans, TVs, pumps, fridges, vaccine coolers,
laptops, rice-cookers, etc., can therefore be operated anywhere on electricity from sunlight.
Solar Home Systems (SHSs) are PV systems that often have a peak capacity in the 100 W range
and are installed in off-grid residential dwellings and equipped with a battery for lighting and
for powering various appliances for several hours per day. Operated under new business models
such as ‘pay as you go’, SHSs that entered the market just in 2017 gave an estimated 6 million
people initial access to electricity. In Bangladesh alone, 12 million people have already gained
access to electricity through SHSs.
Larger off-grid solar energy systems are often used for either primary electricity or for backup
power during the brownouts and blackouts that frequently occur in developing countries. These
systems can generate electricity in an off-grid mode for mines, telecom towers, greenhouses and
other agriculture equipment, hotels, hospitals and schools.
For solar heating technologies, even though the Chinese market is shrinking, it is still the world
leader by far. After declining since 2009, European markets regained growth in 2018, and some
emerging economies have demonstrated market dynamism. While individual solar water heating
systems dominate the global market, in several countries (especially Denmark) the installation of
large-scale solar thermal plants connected to district heating systems or large buildings has been
expanding.
While CSP growth has stalled in the former leading markets of Spain and the United States, a
second wave of projects is emerging in the Middle East, Africa and China as market prices fall.
The share of projects with built-in thermal storage is increasing, as is storage size.
More than 120 countries now have renewable energy targets for their power sectors – twice as
many as in 2010. Support policies in most countries are evolving from open-ended feed-in tariffs
to auctions for stable, long-term remuneration mechanisms that may be adapted to delivery
times and locations or combined with market prices, to both de-risk investment and offer an
incentive to deliver electricity at times and locations that are more beneficial for the power
system. For smaller rooftop systems, there is also a shift towards incentivising self-consumption,
with various schemes designed to remunerate electricity injected into the grid.
PAGE | 14Solar Energy: Mapping the Road Ahead Findings and recommendations
Box 3. The importance of the cost of capital for solar projects
Solar technology costs have dropped drastically in recent years, especially for solar PV. Another
factor that has helped reduce the levelised cost of electricity (LCOE) in many countries is the
reduction of investment risks. Perceived risk is expressed by the weighted average cost of capital
(WACC), composed of interest on bank loans and expected investment returns for equity
investors.
Share of financing costs in the LCOE of solar PV
IEA 2019. All rights reserved.
Note: Assumptions are: capex of USD 1/W; annual operational expenditures 2% of capex; 25-year lifetime; 1 800 full-load hours.
This figure reveals the importance of investment risk, depicting the LCOE as the sum of capital
expenditures (capex), operations and maintenance (O&M) expenses, and the cost of capital (its
share is represented on the right axis). With a WACC higher than 9%, the costs of capital account
for over half the kWh cost.
In a comparison of two projects with similar system costs, O&M expenses and solar resources but
different WACCs (5% vs. 15%), the second project’s LCOE is twice as high. The WACC, which is
often overlooked, is important because the bulk of PV plant expenditures occur upfront, before
the plant delivers its first kWh.
WACCs can vary considerably depending on the country, policy framework and perception of risk
by investors and banks. This is why, even though subsidies are no longer required for solar projects
in many cases, governments and regulators have an obligation to establish a risk-mitigating
regulatory framework that delivers sufficient certainty relative to returns on investment.
Enabling technologies and system integration
Wind and solar PV capacity have expanded very rapidly in many countries as a result of supportive
policies and dramatic drops in technology costs. By the end of 2018, these technologies –
collectively referred to as variable renewable energy (VRE) – had attained double-digit shares of
annual electricity generation in 20 countries. The IEA classifies VRE integration into six phases as
PAGE | 15Solar Energy: Mapping the Road Ahead Findings and recommendations
shares increase. While Figure 4 indicates the VRE levels reached in some countries and regions,
Figure 5 illustrates these six phases and the four pillars of flexibility: power plants, grids, demand-
side response (DSR) and storage.
Figure 4. VRE shares in total electricity generation by selected region, 2018
Source: IEA (2019a), Status of Power System Transformation 2019: Power System Flexibility.
Existing power system flexibility makes it easy to integrate PV electricity initially, but integrating
larger shares will require greater flexibility.
The first two phases of integration are easily manageable owing to the flexibility of power systems,
but close policy-maker attention is nevertheless very helpful at this stage. Attention should focus
on grid connection codes, on adequate forecasting of solar PV (and wind) plant output, and on
managing the interface between high- and low-voltage grids. Moreover, steps must be taken to
adapt renewable energy deployment to the needs of the wider power system, not only the reverse.
This relates especially to the complementarities of technologies with different output profiles (PV,
wind, CSP) and to the localisation of new plants, but may also affect plant design and management.
In phases 3 and 4, PV (or wind) accounts for large shares of the power mix. Power system flexibility
may need to be increased at this point by implementing DSR, expanding grid interconnections,
raising hydropower capacity, using CSP and other thermal plants in a flexible manner, and
eventually expanding storage from pumped storage hydropower and batteries.
In the final phases of integration (5 and 6), seasonal imbalances may be the primary impediment to
integrating very large shares of solar and wind, with risks of shortages during periods of low sun and
wind, and large surpluses at times of high electricity generation and low demand. Flexible
electrification of end-use sectors (buildings, industry and transport) and the production of
electricity-based hydrogen and hydrogen-rich fuels could provide seasonal renewable energy
storage in addition to further decarbonising the overall energy mix. Producing such fuels could also
make use of stranded renewable resources in regions with excellent solar and wind potential,
launching a novel global energy trade.
PAGE | 16Solar Energy: Mapping the Road Ahead Findings and recommendations
Figure 5. The six phases of VRE integration and the four pillars of flexibility
IEA 2019. All rights reserved.
VRE integration requires the use of all flexibility options, of which storage is just one.
Designing and implementing roadmaps
Solar Energy: Mapping the Road Ahead aims to provide government, industry, civil society and
community stakeholders with the methodology and tools to successfully plan and implement
national and regional solar energy roadmaps. This guide’s holistic approach encompasses all solar
technologies – solar PV, CSP and SHC.
Figure 6 illustrates the two streams of activities that make up roadmap development: those that
focus on analysis (in orange) and those centred on decision-making and consensus-building (in
blue).
The evolving process by which a roadmap is created, implemented, monitored and updated is
crucial to achieve the goals it sets out. Creation of the plan should maximise stakeholder
engagement to build consensus and increase the likelihood that those involved will implement
the roadmap’s priorities and together seek early solutions to anticipated barriers. Ideally, a
roadmap is a dynamic document that incorporates metrics to monitor progress in meeting its
stated goals, and is flexible enough to be updated as the market, technology and policy context
evolves.
The overall process should be overseen by the government, as many ministerial departments
could be involved together with the ministry in charge of energy. Virtually all have buildings and
services that require energy supply to service the population. Many are also relevant for their
action.
For example, the agriculture department is concerned by many applications, from combining PV
panels and crops or pasture, running water pumping, transformation processes, etc. The
education ministry could help disseminate information to children and through them, families,
as well as to older students. The health department is concerned with providing electricity to
health services, as well as food preservation, which is also of interest to the ministries of
PAGE | 17Solar Energy: Mapping the Road Ahead Findings and recommendations
agriculture and economy. The ministry of transportation could help in transitioning from fossil
fuels vehicles to solar mobility services. The finance ministry could play an important role in
removing subsidies to fossil fuels and introducing some initial support to solar deployment. The
ministry in charge of habitat could help link energy efficiency and PV deployment in responding
to a growing demand for space cooling… and this list is not exhaustive.
The ISA is available to help countries elaborate their own solar roadmaps, organised around their
respective national focal points.
Figure 6. The roadmap development process
Note: Dotted lines indicate optional steps, depending on available capabilities and resources.
Source: Adapted from IEA (2014a), Energy Technology Roadmaps.
IEA roadmap development involves two streams of activities (analysis and consensus-building) in four
phases: planning, visioning, development and implementation.
The four phases in brief
The planning and preparation phase involves examining the technological, market and public
policy situation specific to the solar technologies covered by the roadmap. In addition to this
broad analysis, a comprehensive understanding of solar potential and resources must be
developed.
Because the range of essential solar energy stakeholders is wide in most countries, not only is
it critical to identify them early in the process, it is also important to consider how they should
be involved in roadmapping at the different levels of engagement (Responsible, Authorised,
Consulted and Informed).
The second phase of roadmapping involves developing a vision for solar technology
deployment in the country or region within a specified time frame. A clear statement of the
drivers for using solar energy is essential to develop the roadmap’s vision and long-term goals.
Clear, realistic targets are an important component of any national or regional roadmap’s
guiding vision. A precise vision and credible goals make it easier to implement a roadmap
effectively, particularly when targets are mandatory rather than aspirational. Although energy
infrastructure, energy demand profiles and solar resource accessibility differ from one country
PAGE | 18Solar Energy: Mapping the Road Ahead Findings and recommendations
to the next, global analyses such as the IEA’s Sustainable Development Scenario may
nevertheless help guide efforts (Figure 7).
Figure 7. PV and CSP generation in the Sustainable Development Scenario
TWh
8000 30%
7000
25%
6000 PV
20% CSP
5000
4000 15% Share of PV
3000 Share of CSP
10%
2000
5%
1000
0 0%
2017 2025 2030 2035 2040
Source: IEA (2018c), World Energy Outlook 2018.
In climate-friendly scenarios, solar technologies provide up to 30% of global electricity.
The next phase, roadmap development, is devoted to identifying barriers to solar technology
deployment, as well as the actions necessary to overcome them and those responsible for
carrying them out. Barriers can be non-economic, such as institutional, administrative,
permitting and public acceptance obstacles, among others. Or, they can be economic, often
resulting from framework or market design shortcomings that magnify perceived risks for
investors and lenders.
The fourth and final phase of roadmap development covers monitoring its implementation and
establishing a mechanism for regular updating. This is an ongoing activity, with tracking and
monitoring occurring on a regular basis through a variety of indicators. Support mechanisms and
targets should also be revised and adjusted frequently because even proven solar technologies
are still evolving quite rapidly and costs are continuing to fall. If support mechanisms take the
form of a subsidy, they should not be excessively generous at the expense of taxpayers;
meanwhile, targets should be enlarged as costs fall, justifying a greater solar contribution to the
country’s energy needs and economic development.
PAGE | 19Solar Energy: Mapping the Road Ahead Findings and recommendations
Useful online resources
IEA: Solar Energy Perspectives (2011): https://webstore.iea.org/solar-energy-perspectives
IEA: Technology Roadmap: Solar heating and cooling (2012):
https://webstore.iea.org/technology-roadmap-solar-heating-and-cooling
IEA: Technology Roadmap: Solar Photovoltaic Energy (2014):
https://webstore.iea.org/technology-roadmap-solar-photovoltaic-energy-2014
IEA: Technology roadmap: Solar thermal electricity (2014):
https://webstore.iea.org/technology-roadmap-solar-thermal-electricity-2014
IEA: Getting Wind and Sun onto the Grid (2017): https://webstore.iea.org/technology-
roadmap-solar-thermal-electricity-2014
IEA: Renewable Energy for Industry (2017): https://webstore.iea.org/insights-series-2017-
renewable-energy-for-industry
IEA: Renewable Heat Policies (2018): https://webstore.iea.org/insights-series-2018-
renewable-heat-policies
IEA: ”Status of power system transformation 2019” (2019): https://webstore.iea.org/
status-of-power-system-transformation-2019-power-system-flexibility
IEA Energy Technology Network:
o IEA PVPS TCP publications: http://www.iea-pvps.org/
o IEA SHC TCP publications: https://www.iea-shc.org/
o IEA SolarPaces (Solar Power & Chemical Energy Systems programme) publications:
https://www.solarpaces.org/
IRENA, IEA and REN21: Renewable Energy Policies in a Time of Transition (2018):
https://www.irena.org/-
/media/Files/IRENA/Agency/Publication/2018/Apr/IRENA_IEA_REN21_Policies_2018.pdf
ISA: http://www.isolaralliance.org/
UNDP, Derisking Renewable Energy Investment (2013); DREI: Off-Grid Electrification (2018):
https://www.undp.org/DREI
World bank group, ESMAP and Solargis, Global solar atlas (2019):
https://globalsolaratlas.info/
PAGE | 20Solar Energy: Mapping the Road Ahead Introduction
Introduction
About technology roadmaps
The primary goal of a technology roadmap is to highlight and accelerate deployment of a specific
technology or group of technologies. Simply put, a roadmap is a strategy or plan describing the
steps to be taken to achieve stated and agreed goals on a defined schedule. It details the
technical, policy, legal, financial, market and organisational barriers to these goals, and the range
of known solutions to overcome them. Roadmaps can be developed for various levels of
deployment – global, national or regional – and can be sector- or technology-specific for different
time frames.
The evolving process by which a roadmap is created, implemented, monitored and updated is
referred to as roadmapping. The way this process is organised is crucial to achieve the goals it
sets out. An effective roadmapping process maximises stakeholder engagement in creating the
plan, thereby building consensus and increasing the likelihood that those involved will implement
the roadmap’s priorities and together seek early solutions to anticipated barriers.
From a geographical prospective, not only the central government should be involved, but also
regional authorities and city mayors.
From a sectoral prospective, it is all the more important that many stakeholders beyond energy
ministries are involved in this process : agriculture, housing, transportation, health, education
and finance among others.
All these stakeholders are critical to a strong roll-out of solar technologies.
Ideally, a roadmap is a dynamic document that incorporates metrics to monitor progress in
meeting its stated goals, and is flexible enough to be updated as the market, technology and
policy context evolves.
About this guide
Solar Energy: Mapping the Road Ahead aims to provide government, industry, civil society and
community stakeholders with the methodology and tools to successfully plan and implement
national and regional solar energy roadmaps. This guide’s holistic approach encompasses all solar
technologies – solar photovoltaic (PV) electricity, concentrating solar power (CSP, or solar
thermal electricity [STE]), solar heating and cooling (SHC), and even solar fuels – and addresses
synergies and trade-offs to consider when formulating a comprehensive solar strategy.
Applications include utility-scale PV and CSP power generation; distributed on- and off-grid
electricity generation; solar thermal water/space heating and cooling; solar heat for industry; and
solar fuels.
Designed for decision makers in developing and emerging as well as developed economies, this
guide does not cover every aspect of solar energy technology, policy or deployment. Rather, it
aims to provide a comprehensive list of steps and concerns for each phase of solar energy
roadmapping and deployment. Selected case studies encapsulate the wide array of existing
applications, and discussions of deployment drivers and barriers are accompanied by realistic
PAGE | 21You can also read