Coal industry across Europe - 7th edition - DEBRIV Bundesverband ...
←
→
Page content transcription
If your browser does not render page correctly, please read the page content below
7th edition

               Coal industry
              across Europe
Coal industry across Europe
Foreword
On 1st December last year, the new Von der Leyen
Commission took office with a clear ambition: to make
Europe the first climate-neutral continent by 2050. The
European Green Deal, presented by the Commission just
two weeks later, includes a comprehensive package of
measures enabling European citizens and businesses to
benefit from a sustainable green transition. This Deal
represents the new growth strategy for Europe, aiming to
reduce emissions while also creating jobs and boosting the
economy. The energy sector is at its core.
As vital elements of the Green Deal, in January 2020, the
Commission presented the Just Transition Mechanism and
the Green Deal Investment Plan. The Just Transition
Mechanism will ensure that no country, region nor person will
be left behind in the green transition, by providing tailored
financial and practical support to help reskilling the most
impacted employees and generating investments and new
jobs in those areas most affected by the transition. For the
transformation to be a success, large-scale investment is
absolutely essential. The overall financial package of the
Kadri Simson, European Commissioner for Energy
Mechanism is worth at least €100 billion. As for the
Investment Plan, it will mobilise public investment and help
unlock private funds through EU financial instruments,
notably InvestEU, leading to a total of at least €1 trillion
euros of investments in the European economy.
The Commission is conscious of the economic significance To do so, the Commission already in 2017 launched the
of coal to the economies of many regions in Europe. The “Platform for Coal Regions in Transition”, to support coal and
coal sector still accounts for around one fifth of the total carbon-intensive regions in transition to be prepared for the
electricity production in the EU, and provides jobs to around upcoming changes. This shift is an ongoing reality in Europe
230 000 people in mines and power plants across thirty-one and although the move to a low-carbon economy presents
regions and eleven Member States. While for the time being many opportunities, the economic and social impacts in
coal remains an important fuel in the European energy mix, many coal regions cannot be ignored. The transformation
we need to acknowledge that change is already happening. ahead of us Europeans is unprecedented, and it will only
In the context of climate change, the transition to cleaner work if it works for all.
sources of energy and innovative technologies is taking
place and accelerates as coal is replaced by more Co-operation and exchange of views with the coal industry
sustainable and competitive alternatives. We as policy has been and will continue to be important for the European
makers are committed to helping communities, which rely on Commission. It is in our common interest to secure that the
the coal value chain during the progressive phasing out of clean energy transition is just, fair and informed by the views
coal from our energy mix over the next decades. of those who are living through it.
February 2020
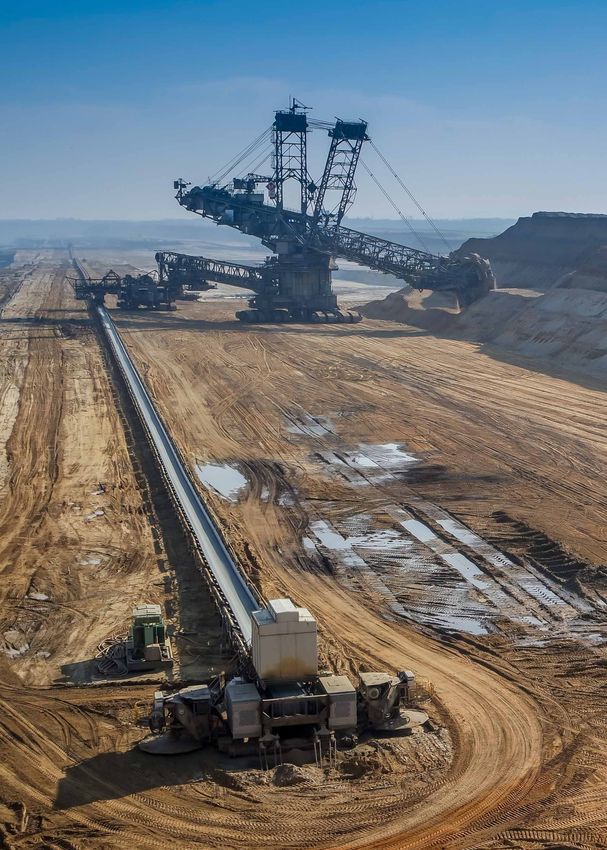
Cover photo: RWE Niederaußem lignite-fired power plant and wind
farm at Bergheim in North Rhine-Westphalia, Germany.
© Stevotion | Dreamstime.com
2 7th edition
Coal industry across Europe

Contents

    5   Introduction by Tomasz Rogala
        President of EURACOAL

    7   Energy Summit Declaration

    9   From Energy Union to a carbon-neutral Europe via a just transition

   15   Added value from coal

   17   International coal market and global energy trends

        Country profiles

   23   Bulgaria

   25   Czech Republic

   29   Germany

   35   Greece

   37   Hungary

   41   Poland

   45   Romania

   47   Serbia

   49   Slovakia

   53   Slovenia

   57   Spain

   59   Turkey

   63   Ukraine

   65   United Kingdom

   69   Other EU Member States and Energy Community stakeholders

   81   Photo credits

   82   EU statistics

   84   EURACOAL

   85   Coal classification

   86   Glossary

   86   Data sources and references

   87   Map of Coal in Europe 2018

European Association for Coal and Lignite                                                             3
Coal industry across Europe

                                                                       important issue of international emissions trading. Although
                                                                       the Intergovernmental Panel on Climate Change (IPCC)
                                                                       report on the impacts of a 1.5°C global warming was not
Introduction                                                           universally endorsed, that target looks now to be achievable
                                                                       in Europe.

                                                                       Those EU member states who depend heavily on coal, such
                                                                       as Poland, Czechia, Bulgaria, Germany and Greece, have all
This publication, prepared by EURACOAL members, tells the              submitted to the European Commission their draft national
story of a vital fuel: where coal comes from, what it is used          energy and climate plans, including assumptions on their
for and the challenges it faces. Presenting facts and figures          future energy mixes. Following the cessation of subsidised
on the coal industry, it covers not only the European Union,           hard coal mining in Germany and Spain at the end of 2018,
but also countries that participate in the Energy Community.           as required under EU law, a growing number of countries are
                                                                       now expected to largely exit from coal and lignite use:
Since we drafted the last edition of Coal industry across              France in 2021, the United Kingdom in 2025, Greece in 2028
Europe, the Paris Agreement of 2015 has been signed and                and Germany in 2038. Other countries are likewise
the European Commission has published its Clean energy                 considering how and when to exit.
for all Europeans package of proposals which have now
been enacted. The package delivers on the commitments                  For this reason, the Coal Regions in Transition Platform, a
made by the European Union under the Paris Agreement. It               welcome initiative of the European Commission, is gaining
took months of negotiation before EU member states were                momentum. Replacing coal with renewable energy sources
able to agree to all the proposals, but the new laws will help         or nuclear power will take time, but progress is being made.
reduce greenhouse gas emissions with a transition away                 Replacing the advantages of coal – its abundance, its
from fossil fuels towards clean energy. Central to the                 affordability and its availability – is also a challenge, but one
package remains the EU emissions trading system which will             that can be met with massive investment in renewable
deliver the politically agreed reductions with certainty.              energy sources and large-scale energy storage technologies.

Towards the end of 2018, the European Commission                       The world is set to use around seven billion tonnes of coal
presented its new strategic long-term vision for a prosperous,         each year through to 2040. The success of the energy
modern, competitive and climate-neutral economy by 2050.               transition in the European Union will be important not only for
Now, under the European Green Deal tabled in December                  the European citizens who must pay the cost of transition
2019, this vision is being turned into legislative proposals           which, according to estimates by the European Commission,
that will transform society. Europeans must decide how                 will run to an additional €175 billion to €290 billion per year
committed they are to these ambitious proposals. Achieving             from 2031 to 2050, but also for the citizens of the world who
climate neutrality will not be an easy task as it goes far             will watch this experiment with deep interest. If it works, they
beyond what other regions of the world have offered, but the           will want to follow. For the European regions with coal mines
European coal industry is preparing itself for such change             and coal power plants, it means finding at least €25 billion each
and welcomes the promised structural investments in the                year from 2021 to replace these assets and associated jobs.
coal-mining regions.
                                                                       With the above in mind, EURACOAL members organised an
To demonstrate the coal industry’s position as an important            Energy Summit in October 2019, co-operating with the Polish
stakeholder, the coal-mining region of Silesia was pleased to          Ministry of Energy to formulate the expectations of the coal
                                th
host in December 2018 the 24 UNFCCC Conference of the                  sector and the support needed to implement the energy
Parties in Katowice (COP24). Although the leaders of the               transition in a way that builds on the coal value chain. We
ten economies responsible for two-thirds of global                     invite you to read the summit declaration and lend your
greenhouse gas emissions were absent – China, the United               support to a sustainable energy transition.
States, India, Russia, Japan, Brazil, Indonesia, Germany,
Canada and Iran – the Katowice Rulebook was adopted. It                Coal will be used for many decades to come. While the
is a roadmap to implement the Paris Agreement and shows                volumes used by EU member states will continue to decline,
us that industrial decarbonisation is only one of the ways to          meeting politically agreed emission-reduction targets, flexible
tackle climate change; forestry and farming are also                   and reliable coal-fired power generation will undoubtedly
important. Unfortunately, no agreement was reached in                  bring security to the energy transition and avoid an
Katowice or at COP25 in Madrid in December 2019 on the                 overdependence on fossil gas.

MEP Grzegorz Tobiszowski, former Secretary of State and
Government Plenipotentiary for the restructuring of hard coal mining
in Poland (left) and Mr. Tomasz Rogala, President of EURACOAL
and Chairman of the Board, Polska Grupa Górnicza S.A.

European Association for Coal and Lignite                                                                                             5
DECLARATION
              CONCERNING THE CONDITIONS FOR A SUSTAINABLE ENERGY TRANSITION

 Energy transition is an industrial technology-driven transformation towards a low-emission economy
employing diverse energy sources. This process should be carried out in compliance with social justice,
  taking into account rational economic decisions and the competitiveness of EU industry as well as
                                   respecting the natural environment.

   I.       A sustainable transition needs to address the climate challenge, including the Paris target,
            but it requires global solutions with adequate ambitions and valid contributions
            everywhere but particularly within the G20. The EU energy and coal sectors will
            continue to reduce their emissions under the reliable EU ETS.

   II.      As such, Energy transition is a cost-intensively process and it will differ between
            particular European Union countries, reflecting the different starting points of each
            member state. That is why it is crucial to have the freedom to define the time
            framework as well as tools and instruments necessary to carry it out in a fair and
            sustainable way.

   III.     The European mining and energy sector is the source of a value chain which should be
            actively included in this transition – therefore, the transformation we need is one that
            prevents impoverishment and social instability of the mining regions and incentivises
            innovation and investment.

   IV.      There must be an appropriate balance between the objectives of the European Union’s
            energy policy of competitiveness, energy security and climate protection. This triangle
            without any overriding element can form the basis for functioning and fair development
            of the society and economy of every country.

It is considered important that the message be taken into account when adopting strategies, policies,
outlooks and directives issued by European Union authorities. We suggest that the transition process
 stakeholders co-operate with scientists and experts in order to evaluate the implemented process of
             transition and its compliance with the conditions included in this declaration.

Coal industry across Europe

From Energy Union to a                                           Box 1
                                                                 Energy Union

carbon-neutral Europe                                            A communication on Energy Union was published by the
                                                                 European Commission in February 2015. It heralded a
via a just transition                                            fundamental transformation of Europe’s energy system,
                                                                 promising a sustainable, low-carbon and climate-friendly
                                                                 economy. To reach this goal means moving away from an
                                                                 economy driven by fossil fuels; although with a strategy for
                                                                 imported fossil gas. The Energy Union proposal consists of
An energy transition is coming. No one is quite sure what        five main pillars:
precise shape it will take as some elements are missing,
such as diurnal and seasonal energy storage. The transition       ■   energy security, solidarity and trust;
is being driven by technological change and political will. In    ■   a fully integrated European energy market;
the media, the environmental impacts of growing energy use        ■   energy efficiency contributing to moderation of demand;
feature prominently, especially in light of reports by the UN     ■   decarbonising the economy; and
Intergovernmental Panel on Climate Change (IPCC) which            ■   research, innovation and competitiveness.
warn of “profound consequences for ecosystems and
people” if man-made global warming is not limited to well        The fourth pillar is based on an EU-wide carbon market
below 2°C above pre-industrial levels. Other, related issues     under the EU emissions trading system (ETS), with the
attract less attention, such as energy security, and the costs   vision of making Europe the number one in renewable
and time needed for a revolution on the scale of the             energy sources.
Industrial Revolution.

Figure 1                                                         Energy systems have never been static, always changing
The UN IPCC states that a sustainable energy transition          and modernising with, for example, larger, more efficient
needs to address the climate challenge with an equitable         power generation units, more robust grids and evermore
global response that eradicates poverty.                         imaginative ways to use electricity. The way coal is used
                                                                 has changed – from the burning of raw coal to the controlled
                                                                 combustion and gasification processes of today, with modern
                                                                 pollution control technologies to further reduce environmental
                                                                 impacts. The new political vision is of a carbon-neutral
                                                                 energy system that relies on renewable energy sources,
                                                                 smart grids, decentralised power production and the active
                                                                 participation of prosumers through the digitalisation of energy
                                                                 services. These are the aims of Energy Union in the EU.

                                                                 The challenge
                                                                 Energy transition is complex and to achieve it on the scale
                                                                 needed will require the wide deployment of new
                                                                 technologies.

                                                                 The EU emissions trading system (ETS) should remain the
Source: IPCC, 2018                                               only instrument used to drive down CO2 emissions from the
                                                                 power sector: it delivers a politically agreed emission
                                                                 reduction target. By 2050, the power sector and other
The vision                                                       energy-intensive industries must have reduced their CO2
                                                                 emissions by around 90% compared with 2005, and no new
In the UNFCCC Paris Agreement of 2015, world leaders set         emission allowances will be auctioned after 2058. Following
the 2°C guardrail on global warming and agreed that each         recent political decisions to tighten the ETS, the price of
country would deliver according to its ability. The Katowice     emission allowances surged and the cheapest fuel suppliers
Rulebook of 2018 outlines reporting standards which will         (i.e. coal and lignite mining companies – see Figure 2) and
provide a picture of the overall level of ambition. Parties to   power utilities now struggle to deliver the cheapest electricity
the UNFCCC are encouraged to inform citizens and explain         to consumers. Such moves have damaged the ETS as a
what progress is being made to avert a climate catastrophe.      reliable and predictable policy instrument.

European Association for Coal and Lignite                                                                                       9
Coal industry across Europe

Figure 2
                                                                       Box 2
Oil, gas and coal prices in the EU since 1990 – compared
                                                                       EU climate strategy to 2050: a clean planet for all
on an energy basis, € per tonne of coal equivalent

€/tce        low sulphur fuel oil          fossil gas     steam coal

400

350

300

250

200

150

100

 50

  0
   1990     1995          2000      2005           2010   2015

                                                                       In November 2018, the European Commission published its
Sources: IEA databases, BAFA in BP, 2019 and IHS, 2019
                                                                       new vision for reducing greenhouse gas (GHG) emissions to
                                                                       achieve a carbon-neutral European Union by 2050. The
Figure 3
                                                                       long-term strategy for a climate-neutral economy would
GHG emission reduction pathways in the EU, 1990-2050
                                                                       require joint action by member states in seven strategic areas:
showing the range of scenarios reported by the
European Commission in its long-term strategic vision                   ■   energy efficiency;
for a climate-neutral economy                                           ■   deployment of renewables;
                                                                        ■   clean, safe and connected mobility;
                                                                        ■   competitive industry and a circular economy;
                                                                        ■   energy infrastructure and interconnections;
                                                                        ■   bio-economy and natural carbon sinks; and
                                                                        ■   carbon capture and storage to address remaining
                                                                            emissions.

                                                                       Member states were invited to submit draft National Climate
                                                                       and Energy Plans by the end of 2018. These continue to be
                                                                       reviewed and refined so that the EU’s climate and energy
                                                                       targets for 2030 and 2050 can be met through the
                                                                       aggregated efforts of member states.

                                                                       Carbon neutrality by mid-century is a challenge, even for
                                                                       progressive regions like the European Union. It will require
                                                                       substantial changes not only to the energy system, but also
                                                                       to the way we all live: what food we eat and how it is
                                                                       produced, packaged and transported; how we travel and
                                                                       whether we can fly or drive; what fuels we use to keep
                                                                       warm; and where we live. Cities are changing in response
                                                                       to the transition – from the deep renovation of old buildings
                                                                       to make them energy efficient, through new smart buildings
                                                                       and low-energy lighting, to roads that limit the space for cars
                                                                       in favour of bicycles and buses.

                                                                       With the right impetus, change can come quickly. Mobile or
                                                                       cell phone subscribers grew from just a few in 1990 to an
                                                                       estimated 5.4 billion in 2020; 69% of the global population
                                                                       willingly pays for a communication system that existed only
                                                                       in sci-fi forty years ago. The climate challenge also requires
Sources: European Commission, 2018, IEA databases and                  global solutions, with similar ambitions everywhere.
EURACOAL estimates for CO2 emissions from coal use based on            However, when it comes to energy supply, not all countries
industry trends.                                                       have the same possibilities.

10                                                                                                                          7th edition
Coal industry across Europe
Figure 5
The response
EU coal, crude oil and fossil gas production, 1990-2018
The coal sector has invested heavily in environmental Mtce crude oil fossil gas coal
technologies such as flue gas desulphurisation (FGD) for 500
SO2 and selective catalytic reduction for NOx. The fall in
pollutant emissions has been impressive – by between 60%
400
and 90% since 1990. In the European Union, CO2 emissions
from the coal sector fell from 1990 to 2016 by an astonishing
300
47%, helping to meet the EU’s ambitious climate targets.
Now, the circular economy concept can be taken to a new
level, not just using ash for cement making and FGD gypsum 200
for plasterboard, but closing the carbon cycle. Much work is
in progress to capture CO2 and convert it using renewable 100
energy into useful products such as basic chemicals and
plastics, or as replacements for oil-based fuels. During the 0
transition, coal should be used in the cleanest possible ways. 1990 1995 2000 2005 2010 2015
This means continued technical research on current issues
and also on alternative uses of coal for a carbon-neutral era. Source: IEA databases
The cost of transition is not shared uniformly across the EU.
Figure 4 For example, in 2016, €57 billion was spent in support of
CO2 emissions from fuel combustion by fuel type in the renewable power generation (Figures 6 and 11), or over
EU-28, 1990-2016 €100 per person. This subsidy added 17.60 €/MWh to the
average cost of all EU electricity. Germany paid the most for
renewables: €24 billion to subsidise one quarter of its power
GtCO2 other gas oil coal production, adding 37.67 €/MWh to the cost of all electricity
4 consumed – more than its wholesale value. Not all countries
can afford to invest so heavily in renewables, especially as
conventional plants must also be kept operating as backup.
3
Figure 6
RES electricity support per unit of gross electricity, 2016
2
Sweden 2.33
47%
Poland 3.52
1 ― EU average 17.60 €/MWh
Netherlands 4.09
Hungary 5.13
0
1990 1995 2000 2005 2010 2015 Romania 5.49
France 7.34
Source: IEA, 2018
UK 10.54
Portugal 18.26
While it is true that the coal industry is in decline in some
Czechia 18.30
member states, this is merely the continuation of a long-term
trend that began decades ago. There are member states Spain 19.49
that will stop using coal in the next few years. For them, Greece 25.25
switching to fossil gas is relatively easy and not disruptive.
Denmark 31.06
In other member states, with a continued high dependence
on coal (as well as oil shale and peat), the switch is not as Italy 36.43
straightforward. They will still need coal in their energy
Germany 37.67
portfolios for decades to come. The switch away from coal
needs to be supported with major investments in new energy
infrastructure which will increase national debts. Source: CEER, 2018
“Energy transition is a costly process and it will differ
The total additional cost of transition, over and above between particular EU countries, reflecting the different
business-as-usual, is estimated by the European starting points of each member state. That is why it is
Commission to be €175 billion to €290 billion each year out crucial to have the freedom to define the timeframe as
to 2050 (COM(2018) 773). This would achieve net-zero well as tools and instruments necessary to carry it out in
emissions at a cost of up to US$10 trillion – more than €500 a fair and sustainable way.”
each year for every man, woman and child in the EU. Energy Summit Declaration, Warsaw, October 2019
European Association for Coal and Lignite 11Coal industry across Europe
Figure 8
The social dimension
Share of coal in the energy mix for EU electricity
generation, 2017
Around the world, 862 million people do not have access to
electricity and 2 651 million are without clean cooking fuels Estonia** 84%
(IEA, 2019a). In the European Union, despite efforts to
Poland 78%
reduce economic disparity, the prosperity map is unequal
when viewed along the east-west, and north-south axes. Czechia 51%
Average salaries can be five times lower in some member Bulgaria 46%
states compared with others for nominally similar work. This Germany 39%
discrepancy reflects the wide range of per capita GDP in
Greece 34%
member states, even on a purchasing power parity basis. It
is often the less wealthy eastern and south-eastern member Slovenia 30%
states who are most dependent on coal. Netherlands 29%
Romania 26%
Figure 7
Portugal 25%
Inequality across European Union regions as shown by
per capita GDP in NUTS 2 regions, 2017 Denmark 20%
(purchasing power standards, EU average = 100) Ireland* 19%
Spain 17%
Hungary 16%
Finland* 14% ― EU average 21.5%
Slovakia 13%
Italy 12%
Croatia 11%
UK 7%
Austria 5%
Belgium 3%
France 3%
Source: Eurostat database nrg_bal_peh, last update 25.06.2019
(n.b. coal includes coke oven / BF gas, peat* and oil shale**)
If coal power utilities were not burdened with expensive CO2
allowances (a c.100% tax for lignite producers), they could
be in position to diversify their activities: switching to other
fuels or entering new industrial markets that require similar
skill sets. However, diversification needs legal certainty and
the availability of funds to invest.
There is much talk of a “just transition”, leaving nobody
behind; coal miners are promised workplaces after coal is
phased out. It will take time to restore land and attract
investors to establish new activities in the coal regions. TheCoal industry across Europe
To this end, the European coal sector supports the European
Box 3
Commission’s Coal Regions in Transition Platform initiative –
European Green Deal
being actively involved from the initial proposal to
In July 2019, the President-elect of the European participating in a fully-fledged interest group with hundreds of
Commission presented her 2019-2024 political agenda to the stakeholders. The World Bank, the European Commission
European Parliament. In a radical departure from free- and the Energy Community are also engaged in establishing
market economics, a Green Deal is proposed that will affect a similar coal platform for the Western Balkans and Ukraine.
all areas of life in Europe. By March 2020, the Commission
will propose: A just transition
■ a 50% GHG reduction target by 2030;
■ the first climate-neutral continent by 2050; The term “just transition” has been embraced by the
■ an extension of the EU ETS to cover maritime, traffic European Commission, trade unions, and environmental
and construction; NGOs who call for the “fair” treatment of workers during what
■ a Carbon Border Tax to avoid carbon leakage; they see as the necessary and inevitable de-industrialisation
■ a review of the Energy Taxation Directive; of society in order to save the planet for future generations.
■ a Circular Economy Action Plan and decarbonisation of
During the energy transition, some sectors are expected to
energy-intensive industries;
shrink and hundreds of thousands of jobs will disappear.
■ a zero-pollution ambition (e.g. air and water quality,
The role of the European Commission is not only to present
industrial emissions and plastics);
a vision for the EU, but also to secure this vision in a way
■ a Biodiversity Strategy for 2030;
that avoids social unrest and the extinction of economic
■ a Farm-to-Fork Strategy for sustainable food;
activity in those regions of Europe which depend on fossil
■ a European Climate Pact for the regions, local
fuels and heavy industry. More generally, across Europe,
communities, civil society, industry and schools;
there is a risk associated with rising energy prices. The
■ a new Just Transition Fund so that nobody in any
issues of energy poverty and industrial competitiveness have
region is left behind, with targeted support to industrial,
to be addressed.
coal and energy-intensive regions and energy islands;
■ a ten-year, €1 trillion Sustainable Europe Investment At the UNFCCC COP24 conference in December 2018, the
Plan led by the European Investment Bank. Solidarity and Just Transition Silesia Declaration was signed
by fifty-six heads of state. The declaration demands that no
A large majority of member states have already endorsed the
one be left behind during the energy transition. In the long
EU objective of climate neutrality by 2050.
term, the implementation of a solidarity-based transition will
help garner and maintain public support for policies to reduce
Figure 9
emissions. In turn, this should enable the successful
Solidarity and Just Transition Silesia Declaration
implementation of a transition which is a prerequisite for
achieving global climate policy objectives.
The €5 billion Just Transition Fund, as called for by the
European Parliament in November 2018, will surely not be
enough to cover the costs of energy transition in the coal
regions. However, the European Commission proposes
using the existing Structural Funds and Cohesion Fund to
support the transition. With such support, the coal regions
can look forward to a bright, carbon-neutral future.
European Association for Coal and Lignite 13Coal industry across Europe
€35 billion to governments in 2015 (Figure 11). Unlike
renewable energy sources, the oil, gas and coal sectors
make net contributions to the public purse.
Added value from coal Figure 11
EU28 + Norway net government revenues and mandated
transfers, 2015
Coal is abundant, affordable and available – that is why it is € billion government revenues government expenditures + mandated transfers
the fuel of choice for electricity generation in many
300
developed and developing countries. In Europe, coal
ensures a truly competitive energy market. Without inter-fuel
200
competition from coal, industrial and residential electricity
consumers would face much higher power prices. 100
Since the beginning of the Industrial Revolution, coal has 0
brought prosperity to many nations. Industrialisation has
improved living conditions, health care and communications. -100
oil gas coal wind solar
Life expectancy in the United Kingdom has doubled thanks
to industrialisation – a picture repeated around the world. As
Source: NERA analysis for IOGP, 2018
society has aged so the global population has increased,
creating a higher demand for energy. Forecasts predict that
In 2018, across the EU, 76 million tonnes of hard coal and
energy demand will continue growing, so new energy
367 million tonnes of lignite were produced. Mining this coal
technologies will be needed to meet the expectation of
employed 163 thousand people, some at integrated mine
higher living standards for all and a clean environment.
and power plants. In the greater Europe, including the
Balkans, Turkey and Ukraine, this number rises to
Figure 10
291 thousand people (Table 1). Adding the indirect jobs
Life expectancy in rich and poor countries around the
supported by coal mining at suppliers of equipment, services
world has increased with industrialisation
and materials leads to a total of around 800 thousand people
whose livelihoods depend on the coal industry. Coal mining
years Africa World Europe UK
is often the main employer in regions which would otherwise
80 be depressed and suffering from high unemployment.
70
Figure 12
60
Average annual wages in the mining and quarrying
50 sector, which includes coal mining, compared with
40 wages across industry in EU member states, 2014
30
€ Industry Mining and quarrying
20
50 000
10
40 000
0
1550 1600 1650 1700 1750 1800 1850 1900 1950 2000 30 000
20 000
Sources: Riley, 2005; Clio Infra, 2015 in Zijdeman, 2015; and UN 10 000
Population Division, 2019. N.b. life expectancy at birth is the
0
average number of years a newborn would live if the pattern of
mortality in the given year were to stay the same throughout its life.
In the European Union, coal remains an important energy
source, meeting 15% of primary energy demand in 2017. At Source: Eurostat database earn_ses14_27, last update 18.05.2018
187 million tonnes of coal equivalent (Mtce), indigenous coal
and lignite production exceeded EU production of oil or fossil The annual value of EU-wide coal and lignite production,
gas. Ample reserves of coal and lignite are found in many based on its calorific value and on international hard coal
1
member states. prices, totalled around €18 billion in 2018. Adding coal
imports lifts the total value of coal used in the EU to
Coal mining companies create well-paid jobs with above- €34 billion. To replace this coal with fossil gas would mean a
regional-average salaries (Figure 12). They pay national greater dependency on non-EU gas as the EU itself has
taxes and contribute to local authority budgets. Overall, EU insufficient indigenous fossil gas production to meet its
companies making up the coal-value chain (e.g. mining, existing needs. In 2017, the EU was 74% dependent on gas
supply, power generation and coke making) paid a net imports.
European Association for Coal and Lignite 15Coal industry across Europe
In 2017, power generation from coal and other solid fuels – balance and our lights on, whatever the time of day,
indigenous and imported – accounted for 21.5% of gross whatever the weather and whatever the season.
electricity production in the EU. With the growth of
intermittent renewable power generation from wind and Note
1
solar, the flexibility of conventional thermal power plants Indigenous coal production of 76 Mt, lignite production of
matters more and more. Coal-fired power plants respond as 367 Mt (approximately 133 Mt at 6 000 kcal/kg) and imports
quickly as gas-fired plants to the ups and down of electricity of 167 Mt in 2018, at an average price of 92 US$/tonne for
supply and demand, helping to keep electricity grids in steam coal and double this for coking coal (IHS, 2019).
Table 1
Manpower in the European coal industry, 2015 and 2018
2015 2018
Hard Coal Lignite Total Hard Coal Lignite Total
Bosnia and Herzegovina - 14 382 14 382 - 13 323 13 323
Bulgaria - 11 765 11 765 - 10 294 10 294
Czech Republic 10 131 7 869 18 000 6 757 7 147 13 904
Germany 9 640 15 428 25 068 4 125 15 876 20 001
Greece - 4 919 4 919 - 4 082 4 082
Hungary - 1 655 1 655 - 1 400 1 400
Norway 267 - 267 126 - 126
Poland 89 924 9 574 99 498 82 843 8 583 91 426
Romania 4 442 10 600 15 042 3 022 13 000 16 022
Serbia 1 600 12 360 13 960 3 500 14 850 18 350
Slovakia - 2 190 2 190 - 2 000 2 000
Slovenia - 1 274 1 274 - 1 252 1 252
Spain 3 324 - 3 324 1 549 - 1 549
Turkey 15 668 28 856 44 524 14 251 37 596 51 847
Ukraine 122 000 - 122 000 44 300 - 44 300
United Kingdom 1 975 - 1 975 647 - 647
Total 258 971 120 872 379 843 161 120 129 403 290 523
Source: EURACOAL members
16 7th editionCoal industry across Europe
A key requirement for the development of sustainable energy
supplies in Europe is competitiveness. Energy at affordable
and equitable prices helps to maintain the competitiveness of
International coal market European industry as a whole and allows people to enjoy
comfortable lives. At present, the EU imports 55% of all the
and global energy trends energy it consumes, at a cost of around €266 billion per year.
The EU imports 87% of its crude oil needs, 74% of its fossil
gas and 44% of its coal: all are rising.
Managing energy-supply risks is an integral part of the
Around the world, coal makes a crucial contribution to the Energy Union strategy of 2015. Two essential elements of a
security of energy supply. It is a very competitive fuel and secure energy system are a diversity of energy sources and
adds economic value wherever it is used: for steelmaking, a diversity of energy technologies. A diverse energy mix,
for cement production and, most importantly, for electricity comprising indigenous and imported energy sources,
production. Coal oils the wheels of industry. A diverse including hard coal and lignite, helps to limit supply risks.
energy mix with coal can be part of any strategy that aims to
reduce risks and underpin sustainable economic growth. Electric power is no longer generated using conventional
hydro, coal, fossil gas and nuclear energy alone. Today,
The aim of this section is to give an overview of how coal new renewable energy sources, such as wind turbines and
production and use in the European Union fit with the wider solar PV, are growing in importance, but still require reliable
global picture of expanding coal consumption. Although it is backup from conventional sources, at least until large-scale
impossible to forecast the future, it is instructive to look at electricity storage options become available. By valuing the
current energy trends and examine how climate and energy flexibility and reliability of coal- and lignite-fired power
policies may influence these trends. generation, there is great scope for developing and
implementing renewable energy sources to the maximum
possible extent. The key to Europe’s future power
Coal and sustainability generation lies in a broad mix of energy sources, so that
supply risks are minimised, reliability maximised, affordable
The European coal industry believes that the three energy electricity enjoyed and further progress made in
sustainability objectives – security of supply, competitiveness environmental protection.
and environmental compatibility – must be pursued with
equal effort. Europe’s energy sector faces considerable
challenges to ensure security of energy supplies and
investment in new energy infrastructure. Conventional Global energy mix and coal
thermal power generation, including nuclear power plants
and, to an even greater extent, coal-, lignite- and gas-fired World total primary energy supply in 2018 was 19.8 billion
power plants, will continue to be needed for decades to tonnes of coal equivalent (Gtce) of which 27.2% came from
come, so, they need to be sustainable. coal. Coal is of particular significance for electricity
generation. Some 38.0% of global power generation and
Figure 13 20.0% of EU power generation in 2018 was based on coal.
The energy trilemma according to the World Energy
Council
Figure 14
ENERGY World total primary energy supply by fuel, 2018
SECURITY
4.0%
4.4%
6.8% 27.2%
19 807 Mtce
23.9%
coal and lignite
oil and petroleum products
fossil gas
hydro power
33.6%
nuclear power
ENVIRONMENTAL ENERGY renewables / other
SUSTAINABILITY EQUITY
Source: World Energy Council, 2015 Source: BP, 2019 (excludes non-commercial biofuels)
European Association for Coal and Lignite 17Coal industry across Europe
Figure 15
World coal resources
World electricity generation by fuel, 2018
Reserves of coal and lignite are abundant; total resources
are estimated at 17 489 billion tonnes of coal equivalent
(Gtce) of which only 1.2% have been extracted since 1950.
9.9%
Reserves amount to 747 Gtce and are substantially greater
10.2% than those of either oil or fossil gas, even if one includes
38.0%
non-conventional oil and gas reserves. In fact, coal reserves
26 615 TWh account for over half of all non-renewable energy reserves
15.8% coal and lignite and are distributed more equally than those of fossil gas or
oil and petroleum products oil. The world coal market is a free commodity market, which
fossil gas – in contrast to oil and fossil gas markets – is not influenced
3.0% hydro
23.2%
by geopolitics or the formation of cartels.
nuclear
renewables / other
Figure 17
Global hard coal and lignite reserves as at 1.1.2018
Sources: IEA databases, BP, 2019 and own estimates
According to ENTSO-E (2019), 592 TWh of net electricity CIS
46
13
generation in the EU came from solid fuels in 2018 (284 TWh 23 22 China
112
from hard coal, 294 TWh from lignite and the remainder from 2
Europe
oil shale and peat). Hard coal-fired power plants in the EU North 194 6
1 112
have a total capacity of 99 GW and lignite-fired power plants America 1 27
other
add a further 52 GW. Individual countries have very different 8
72
Asia
Latin 11 India
energy mixes for power generation, with coal being America Africa 26
indispensable for many (Figure 16 and table on page 83).
■ Coal 624 Gtce 65
Figure 16 ■ Lignite 123 Gtce
Australia & NZ
Total 747 Gtce
Share of coal- and lignite-fired gross power generation
in selected countries, 2017 and 2018
Source: BGR, 2019 and own calculations
* Kosovo 97%
* South Africa 89%
Poland 49% 29%
* Bosnia & Herzegovina 75% EU coal resources
* India 72% 2%
* Serbia 71% The availability of coal and lignite resources in Europe and
* Kazakhstan 69% around the world, combined with the high productivity of
* China 68% European coal and lignite producers and the diversity of coal
* North Macedonia 61% exporters to Europe, guarantee a high degree of supply
Australia 47% 14% security and competitive prices. Indigenous energy
* Indonesia 58% production, diversified sources of import supply and the
* Montenegro 55% storage capacities available at mines, ports and consumers
* Philippines 50% all help to ensure a stable supply chain. Unlike oil and fossil
Czech Republic 7% 43% gas, coal does not require strategic stocks to safeguard
* Taiwan 47%
against political risks.
* Bulgaria 3% 43%
South Korea 45% Table 2
* Malaysia 44% Non-renewable energy reserves in the European Union
Germany 15% 22% Gtce share
Greece 34%
Hard coal 20.6 51.0%
* Ukraine 32%
Lignite 16.4 40.5%
Japan 31% Coal
Oil 1.4 3.5%
Israel 30% Lignite
Fossil gas 1.7 4.2%
United States 27% 1%
Uranium 0.3 0.8%
* World 36% 3% * 2017 for non-OECD
Total 40.5 100.0%
Source: IEA databases (including coal gases and coal products) Source: BGR, 2019
18 7th editionCoal industry across Europe
Table 4
International coal market
Largest coal users, 2018
The largest coal producers in 2018 were China and India, Coking
followed by the United States and Indonesia. Australia was Country coal Steam coal Lignite Total
(Mt) (Mt) (Mt) (Mt)
the fifth largest coal producer and is the world’s largest
exporter of steam and coking coal by value. The European 1 China 587.4 3157.8 - 3745.1
Union was the sixth largest producer, being the world’s 2 India 97.4 842.3 45.3 985.0
largest producer of lignite by a wide margin. The top-10 3 United States 16.7 545.4 52.4 614.5
producers accounted for 94% of total world production. 4 EU-28 55.0 175.9 368.6 599.6
5 Russia 64.5 93.4 73.8 231.7
Table 3 6 South Africa 3.3 186.1 - 189.4
Largest coal producers, 2018 7 Japan 46.7 139.3 - 186.0
8 South Korea 36.9 106.9 - 143.8
Coking
Country coal Steam coal Lignite Total 9 Turkey 7.7 33.1 84.9 125.7
(Mt) (Mt) (Mt) (Mt) 10 Indonesia 7.5 107.6 - 115.1
1 China 3026.4 523.7 - 3550.1 others 69.0 547.8 168.5 785.3
2 India 676.4 49.2 45.3 770.9 World 992.1 5935.6 793.5 7721.2
3 United States 561.7 71.9 51.7 685.4
4 Indonesia 543.0 5.6 - 548.6 Source: IEA Coal Information 2019 and EURACOAL members
5 Australia 257.8 179.4 46.0 483.1
6 EU-28 15.5 60.2 366.9 442.6 Figure 19
7 Russia 245.4 93.0 81.4 419.8 Largest coal users in 2018, billion tonnes
8 South Africa 254.2 4.4 - 258.7
9 Kazakhstan 96.4 10.8 6.4 113.7 Mt
10 Turkey 1.9 0.7 85.2 87.8 Coal Lignite
3.0
others 298.1 34.4 120.3 452.6
2.0
World 5976.8 1033.3 803.2 7813.3
1.0
Source: IEA Coal Information 2019 and EURACOAL members
0.0
Figure 18
Largest coal producers in 2018, billion tonnes
Mt Source: IEA Coal Information 2019
Coal Lignite
3.0
Global seaborne hard coal trade is estimated at 1 210 million
2.0
tonnes in 2018, of which 906 million tonnes were steam coal
1.0
and 304 million tonnes were coking coal. Seaborne coal
trade can be divided into Pacific and Atlantic markets, each
0.0 with different supply patterns.
Figure 20
World traded coal flows in 2018
Source: IEA Coal Information 2019
Canada Russia
30 Mt 167 Mt
USA
The largest coal consumers in 2018 were China and India, 100 Mt China
followed by the United States. The European Union was the to Far East
3 Mt
316 Mt
fourth largest consumer, with steam coal for electricity Colombia Indonesia
82 Mt 343 Mt
generation being the main use of coal, accounting for three 6 Mt 46 Mt
337 Mt
5 Mt South Africa
quarters of all coal and lignite use on an energy basis. The Australia
81 Mt 386 Mt
top-10 consumers accounted for over 90% of total world
16 Mt
consumption, with the European Union accounting for 7.8%. Steam coal 906 Mt
Coking coal 304 Mt
At 1.2 tonnes, the annual per-capita coal consumption of Total seaborne trade 1210 Mt
European Union citizens is above the global average of
1.0 tonne of coal per person. Source: VDKi, 2019
European Association for Coal and Lignite 19Coal industry across Europe
Important exporting countries for steam coal and coking coal consumption, with more or less similar proportions of oil, coal
are Australia, Indonesia, Russia, the United States, and gas in the energy supply mix.
Colombia and South Africa and who together accounted for
91% of all coal exports in 2018 (Table 5). In contrast to the global picture of growing fossil fuel use and
hence rising carbon emissions, leaders of the European
Table 5 Union have agreed to reduce greenhouse gas emissions by
Largest coal exporters, 2018 80-95% by 2050 compared with 1990 levels. Their ambition
is to achieve carbon neutrality by 2050, such that residual
Country Coking coal Steam coal Total
(Mt) (Mt) (Mt)
man-made emissions are balanced by enhanced removals.
The European Commission presented its Energy Roadmap
1 Indonesia 3.5 435.4 439.0
2050 in December 2011, accompanied by an impact
2 Australia 179.2 202.7 381.9 assessment in which it details various scenarios to achieve
3 Russia 26.4 183.4 209.9 an 80% reduction in greenhouse gas emissions by 2050.
4 United States 55.8 49.1 104.9 While all sectors are analysed, the power sector is seen as
5 Colombia 2.4 79.5 81.9 the one carrying most of the burden of emission reductions.
6 South Africa 1.2 68.2 69.3
7 Mongolia 25.7 8.3 34.0 The IEA World Energy Outlook analyses future energy
8 Canada 28.9 0.9 29.9
supply and demand to 2040. In its Stated Policies Scenario,
the Agency assumes the cautious implementation of already
9 Kazakhstan 3.6 22.2 25.8
announced policy measures. Figures 22 and 23 show that
10 Mozambique 6.2 5.4 11.6
coal and lignite are expected to remain an important albeit
others 3.9 28.2 31.9 smaller component of EU energy supply for many years.
World 336.8 1083.3 1420.1
Figure 22
Source: IEA Coal Information 2019 EU production of coal and lignite
Top coal importing countries are China, India, Japan, South
EU Energy Roadmap 2050 scenarios, 2011
Korea and Taiwan, together accounting for 65% of all coal
EC Reference Scenario, 2016
trade in 2018. In the European Union, Germany and Poland Mtce
IEA Stated Policies Scenario, 2019
were the biggest coal importers in 2018, followed by Spain,
300
Italy and France. Leading exporters to the European Union
are Russia, Colombia, the United States, Australia and South
Africa. In 2017, 38.9% of all coal imports into the European
200
Union came from Russia.
Figure 21 100
Hard coal imports into the EU by country of origin, 2017
Canada, 0
2.5% 2000 2010 2020 2030 2040 2050
Indonesia, Russia,
3.4% 38.9%
Figure 23
South Africa,
4.9% EU consumption of coal and lignite
Australia, 157 million tonnes
11.8% EU Energy Roadmap 2050 scenarios, 2011
EC Reference Scenario, 2016
Mtce
IEA Stated Policies Scenario, 2019
United States,
16.9% Colombia, 400
16.9%
300
Source: European Commission DG Energy, 2019
200
Global energy trends 100
0
Future world energy scenarios to 2040 and beyond from the 2000 2010 2020 2030 2040 2050
International Energy Agency (IEA) and other respected
bodies show a marked increase in world total primary energy Sources: European Commission, 2011 & 2016 and IEA, 2019a
20 7th editionCoal industry across Europe
Bulgaria
Since the global economic crisis of 2007-08, the Bulgarian
economy has grown steadily, by up to 4% per year. In 2018,
GDP growth was 3.4% and the unemployment rate was
5.2%. The driving forces for this growth are investment and
domestic consumption as disposable household incomes
rise. EU funds and low interest rates on loans provide
favourable investment conditions.
With its large resource potential, the mining sector is of great
importance to Bulgaria and has developed strongly over the
years. The mining sector has attracted considerable local
and foreign investment with several companies investing in
world-class exploration, extraction and processing projects.
The National Strategy for the Development of the Mining
Industry to 2030 envisages further growth of the sector.
Following its Energy Strategy to 2020, the Bulgarian
government is elaborating a new energy strategy to 2030,
with a horizon to 2050. The key priorities are: guaranteeing
energy security and the financial stability of companies in the
energy sector; full liberalisation of the Bulgarian electricity
market in line with EU legislation; selection of a prime
contractor for the Belene nuclear power plant; continued gas
exploration in the Black Sea and construction of related
infrastructure; increasing the share of renewable energy
sources in power generation; and implementing an energy
efficiency programme.
General data 2018
In October 2019, the Council of Ministers approved a National Population million 7.1
Climate Change Adaptation Strategy and Action Plan for the GDP € billion 55.2
period to 2030. This will serve as a reference document, Per capita GDP €/person 7 800
setting a framework for action and priority directions.
Primary energy production totalled 16.8 million tonnes of coal
equivalent in 2017, with lignite and brown coal having the
highest share at 48.3%, followed by nuclear energy (34.6%). The 1 926 MW Kozloduy nuclear power plant plays a
Renewables (16.3%), fossil gas (0.6%) and liquid fuels prominent, baseload role. The ten-year lifetime extensions
(0.2%) accounted for the remaining energy production. In granted in 2017 and 2019 for units 5 and 6 are of great
2012, eight years early, Bulgaria reached its 2020 target of importance; operation could continue for thirty years. Kozloduy
16% renewable energy in final energy consumption, but at a accounted for 34.1% of gross power generation in 2017.
high economic and political cost.
The Bulgarian energy sector is important for the country’s
Due to its domestic production of coal and nuclear power, energy-intensive industries and accounts for above
Bulgaria had an import dependency in 2017 of just 39.5%, EU-average shares in total employment and value added.
far below the EU average of 55.1%. At 32.7%, the share of The sector contributes to the socio-economic development
coal in total primary energy supply is more than double the and welfare of the coal mining municipalities.
EU average, while the 21.7% share of nuclear power is
around 70% above the EU average. Power prices are Large investments in new capacity, rehabilitation of old
correspondingly low – among the lowest in the EU. power plants and expansion of the electricity grid have been
made over recent years. However, regulated consumer
Coal power plants accounted for 45.9% of total electricity tariffs are insufficient to cover new investments and the CO2
generation in 2017 and help to guarantee Bulgaria’s energy emission allowance costs borne by electricity utilities, a
security and economic competitiveness. Indigenous coal situation exacerbated by the high number of consumers in
reserves can fuel power generation for the next sixty years. arrears.
European Association for Coal and Lignite 23Coal industry across Europe
Bulgaria
Lignite
Coal resources and reserves as at 1.1.2018
Opencast lignite mining is mainly carried out in the mines of Total resources brown coal Mt 4 112
MINI MARITSA IZTOK EAD (MMI) whose production of
Total resources lignite Mt 4 574
28.0 million tonnes accounted for 96.6% of the country’s total
Reserves brown coal Mt 192
29.0 million tonnes in 2018. Its mines cover an area of some
240 square kilometres, being the largest mining site in South Reserves lignite Mt 2 174
East Europe. MMI is also the biggest employer in Bulgaria.
The company supplies four power plants with its own lignite: Primary energy production 2018
the state-owned Maritsa East 2 thermal power plant (TPP)
Total primary energy production* Mtce 16.8
(1 620 MW) and the privately owned CONTOURGLOBAL
Brown coal and lignite (saleable) Mt / Mtce 30.3 / 7.2
Maritsa Iztok East 3 TPP (908 MW), AES Galabovo TPP
(670 MW) and BRIKELL TPP (200 MW). MMI also supplies
lignite to the 120 MW Maritsa 3 TPP in Dimitrovgrad. Saleable coal quality
Brown coal calorific value kJ/kg 12 140-13 400
As a subsidiary of BULGARIAN ENERGY HOLDING, MMI
Lignite calorific value kJ/kg 5 652-7 746
plays an important role in ensuring national energy security.
In the next few years the level of lignite production by MMI Brown coal ash content % a.r.Coal industry across Europe
Czech Republic
Since 2014, the Czech Republic has enjoyed real GDP
growth of around 3% per year. Over the next few years,
GDP is expected to grow at around 2%, driven almost
exclusively by domestic demand. Labour shortages
constrain faster growth. The Czech government aims to
decouple energy consumption from economic growth.
Coal is the only significant indigenous energy resource in the
Czech Republic. The country’s proven coal reserves have
been estimated to total 705 million tonnes. Brown coal,
which accounts for more than 95% of these reserves, is
mainly produced in north-western Bohemia, while hard coal
is mined in northern Moravia. Significant quantities of hard
coal are exported to Slovakia, Poland, Austria and Hungary.
Primary energy supply, which was 61.8 million tonnes of coal
equivalent (Mtce) in 2018, comprised: 36.2% coal
(22.4 Mtce total of which an estimated 5.7 Mtce was hard
coal and 16.4 Mtce was brown coal), 15.8% fossil gas General data 2018
(9.7 Mtce) and 21.6% oil (13.3 Mtce). The primary energy
Population million 10.6
mix also includes nuclear energy with an 18.1% share in
GDP € billion 207.8
2018 (11.2 Mtce), as well as biofuels and waste which
Per capita GDP €/person 19 600
together accounted for 10.2% (6.3 Mtce). Solar, hydro and
wind power supplied the remaining 0.9% (0.6 Mtce).
The Czech Republic’s dependence on energy imports has
been quite modest to date, but is growing; 37.2% of energy owned by ČEZ; VRŠANSKÁ UHELNÁ, with coal reserves to
demand was met by imports in 2017. However, imports are last until 2055; SEVERNÍ ENERGETICKÁ, with the largest
structurally imbalanced with around 97% dependence on brown coal reserves in the Czech Republic; and
imported oil and gas. A number of direct and indirect SOKOLOVSKÁ UHELNÁ, the smallest of the brown coal
measures are being adopted to reduce energy import mining companies. All five companies are publicly listed or
dependence, including: increased energy efficiency, the in private ownership. The majority state-owned utility
promotion of renewable energy sources which already company, ČEZ, is the largest coal consumer in the Czech
account for more than the targeted 13% share in final energy Republic and the most important Czech supplier of
consumption by 2020, and the efficient use of indigenous electricity.
solid fuel resources, mainly brown coal.
Hard coal
In 2018, 49.5% of national gross electricity production of
88.0 TWh came from coal-fired power plants with a total
The Czech Republic has 23 million tonnes of economically
capacity of approximately 10.0 GW, including those using
recoverable hard coal reserves, with the largest deposits
coal gas. Fossil gas-fired power generation had a 4.3%
located in the Upper Silesian coal basin. Having an area of
share. Nuclear power plants supplied 34.0% of gross
6 500 square kilometres, this coal basin ranks among the
generation and 11.8% came from renewable energy sources
largest in Europe. A major part is located in Poland, while
including hydro. After rapid growth from 2009 to 2011,
about one sixth (1 200 square kilometres) lies in the Czech
output from solar PV has stagnated, with 2.3 TWh in 2018
Republic where it is called the Ostrava-Karviná basin (after
when output from wind turbines was just 0.6 TWh.
the city of Ostrava and the town of Karviná). Here,
OSTRAVSKO-KARVINSKÉ DOLY (OKD) extracts hard coal
There are five coal mining companies in the Czech Republic, from three deep mines: Karviná, Darkov and ČSM. A fourth
including OSTRAVSKO-KARVINSKÉ DOLY, the only hard mine, Paskov, stopped production in March 2017. In 2018,
coal producer, and four brown coal mining companies: OKD’s saleable output was 4.5 million tonnes, with a
SEVEROČESKÉ DOLY, the biggest producer of brown coal, workforce of 6 895 own employees and 2 200 contractors.
European Association for Coal and Lignite 25Coal industry across Europe
The thickness of worked coal seams at Karviná mine ranges Czech Republic
from 1.5 to 6.5 metres. Production at OKD mines is mainly
Coal resources and reserves as at 1.1.2018
longwall with shearer loaders, combined with controlled
caving. The last longwall working with a plough finished in Resources hard coal Mt 1 437
October 2019 and “room and pillar” trials have ended. Raw Resources lignite Mt 2 210
coal is washed in coal preparation plants at ČSM and Darkov Reserves hard coal Mt 23
mines and is sold as coking coal or steam coal, based on its Reserves lignite Mt 682
quality parameters.
Primary energy production 2018
Brown coal and lignite Total primary energy production Mtce 39.4
Hard coal (saleable output) Mt / Mtce 4.4 / 4.0
The Czech Republic has 682 million tonnes of economically Lignite (saleable output) Mt / Mtce 39.2 / 16.7
recoverable brown coal reserves. In addition to a coal basin
in North Bohemia and another basin near the town of Saleable coal quality
Sokolov, there are coalfields in the south of the country,
Hard coal net calorific value kJ/kg 25 490-32 070
although these are not economically viable. Production of
brown coal totalled 39.2 million tonnes in 2018, providing an Lignite net calorific value kJ/kg 11 600-20 560
important contribution to the country’s energy supply. Hard coal ash content % a.r. 4.3-18.9
Lignite ash content % a.r. 6.0-37.8
The main brown coal deposit and the largest mining area, Hard coal moisture content % a.r. 3.5-9.9
covering 1 400 square kilometres, is the North Bohemian Lignite moisture content % a.r. 26.5-38.3
brown coal basin, which is located at the foothills of the Hard coal sulphur content % a.r. 0.42-0.43
Krušné hory mountains, along the border with the German Lignite sulphur content % a.r. 0.78-1.44
state of Saxony, in the vicinity of the towns of Kadaň,
Chomutov, Most, Teplice and Ústí nad Labem. The coal
seams in this area lie at depths of up to 400 metres and are Coal imports / exports 2018
between 15 and 30 metres thick. Hard coal imports Mt 3.8
Hard coal exports Mt 1.9
Brown coal is extracted in the central part of the North
Bohemian brown coal basin by two mining companies,
Primary energy consumption 2018
VRŠANSKÁ UHELNÁ (VUAS) and SEVERNÍ
ENERGETICKÁ (SEAS). Both are members of the vertically Total primary energy consumption Mtce 61.8
integrated SEV.EN ENERGY GROUP and together employ Hard coal consumption Mtce 5.7
2 700 people for coal production out of a total group Lignite consumption Mtce 16.4
workforce of 3 140 in 2018.
Power supply 2018
SEAS exploits the country’s largest brown coal deposit at its
ČSA surface mine, which holds reserves of 750 million Total gross power generation TWh 88.0
tonnes of good quality brown coal with an energy content of Net power imports (exports) TWh (13.9)
up to 17 500 kJ/kg. These reserves are sufficient to support Total power consumption TWh 74.1
production for the next one hundred years. However, Power generation from hard coal TWh 5.8
reserves within the current mining limits, which were Power generation from lignite TWh 37.7
approved in 1991, will last until 2024. A total of 3.7 million Hard coal power generation capacity MW 1 200
tonnes was produced in 2018.
Lignite power generation capacity MW 8 450
VUAS extracts brown coal at the Vršany surface mine. Its
coal reserves within existing mining limits have the longest Employment 2018
remaining life of any in the Czech Republic. In 2013, the Direct in hard coal mining thousand 6.757
company entered into a fifty-year coal supply agreement with Direct in lignite mining thousand 7.147
the ČEZ Počerady power station (5 × 200 MW). This long-
term contract secures the future of Vršany mine through to
its depletion and brings economic stability to the North
Bohemian region. In 2018, VUAS extracted 7.8 million In 2019, SEV.EN ENERGY GROUP expanded its portfolio
tonnes of brown coal. by acquiring two heat and power plants: a 516 MW coal-
and gas-fired plant at Kladno near Prague and a 64 MW
The SEV.EN ENERGY GROUP also operates the 820 MW plant at the city of Zlín in eastern Moravia.
Chvaletice brown coal power plant which is undergoing an
extensive modernisation programme to reduce emissions The brown coal mining company SEVEROČESKÉ DOLY
and meet stringent European environmental standards with (SD) based in the town of Chomutov operates in the North
the aim of extending its life to 2030. Bohemian brown coal basin, northwest of Prague. SD
26 7th editionYou can also read