Traditional livestock systems in Tanzania; - The Economics of ...
←
→
Page content transcription
If your browser does not render page correctly, please read the page content below
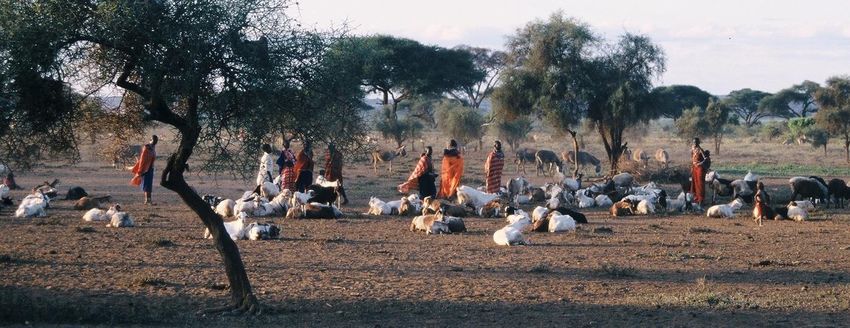
Traditional livestock systems in Tanzania;
An application of the TEEB Framework

Baltussen, W.1, S. van Berkum1, Y. Dijkxhoorn1, R. Helmes1, Ş. Özkan Gülzari2, T.
Vellinga2, G.D. Massawe3, P. Galgani4; D. Borniotto4; F. van den Elzen4 and T.
Smith4

1
 Wageningen Economic Research
2
 Wageningen Livestock Research
3
 Sokoine University of Agriculture
4
 True Price / Impact Institute

Photo credit: Bob Denaro (Maasai Village, 16 Sep 2007, available at:
https://www.flickr.com/photos/15174316@N02/1593920157/in/photostream/)
Acknowledgements: We acknowledge the EU for funding this research and report and the EC
commitments towards the sustainability development goals, Aichi targets and the agri-environmental
schemes in the common agricultural policy.

The authors accept no liability for any damage resulting from the use of the results of this study or the
application of the advice contained in it. This study was commissioned by UNEP TEEB and was carried
out by Wageningen University & Research, Sokoine University of Agriculture and True Price/Impact
Institute. Information and views set out in this study do not necessarily reflect the official opinion of
UNEP TEEB nor the EU.

Reviewers: James Vause1, Jacob Salcone2, Salman Hussain2, William Speller2, Carl Obst3, Harpinder
Sandhu4, Urvashi Rangan5, Pablo Vidueira6

Copy editor: Lucy Cockerell2

1
 UNEP-WCMC
2
 UNEP - The Economics of Ecosystems and Biodiversity (TEEB)
3
 IDEEA
4
 Flinders University
5
 GRACE Communications
6
 Global Alliance for the Future of Food

 2
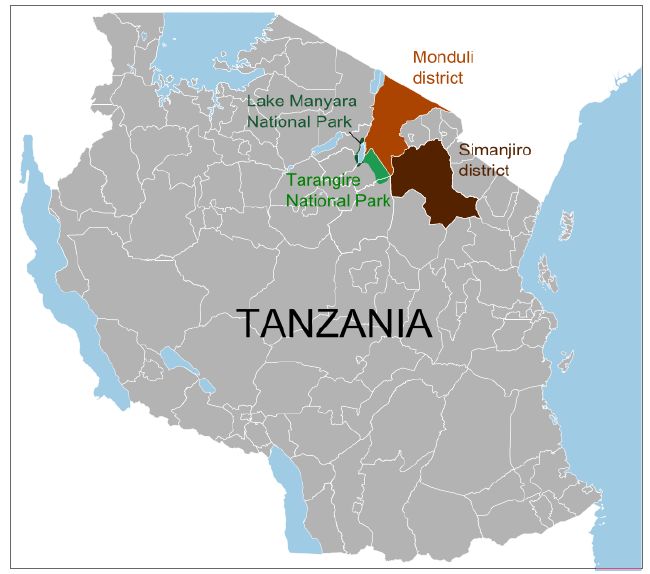
Table of Contents
Natural and capital valuation glossary .................................................................................................... 6
1 Introduction ..................................................................................................................................... 7
 1.1 Background.............................................................................................................................. 7
 1.2 Objective and scope of the evaluation .................................................................................... 7
 1.3 Method .................................................................................................................................... 8
 1.3.1 Framework....................................................................................................................... 8
 1.3.2 Approach ......................................................................................................................... 9
 1.3.3 Limitations ..................................................................................................................... 13
 1.3.4 Reading guide ................................................................................................................ 14
2 Systems description....................................................................................................................... 15
 2.1 The pastoral cattle system .................................................................................................... 15
 2.1.1 Introduction ................................................................................................................... 15
 2.1.2 Livestock genetic resources........................................................................................... 16
 2.1.3 Maasai pastoral herds and flock characteristics ........................................................... 16
 2.1.4 Pastoralists’ meat and milk production......................................................................... 16
 2.1.5 Market structures and value chains for Maasai pastoralists’ cattle ............................. 18
 2.1.6 Value chain actors along the pastoral cattle value chain .............................................. 19
 2.1.7 Consumption ................................................................................................................. 20
 2.1.8 Pastoral cattle feeding strategies .................................................................................. 20
 2.1.9 Extension services ......................................................................................................... 21
 2.1.10 Scoping definition for the further evaluation ............................................................... 22
 2.2 The backyard poultry system ................................................................................................ 23
 2.2.1 Introduction ................................................................................................................... 23
 2.2.2 Chicken populations in Tanzania ................................................................................... 24
 2.2.3 Production ..................................................................................................................... 25
 2.2.4 Consumption ................................................................................................................. 26
 2.2.5 Poultry feeds.................................................................................................................. 27
 2.2.6 Veterinary ...................................................................................................................... 27
 2.2.7 Extension services ......................................................................................................... 28
 2.2.8 Scoping definition for the further evaluation ............................................................... 29
 2.3 The smallholder arable dairy system .................................................................................... 30
 2.3.1 Introduction ................................................................................................................... 30
 2.3.2 Other livestock species in the smallholder arable dairy system beside cattle .............. 31
 2.3.3 Crop production in the smallholder arable dairy system .............................................. 31
 2.3.4 Breeding practices ......................................................................................................... 31
 2.3.5 Milk production ............................................................................................................. 32
 2.3.6 Labour ............................................................................................................................ 33
 2.3.7 Dairy value chain in Tanzania: the case of the Southern Highlands.............................. 33
 2.3.8 Consumption ................................................................................................................. 34
 2.3.9 Smallholder dairy cattle feeding strategy ..................................................................... 35
 2.3.10 Veterinary ...................................................................................................................... 35
 2.3.11 Extension services ......................................................................................................... 36
 2.3.12 Scoping definition for the further evaluation ............................................................... 36

 3
3 Produced and financial capital assessment................................................................................... 38
 3.1 Pastoral livestock systems ..................................................................................................... 38
 3.1.1 Pastoral beef value chain .............................................................................................. 38
 3.1.2 Pastoral household income ........................................................................................... 39
 3.1.3 Improved scenario ......................................................................................................... 40
 3.1.4 Evaluation of the produced capital stocks .................................................................... 41
 3.1.5 Summary........................................................................................................................ 42
 3.2 Backyard poultry systems...................................................................................................... 42
 3.2.1 The backyard poultry value chain ................................................................................. 42
 3.2.2 Contribution to household income ............................................................................... 43
 3.2.3 Improved scenario ......................................................................................................... 44
 3.2.4 Evaluation of the produced capital stocks .................................................................... 45
 3.2.5 Summary........................................................................................................................ 45
 3.3 Smallholder dairy systems ..................................................................................................... 45
 3.3.1 The traditional dairy value chain ................................................................................... 45
 3.3.2 Milk income ................................................................................................................... 46
 3.3.3 Improved scenario ......................................................................................................... 47
 3.3.4 Evaluation of the produced capital stocks .................................................................... 49
 3.3.5 Summary........................................................................................................................ 49
 3.4 Synthesis ................................................................................................................................ 49
4 Natural capital assessment ........................................................................................................... 51
 4.1 The pastoral cattle system .................................................................................................... 51
 4.1.1 Assumptions .................................................................................................................. 51
 4.1.2 Results ........................................................................................................................... 52
 4.2 Ecosystem services of pastoralism ........................................................................................ 53
 4.2.1 Context .......................................................................................................................... 53
 4.2.2 Data sources .................................................................................................................. 54
 4.2.3 Results ........................................................................................................................... 55
 4.3 The backyard poultry system ................................................................................................ 56
 4.3.1 Assumptions .................................................................................................................. 56
 4.3.2 Results ........................................................................................................................... 57
 4.4 The smallholder dairy system................................................................................................ 58
 4.4.1 Assumptions .................................................................................................................. 58
 4.4.2 Results ........................................................................................................................... 59
 4.5 Biodiversity assessment ........................................................................................................ 61
5 Human and social capital assessment ........................................................................................... 62
 5.1 Human capital assessment .................................................................................................... 62
 5.1.1 Education and skills ....................................................................................................... 62
 5.1.2 Human health ................................................................................................................ 63
 5.1.3 Working conditions ....................................................................................................... 63
 5.1.4 Conclusion ..................................................................................................................... 63

 4
5.2 Social capital assessment ...................................................................................................... 64
 5.2.1 Food security ................................................................................................................. 64
 5.2.2 Social cooperation ......................................................................................................... 66
 5.2.3 Institutions, laws and regulations ................................................................................. 66
 5.2.4 Conclusion ..................................................................................................................... 66
6 Policy options ................................................................................................................................ 67
 6.1 Introduction ........................................................................................................................... 67
 6.2 Input provision ...................................................................................................................... 68
 6.3 Extension service development ............................................................................................ 69
7 Conclusions.................................................................................................................................... 71
 7.1 Pastoral cattle system ........................................................................................................... 71
 7.2 Backyard poultry system ....................................................................................................... 72
 7.3 Smallholder dairy system ...................................................................................................... 72
 7.4 Policy options ........................................................................................................................ 73
References ............................................................................................................................................. 75
Annex 1: Data tables for livestock scenarios ......................................................................................... 81
Annex 2: Results tables for livestock scenarios ..................................................................................... 84
Annex 3: Ecosystem services of pastoralism methodology .................................................................. 92

 5
Natural and capital valuation glossary
 • Ecosystem services: Ecosystem services are “the direct and indirect contributions of
 ecosystems to human well-being” (De Groot et al., 2010). Examples of ecosystem services are
 food provisioning, carbon regulation and recreation.
 • Natural capital: The naturally occurring living and non-living components of the Earth, together
 constituting the biophysical environment, which may provide benefits to humanity (SEEA
 definition). Natural capital can also be defined as “the stock of natural ecosystems on earth
 including air, land, soil, biodiversity and geological resources. This stock underpins our
 economy and society by producing value for people, both directly and indirectly” (NCC, 2014).
 Natural capital includes the extent and condition of ecosystems that provide ecosystem
 services.
 • Externalities: An externality arises when the actions of one economic agent in society impose
 costs or benefits on other agent(s) in society, and these costs or benefits are not fully
 compensated for and thus do not factor into that agent’s decision-making (Hussain and Miller,
 2014). External costs and benefits are called negative and positive externalities, respectively.
 • Invisible costs and benefits: Costs and benefits are considered invisible when not captured in
 financial transactions or cost-benefit analysis and therefore not taken into account in common
 decisions making. Examples of invisible costs and benefits relevant for livestock systems are
 greenhouse gas (GHG) emissions and landscape management.
 • Visible costs and benefits: Costs and benefits captured in the market. Examples of visible
 benefits relevant for livestock systems are food provisioning and raw materials. Examples of
 visible costs are compound feed or medicines.
 • Natural capital costs or impacts: Natural capital costs express in monetary terms the impacts
 on natural capital that are produced by livestock systems, as a result of resource use and
 pollutant emissions (units in $). Natural capital costs captured in this study are external to the
 market, thus are invisible costs.
 • Income: The amount of earnings available to the household. For a household farm, this
 represents the profit after all costs have been deducted from revenues. Since labour mostly
 exists of family labour its value is not subtracted. Income can be derived from financial
 activities or from in-kind consumptions.
 o In-kind income: The income derived from sources other than monetary income. In the
 case of smallholder farms, it is what households save from consuming their own
 production. For pastoralism, this also includes materials such as animal skins.
 o Financial income: Share of the household income that is monetary, calculated as
 revenues from sales derived from economic activities minus the costs incurred for
 those activities. As such, it is equivalent to the profit of the household’s economic
 activities.
 • Financial revenue: The monetary revenue derived from sales of products.
 • Full-time equivalent (FTE): A unit that indicates the workload of an employed person and is
 calculated as the ratio between the total paid hours during a period and standard full-time
 working hours in the same period. When not specified otherwise, 1 FTE refers to one person
 working full time for one year.
 • Price mark-ups: The difference between the price of product purchased and the price of the
 product resold.

 6
1 Introduction
1.1 Background
Tanzania’s population is growing fast, as is the average income per capita (see Table 1.1). These factors
are associated with increased demand for animal proteins (meat, fish, milk, milk products and eggs), a
trend which is expected to continue (Cockx et al., 2017). Most animal products consumed in Tanzania
are produced in the country, largely by traditional livestock systems that are characterised by low-
input use and low yields.

Table 1.1: Key macroeconomic indicators Tanzania
 2008 2014 2015 2016 2017
 Gross domestic product (GDP,
 27,368.4 48,219.7 45,623.5 47,388.4 52,090.3
 current in million $)
 GDP growth (annual %) 5.6 7.0 7.0 7.0 7.1
 Agriculture as part of GDP (%) 24.8 25.8 26.7 27.4 24.8
 GNI per capita, PPP (current int. $) 1,890 2,500 2,610 2,740 2,920
 Population (in million) 43.3 52.2 53.9 55.6 57.3
 Population growth (annual %) 3.2 3.1 3.1 3.1 3.1
 Urban population (% of total) 26.8 30.9 31.6 32.3 33.1
 Employment in agriculture (%) 71.4 68.1 67.8 67.5 66.9
 Cattle (heads) 18,800,000 25,800,000 26,713,644 26,697,483 26,399,523
 Chicken (heads) 32,500 36,000 36,389 37,113 37,146
Source: World Bank

An important question is how traditional livestock systems in Tanzania can benefit from the expected
increase of demand for animal proteins while at the same time avoiding negative environmental and
socio-economic impacts. These kind of questions need a ‘holistic’ or ‘system thinking’ approach that is
offered by ‘The Economics of Ecosystems and Biodiversity for Agriculture and Food’ (TEEBAgriFood)
valuation framework.1 Former analysis of the livestock sector in Tanzania (such as Da Silva, Desta and
Stapleton (2017), Nadonde, Gebru and Stapleton (2017) and Katjiuongua and Signe (2014)) are limited
to economic and physical evaluations with a high risk that hidden costs for ecosystems or livelihoods
are not taken into account. The TEEB framework illuminates how the components of a system – the
social, the human, economic and natural dimensions – are interconnected.

1.2 Objective and scope of the evaluation
The study ‘Valuation of livestock eco-agri-food systems: Poultry, beef and dairy’ (Baltussen et al., 2017)
describes externalities until the farm gate2 of livestock systems for different developing countries,
including Tanzania. The Economics of Ecosystem and Biodiversity (TEEB) requested to expand upon
the previous study for Tanzania in terms of impacts and externalities to be analysed across the value
chain. This study takes into account the entire value chain including supplying industries (e.g. feed
industry), farmers, middlemen/traders, processors, retail and consumers.

1
 Chapter 6 of the ‘TEEB for agriculture & food; scientific and economic foundations report’
(http://teebweb.org/agrifood/) presents the assessment framework in detail.
2
 Farm gate means the total food value chain until the produce leave the farm.

 7
The objective of this study is to evaluate the socio-economic and environmental impacts of value chain
activities related to three livestock sectors in Tanzania using the TEEBAgriFood evaluation framework.
The aim is to improve decision-making in livestock production policies, to enhance its viability, not just
economically but also socially and environmentally. The three different livestock production systems
studied, are:

 • The pastoral cattle system (Maasai);
 • The backyard poultry system; and
 • The smallholder dairy system.

By applying a mix of traditional techniques, these systems provide animal protein to a large section of
Tanzania’s population, both rural and urban. This TEEBAgriFood study (i) provides input for the
synthesis of African case studies, (ii) quantifies the value of social and environmental externalities of
livestock systems so they are accounted for in decision-making, and (iii) assesses the various types of
interventions that might be used to capture these values, leading to sustainable food production and
improved livelihoods.

1.3 Method
1.3.1 Framework

This evaluation follows the TEEBAgriFood framework, (see Figure 6.7 in the TEEB Foundations report,
2018). The TEEBAgriFood evaluation framework has been developed to better capture the value of
natural, human and social capital that contribute to and are impacted by agricultural value chains.
Value chain activities are mostly evaluated for their contribution to economic output. Sometimes social
impacts are evaluated but their full impact on all the natural capital is often neglected. By highlighting
all relevant components of the value chain and the non-market social and environmental impacts of
food systems across that value chain, the TEEBAgriFood evaluation framework allows for a better
understanding of and forecasting of the outcomes of policy and business decisions.

The framework seeks to review the interdependencies between human (economic and social) systems,
agriculture and food systems, and biodiversity and ecosystems services and environment. In doing so,
it addresses the economic invisibility of many of these links while exploring how biodiversity and key
ecosystem services deliver benefits to the agriculture sector and beyond, itself being a key contributor
to human health, livelihoods and well-being. In the framework the following capital dimensions are
distinguished:

 a. Produced and financial capital;
 b. Natural capital (e.g. GHG emissions, biodiversity and ecosystems services);
 c. Human capital; and
 d. Social capital.

The descriptive use of the framework tends to focus on stocks, flows and outcomes, while the
analytical use of the framework tends to focus on outcomes and impacts of agri-food systems on
human wellbeing. In both uses, all stages of the agri-food value chain are intended to be covered, from
production through to final consumption and human health. The figure below summarizes and
visualizes the linkages between the stocks, flows, outcomes and impacts.

 8
Figure 1.1: TEEBAgriFood schematic showing the eco-agri-food system nexus. Source: TEEB

1.3.2 Approach

For the initial assessment of the socio-economic and environmental impacts, we considered the
current value chain of the three traditional livestock production systems. We do not compare the three
systems with each other, but for each system, we evaluate an improved production scenario. This
production scenario is hypothetical in the sense that the average farmer produces less efficiently, but
there are already a few farmers who are able to produce conforming to the improved production
scenario. Next to the initial assessment of the current impacts, we considered improved livestock
systems based on small technical improvements that could contribute significantly to a more efficient
livestock production system.

Effects on produced and financial capital
We will describe the flows of the stocks for each value chain, including change of the value in
machinery and equipment, infrastructure, research and development, and finance. For all value chains,
this will be evaluated in a qualitative way.

Effects on produced and financial capital are quantified by assessing the typical income of each value
chain actor including financial and in-kind household income, price mark-up, cost of labour, purchased
inputs and asset value of livestock. This was built upon by the addition of several data sources for both
the calculation of contributions to the value chain and profit and loss (P&L) accounts for households.
A more detailed overview of data sources used can be found towards the end of this section. The
potential impact of improved scenarios is assessed looking at expected changes in household income
and costs. All the results in Chapter 3 express changes in income based on changes in revenues and
costs. Annex 2 gives detailed information of all the evaluated flows within the income changes.

Effects on natural capital
For the environmental modelling, the Global Livestock Environmental Assessment Model (GLEAM) was
used to evaluate the effects of change in feed and herd dynamics on GHG emissions, covering the three

 9
major GHGs from agri-food chains, namely methane (CH4), nitrous oxide (N2O) and carbon dioxide
(CO2) (Gerber et al., 2013). The methods used in GLEAM to calculate the GHG emissions are mainly
sourced from the Intergovernmental Panel on Climate Change (IPCC) guidelines (IPCC, 2006; IPCC,
2007).

The model is built on five modules (Gerber et al., 2013): the herd module, the manure module, the
feed module, the system module and the allocation module. Once the herd structure (e.g. number of
animals in each cohort) and animal characteristics (e.g. live weight, mortality rate etc.) are defined,
energy requirements for each animal category are calculated in the system module. The model
presumes that the energy requirements of animals are met, which is not necessarily the case in
Tanzania. The user inputs the proportions of feed items used to feed the animals in the feed inventory
containing data associated with the production of each feed ingredient. The information on herd
structure, manure, animal and feed characteristics is used in the system module to calculate the
amount of animal products produced per year. Subsequently, the emissions associated with manure
management, enteric fermentation and feed production are estimated. Energy use on farm is added
to the total emissions, which are then allocated to co-products and services in the allocation module.
Allocation in this study was based on protein content. Emissions intensity i.e. emissions produced per
unit of product are reported as a final output. Land-use change was not part of this assessment at farm
level. However, for the system, the implications on pastoral land management and biodiversity in the
context of regional land use change trends are presented in the landscape level assessment of
ecosystem services of pastoralism (explained below).

We will describe other relevant positive and negative environmental externalities related to the
following natural capital stocks for each value chain (for a complete overview of the flows see Figure
6.1 in TEEB (2018):

 • Fresh water (incl. quality, quantity);
 • Soil (incl. quality, quantity);
 • Air;
 • Vegetation cover and habitat quality;
 • Biodiversity (quantitative by referring to Globio Model output as described in Baltussen et al.,
 20173);
 • Land use based on general land and agricultural statistics;

The ecosystem services of the pastoral livestock system have been assessed as part of the natural
capital assessment. This assessment builds on the innovative natural capital analysis of the Maasai
steppe that was developed in the previous TEEB global livestock study (Baltussen et al. 2017, explained
in True Price, 2016) to quantify key positive externalities of grassland management carried out by
pastoralists at the landscape level. The results presented in this report add one additional layer to the
above-mentioned analysis, taking the perspective of the value chain of pastoral meat and, in particular,
that of meat consumption in the region. Past research shows evidence that pastoral livestock systems
maintain natural capital stocks better than sedentary farming, as farming in the region has shown to
have two main negative effects on the environment: the decline of wildlife migratory corridors and
land degradation (Msoffe, 2010; Msoffe et al., 2011; FAO, 2009).

3
 GLOBIO is a tool to assess past, present and future impacts of human activities on biodiversity. For our study
we only used it to assess the present situation because we only considered livestock activities at farm level and
not other human activities such as arable farming, mining, climate change.

 10
The Maasai steppe is a biodiversity rich area, hosting some of the most visited National Parks in
Tanzania. Grassland areas used by pastoralists for grazing act as migratory corridors that allow large
mammals such as wildebeest, elephants and zebras to graze outside National Parks in the wet season.
However, only five of the nine migratory corridors that existed in 1988 were still open in the 2000s,
due to the expansion of sedentary farming and the shrinking of pastoralists rangeland (trends that are
continuing today), leading to a steep decline of wildlife populations (Msoffe et al., 2011). In terms of
ecosystem services, this can be translated into effects on the economic potential of the national parks.
Besides the decline of wildlife corridors, another prominent effect of land use change in the region is
land degradation. As land in the Maasai Steppe is generally arid and not particularly suited for farming
or keeping concentrated livestock, agriculture is characterized by low productivity and declining soil
fertility. Degraded land that can no longer be used for farming or grazing, is systematically abandoned
(Msoffe, 2010; FAO, 2009). In terms of ecosystem services, this can be linked to lower food production
and lower land carbon stocks stored in soil and biomass. Based on this research, we analyse natural
capital effects of pastoralism looking at these three types of ecosystem services: contribution to
tourism, carbon storage and land degradation prevention. These represent key flows from natural
capital to human well-being in this region that are protected by pastoralism4.

The following question is asked: what is the value of landscape-level positive externalities of
pastoralism compared to sedentary farming per unit of meat produced in that region? To answer this
question, we quantify tourism, carbon storage and land degradation prevention, as monetary benefits
per kg of meat produced. These ecosystem services represent quantifiable positive impacts on natural
capital of pastoral livestock systems compared to sedentary agriculture in the same region. The results
can be compared to household income and the retail price of meat. The methodology used for each of
the three ecosystem services is summarized below and presented in detail in Annex 3. The assessment
of ecosystem services of the pastoral cattle system focusses on the baseline scenario, as it was outside
the scope of this project to also gather the data required to assess the improved scenario.

Contribution to tourism. Tourism revenues, based on biodiversity, come from investments in tourism
infrastructure and labour, but also from the existence of wildlife corridors and wet season grazing areas
that are outside national parks and under pastoral management. These grazing areas are used by
pastoralists for their herds and frequented by wildlife and as such increase the area of the habitat
available to elephants, wildebeests, giraffes and other animals. Wildlife populations in turn, contribute
to attract visitors in the two National Parks in the region. In other words, pastoralist rangelands allow
to sustain larger wildlife populations than those that would be viable if sedentary farming would take
the place of pastoral livestock herding. Contribution to tourism can therefore, be quantified as a side
flow of economic benefits to pastoral food production.

Carbon storage. Potential carbon losses are very large if current land conversion trends continue. Up
to 35% of the regional area could be converted to sedentary farming according to FAO (2009). As
discussed in Baltussen et al. (2017), carbon is removed from agricultural land through crops and crop

4
 Contribution to tourism, carbon storage and land degradation prevention represent two of the three categories of ecosystem services
of the TEEBAgriFood framework: cultural and regulating ecosystem services. The third type, provisioning services, had been
quantified for Maasai pastoralism in Baltussen et al. (2017) through a range of animal products (meat, milk, skins and blood, which is
in certain cases consumed by Maasai) and grassland products. In this case we consider beef as the denominator of the analysis (e.g.
results are per kg of meat produced) while we exclude the other provisioning services, as these were found to be marginal compared
to beef. Other ecosystem services of Maasai rangeland that may be important but could not be quantified are water cycle regulation
and carbon sequestration.

 11
residues. Additionally, ploughing the land increases soil micro-organism respiration and decreases soil
carbon stocks. By managing grasslands to graze their livestock and by preventing land from being
converted to cropland, the pastoral system allows for maintenance of soil carbon stocks. Carbon
storage is quantified by looking at the difference between the original carbon stocks of grasslands and
the final carbon stocks after land converted to cropland has become unfit for agricultural purposes,
and dividing these by the total food output in this period.

Land degradation prevention. Beyond the loss of soil carbon stock, areas converted to agricultural
land lose productivity over time. The prevention of land degradation is a positive externality of pastoral
systems. Grassland converted to farmland in this region has been shown to become abandoned after
only 20 years of farming, by which time it has become unfit for agricultural purposes (Msoffe, 2010).
The value of preventing land degradation of pastoral grassland management is quantified as the
difference in depreciation of the natural capital value of land of an average hectare of grassland and
an average hectare of farmland over the respective amount of food produced in a period of 20 years.
The natural capital value of land is defined as the present value of food provisioning ecosystem services
over that time period with a discount rate of 2.5%. A more detailed explanation is provided in Annex
3.

Improved scenario
For each livestock system, a baseline value representing the current situation is compared to an
improved scenario. The improved scenarios have been defined, based on the reference situation for
each of the livestock systems studied, taking into account a realistic development scenario and the
current enabling environment (e.g. education, infrastructure, agricultural policies). We also considered
stocks and flows of the agricultural system, the social system and the ecosystem. As an improved
scenario, we took a number of limited technical improvements within the existing farm structures. The
reasons for this are the following:

 • The ecosystem is sensitive to intensification for land use, for example due to changing the
 pastoral system into sedentary livestock farming that includes arable farming (see also
 Baltussen et al., 2017);
 • 67% of the population still live in rural areas where alternative employment opportunities
 outside the agricultural sector are limited; and
 • Past agricultural policies in Tanzania (e.g. Livestock Strategy (URT, 2010)) have been proven to
 be ineffective until now (see Chapter 6).

To increase food production and to improve the income position of the value chain actors without
harming the social system and the ecosystem, we developed an improved scenario containing the
following aspects:

 • Improving management practices such as better-quality feed and use of medicines to improve
 animal health. For smallholder dairy, we also considered the use of artificial insemination to
 improve the output per unit of input of dairy cattle by introducing improved breeds.
 • Improved knowledge by supporting a well-functioning extension service to support production
 and marketing practices without endangering the environment.
 • We assume that no further investments in infrastructure are needed for the poultry and beef
 value chain. However, for the improved dairy chain it might be necessary to introduce an
 improved milk collection system to keep the milk cool and the process accordingly.

For each of the improved scenarios, specific changes in inputs are given in a footnote in the respective
chapters.

 12
Human and social capital
Human capital and social capital are assessed by describing for each value chain and the differences
between the scenarios in a qualitative matter based on literature and some statistics. Different stocks
are used for describing human capital: education, skills, health, working conditions. For social capital
food security, opportunities for empowerment, social cooperation, institutions, law and regulations
(child labour) are evaluated.

Data sources
For all assessments, we used different models to assess the change in the conditions of the capital
dimensions and impacts. Overall, the background data on the economic dimensions of each system
(including ecosystem services contributions) was drawn from the previous study (Baltussen et al.,
2017), for example the number of livestock in each system, nutritional information as well as several
of the outputs from each agricultural system for households. This was built upon using a large set of
secondary data collected during a literature review and presented in the following Chapters. In Annex
2, an overview is given per stock or flow on what issue for what part of the value chain is taken into
account and what type of information will be delivered. This is more or less the same for all three
cases: the pastoral cattle system, the backyard poultry system and the smallholder dairy system. For
backyard poultry, a majority of additional data was drawn from Queenan (2016) for both the value
chain construction and P&L calculation, in-kind income, in terms of prices for sale and purchase,
consumption rates of goods, as well as outputs from poultry. Further data was sourced for flock
productivity for the P&L accounts (Alemayehu et al., 2018; Guni et al., 2013). For smallholder dairy,
most data were sourced from IFAD (2016) for both the value chain and P&L, in terms of the pricing of
cattle and goods produced, in-kind income, as well as input costs. Value chain data was supplemented
with milk consumer prices from Katjiuongua and Signe (2014). For pastoralism, data for both the value
chain and P&L were primarily sourced from Meshack (2015) as well as Chapters 1, 6, 8 and 9 from ILRI’s
1991 book ‘Maasai herding - An analysis of the livestock production system of Maasai pastoralists in
eastern Kajiado District, Kenya’. The P&L account needed to be supplemented with further data on
average meat prices (PINGO’s Forum, 2016), total livestock units (ILRI, 1991), as well as outputs of
sheep and cattle in pastoral herds in terms of milk and skins (Akliku, 2002; Mdoe and Mnenwa, 2007;
Liljestrand, 2012; Tungu et al., 2016). All income figures were compared with benchmark minimum
wages for agricultural services (WageIndicator, 2018), pastoral herder wages (FAO, 2007), and average
rural household income (Lusambo, 2016).

1.3.3 Limitations

Our approach offers a high level of detail, but also has some limitations:

 • The scope of the valuation is partial. Although the descriptions of the systems do cover a broad
 range of natural capital-livestock linkages, the impacts that could be quantified and monetized
 are limited. However, this does not influence the reliability of the results and it is important to
 keep in mind that other aspects (e.g. other income sources) should also be considered when
 drawing conclusions.
 • The focus is on one type of benefit. Livestock is mainly kept for food provision, and therefore
 animal protein was chosen as the functional unit for this assessment. However, there are other
 benefits that humans derive from animal husbandry, which are overlooked if we limit our
 scope to the ratio between external costs and food output. Animal traction and the use of
 manure as fuel or as soil amendment could also be assessed monetarily from the bottom-up.
 The same holds for the quality of food produced, as contribution to human health could also

 13
be included in the assessment of invisible benefits. Including into the picture these other
 benefits, in addition to the production of animal protein, would result in a more complete
 assessment but also introduce many methodological challenges related to the choice of a
 functional unit and system boundaries.
 • Direct comparability is limited. The bottom-up valuation quantitatively assesses and compares
 the different livestock systems. The results are expressed in the same unit ($/kg of protein)
 and can be compared. However, the systems capture livestock systems in very different
 contexts, with their own economic and ecological constraints, and the systems do not
 necessarily substitute each other.
 • System boundaries differ, and are not exactly the same for each natural capital aspect valued.

1.3.4 Reading guide

Based on the scope determined, the report is structured as follows:

 • Chapter 2 describes the current value chain context of agri-food production systems for the
 three livestock systems;
 • In Chapter 3, 4 and 5 we assess the impacts and dependencies between financial, natural,
 social and human capital systems for each livestock system;
 • Chapter 6 provides a narrative on the Theory of Change, i.e. opportunities for policy
 interventions to capture the visible and invisible values of nature in decision-making, leading
 to better livelihood outcomes; and
 • The report ends with the conclusions in Chapter 7.

 14
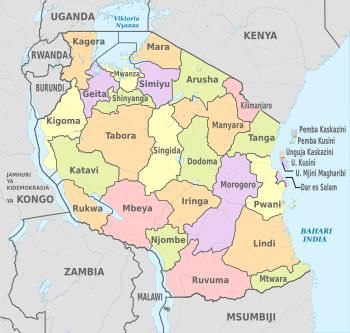
2 Systems description
2.1 The pastoral cattle system
2.1.1 Introduction

Livestock production in Tanzania falls under three sub-systems namely commercial ranching,
pastoralism and agro-pastoralism. Commercial ranching constitutes around 2% of all livestock activities
in Tanzania. The remaining proportion is occupied by either pastoralism or agro-pastoralism.
Pastoralism is practiced in areas characterized by poor soils and insufficient rainfall, which are areas
that are normally unfit for crop cultivation. Therefore, livestock are mainly kept for subsistence,
storage of wealth and cash earnings. The most popular livestock are cattle, goat, sheep and poultry.
The United Nations Industrial Development Organization (UNIDO) defines ‘pastoralism’ as a traditional
cattle production system, which relies entirely on natural pasture for animal rearing (UNIDO, 2012).

In Tanzania, about 50% of the households keep livestock and of these livestock-keeping households,
14% belongs to pastoral communities mainly living in the arid, semi-arid and dry regions (PINGO’s
Forum, 2016). Pastoral communities in Tanzania are multi-ethnic in nature and Maasai is the
dominating pastoral ethnic community. A study conducted in the North of Tanzania indicates that
almost all pastoral households own cattle, goats and sheep (Mkonyi et al., 2017). More than 70% of
the total cattle herd in the country are found in the eight regions namely; Arusha, Dodoma, Manyara,
Mara, Mwanza, Shinyanga, Singida and Tabora (Figure 2.1) (URT, 2010).

Figure 2.1: Regions of Tanzania. More than 70% of the total cattle herd in the country are found in
Arusha, Dodoma, Manyara, Mara, Mwanza, Shinyanga, Singida and Tabora. Source: URT (2010)

Over 95% of meat from cattle, sheep and goats in Tanzania comes from local breeds of animals mainly
reared under extensive conditions in the pastoral, agro-pastoral and smallholder dairy systems
(PINGO’s Forum, 2016; Trevor, 2015). It is estimated that over 90% of cattle herds in Tanzania are kept
by pastoralists who supply the bulk of meat consumed in the country (Wakhungu et al., 2014).

 15
Likewise, beef production in Tanzania is overwhelmingly the domain of small-scale traditional
producers. It is estimated that up to 99% of red meat production is obtained from the traditional sector
and there are prospects this situation will continue long into the future (Trevor, 2015).

2.1.2 Livestock genetic resources

The main cattle breeds kept by Maasai people and other pastoralists in the country are the Zebu and
Ankole breeds (PINGO’s Forum, 2016; Trevor, 2015). There have been efforts at breed modification
through the promotion of the use of ‘improved’ Boran bulls mainly from Tanzania National Ranching
Company (NARCO) and from few available private commercial ranches.

Tanzania has the third largest livestock population on the African continent comprising about 25
million cattle. A large share comprises of goats: 16-17 million, of which over 98% are indigenous goats
belonging to the Small East African (SEA) breed. The SEA goats are widely distributed in all agro-
ecological zones of the country and are kept mainly by pastoralists, agro-pastoralists and farmers
engaged in mixed farming. According to Chenyambuga and Lekule (2014) the most important purpose
for keeping goats in pastoral and agro-pastoral communities is provision of cash income obtained from
sales of live animals and meat. Pastoralists also keep goats as savings to be drawn upon in times of
need. Goats are also important for the production of meat for home consumption. They are also used
for payment of dowry, to cater for traditional/cultural ceremonies and to provide skins, milk and
manure (Chenyambuga and Lekule, 2014). In the pastoral community, goat milk is normally for home
consumption.

2.1.3 Maasai pastoral herds and flock characteristics

Livestock numbers kept by pastoralists vary across households but consistently cattle is a dominant
livestock species (Mkonyi et al., 2017). A group of households together typically own 300 head of
cattle, 50 sheep and 60 goats (Baltussen et al., 2017). It is uncertain how many households would be
in such a group of households because the characteristics of pastoral groups may not align with the
regular understanding of a household. Based on sources about pastoral communities in Kenya and
Tanzania, the number of households in the reference group of households is most likely within the
range of 3-9, where the reported household size is around 14 people (Achiba, 2018; McCabe et al.,
2010; Kaimba et al., 2011).

Table 2.1: Livestock per household group (herd size)
 Animal Type Animals
 Cattle 300
 Goat 60
 Sheep 50
Source: Baltussen et al. (2017)

2.1.4 Pastoralists’ meat and milk production

In addition to the production of meat (and milk, hides and skins), livestock have many other important
outputs including their functions as draught animals, provision of manure, repositories of wealth,
dowry payments, rituals and media of exchange (Trevor, 2015). Pastoral cattle grow slowly and in a
classic gain-loss-gain pattern according to the rhythm of the seasons and the passage of the years.
Male cattle may reach a maximum of 416 kg live weight (though the common range is between 240
and 270 kg) at slaughter age normally from 6 to 7 years (Baltussen et al., 2017; Trevor, 2015; URT,
2013). Females can reach a maximum of 320 kg, but 160—180 kg is a common range. Pastoralists’

 16
cattle produce little milk and meat but they are well adapted to the environment and long periods of
harsh environments. In pastoral management systems, there are high mortality rates (8—10% in young
and adult stock and around 25% in calves), coupled with an annual calving rate of less than 50%. These
factors limit herd growth and more importantly commercial offtake. Dressing percentages5 are
generally about 46-47% in carcasses of 100—175 kg, whilst a few better-fed animals can give a carcass
yield of 50% (Trevor, 2015; URT, 2013) (Table 2.2).

Table 2.2: Production parameters of cattle under pastoralist system in Tanzania
 Production parameter Estimate
 Calving rate (%) 40-50
 Calving interval (months) 18-24
 Calf mortality rate (%) 25
 Pre - weaning mortality (%) 25-40
 Adult mortality (%) 8-10
 Mature weight (kg) 320-416
 Carcass weight (kg) 100 - 175
 Offtake rate (%) 8-10
 Age at first calving (months) 30
 Lactation length (days) 400
 Age at weaning (days) 180-210
 Average milk production (litres/year/cow) 200
 Age at slaughter (years) 6-7
Source: Baltussen et al. (2017); PINGO’s Forum (2016) and URT (2013)

The average weight of a mature goat is 24 kg. These animals are good browsers, and are also somewhat
prolific breeders and produce enough milk for twins (to which they often give birth) to grow at a
reasonable growth rate and be ready for slaughter at an age of 8 to 12 months (URT, 2013).
Pastoralists’ goats are tolerant of harsh conditions and of some diseases, and obtain their nutrients
from a variety of shrubs, herbs and grasses. Most goats slaughtered for meat are young males that
normally yield a carcass of around 15 kg per animal (Table 2.3) (Trevor, 2015). There is insufficient
information with regard to goat milk production among the pastoral community, which could be
associated with the fact that pastoralists mainly keep local breeds of goats that are more suited for
meat production.

Table 2.3: Production parameters of goat under the traditional sector in Tanzania
 Production Parameter Estimate
 Kidding rate (%) 100-150
 Age at slaughter (months) 8-12
 Average live weight (kg/animal) 24
 Off-take rate (%) 15
 Average carcass weight (kg) 12-15
 Average kid mortality (%) 20-40
 Average adult mortality (%) 8-15
Source: PINGO’s Forum (2016); Trevor (2015); URT (2013) and URT (2015)

5
 A dressing rate represents the meat and skeletal portion of an animal compared to its live weight.

 17
The fat-tailed sheep reared by pastoralists are neither as hardy as goats nor as prolific (reproduction),
as single births are typically the rule. The fat-tailed sheep are resistant to worms (helminths) that may
be present in some other types of sheep. Mature live weights are almost the same as those of goats
but growth rates are slow and carcass quality is not particularly good. Most sheep slaughters occur at
the age approaching 12 months and provide a carcass of 10-12 kg, as can be seen in Table 2.4 (Trevor,
2015; URT, 2013).

Table 2.4: Production parameters of sheep under the traditional sector in Tanzania
 Production Parameter Estimate
 Lambing rate (%) 100
 Age at slaughter (months) 12
 Average live weight (kg/animal) 24
 Off-take rate (%) 25
 Average carcass weight (kg) 10-12
 Lamb mortality (%) 20-40
Source: URT (2013) Tanzania

Poultry, specifically chickens, are also raised by a large number of Maasai pastoralists, a practice that
was not common in the Maasai land some decades ago. However, there is a tendency for Maasai men
to say they do not have poultry, despite chickens running all around the boma. This is because poultry
are largely owned by the women and are not considered livestock by the men. Likewise, there is a
widespread perception among the Maasai men that chickens are the livestock for the poor and
associate chickens with poverty (Kirwa et al., 2010). However, more and more households are
developing an interest in chicken farming. Chicken raised by Maasai pastoralists often share the same
production parameters as others raised in the traditional backyard system. The eggs laid by these
chicken ranges from 12 to 15 per clutch and there are on average three clutches per hen per year.

2.1.5 Market structures and value chains for Maasai pastoralists’ cattle

Tanzania mainland has in total 475 livestock markets countrywide, of which 464 are primary livestock
markets and the rest are either secondary or terminal livestock markets (PINGO’s Forum, 2016). The
primary markets are normally characterized by sellers and buyers mainly from pastoralists themselves
from within the market area; and a low price of livestock marketed. The buyer in the primary markets
has higher bargaining power because the demand is lower than the supply, and the number of sellers
is high compared to the number of buyers. In the secondary market there are more buyers so the seller
and buyer share almost equal bargaining power due to higher demand. The terminal markets involve
mostly livestock dealers that sell to local traders, international traders and slaughterhouses who buy
and sell animal in bulk, and sometimes retail buyers can also be found here.

In this paragraph, we discuss the case of Arusha and surrounding regions in Northern Tanzania since
this is the most important pastoral area in Tanzania (see Figure 2.2). Arusha Region ranks second in
the total number of livestock unit in Tanzania. In terms of cattle only, it ranks number four after
Shinyanga, Tabora and Mwanza regions. It also ranks first and second respectively in the number of
goats and sheep (Allegretti et al., 2016). Arusha district and municipal council has one of the only
modern public abattoirs in Tanzania which slaughters and processes meat for both internal and export
markets. Its capacity is around 200 cattle and 200 other ruminants per day which is equivalent to
60,000 cattle and 60,000 other ruminants per year, respectively (PINGO’s Forum, 2016).

 18
Figure 2.2: The livestock market in Arusha/Manyara regions. Source: PINGO’s Forum (2016)

2.1.6 Value chain actors along the pastoral cattle value chain

Different actors exist in the pastoralists’ cattle value chain in the Arusha region. The major actors in
the chain are producers (farmers), middlemen (cattle traders), abattoirs, butchers, supermarkets,
hotels and individual consumers (final consumers). However, middlemen have the greatest market
power and are the primary source of market information. The characteristics of each of the actors are
as follows:

Producers (Pastoralists): Pastoralists in Arusha (Monduli and Longido Districts) supply cattle to the
primary markets around their districts and subsequently the animals are bought by traders who send
them directly to Meserani secondary market or fatten some cattle that weigh too little, before re-
selling them at higher prices.

Cattle traders: Pastoralists in the Monduli and Longido districts sell their animals to traders in the
primary or secondary markets in their proximity. Markets are dominated by middlemen who contact
pastoralists everywhere in the district, but only 10% of pastoralists manage to meet traders. In
practice, most pastoralists (85%) sell their cattle to middlemen. Hence, in most cases traders buy the
animals from middlemen at primary or secondary markets, and assemble and transport them to the
terminal markets. Traders purchase four to eight animals or more in a given market day depending on
the arrangement of a particular day and place. On average, cattle weighing about 200 kg cost about
TZS 450,000. In most cases, they have the financial power to deal with their customers, including

 19
You can also read


