Soil Country Analyses Belgium - Anna Rita Gentile, Sara Barceló-Cordón, Marc Van Liedekerke - JRC Publications Repository
←
→
Page content transcription
If your browser does not render page correctly, please read the page content below
Soil Country Analyses
               Belgium

Anna Rita Gentile, Sara Barceló-Cordón, Marc Van Liedekerke

                                                       EUR 23959 EN/2 - 2009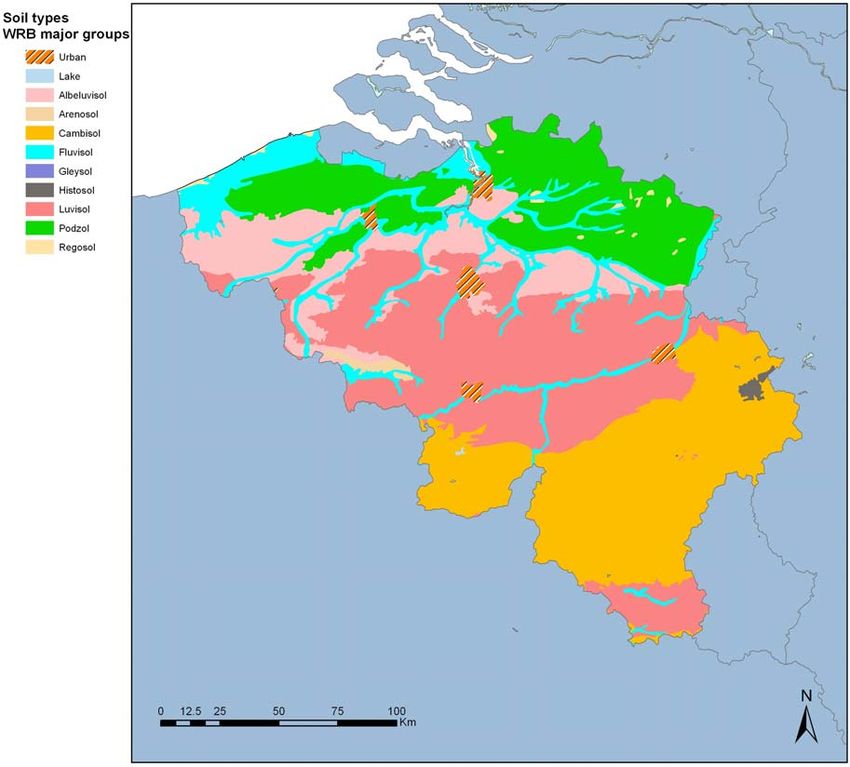
Soil Country Analyses
       Belgium
The mission of the JRC-IES is to provide scientific-technical support to the European Union’s
policies for the protection and sustainable development of the European and global
environment.

European Commission
Joint Research Centre
Institute for Environment and Sustainability

Contact information
Address: Joint Research Centre, TP 280, Via E. Fermi 2749, 21027 Ispra (VA) Italy
E-mail: marc.van-liedekerke@jrc.ec.europa.eu
Tel.: +39 0332 785179
Fax: +39 0332 786394

http://ies.jrc.ec.europa.eu/
http://www.jrc.ec.europa.eu/

Legal Notice
Neither the European Commission nor any person acting on behalf of the Commission is
responsible for the use which might be made of this publication.

                       Europe Direct is a service to help you find answers
                          to your questions about the European Union

                                          Freephone number (*):
                                             00 800 6 7 8 9 10 11

     (*) Certain mobile telephone operators do not allow access to 00 800 numbers or these calls may be billed.

A great deal of additional information on the European Union is available on the Internet.
It can be accessed through the Europa server http://europa.eu/

JRC 53315

EUR 23959 EN/2
ISBN 978-92-79-12980-3
ISSN 1018-5593
DOI 10.2788/27334

Luxembourg: Office for Official Publications of the European Communities

© European Communities, 2009

Reproduction is authorised provided the source is acknowledged

Printed in Italy
TABLE OF CONTENTS
Introduction ................................................................................................................................ 1
Organization of the report.......................................................................................................... 3
Authors and contributors ........................................................................................................... 4
Note from the editors ................................................................................................................. 5
1. THE GENERAL CONTEXT .............................................................................................. 7
1.1. Soil description ......................................................................................................... 8
2. THE STATUS OF SOIL RESOURCES .......................................................................... 12
2.1. A snapshot of the status of soil in the country ....................................................... 12
2.2. The threats to soil................................................................................................... 14
2.2.1. Contamination ............................................................................................... 14
2.2.2. Salinisation .................................................................................................... 18
2.2.3. Erosion........................................................................................................... 18
2.2.4. Decline in soil organic matter ........................................................................ 20
2.2.5. Sealing........................................................................................................... 21
2.2.6. Hydro-geological risks ................................................................................... 22
2.3. Cross-cutting issues............................................................................................... 23
2.3.1. Brownfields .................................................................................................... 23
2.4. Soil services ........................................................................................................... 24
2.5. Hot spots ................................................................................................................ 25
2.5.1. Heavy metal contamination in the north of Flanders..................................... 25
2.6. Outlooks ................................................................................................................. 26
2.6.1. Integrated management of contaminated land and urban redevelopment ... 26
3. POLICY INSTRUMENTS AND INTERNATIONAL COOPERATION ............................. 27
3.1. Environmental policy .............................................................................................. 27
3.2. Soil policy instruments ........................................................................................... 27
3.2.1. Soil legislation................................................................................................ 27
3.2.2. Soil policy targets .......................................................................................... 30
3.2.3. Market based instruments for soil protection................................................. 32
3.3. International co-operation ...................................................................................... 38
4. SOIL MANAGEMENT, MONITORING AND ACCESS TO ENVIRONMENTAL
INFORMATION........................................................................................................................ 40
4.1. Soil management ................................................................................................... 40
4.1.1. Contaminated sites........................................................................................ 40
4.2. Soil monitoring........................................................................................................ 42
4.2.1. Wallonia ......................................................................................................... 43
4.3. Information, education and data access ................................................................ 44
4.3.1. Flanders......................................................................................................... 44
4.3.2. Wallonia ......................................................................................................... 45
5. STATE OF THE ENVIRONMENT .................................................................................. 46
6. ECONOMY AND SOCIETY ............................................................................................ 50
6.1. A snapshot of the country socio-economic development....................................... 50
6.1.1. Social background ......................................................................................... 50
6.1.2. Historical economic background ................................................................... 50
6.1.3. Current economy ........................................................................................... 52
6.2. Economic statistics by sector ................................................................................. 53
6.2.1. Agriculture ..................................................................................................... 53
6.2.2. Transport ....................................................................................................... 54
6.2.3. Energy ........................................................................................................... 54
6.2.4. Industry .......................................................................................................... 54
6.2.5. Trade ............................................................................................................. 55
6.2.6. Tourism.......................................................................................................... 55
6.2.7. Waste............................................................................................................. 56
7. LAND USE ...................................................................................................................... 58
7.1. Land use changes .................................................................................................. 58
REFERENCES ........................................................................................................................ 60APPENDIX 1. Soil contamination from local sources.............................................................. 62 APPENDIX 2. Market Based Instruments (MBI) Fact sheets.................................................. 65 APPENDIX 3. Country review of European datasets for soil erosion, decline in organic matter and hidrogeological risks ......................................................................................................... 75 APPENDIX 4. Socio-economic indicators ............................................................................... 78 APPENDIX 5. Additional information....................................................................................... 81 List of tables Table 1. Facts and figures ....................................................................................................... 10 Table 2. Erosion risk class in agricultural land ........................................................................ 19 Table 3. Soil carbon content in arable land in Flanders (%of soil samples) ........................... 20 Table 4. Population density ..................................................................................................... 22 Table 5. Soil sealing ................................................................................................................ 22 Table 6. MBI overview ............................................................................................................. 34 Table 7. Environmental indicators ........................................................................................... 47 Table 8. Relevant statistics 1990-2000 by land cover class in ha........................................... 59 List of maps Map 1. Map of Belgium.............................................................................................................. 7 Map 2. Soil Map of Belgium....................................................................................................... 9 List of boxes Box 1. Soil targets included in the current MINA plan in Flanders ............................................ 1 Box 2. BeNeKempen: a cross-border partnership to remediate contaminated land............... 38 Box 3. The Wallonia-Quebec Collaboration Project ................................................................ 39
Introduction

The state of soil in Europe is influenced by its diversity, distribution and specific vulnerabilities
across the region, as well as the diversity of geology, climate, topography and the availability
of other natural resources. Soil conditions are also determined by the spatial distribution and
intensity of the economic activities, together with the underlying social political, legislative,
financial, scientific and institutional frameworks within individual countries. Given the cross-
cutting nature of the soil environment and the many users and sectors exploiting soil
resources, providing comprehensive assessments on soil in Europe or at the national level is
a difficult task.

The DPSIR (Driving forces-Pressures-State-Impacts-Responses) approach has been widely
used to carry out integrated environmental assessments. This approach requires the
integration of socio-economic information on driving forces and pressures with: media-specific
information on state and impacts; information on the impacts of environmental degradation on
society and information on responses and their effects.

On the other hand, data on the different aspects of soil at the pan-European scale are scarce
and patchy. In particular, the information currently available is not sufficient to cover all the
                                                                         1
soil threats nominated in the EU Thematic Strategy for Soil Protection and socio-economic
aspects are in general not taken into account. This scarcity of the policy-relevant information
has prevented so far the production of a comprehensive assessment on soil in Europe.

In order to approach this challenge, in early 2007, the European Environment Agency (EEA)
initiated the preparation of soil country analyses in close collaboration with the EIONET.

The EEA started the process by putting together available information on the different soil
aspects. This information was loaded into a customised questionnaire for each country. The
countries were then asked to review the information and provide additional data where
possible.

The so-called “Soil Country Analyses” reports are the final outcome of this process. Each
report offers an overview of the status of soil resources at the national level and touches the
aspects presented in the Soil Thematic Strategy. These include the main soil threats, the
different soil policy instruments (also economic instruments) in force, and the specific soil
management programmes and monitoring activities implemented or planned in each country.

Putting together this wide range of information from diverse sources has not been an easy
exercise, and the EIONET countries have made considerable efforts over a period of two
years.

The completeness and quality of the information which underpins the analyses is variable,
reflecting the range of resources and information available at the national level. The positive
outcomes of the exercise are many:
    •   The information provided by the countries filled many of the existing data gaps and
        provided the basis for preparing the soil country reports;
    •   For the first time, soil information spanning across the aspects of the EU Soil
        Thematic Strategy is available from one place, thus facilitating analysis and further
        use;
    •   The completed questionnaires plus the country reports are available as input to
        national activities (e.g. preparation of national State of the Environment Reports);

1
 COM(2006) 231. Communication from the Commission to the Council, the European Parliament, the
European Economic and Social Committee and the Committee of the Regions – Thematic Strategy for
Soil Protection. Commission of the European Communities. Brussels, 22.9.2006

                                                                                                   1
• Comprehensive lists of national data sources have been collected and can be used
for further processing in European and national projects;
• The Information provided by the countries helped the validation of the data already
available and has in some countries led to improvements in data reporting processes,
in particular by enhancing the contacts between national institutions;
• Information is now available to support the European State of the Environment
Report.
In parallel to this exercise, the European Commission’s DG Environment (ENV), DG Joint
Research Centre (JRC) and Eurostat, together with the European Environment Agency (EEA)
decided at the end of 2005 to establish “Environmental Data Centres” to ensure the provision
of robust data and information on the state of the environment for the development of
environmental policies at European Union level. In that context, the European Soil Data
Centre (ESDAC) was established at the JRC.
In the "EIONET Workshop on Soil" held on 18 September 2007 2 with representatives from
DG ENV, the EEA and the JRC, together with representatives from the EIONET 'National
Reference Centres for Soil' and members of the Steering Committee of the 'European Soil
Bureau Network', the EEA and the JRC jointly decided that all soil data management activities
carried out by the EEA in collaboration with EIONET were to be transferred to the JRC.
Following that decision, in the “EIONET workshop on Soil” organized by the JRC IES on the
4-5 of March, 2009 3 , the representatives of the EIONET National Reference Centres for Soil
agreed on the joint JRC-EEA publication of the Soil Country Analyses under the “Scientific
and Technical Reports” series of the JRC. The final edition of the reports and the inclusion,
where relevant, of additional soil information available at the SOIL Action was the contribution
of the JRC to the publication of the Soil Country Analyses. They are also made available
online at the European Soil Portal (http://eusoils.jrc.ec.europa.eu/).
2
All the material from the workshop can be found at
http://eusoils.jrc.ec.europa.eu/library/data/eionet/Workshop2007.htm
3
All the material of the workshop can be found at
http://eusoils.jrc.ec.europa.eu/library/data/eionet/Workshop2009.htm
2Organization of the report
Section 1 presents a brief description of the general situation in the country. It is aimed at
capturing the main context features which have an influence on the environment, with specific
reference to the status of soil resources.
Section 2 contains a summary of the status of soil resources, including priorities, challenges,
problems, and success stories. It presents information on the following specific issues:
• the eight threats identified in the Soil Thematic Strategy (compaction, contamination,
erosion, depletion of soil organic matter, loss of soil biodiversity, salinisation, floods
and landslides, and soil sealing)
• cross-cutting and complex issues such as desertification (where relevant)
• impacts of sectors of activity that are relevant in the country
• case studies/success stories. Specific documentation that is related to issues of
particular interest or that describes an emergent or underestimated issue that is worth
telling (e.g. surface mining in Germany)
Section 3 provides a brief overview on legislation, market-based and in general economic
instruments to protect soils (e.g. remediation funds, subsidies, etc.), as well as international
activities.
Section 4 contains information on management and monitoring programmes with particular
reference to programmes aimed at soil resources (e.g. the water basin management
programmes, national inventories of contaminated sites) and major factors that hinder the
access to relevant information (e.g. confidentiality issues).
Section 5 presents information on the status of the main environmental issues in the country,
including priorities, challenges, problems, success stories.
Section 6 presents brief overviews and relevant statistics of main sectors of activity and main
industries and a snapshot of the social features, including characteristics of the population
such as lifestyles and consumption patterns. The sectors that are likely to be relevant to soil
are agriculture, energy production, transport, tourism, households, chemical industry, etc. It
includes information on industrial development and economic evolution (historical).
Section 7 presents information on land use changes.
The report has four appendices. The first one details information on local soil contamination,
since a reporting process has been going on in the EEA since 2000 and more detailed
information is available. The second appendix provides a detailed factsheet on the different
Market Based Instruments presented in section 3, when this information is available. Finally,
the third and fourth appendices offer some comments provided by the country experts on
different datasets available at European level: on soil threats in appendix 3 and on socio-
economic information in appendix 4.
3Authors and contributors This report was prepared by Anna Rita Gentile, European Environment Agency, on the basis of the information available in December 2006. Comments and additional and recent information were provided by Belgium through an ad-hoc questionnaire. Sara Barceló-Cordón and Marc Van Liedekerke, Joint Research Centre, completed and revised the report for its publication. Contributors: European Environment Agency: BSS secretariat, IDS (IT support), Sheila Cryan (Reportnet and Eionet liason) National experts: Eddy Van Dyck and Marijke Cardon (OVAM) for Flanders; Vincent Brahy, Emmanuel Maes (MRW/DGRNE) for Wallonia; Jan Voet (IRCEL-Belgian National Focal Point EEA & EIONET). Other experts: Hendrik Neven (ALBON); Els Gommeren, Victor Dries, Geert Van Soom, Patriek Casier and Sam Fonteyne (OVAM). 4
Note from the editors

Belgium is a federation of three regions: Flanders, Wallonia and the Brussels-Capital Region
(comprising the capital and its metropolitan area). Environmental policy is devolved to the
regions and therefore, in this report, most of the information is presented separately for each
region. The differences in the content and approach of the information regarding the regions
are therefore a result of the different interests and organization of the regional
administrations. In those cases where the Brussels-Capital Region is not mentioned it should
be assumed that the situation is equivalent to that of Flanders (in which this small region is
geographically embedded) or that the Brussels region has not developed a policy for the
discussed issue.

                                                                                             5
6
1. THE GENERAL CONTEXT
Belgium is located on the southeast bank of the North Sea. Almost the entire country lies in
the basins of the two main rivers, the Scheldt and the Meuse, which enter it at the French
border and then flow northeast to the Dutch border. The country is almost flat, with its highest
point at nearly 700 meters above sea level. However, due to the great variation in topography,
geology and soil types, it has a large variety of landscapes. Geographically, three main
regions can be distinguished. The northern lowland plains (up to 50 m of altitude), or Lower
Belgium, stretches from the flat and fertile polders in the west to the poor sandy soils in the
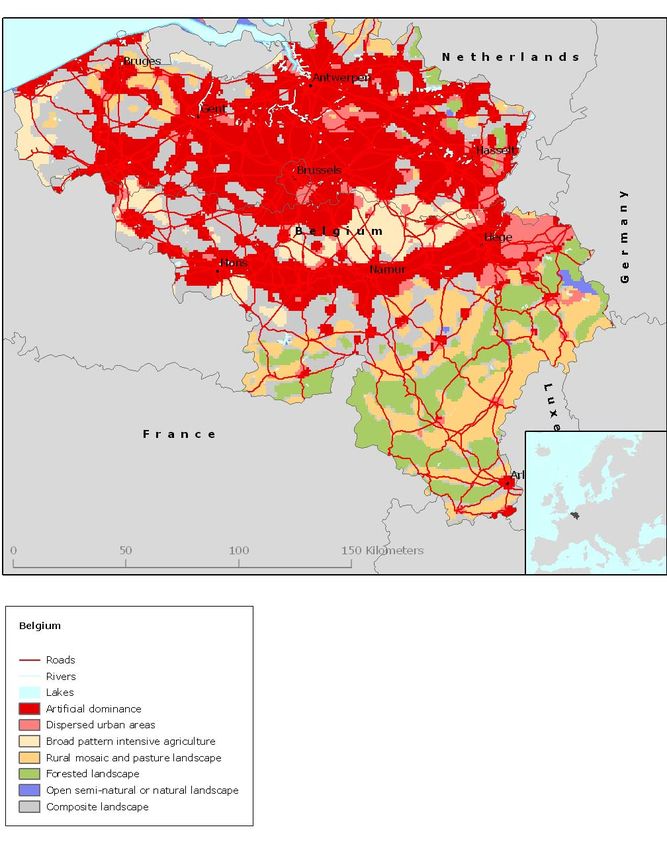
Map 1. Dominant Landscape types of Belgium. Source: EEA (Year: 2007).
7east. This region is mainly characterised by sands and sandy loams, with slopes that rarely
exceed 2 %, and a mixed land use. Agricultural areas are predominant in the west, while
forests are mainly found in the east; the extent of urban areas is also relevant. The central
plateau, or Central Belgium (50-200 m), includes densely urbanised areas, as well as
farmlands in the west and the east. This region is characterised by a hilly landscape, created
by south-north running rivers, with slopes in general steeper than 5 % that can reach 15-25 %
in some areas. Loess-derived Luvisols are the main soil types and agriculture is the main land
use (dominant crops: winter wheat, maize, sugar beet and potatoes). Located further to the
south, Upper Belgium (200-700 m) is the most sparsely populated and densely forested
region in Belgium. It comprises the Ardennes and many limestone caves. Cambisols are the
main soil types, while pastures and forests are the main land uses. Cropland is almost
negligible. The slopes can be very steep (over 30 % in some areas).
Belgium has a moderate maritime climate with generally mild temperatures, predominantly
westerly winds and regular rainfall (OECD, 1998; Boardman J. and Poesen J. (eds.), 2006).
The intensity of water use is relatively high due to the high population density.
1.1. Soil description 4
This region is exposed to the cooler and wetter conditions associated with the North Sea. The
dominant soil processes are essentially weathering, leaching, illuviation and podzolisation.
Among the different factors that influence the evolution of the soil of this region are geology,
geomorphology (landforms) and past and present climatic conditions.
Soil from sandy materials exhibit leaching and podzolisation processes leading to the
development of different kinds of Podzols. Sandy regions are extensive in Belgium (sandy
Flanders and Campine), leading to the development of Gleyic and Carbic Podzols. Soil from
loamy-loessic deposits and old alluvium is favourable to a rapid differentiation by clay
illuviation. However, a number of soil types were initially calcareous and have previously
undergone decarbonation, giving rise to progressive desaturation by leaching thus creating
optimum conditions for eluviation. This process is the basis for the differentiation of Luvic
Cambisols and then Haplic Luvisols that appear extensively in Belgium. The resulting
variation in drainage conditions and the associated acidification then allows conditions for soil
degradation with appearance of Haplic Albeluvisols. This loamy soil, as a whole, appears
notably in the so called Belgium loess belt, covering nearly 30 % of the total area of the
country.
Soil from the moderate weathering of different kind of parent materials are relatively weakly
differentiated, without important geochemistry processes, may be saturated or slightly acid,
4
Extracted from Soil Atlas of Europe (2005).
8and mostly dystric in nature. The south-eastern part of Belgium (Condroz, Famenne and
Ardennes) is dominantly a Dystric Cambisol.
Other soil types are typical of more specific pedogenetic processes. The extent of recent
marine formations is very important in Belgium (mostly Calcaric and Eutri-Gleyic Fluvisols).
The coverage of the main soil types in the country is reported in Table 1.
Map 2. Soil Map of Belgium. Source: elaborated from European Soil Database (v.2).
9Table 1. Facts and figures
Item Data and information Sour
ces
Population 10 584 534 2
(inh)
Population 345.5 2
density
(inh/km2) 5 [1]
GDP (Million 275 580.7 2
EUR) [2]
GDP (EUR per 26 100 2
capita) [3]
Administration Federal parliamentary democracy under a constitutional monarchy. As 3
a result of the 1993 constitutional revision that furthered devolution
into a federal state, there are now three levels of government (federal,
regional, and three linguistic communities) with a complex division of
responsibilities.
Geography Crossroads of Western Europe; majority of West European capitals 3
within 1 000 km of Brussels, the seat of both the European Union and
NATO
Borders Land: Total: 1 385 km; border countries: France 620 km, 3
Germany 167 km, Luxembourg 148 km, Netherlands
450 km
Coastline: 66.5 km 3
Climate Temperate; mild winters, cool summers; rainy, humid, cloudy 3
Land use Refer
Land use type Km2 ence
year 2
Total agricultural land 17 361 2000
Arable land 8 635 2000
Total land under forest and other wooded land 6 791 2000
Built-up and related land 5 640 2000
Land used for transport and communication 1 942 2000
Wet open lands 232 2000
Total dry open lands 304 2000
Waters 200 2000
Land area 30 328 2000
Total area 30 528 2000
Dominant
Landscape type % of total area
landscape 1
types [4] A1 - Urban dense areas 39
A2 - Dispersed urban areas 6
B1 - Broad pattern intensive agriculture 7
B2 - Rural mosaic and pasture landscape 14
C1 – Forested landscape 11
C2 - Open semi-natural or natural landscape 0
D1 - Composite landscape 22
Elevation Flat coastal plains in northwest, central rolling hills, rugged mountains
of Ardennes Forest in southeast; 3
lowest point: North Sea 0 m; highest point: Signal de Botrange 694 m
Elevation
Elevation class % total area 1
Breakdown
(%total area) 1 - Low coast 7
2 - High coast 0
5
See Table 2 for more information on population density at the regional level.
10Table 1. Facts and figures
Item Data and information Sour
ces
[5] 3 - Inlands 61
4 - Uplands 32
5 - Mountains 0
Soil resources
Major soil type or ground cover type % total area
[6] 4
Luvisol 30
Cambisol 27
Podzol 11
Fluvisol 11
Albeluvisol 8
Arenosol 4
Other soil and ground cover types [7] 9
Hydrology
Seas
Water
resources
Natural Construction materials, silica sand, carbonates 3
resources
Natural risks Flooding is a threat along rivers and in areas reclaimed from the sea 3,
using concrete dykes. EIO
Some areas are also subject to collapsing terrain (karstic areas), NET
rockslides of rock walls, landslides, and the presence of radon in high
concentrations sometimes.
Protected
areas
Products Sugar beets, fresh vegetables, fruits, grain, tobacco; 3
Agriculture:
beef, veal, pork, milk
Products Engineering and metal products, motor vehicle 3
assembly, transportation equipment, scientific
Industry:
instruments, processed food and beverages, chemicals,
basic metals, textiles, glass, petroleum
Notes [1] See also Section 6 Society and Appendix 4 Socio-economic indicators
[2] Source: ESTAT data. Latest reference year available. Population data refer to
2007; density of population refers to 2005.
[3] At 1995 prices and exchange rates. Source: ESTAT; Reference year: 2006
[4] EEA Major landscape types (EEA, 2006ab)
[5] EEA Elevation classes (EEA, 2006ab)
[6] Soil classification based on the reference soil groups of the World Reference
Base for Soil Resources-WRB (FAO AGL, 2003). EEA elaboration based on
European Soil Database v. 2. Only soil and ground cover types covering at least
2% of total area are explicitly included.
[7] % area less than or equal to 2 %. Leptosols cover about 1.7 %
Sources:
1 EEA
2 ESTAT
3 CIA world factbook web updated 7 September 2006
4 European Soil Database (v. 2)
112. THE STATUS OF SOIL RESOURCES 2.1. A snapshot of the status of soil in the country Flanders Flanders presents a flat to gently sloping relief from sea level (and under sea level for some areas in the Polders) to 130 m above sea level and quaternary soil types (heavy clay, light clay, loam, heavy sandy loam, light sandy loam, loamy sand, sand; sand, sandy loam and loam are predominant). The majority of the soil types present in Flanders have an æolian origin (Würm glacial period), while a small percentage is represented by polder soils (of marine or alluvial origin). The more ancient tertiary soils emerge on eroded hill tops in the loamy or sandy loam areas. The overall climate is a moderate sea climate with a year rain average of 800 mm. Erosion is considered to be the main threat to soil in agricultural areas. The more hilly southern part of Flanders, with loamy and sandy loam soil textures, is sensitive to erosion with varying intensities (one third of the agricultural surface of Flanders is inside an erosion risk area). The flat northern part of Flanders with sandy and/or clay soil texture has no erosion problems. Erosion is a consequence of the steady growing surface of arable land parcels and the growing extent of erosion-prone summer crops, which gives rise to higher soil erodibility in springtime. The loss of multi-functionality of soil by sealing in built-up areas is also considered to be a serious problem. This is a direct consequence of the high population density and the high level of socio- economic activities. The decline in soil organic matter is considered to be another major soil threat. Soil analysis for agricultural and manuring purposes has shown some steady decline of soil organic matter in percent terms in the two last decades. However, this may not correspond to a decrease of the total mass of organic matter in the soil (SOM) 6 . The observed percent decline may be caused by the increase of plough depth, or the substitution of permanent grassland by temporary grassland. Concerns about soil organic matter and erosion have been integrated in cross-compliance actions and in rural development plans. Diffuse contamination is generally limited to small regions. Due to intensive animal husbandry, phosphorous is commonly spread in the soil, but phosphorous saturated soils are only found in 6 Comment from Hendrik Neven: The total mass of SOM is more stable than the carbon content of the top layer, expressed in percent terms. Research studies, targeted at the total mass of organic matter in the entire soil profile and extending over several years, indicate a more constant content with time. 12
some sandy areas. Heavy metals such as cadmium or copper (generally originated by rock
phosphorous or feed supplements) are not considered to be a problem, except in the sandy
Campine area, a region near the Dutch border, where there is a legacy of contamination by non-
ferrous industries. Although it is only indirectly monitored through the monitoring of surface and
ground waters, soil contamination by pesticides is estimated to be widespread in agricultural land.

Soil compaction has always been considered as an individual problem for the farmer and has
rarely been monitored. The relative soil weight is known from several soil bound research
projects. A growing awareness about soil compaction is a consequence of the increased
awareness about soil organic matter and soil erodibility.

Salinisation is a minor problem, confined in the areas close to the North Sea.

The loss of soil biodiversity is not yet monitored, besides a few pilot studies carried out in the
framework of soil quality related research projects (rainworms, etc.).

Wallonia

In the south of the country, the Walloon territory is hillier, with an elevation ranging from 25 to 694
m above sea level (Signal of Botrange: the highest point in Belgium). The underground is
composed of a very wide diversity of geological formations stretching from the Cambrian
(limestones, phyllites, quartzite, shales, sandstones, etc.) to the Quaternary (loess). The diversity
of landscapes and bedrocks has given rise to many different soil types (deep silty soils north of
the Sambre-Meuse furrow, acid pebbly-silty soils in the Ardenne, sandy and clay soils in the
Belgian Lorraine, etc.). There are thirteen major soil associations in Wallonia with marked
differences in terms of chemical, physical, and biological properties.

On the basis of available information, action should be directed primarily towards the restoration
of soil organic matter content, the prevention of the risks of water erosion, the control of diffuse
contamination, and the remediation of contaminated sites. In relation to soil compaction and soil
biodiversity decline, information is still too sparse to allow a complete assessment.

The decreasing amount of soil organic matter (OM) in arable land is a cause for concern,
especially in field crop areas, where most of the soil is depleted (OM content below 2 %). On the
other hand, OM has risen in forests and permanent grassland over the past forty years.

According to the results of a model, in agricultural land soil losses due to water erosion increased
on average from 1.7 to 2.6 tonnes/ha/yr in the period 1971-2000. This trend can be connected to
more abundant and erosive rainfall and decreasing plant cover in arable land (root crops) during
the most critical periods.

It is currently difficult to evaluate the extent of diffuse contamination in the region, given the
absence of regular soil monitoring. Model estimates seem nevertheless indicate a decrease in the

                                                                                                    13
nitrate concentration in the root zone in certain catchment areas, due to reduced fertiliser inputs
and better effluent management. In addition, in general, soil seems not to suffer from (or show the
signs of) major metallic trace element contamination (of airborne or agricultural origin).
The large number of industries that contributed to economic development in Wallonia is estimated
to have left a heavy heritage of contaminated sites, the exact number of which is not yet known.
Whereas the remediation of polluted soils is considered a priority by the regional government and
large sums have been allocated for the clean-up, some structural elements for an effective
contaminated site management are still lacking. The main problems include ineffective
regulations, lack of a centralised inventory, distribution of competences and lack of
communication among stakeholders.
A country review of European datasets relevant to the soil threats is provided in Appendix 3.
2.2. The threats to soil
2.2.1. Contamination
2.2.1.1. Diffuse contamination
From the end of the 19th century to until the late 1970’s, zinc smelters located in the Campine
area, stretching across Flanders and the Netherlands 7 , used thermal processes to extract zinc
from zinc ore (see also section 2.5 and box 2). The processes produced emissions containing
heavy metals such as cadmium, lead and zinc, which caused the diffuse contamination of a vast
area, estimated to cover 350 km2, of which 200 km2 in Flanders and 150 km2 in the Netherlands.
In addition, the residues of the smelting processes, the so called ‘zinc ashes’, were used for road
stabilisation. This practise resulted in the pollution by heavy metals of the soil and the
groundwater around and below the ash-roads. The ashes were used in a region of about 2,600
km2, nearly half of which in Flanders. This area, corresponding to 4 % of the total land area of
Belgium has been contaminated through the deposition of airborne pollutants, dumping in water
channels and the re-use of zinc-ashes. In many places, the concentration of heavy metals in soil
and groundwater still exceeds environmental quality standards.
In the south of the country, the soils located in the industrial basins of Liège and Charleroi often
present metal trace element concentrations above the natural pedological and geochemical
background levels. In these districts, diffuse contamination results primarily from the fall-out of
airborne pollutants from the non-ferrous metallurgy, an industrial activity which has been widely
practised there since the start of the Industrial Revolution.
The deposition of airborne pollutants from the industrial areas of Antwerp and the Ruhr is
contributing to the effects of soil contamination in acid sandy soils. According to the latest report
7
One smelter in Budel.
14on the State of Environment in Flanders (MIRA-T, 2007), in 2004, critical loads for eutrophying
nitrogen were exceeded in 95 % of the total area of terrestrial ecosystems (forests, semi-natural
vegetation, etc.) in Flanders. On the other hand, the critical loads for acidifying compounds
(nitrogen, sulphur) were exceeded in an area corresponding to 59 % of the Flemish terrestrial
ecosystems.
In 2004, almost the entire territory of Wallonia (99 %) received acidifying inputs of nitrogen and
sulphur below the critical load for forest ecosystems, whereas exceedances were observed in
1990 in over 70 % of the forested area 8 . This improvement is explained mainly by the drop in the
emissions of acidifying compounds, especially sulphur compounds. However, in 2004, more than
75 % of the forested areas (mainly located below the Sambre and Meuse River Valleys) and
almost the totality of other semi-natural ecosystems were still affected by exceedances of the
critical load for eutrophying nitrogen. This brings the risks of nitrate leaching into the aquifers,
nutrient imbalances and the loss of biodiversity.
Other causes of contamination include the improper use of pesticides and emissions from
incomplete incineration processes. These latest processes may generate emissions to air
containing polycyclic aromatic hydrocarbons (PAHs), which can be deposited in vast areas. High
concentrations of these pollutants have been found in old residential areas and along main roads.
In residential areas, high concentrations of PAHs are also found in garden paths paved with
materials containing industrial ashes. For several decades, from the 1950’s to the 1970’s, the use
of residues from industrial processes as paving materials, including residues from asbestos
converting companies, was a common practice by local authorities and private households in the
areas surrounding industrial plants. These materials, which were appreciated for their high
mechanical stability and good drainage capability, often included contaminants, thus causing soil
contamination and serious human health problems due to the inhalation of asbestos fibres. The
remediation of the contaminated soils is currently underway by government action.
Agricultural areas are regularly monitored. Due to the heavy use of fertilisers in the past,
especially manure produced by intensive animal husbandry, most of the cultivated areas have
fairly high contents of phosphates. Some localised sandy areas are over-fertilised (phosphate
saturated zones are officially identified in the Flemish region, while work to identify the soils that
are saturated in phosphorus in the Walloon Region is currently under way). Continuous measures
are taken in the context of the Flemish manure law to prevent further excesses of phosphates.
The manure law, implementing the Nitrate Directive (Directive 91/676/EEC), includes limits for the
application of both nitrogen and phosphorus. As a rule, phosphorus application with chemical
fertilisers is prohibited unless soil analysis is performed and a permit is issued by the competent
authority. In groundwater, high concentrations of phosphates are only present in the polders,
8
Blin & Brahy (2007).
15probably due to the specific soil conditions, such as the high concentration of organic matter. In Wallonia, the aquifers are not contaminated by phosphates. Measures are also taken to control copper content in animal feed, as copper contamination was detected in the past. Recent monitoring of groundwater shows that diffuse contamination due to chrome, copper and mercury is almost absent, as it is the case for phosphates 9 . Cadmium, lead, arsenic, zinc and especially nickel are present in higher concentrations (nickel concentrations are higher than the drinking water limits in 30 % of the monitored sites in Flanders but less than 0.5 % of the monitored sites in Wallonia). Some groundwater bodies can be considered to be in a bad status due to the presence of contaminants such as phosphates and zinc. Contamination by pesticides is only monitored in groundwater, sediments in riverbeds and through bio-indicators (e.g. eels). Pesticides were found in 58 % of the 500 groundwater measuring points in Flanders, while 36 % of the 360 measuring points are affected by the presence of pesticides in Wallonia. Desethylatrazine, atrazine, bentazon and AMPA 10 are the main pesticides found in groundwater 11 . In 15 % of the monitoring sites in Flanders, the limits of individual products are exceeded, while the global limits are exceeded in 9 % of the cases. In Wallonia, the limits of individual pesticides are exceeded in 8 % of the monitoring sites and the global limits in only 2 % of the investigated water intakes. 2.2.1.2. Contamination from local sources 12 In Flanders and Brussels, soil contamination requiring clean up is estimated at present at 12 400 sites. Potentially polluting activities are estimated to have occurred at nearly 83 000 sites (including the 12 400 sites already mentioned) and investigation is needed to establish whether remediation is required. Just above 600 sites have been cleaned up since 1995. There is no centralised inventory of contaminated sites in Wallonia. Several inventories have been carried out by different subjects for several purposes. These inventories also include sites where 9 Comment from Vincent Brahy: Soil contamination by phosphates has not affected groundwater quality (except in the Polders Region).This is mainly due to the fact that phosphates are specifically fixed at the surface of iron and aluminium oxy-hydroxides present in the soils. For this reason, they cannot be easily lixiviated to groundwater bodies (when the phosphorus fixation capacity of the (sub) soils is not exceeded of course). As far as heavy metals are concerned, soil contamination ahs not affected groundwater quality in the case of Cr, Cu and Hg but not necessary in the case of Cd, As, Pb, Zn and Ni. Some of these elements are "naturally" present in certain aquifers (dissolution of rocks containing sulphur-bearing minerals for example) but it is still difficult to know if these trace elements are coming from natural or anthropogenic sources. 10 Aminomethylphosphonic acid 11 The monitoring done on most of the groundwater extraction points in the Walloon Region also reveals the appearance of new molecules, such as 2,6-dichlorobenzamide (the main metabolite of dichlobenil), in high concentrations. 12 Unless otherwise specified, numbers in this section refer to the regions of Flanders and Brussels (source: Eionet data flow on contaminated sites 2006). In Flanders, soil contamination requiring clean up is estimated at present at 11 200 sites. Potentially polluting activities are estimated to have occurred at nearly 76 200 sites (including the 11 200 sites already mentioned) and investigation is needed to establish whether remediation is required. Just above 600 sites have been cleaned up since 1995. 16
the soil is little or not contaminated. The inventories list 3 550 brownfield sites (SAED 13 ), 2 500 old
landfills, and 1 500 service stations (Maes et al., 2007). However, it is estimated that the number
of the sites potentially contaminated is much higher, as many sites have not yet been registered 14 .

A wide range of pollution sources have been identified. Industrial production and commercial
services, oil extraction and production, industrial waste disposal and treatment, and power plants
are reported to be the most important sources. In Wallonia, pollution sources also include the old
coal industries (coking plants, gas factories, etc.), and the metallurgical industry and steel mills
which ensured a booming economic growth in the region until the early 20th century.

Heavy metals, polycyclic aromatic hydrocarbons (PAH), mineral oil and aromatic hydrocarbons
(BTEX) are the most frequent soil contaminants at investigated sites.

Information on expenditures for the management of contaminated sites in Belgium is limited. In
Flanders, a quarter of the remediation expenditure comes from public budgets. In Wallonia, the
costs for the remediation of 50 priority sites have been estimated to be 800 million EUR 15 .
Although considerable efforts have been made already, it will take decades to clean up a legacy
of contamination. A detailed assessment is reported in Appendix 1.

13
  SAED = Sites d’activités économiques désaffectés (abandoned economic activity)
14
  Note from Vincent Brahy: The specialised state-funded company, SPAQuE S.A., in charge of orphan sites
and sites that require urgent action due to the presence of relevant health or environmental risks, established
a classification of priority sites, namely based on the estimation of theoretical risks (Auditsol software). The
results of this classification carried out only for the existing SAED inventory (not yet complete) are included
below:
                Type of risk                          Number of sites
 A              High risk                                           253
 B              Moderate risk                                       853
 C              Low risk                                          1 817
 D              Not determined or no risk                           603
15
   Note from Vincent Brahy: It is difficult to provide more information on funding because there are many
budgets, each of them being dedicated to a specific class of sites. Moreover, a specific company has been
created by the regional authority (SOWAFINAL S.A) for contracting loans and boosting soil remediation. A
rough overview of the situation is provided in the table below :
Type of sites                                     Number of sites     Corporation    Funding (EUR)
SAR (Sites à réhabiliter) non pollués à 79 sites (2005)               SOWAFINAL               34 500 000
assainir prioritairement                          70 sites (2006)     SOWAFINAL               64 000 000
SRPE (Sites de Réhabilitation Paysagère et 77 sites (2006)                                    22 700 000
Environnementale)
SAR pollués                                       50 sites (2006)     SPAQuE       +        800 000 000
                                                                      FEDER
Contaminated sites in general                     1207 sites                           Rough estimation:
                                                                                      2.1~3.9 billion EUR
                                                                                           over 30 years
More information is available in the analytical report on the state of the Walloon environment (chapter
SOLS05). (Available at: http://environnement.wallonie.be/eew/rapportProblematique.aspx?id=SOLS_05)

                                                                                                             17
Legislative and budgetary measures were taken in Wallonia in 2005 to accelerate the remediation
of polluted soils. However, the decree on soil remediation has not yet gone into effect. In Brussels,
new legislation has been in force since 2004 16 .
2.2.2. Salinisation
Salinisation is rather a minor concern in Belgium, since this soil threat is present only along the
coastline of the North-Sea. The problem in general originates from or is increased by the
exploitation of groundwater in the coastal areas with the consequent subsoil intrusion of marine
water.
The presence of salts in the topsoil is confined to a small natural area (some 15 ha) in the dune
zone, and some 5 ha of agricultural land in the nearby polders. In the dune zone and the northern
part of the polders, the groundwater sometimes shows a high salt content and therefore it is no
longer suitable for irrigation or animal drinking purposes.
The intrusion of seawater is expected to increase due to the predicted sea level rise consequent
to global warming. Under present climatic conditions, there is no problem of salinisation caused by
irrigation, although quantitative information on salt accumulation in topsoil is not available. On the
other hand, salinisation is known to cause problems in greenhouses with soil cultivation.
2.2.3. Erosion
The localisation, causes and magnitude of soil erosion problems in Belgium reflect the distribution
of the landscapes in the three main geographical regions. Main erosion processes include erosion
due to water, tillage and crop harvesting, while wind erosion affects a small area. In the central
part of the country, characterised by a hilly topography, loess-derived luvisols and a high share of
arable land, soil erosion caused by water and tillage is dominant. In many agricultural catchments,
total water erosion soil loss rates vary between a few to more than 10 tonnes/ha/year. The
average within-field tillage soil redistribution rates are of the same order of magnitude. According
17
to estimates made using a risk model combining water and tillage erosion , the percentage of
16
Information for Brussels can also be found on the web page of the Brussels Institute for the Management
of the Environment, INTERNET: http://www.ibgebim.be. Information for Wallonia can be found on the web
site of the “State of the environment in Wallonia”. INTERNET: http://environnement.wallonie.be/eew
17
Soil loss by water erosion in Belgium is predicted using the RUSLE equation. Hence, this is a risk
indicator, based on modelling without using measured data. However the model was calibrated under
Walloon and Flemish conditions. In the Flemish Region, the soil erodibility factor is estimated from the soil
texture data provided by the digitalized Belgian Soil Map (1:20 000). The topographic factors are derived
from a digital elevation model with a resolution of 5 m, originated by laser-supported topographical
technology. The accuracy of this DEM is high. The crop management factor is simplified by assuming that no
erosion takes place on grassland, and by taking an average C value of 0.37 for all field parcels in arable use.
The agricultural field parcel map results from a yearly inventory of the agricultural land use.
The results of the degree of yearly erosion/ha combine water erosion and tillage erosion. The net downwards
soil flux due to tillage translocation on a hill slope is proportional to the local slope gradient multiplied with the
transport coefficient (500 kg/m/year, assuming that each field parcel is tilled once with a chisel plough and
once with a cultivator per year).
The model used in Wallonia to estimate soil losses (EPICgrid model) differs somewhat from the model used
in the Flemish Region (Watem/Sedem model). The results obtained with these two models are, however,
18agricultural land under risk of erosion varies from about 19 % in Wallonia to nearly 14 % in
Flanders (Table 2).
Table 2. Erosion risk class in agricultural land
Region Low Moderate High All risk classes
Flanders 6.5 7 0.4 13.9
Wallonia 16 3 0.3 19.3
Notes:
Unit: % of agricultural land under risk of water and tillage erosion
Erosion classes: OECD classification
The effects of erosion are mainly concentrated on site in the field parcels (loss of soil from the
fields and accumulation downslope 18 ). Soil erosion by water is also causing the sedimentation of
water bodies and other environmental problems such as muddy floods. Especially after intense
storm events, soil erosion and sediment export rates can reach several tens of tonnes/ha in a
single catchment. Off-farm delivery of eroded soil into the main watercourses is considered to be
the main sediment input, estimated to reach 0.4 million tons per year in Flanders and 0.67 million
tons per year in Wallonia. This estimated erosion sediment corresponds to an erosion rate of 1 to
2 tonnes/ha of arable land in the whole country.
In regions where water and tillage erosion are less important (e.g. in the northern part of Flanders
and the southern part of Wallonia, Famenne-Ardennes), soil erosion caused by crop harvesting is
probably the most important soil degradation process. Mean values of soil losses have been
estimated at 1.4 tonnes/ha/year, while mean values for individual crops (e.g. potatoes, chicory,
carrots, sugar beet) can range from 2 to 16 tonnes/ha per harvest.
In the northern part of Belgium, wind erosion is also observed in many fields, although not many
measurements of its intensity are currently available.
Finally, within two smaller areas – in the Flemish Ardennes, south of Ghent, and in the eastern
part of the country, near Liege and Andenne – several tens of landslides have been identified.
These have an average affected area per landslide of about 5-6 ha. Many of the landslides are
still active and cause damage to private and public infrastructure (Boardman and Poesen, 2006).
Erosion prevention is a major soil policy issue and several anti-erosion actions are being taken,
such as subsidies for small scale anti-erosion works by local authorities, cross-compliance, agri-
environment measures and legislation related to soil protection.
consistent with each other. The EPIC grid model and parameters used in Wallonia are described in detail in
Dautrebande & Sohier (2006).
18
This phenomenon is known as colluviation.
192.2.4. Decline in soil organic matter
Soil organic carbon data from the agricultural advice system on soil fertility provided by the
Belgian Soil Service (BDB vzw) show that the actual carbon content of arable land parcels in
Flanders can be considered fairly good. An average of 70 % of the (randomly) analysed arable
land parcels have a sufficient carbon content (from normal to very high), as shown in Table 3,
which provides the frequency distribution of carbon content in arable land (all soil types), for four
time periods, as percentages of soil samples.
Table 3. Soil carbon content in arable land in Flanders (%of soil samples) 19
Classes 20 /Period 1982-1985 1989-1991 1992-1994 1996-1999
s
Very low 2.0 2.3 1.9 3.3
Low 6.8 6.3 6.0 9.1
Moderate low 13.9 12.3 12.6 17.7
Normal 52.0 50.7 51.7 50.1
Moderate high 22.9 25.8 25.7 18.0
High 2.3 2.4 2.0 1.7
Very high (peaty) 0.1 0.2 0.1 0.1
Note: measured at a soil depth of 23 cm
Source: Belgian Soil Service (BDB)
In Wallonia, a more recent analysis of the total organic carbon (TOC) contents in arable land (at a
depth of 0-25 cm) and grasslands (at a depth of 0-15 cm), carried out in the period 1998-2002,
shows that 84 % of the samples taken from cropland had organic carbon concentrations above
the cut-off value, whereas all the samples taken from meadows contained sufficient amounts of
organic carbon (Colinet et al., 2005).
The data in Table 3 indicate that, in the past two decades, the status of the carbon content in most
of the arable land parcels has been sufficient. However, the percentage of parcels with carbon
content below normal has increased in recent years. This trend has been observed since the
beginning of the 1990s in all soil texture classes. For example, the organic status trend in the
arable land (0-30 cm) in Wallonia reveals an overall 10 % decline in the TOC for the region as a
19
The figures in Table 3, although referring to percentages of soil samples taken in arable land, give a rough
indication on the carbon content in the arable land parcels (several thousands of soil samples are taken
randomly every year).
20
The Belgian soil fertility advice system uses the evaluation classes below for soil organic carbon content
for arable land:
Evaluation classes of the carbon content related to the main soil type/texture classes for arable land
Classification / Sand Loam and Clay
Soil type Sandy-Loam
%C %C %C
Very low < 1.2 < 0.8 < 1.0
Low 1.2 – 1.4 0.8 – 0.9 1.0 – 1.2
Moderate low 1.5 – 1.7 1.0 – 1.1 1.3 – 1.5
Normal 1.8 – 2.8 1.2 – 1.6 1.6 - -2.6
Moderate high 2.5 – 4.5 1.7 – 3.0 2.7 – 4.5
High 4.6 – 10.0 3.1 – 7.0 4.6 – 10.0
Peaty > 10.0 > 7.0 > 10.0
Source: BDB
20whole between 1947 and 2004. This drop concerns above all the Ardennes, Upper Ardennes and
the Jurassic Region.
Although general conclusions should be made with care due to the abrupt nature of the changes
observed, these may be explained by the changing patterns of crop rotations, the historical
conversion of grassland into arable land (especially that under forage crops), changes in
agricultural and horticultural practices (such as deep tilling or the preferential use of inorganic
fertilisers) and the decreasing use of animal manure.
On the other hand, research studies targeted at the total mass of organic carbon in the entire soil
profile (0-90 cm) indicate that carbon content is more constant with time. Regional differences
exist, however. For example, in Wallonia, the total mass of the soil organic matter (to a depth of 1
metre) rose from 137 million tons in 1960 to 163 in 2000. This was mainly due to the rise in the
carbon contents in forest soils. A large proportion of forests are still fairly young and productive,
meaning that the sources of soil organic matter (leaf litter and roots) are rising apace with biomass
production. Another explanation lies in the extensification of forest management, which increases
the return of harvest residues. (Cellule Etat de l’environnement Wallon, 2007). A decreasing trend
of soil carbon mass is also present in grassland parcels, probably caused by an increased grass
renewal.
Due to the importance of a sufficient level of soil organic matter for maintaining soil fertility and in
general for ensuring the sustainable use of soil and combating erosion, compaction, loss of soil
fertility, priority is given to actions for maintaining or increasing soil organic carbon where needed,
up to a reasonable optimal level, depending on the specific circumstances. Actions include agri-
environmental measures, organic farming, and the utilisation of externally produced organic
matter.
Until 2005, green manuring was part of the environmental measures of the regional Plan for Rural
Development. This measure is considered to be no longer necessary since green manuring is
becoming a more common practice.
2.2.5. Sealing
The relatively high proportion of sealed soil in Belgium is related to the limited availability of
space, as it is shown by the high population densities. With an average density of over three times
the average density in the EU27, Belgium is one of the most densely populated countries in
21
Europe after Malta and the Netherlands. Over 97 % of the total population live in urban areas .
The “Flemish Diamond”, the central region situated between Antwerp, Leuven, Brussels and Gent,
is the most densely populated area (see Table 4).
21
In the Wallonia, 56 % of the population living in rural areas and 44 % in urban nuclei (Liège, Charleroi,
Mons, Namur, etc.). In Flanders, the rural areas with smaller communities (‘village’) type cover 60 % of the
total surface, while the main communities (‘city’ type) cover about 40 % of the total surface.
21You can also read