REVIEW ON LCA APPROACHES AND GHG MITIGATION ACTIONS IN SHEEP SUPPLY CHAIN - SHEEPTOSHIP
←
→
Page content transcription
If your browser does not render page correctly, please read the page content below
With the contribution of the LIFE financial
                     instrument of the European Community

                              LIFE15 CCM/IT/000123

                                  Language: IT

Review on LCA approaches
and GHG mitigation actions
in sheep supply chain

     A.2.1 Scientific and technical state of the art
                         update
               Version n. 1, 30-05-2017
                     Language: EN
Authors                                                   Coordinated by:

Dipartimento di Agraria UNISS
Alberto S. Atzori

Agris Sardegna
Giovanni Molle
Mauro Decandia

CNR Ibimet
Enrico Vagnoni
Laura Sanna
Pasquale Arca
Pierpaolo Duce

CNR ISPAAM
Antonello Franca
Claudio Porqueddu

                                Executive summary
       The report analyzes the state of the art of the literature on the environmental
       impact of the sheep supply chain, relatively to global warming. LCA studies on
       sheep productions (meat, wool, milk and cheese, ecosystem services) and on
       post-farm emissions were reviewed and discussed focusing their
       methodological approach and main outcomes. Studies focusing the most
       important biological and technical option for the reduction of methane
       emissions, nitrogen excreta and variation of soil carbon stock were also
       reviewed and discussed. The report allowed to deduce important information
       for the planning of emission mitigation strategies to be applied in dairy sheep
       sector at territorial level in the European sheep farming systems.
Summary
Premises ....................................................................................................................................................... 1
The SheepToShip LIFE project....................................................................................................................1
Livestock and global warming ..................................................................................................................1
Small ruminants and global warming .......................................................................................................2
Scope and structure of the Review............................................................................................................2
Introduction .................................................................................................................................................. 4
Life Cycle Assessment for GHG emission estimation.................................................................................4
1. Literature overview on sheep farming systems LCA studies .............................................................. 6
1.1 Boundaries and contextualization of the impact addressed by LCA ................................................ 11
1.2 Functional units ................................................................................................................................ 12
1.3 The allocation methods .................................................................................................................... 14
1.4 Impact categories and data inventory ............................................................................................. 19
1.5 Hotspots ........................................................................................................................................... 20
1.6 LCA studies on post-farm emissions ................................................................................................. 22
2. Animal emission hotspots ...................................................................................................................... 23
2.1.1 Factors related to animal diet ....................................................................................................... 23
2.1.2 Rumen population modifiers ......................................................................................................... 23
2.1.3 Intake and diet digestibility........................................................................................................... 25
2.1.4 Forages and forage-based diets.................................................................................................... 26
2.1.5 Plant bioactive compounds ........................................................................................................... 28
2.1.6 Level of concentrate supplementation and concentrate to forage ratio ...................................... 34
2.1.7 Concentrate source: lipid-based and starchy concentrates .......................................................... 35
2.1.8 Dietary additives to reduce denitrification and leaching of N in excreta...................................... 36
2.1.9 Dietary additives acting as electron receptors.............................................................................. 37
2.1.10 Generalization of dietary mitigation strategies .......................................................................... 38
3. Non- nutritional factors .................................................................................................................... 39
3.1 Animal genetics ............................................................................................................................ 39
3.2 Animal reproduction management and animal health................................................................ 39
3.3 Generalization of non-nutrition mitigation strategies ..................................................................... 404. Mitigation potentials of managed grasslands ....................................................................................... 41 5. Tailoring mitigation strategies with LCA approaches at territorial level ............................................. 45 6. Conclusions ............................................................................................................................................. 49 7. References .............................................................................................................................................. 50
Premises

The SheepToShip LIFE project
This review represents a deliverable of SheepToShip LIFE (LIFE15 CCM/IT/00123), a project funded
by the European Commission under the LIFE programme - Climate Action - Climate Change
Mitigation.
SheepToShip LIFE seeks to contribute in a practical way to EU climate change objectives by helping
to reduce emissions of greenhouse gases from the sheep farming sector and dairy supply chain in
Sardinia. The main objective of the project is to reduce by 20% in 10 years greenhouse gas (GHG)
emissions (nitrous oxide – N20, methane – CH4 and carbon dioxide – CO2) from the Sardinian
livestock sector and sheep industry.
The immediate objectives of the project are:
     • Encouraging environmental improvements of production systems in the sheep sector and
        demonstrating the environmental, economic and social benefits deriving from eco-
        innovation in the dairy supply chain and sheep farming sector;
     • Promoting the implementation of environmental policies and rural development, guided by
        the life-cycle approach, and aimed at enhancing the environmental quality of local sheep’s
        milk and cheese supply chains;
     • Increasing the level of knowledge and awareness of stakeholders and the general public
        regarding the environmental sustainability of products made from sheep’s milk and their
        contribution to the mitigation of climate change.
SheepToShip LIFE is aligned to the Europe 2020 strategy and in line with EU policies and regulations
in terms of combating climate change, environmental protection and sustainable development. It
demonstrates strategic and methodological approaches to develop knowledge for estimating and
monitoring the mitigation measures of climate change, and applying good practices and solutions for
the reduction of GHG emissions in the sheep sector in Sardinia.

Livestock and global warming
Livestock contributes to global emissions, and their emissions of the GHG as CO2, N2O and CH4 are of
particular concern. GHG emissions and Carbon Footprint (CF) are expressed in units of CO2
equivalents (CO2-eq). This is because different GHGs have different impacts on the atmosphere, with
1 kg of CH4 being equivalent to 25 kg of CO2 and 1 kg of N2O equivalent to 298 kg CO2 over a 100 year
time horizon (IPCC 2007). The conversion of N2O and CH4 to CO2-eq is based on their effect on the
radiative forcing of the atmosphere relative to the effect of CO2. This depends, amongst other
factors, on their atmospheric lifetime, their current concentration in the atmosphere and their
ability to capture infrared radiation. Both CH4 and N2O are at much lower concentrations in the
atmosphere than CO2, but because their global warming potentials are 25 and 298 times greater
than that of CO2, respectively, small changes in these gases can have relatively large effects on
climate change and its mitigation. For the livestock producer, these emissions are losses of energy,
nutrients and soil organic matter and often reflect the non-efficient use of resources. Moreover,
these losses often reduce the economic viability of livestock production systems. On the basis of the
Global Livestock Environmental Assessment Model (GLEAM) developed by FAO (Hristov et al., 2013),
livestock supply chains emitted about 7.1 Gt CO2-eq per annum of total (GHG) for the 2005
reference period. They consist of 14.5 % of total human-induced emissions (IPCC, 2007). About 44 %
of the agriculture sector’s emissions are in the form of CH4. The remaining part is almost equally
shared between N2O (29%) and CO2 (27%). Cattle are the main contributor to the sector’s emissions

       1
with about 4.6 gigatonnes CO2-eq, representing 65% of sector emissions but only the 4.0% on the
human-induced emissions scale (Opio et al., 2013).
Small ruminants and global warming
Small ruminants have much lower emission levels than cattle, ranging between 7 and 10 % of
livestock emissions, depending on year and source (Gerber et al., 2013). World population of small
ruminants exceeds 2 billion of heads and makes 55% of global ruminant domestic population (cattle,
buffalo, sheep and goats) (FAO, 2012; www.faostat.fao.org/site/569/default). Small ruminant
products, compared with cattle, constitute a relatively small share of globally-produced ruminant
meat and milk, being about 17% and 4%, respectively (Opio et al., 2013). Globally sheep produces
40% of the milk and 62% of the meat from small ruminants, the remaining being produced by goat
(Opio et al, 2013). Sheep adapt very easily to different production conditions, from arid to humid
areas and from poor extensive production systems to intensive ones. Despite their relative
contribution to global milk and meat output, sheep and goat farming plays a large socio-economic
role in some specific economies, especially in developing countries (subsistence) or in Europe and
Oceania (market trade). In particular, in the Mediterranean region the majority of sheep and all
goats belong to dairy breeds, for which milk is the main product and meat is a secondary product
(Gerber et al., 2013). Due to high specialization of breeds and farming systems, in Western Europe
small ruminants reach higher production levels and efficiency and higher economic importance than
in other temperate areas or in most developing countries (Opio et al., 2013). Italy in particular plays
an important role in the small ruminant production sector, being one of the first world sheep milk
producers and the top world sheep cheese exporter (FAO, 2012). At the same time consumers are
paying, day by day, more attention to environmental friendly products and the concept of
environmental sustainability was included in industrial management, considering low environmental
impact as an added value for products.
Studies on small ruminant products also confirmed that CF and GHG estimations may be used to
inform supply chain professionals about the relative impacts of different products and activities. The
packaging carbon label could act in a similar way to many other product labels, which assume that
concerned consumers will preferentially purchase goods with attributes of low CF that they value
(Edwards-Jones et al. 2009).
Several studies have been carried out in large and small ruminants to estimate livestock emissions
and main causative factors (Zervas and Tsiplakou, 2012). Sheep world production contributes to GHG
emissions with around 254 Mt CO2-eq (Opio et al., 2013). FAO estimated that total emissions of
sheep milk system are about 67.1 Mt CO2-eq (Hristov et al., 2013).
Most of the studies about CF are based on cattle dairy farms, with only few cases on sheep dairy
farms (Opio et al., 2013; Weiss and Leip, 2012; Vagnoni et al., 2015; Marino et al., 2016). These
studies show that CF of sheep milk is more than the double per kg compared with cow milk, which
also outweighs the ratio between sheep and cow milk energy. In this context, grazing systems are
important resources in sheep feeding, especially in areas where natural grasslands are part of the
landscape. From a global change perspective, managed grasslands contribute to the anthropogenic
GHG emissions due to livestock sector (Gerber et al., 2013).
Scope and structure of the Review
This review will put the basis for planning future activities and networking of the SheepToShip LIFE
project. The overview was driven by the necessity to organize and classify the studies on Life Cycle
Assessment (LCA) that focused sheep farming systems. The review aim to build a clear picture of the
published in the last 10 years on the LCA applied to the sheep sector especially for adopted
approaches and findings. A more specific focus will be given to the evolution of the opinion of the
scientific community regarding the opportunities and limits of LCA of sheep farming systems. The
investigation and study of these aspects will allow: i) to adopt the most advanced focus when the
2LCA will be carried out in the farms involved in this project; ii) to produce from the project activities
high informative outcomes to share with the scientific community; iii) to stimulate the brainstorming
of new attitudes for the planning of mitigation strategies at territorial level. A critical approach will
be used in this report in order to deduce useful tips for data recording and emission estimations to
further support the project accomplishments. In particular, the overview will take in consideration
all the studies on sheep systems but focusing possible indications that might be useful for
application in the dairy sheep supply chain.
The structure of the report follows two main lines: i) after a brief general introduction section on the
LCA approach and principles, the report presents a literature overview on LCA studies carried out on
sheep farming systems oriented to meat, milk and wool productions. The main focus of the
literature review was to evidence the CF emission intensities reported in each study and discuss the
methodological approach adopted by different authors and relatively to functional units, allocation
methods, impact categories, data inventories and hotspots. A special section on LCA studies on post-
farm emissions has been also included. ii) a deep analysis of the mitigation strategies focus the
animal emission hotspots and the land use emissions and sinks. This section covered the actual state
of the art of the literature in terms of nutritional and managerial factors that allow to reduce sheep
farm emissions (mainly from enteric CH4 and from nitrogen excretion) and the main agronomical
strategies related with forage systems and feed production emissions (mainly from nitrogen and
carbon (C) stock changes).
Inspired by the project goals, the review ends with several considerations on the approaches that
might be adopted to reduce GHG emissions in the dairy sheep supply chain at territorial level. In
particular, a special case study of territorial data analysis to drive the mitigation strategies has been
reported showing how the mitigation priorities might change if different ranking techniques of farm
performances are adopted. A practical example was also added, data from 12 farms were gathered
from Batalla et al. (2015) and a Pareto analysis on of the cumulative emissions was performed to
show an example of identification of the most effective mitigation plans.
The report has been written considering that the reader will go through its content firstly
familiarizing with the contribution of small ruminants on global warming and acquainting with
adopted methodological approaches and CF emission intensities determined with application of LCA.
Then the reader will continue training with the most important technical strategies that could be
applied for farm mitigation and finally figuring out a possible way to identify target farms hotspots to
run an effective mitigation plan on a territorial level. Separate paragraphs will describe specific
topics such as functional units, allocation criteria, system boundaries, data inventories and hotspots.
Final considerations will be deduced at the end of each paragraph in order to get summarized
messages and recaps that might be useful for application in dairy sheep supply chains.
3Introduction
Life Cycle Assessment for GHG emission estimation
LCA, as governed by the ISO standards 14040 and 14044, has become a recognized instrument to
assess the ecological burdens and human health impacts connected with the complete life cycle
(creation, use, end-of-life) of products, processes and activities, enabling the practitioner to model
the entire system from which products are derived or in which processes and activities operate
(Curran, 2014). Outcomes of the LCA studies result in quantification of the environmental impact of
each sector, including agriculture, and livestock farm models have been also suggested or adopted
to get estimated emissions from surveyed and simulated scenarios both alone or integrating LCA
approaches (Eckard et al., 2010; O’Brien et al., 2016). Traditionally, LCA methods have mostly relied
on generic, nonspatial, and steady state multimedia environmental models (Notarnicola et al., 2017).
Most LCA studies represent the impacts as mere flows of resource used and emissions, not assessing
the potential environmental damage arising from these uses. However, in the agricultural sector,
site dependent and closely related environmental aspects, such as natural resources (i.e., water and
land) and ecosystems quality, acquire special relevance (Notarnicola et al., 2017). Although LCA
methods are well defined, the studies vary considerably in their level of detail, their definition of
system boundaries, the emission factors they use, and other technical aspects such as the allocation
techniques and functional units they employ (Vellinga et al., 2013). LCA protocols have been applied
to entire production processes, “from cradle to grave”, to quantify GHG total emission of milk and
meat production per unit of time of CO2-eq or as CF, i.e. total emissions per unit of product (e.g. kg
of CO2-eq/kg of milk). Their main goal is to identify production systems and technical practices which
allow to use less natural resources per unit of product, reducing the food production environmental
impact.
Regarding the sheep sector the most inclusive studies on GHG emissions using life cycle approaches
have been published by FAO (Opio et al., 2013). From a geographical point of view, estimates from
FAO reported that, with the exception of Western Europe (for sheep milk and meat) and Oceania
(for sheep meat), small ruminant productions are generally more important in developing world
regions. Emission intensity for small ruminant milk is however highest in developing regions such as
North Africa and Asia due to poorer production conditions in which animals are for the most part
reared for subsistence purposes (Opio et al., 2013). In contrast, in industrialized countries where
small ruminant milk production is important, emission intensity is on average lower than developing
areas due to the specialization of production.
Considering the methodological approach FAO estimates were performed:
− after developing the Global Livestock Environmental Accounting model (GLEAM; Hristov et
al., 2013);
− following ISO, 2006. Environmental management – Life Cycle Assessment- Requirements and
guidelines - BS EN ISO 14044 and British Standards Institute PAS 2050; 2008. Specification
for the assessment of the life cycle greenhouse gas emissions of goods and services (BSI,
2008).
FAO estimates are in line with the guidelines of the Livestock environmental animal performance
partnership (LEAPp, 2014). In particular, the considered emission sources of FAO LCA for the small
ruminant sector at global level included all the variables listed in Table 1. These emission sources are
the most common considered in the LCA studies but emissions from other sources might be added
to the production processes, as further discussed.
4Table 1. Emission categories considered in the FAO estimates (Opio et al., 2013).
Category Description
Feed N2O Direct and indirect N2O emissions from manure deposited on pasture Direct and
indirect N2O emissions from organic and synthetic N applied to crops and pasture
Feed CO2
blending and transport CO2 arising from the production and transportation of compound feed
fertilizer production CO2 from energy use during the manufacture of urea and ammonium nitrate (and small
amounts of N2O)
processing and transport CO2 from energy use during crop processing (e.g. oil extraction) and transportation by
land and (in some cases) sea
field operations CO2 arising from the use of energy for field operations (tillage, fertilizer application).
Includes emissions arising during both fuel production and use.
Feed LUC CO2 CO2 from LUC associated with soybean cultivation and pasture expansion
Indirect (embedded) energy CO2 CO2 arising from energy use during the production of the materials used to construct
farm buildings and equipment
Manure N2O Direct and indirect N2O emissions arising during manure storage prior to application to
land
Manure CH4 CH4 emissions arising during manure storage prior to application to land
Enteric CH4 CH4 arising from enteric fermentation
Direct energy CO2 CO2 arising from energy use on-farm for heating, ventilation etc.
Post farmgate Energy use in processing and transport
In the latest FAO report on climate change (Gerber et al., 2013) the percentage incidence on the
emissions were presented as average for sheep and goats. It resulted that over 55% of emissions
from small ruminant milk and meat production were attributed to enteric fermentations and about
35% to feed production (considering feed CO2 and crop fertilization with manure and chemical
fertilizers), whereas emissions from manure were very low because excreta are deposited on
pasture (Figure 1). Average emission for the sheep sector was estimated in 8.4 kg of CO2-eq per kg of
sheep milk and 25.0 kg of CO2-eq per kg of meat.
Figure 1. Emission source contribution to small ruminant CO2-eq for meat and milk production
(adapted from Fig. 14 of Gerber et al., 2013).
51. Literature overview on sheep farming systems LCA studies
Application of LCA to livestock production systems is a relatively new area of research (Cottle and
Cowie, 2016). Several studies have been published on dairy and beef cattle whereas few papers have
been published on LCA of the sheep sector. Therefore a review of these studies for methodological
and quantitative issues could be helpful to highlight strength and weaknesses of this approach and
to execute improved LCA analysis in the future. In order to perform a literature review on the most
relevant studies regarding world sheep productions, twenty-five LCA studies were classified
considering their focus on the farm main product, in particular distinguishing among meat (Table 2),
milk (Table 3) and wool (Table 4). The list of published papers reported in the following tables might
be considered exhaustive of the actual literature even if it cannot be excluded that other papers
have been published and provide quantifications of the emissions intensities of the sheep supply
chain under different livestock systems and conditions.
Literature information and tables 2, 3 and 4 generally showed that the most part of the LCA studies
published since 2008 to present on sheep farms quantified emissions of meat productions systems
at farm level. The studied farms were located in Europe (mainly UK, one from Spain, two from
France, one from Sweden) or Oceania (mainly Australia, and one New Zealand farms) (Table 2). This
highlights the relevance of the sheep production systems in these two areas. Despite this general
aggregation, the studies were very heterogeneous in terms of scope, focus, methodological
approaches and results (Table 2). Sample size also extremely changed; several studies considered
only a single case study farm (Peters et a., 2010, Edwards-Jones et al., 2009) others performed
surveys including more than 1000 farms (Benoit and Depko, 2012) whereas other designed
experimental blocks that considered different farming systems (Edwards-Jones et al., 2009; Jones et
al., 2014; Table 2). System boundaries were limited, for the most part of the studies, from
production to farm gate, with only 3 studies estimating the emission intensities from production to
retail (Wiedemann et al., 2015c; Wallman et al., 2012; Williams et al., 2008), whereas only 1 from
production to grave (Table 2). Differences were also found on the methods used to estimate the
emission from enteric fermentation. It has to be noticed that the most recently published studies
mainly preferred to adopt the Tier 2 or 3 approaches from IPCC guidelines (2006; Table 2), which are
considered more appropriate to get accurate estimates of the emissions at farm level.
Allocation methods used to distribute emissions among farm products were also very different
among studies. The most part of them adopted the economic allocation criterion, whereas the
allocation based on biophysical mass balance was the second most diffused approach. Only one
study included the system expansion criteria. It should be noted that the most recently published
studies tried to include different allocation approaches in order to provide more information on the
impact quantification.
The emission intensity output was expressed in terms of carcass weight (CW) or live weight (LW),
and only one single case in terms of meat ready for retail eat. The CF of the meat production largely
varied within study and among studies. Within study the largest observed variation ranged from 5.4
to 33.3 kg of CO2-eq/kg of LW lamb meat. Differences were large even within the same meat farming
system (Jones et al., 2014; Table 2), mainly because animal productivity was indicated as number of
lambs per ewe mated and lamb growth rate.
Among studies the CF of the lamb meat varied from 5 to 33.3 kg of CO2-eq/kg of LW lamb meat. A
large number of values resulted within 8 and 20 kg of CO2-eq/kg of lamb meat (CW or LW; Table 2).
Functional units always matter but, due to the extreme variability within and among studies,
emission intensities expressed per kg of CW were not always higher than those expressed per kg of
LW. Even if it is very difficult to define a typical range of CF, two values of emission intensities
resulted very far from the observed range obtained in the most part of the studies. The value
reported by Benoit and Dakpo (2012) resulted equal to 82 kg of CO2-eq/kg of CW lamb meat for a
6France farm, representing the extreme value obtained in a sample of 1180 farms, and the value
reported by Edward Jones et al. (2009) resulted equal to 144 kg of CO2-eq/kg of CW lamb meat for
an extensive UK farm, the only considered in that farming system. Heterogeneity of literature values
reported in Table 2 does not allow to easily deduce a clear picture of the main factors affecting
environmental performance of the lamb meat sector. In this sense each study should be evaluated
and analyzed individually in order to exploit the most important factor that affect emission
intensities.
Among LCA studies focusing on sheep milk, 4 of them analyzed Mediterranean farms whereas 1
article analyzed an Australian case study (Table 3). Sample size was very limited in all the considered
studies: 1 case study farm (Atzori et al., 2015), 3 farms representative of 3 farming systems (Vagnoni
et al., 2015); the largest sample included 12 surveyed farms (Batalla et al., 2015); one study focused
on 4 simulated farm scenario without performing a specific farm survey (Atzori et al., 2013). System
boundaries were limited from production to farm gate in all considered dairy sheep studies (Table
3). Emissions were, for the most part, economically allocated to farm products and then expressed
per kg of fat and protein corrected milk (FPCM). Emission intensities from European farms (studies
from 1 to 4 in Table 3) on average varied from 2.0 (Vagnoni et al., 2015) to 5.35 CO2-eq/kg of FPCM
(Batalla et al., 2014). The most frequent values were included among 2.0 and 3.0 CO2-eq/kg of
FPCM. The Australian farms showed values from 3.64 to 4.10 CO2-eq/kg of FPCM (Michael, 2011;
Table 3). CH4 estimations were obtained using Tier 1, 2 or 3 of IPCC, which made difficult the
comparison of values obtained from different studies since enteric CH4 is the most important
component of farm emissions.
Relatively to wool production all the considered studies were performed in Australian farms and
considered specific farms (Brock et al., 2013; Cottle and Cowie, 2016) or more general farming
systems. System boundaries framed emissions from production to farm gate and the output were
commonly expressed per kg of greasy wool. Emissions were allocated using different criteria (mass,
economic, protein and system expansions approaches). Observed emission intensities for wool
production were quite variable and very large differences were found when system expansion
allocation method was applied (Biswas et al., 2010; Cottle and Cowie, 2016). Emissions intensities
were quite similar among studies when the economic allocation was considered, specifically ranging
from 20.6 (Cottle and Cowie, 2016) to 29.4 (Brock et al., 2013) kg of CO2-eq/kg of wool. From a
certain point of view the separation of meat studies from wool studies was an oversimplification of
the production systems. In fact, wool production is not totally separated from meat production and
emission intensities for the two products often came from the same studies (Cottle and Cowie, 2016;
Biswas et al., 2010). Indeed, the most part of the wool sheep breeds have double aptitude both for
meat and wool production and they may be considered as co-products (Cottle and Cowie, 2016;
Biswas et al., 2010). The number of sheep head produced yearly in a wool production system is
quantitatively important for the farm balance and flock dynamics, both from a biophysical and
economic outlook. The amount of resources and impact allocated to wool in Australian sheep farms
varies from 33 to 79% for the studies reported in Table 4 considering the economic criterion. It is
different in dairy farms were wool production contributed to total production for 0.9, 1.5, 6.5, 14.3%
using economic, mass balance, energetic and protein allocation criteria (Mondello et al., 2016).
Biswas et al. (2010) in crop + meat + wool farming systems also decided to account for specific
allocations to crop productions (wheat) causing that emission intensities of meat and wool were
lower than those from other studies on similar sheep production systems (Table 2 and 4).
The large heterogeneity of the listed results does not allow to summarize general and useful
information for the quantification of average value of the CF of the sheep meat, milk and wool
production systems. A comparison of estimates might be not informative even within hotspot, if
similar approaches have not been used to get farm data and to determine the emission coefficients
(Curran et al., 2014). The information gathered from literature are in general not comparable and
difficult to discuss. Similarities can be highlighted among methods and findings reported in the
7classified studies but the published emission intensities might be considered affordable only within
study. On the other hand, characteristics of input information and initial assumption adopted for
each study need to be deeply considered when emission intensities of a single study are discussed in
order to avoid misperceptions. Considering that a large number of variables and factors affected the
final values, the comparison among studies should be cautious even considering the percentage
incidence of emission sources on the total impact. Detailed examples will be presented in the further
sections. Confusing factors are very common when different studies are compared. In addition,
findings and outcome of LCA studies only considering CF are difficulty comparable with other studies
that include different degrees of environmental impacts. Nevertheless, cautious comparisons
between studies are useful to validate results (O’Brien et al., 2016). A meta-analysis approach might
be used to get more information from these papers in a quantitative term. On the other hand and
relatively to this project, these papers might provide useful qualitative information from a
methodological point of view.
8Table 2. Carbon footprint values for LCA studies on meat sheep.
n Reference Country Production Data source System functional unit Enteric Allocation method Carbon footprint kg
boundary (FU) methane CO2-eq/FU average
(range)
1 Peters et al., 2010 Australia Lamb 1 case farm Farm gate 1 kg CW Tier 2 Mass, No Allocation (10.2-10.8)
2 Eady et al., 2012 Australia Lamb 1 case farm Farm gate 1 kg CW Tier 2 Syst. exp., bioph., econ. 12.6
3 Eblex, 2012 England Lamb 57 case farm Farm gate 1 kg LW Tier 2 Economic (6-20)
4 Gac et al., 2012 France Lamb Survey 104 farms Farm gate 1 kg LW Tier 1 Mass 12.9
5 Benoit and Dakpo, 2012 France Lamb Survey 1180 farms Farm gate 1 kg CW Tier 1-2 Mass 11.9 (15-82)
6 Ledgard et al., 2011 New Zealand Lamb Survey 437 farms Farm gate 1 kg CW Tier 2 Biophysical, economic 19
7 Ripoll‐Bosch et al. 2013 Spain Lamb Pasture based Farm gate 1 kg LW Tier 2 No alloc./Economic 25.9/13.9
Mixed Farm gate 1 kg LW Tier 2 No alloc./Economic 24.0/17.7
Zero-grazing Farm gate 1 kg LW Tier 2 No alloc./Economic 19.5/19.5
8 Jones et al., 2014a UK Lamb lowland - 27 farms farm gate 1 kg LW Tier 1 Economic 10.8 (5.4-21.5)
upland - 12 farms farm gate 1 kg LW Tier 1 Economic 12.8 (8.3-18.3)
hill - 21 farms farm gate 1 kg LW Tier 1 Economic 17.9 (8.8-33.3)
9 Biswas et al., 2010 Australia Meat sheep Sub-clover system Farm gate 1 kg LW Tier 2 Economic 5.09
Wheat system Farm gate 1 kg LW Tier 2 Economic -
Mixed System Farm gate 1 kg LW Tier 2 Economic 5.56
10 Harrison et al., 2014 Australia Lamb wool Low fec.- High density Farm gate 1 kg fleece+LW Tier 3 No allocation 9.3
(modelled High fec.- High density Farm gate 1 kg fleece+LW Tier 3 No allocation 7.3
scenario) High fec.- Low density Farm gate 1 kg fleece+LW Tier 3 No allocation 7.2
11 Bell et al., 2012 Australia Lamb From 2000 to 2070 Farm gate 1 kg LW Tier 2 Biophysical (11 to 10)
(modelled From 2000 to 2070 Farm gate 1 kg LW Tier 2 Biophysical (12-21.7)
scenario) From 2000 to 2070 Farm gate 1 kg LW Tier 2 Biophysical (12 to 15)
From 2000 to 2070 Farm gate 1 kg LW Tier 2 Biophysical (13 to 17)
12 O’Brien et al., 2016 Ireland Lamb Lowland Farm gate 1 kg LW Tier 3 Economic 10.4
Hills Farm gate 1 kg LW Tier 3 Economic 14.2
Intensive mid season Farm gate 1 kg LW Tier 3 Economic 9.7
Intensive early season Farm gate 1 kg LW Tier 3 Economic 10.7
13 Wiedemann et al., 2015c Australia Lamb Country level To retail 1 kg retail eat Tier 2 Economic 16.074
14 Wallman et al., 2012 Sweden Lamb 10 case farm To retail 1 kg CW Tier 2 Mass/economic 16
15 Williams et al., 2008 UK Lamb Country level model To retail 1 kg CW Tier 2 Economic 14.1
16 Edwards‐Jones et al., 2009 Wales Lamb 1 intensive farm To grave 1 kg LW Tier 1 Economic 12.9 (8.1-31.7)
Lamb 1 extensive farm To grave 1 kg LW Tier 1 Economic 51.6 (20.3-143.5)
17 Cottle and Cowie, 2016 Australia Meat sheep 1 farm North Farm gate 1 kg LW Tier 2 Mass, prot., econ., syst. exp 8.5 for mass all.
Meat sheep 1 farm West Farm gate 1 kg LW Tier 2 Mass, prot., econ., syst. exp 8.7 for mass all.
9Table 3. Carbon footprint values for LCA studies on dairy sheep
n Reference Country Production System boundary functional unit Enteric Allocation method Carbon footprint kg CO2-
(FU) methane eq/FU average (range)
1 Vagnoni et al. 2015 Italy Low input system Farm gate 1 kg FPCM Tier 1 Economic 2.30
Italy Medium input system Farm gate 1 kg FPCM Tier 1 Economic 2.15
Italy High input system Farm gate 1 kg FPCM Tier 1 Economic 2.00
2 Atzori et al., 2015 Italy 1 case farm Farm gate 1 kg FPCM Tier 2 No Allocation 2.77
Italy 1 case farm Farm gate 1 kg FPCM Tier 2 Economic 2.27
3 Atzori et al., 2013b Italy Simulated: zero-grazing; 100% self sufficient Farm gate 1 kg FPCM Tier 3 No allocation 2.45
Italy Simulated: zero-grazing conc. purchase Farm gate 1 kg FPCM Tier 3 No allocation 3.05
Italy Simulated: grazing, purch. conc. Farm gate 1 kg FPCM Tier 3 No allocation 3.05
Italy Simulated: grazing only Farm gate 1 kg FPCM Tier 3 No allocation 3.16
4 Batalla et al., 2014 Spain 3 farms semi intensive+Assaf Farm gate 1 kg of ECM Tier 3 Economic 2.29 (2.03-2.61)*
Spain 3 farms semi intensive+Latxa Farm gate 1 kg of ECM Tier 3 Economic 3.02 (2.87-3.19)*
Spain 6 farms semi extensive+Latxa Farm gate 1 kg of ECM Tier 3 Economic 3.74 (2.76-5.17)*
5 Michael, 2011 Australia 1 case study Farm gate 1 kg of FPCM Tier 2 No allocation, 4.10
Australia 1 case study Farm gate 1 kg of FPCM Tier 2 Economic 3.57
Australia 1 case study Farm gate 1 kg of FPCM Tier 2 Mass balance 3.64
Note: CW = carcass-weight; LW = Live weight; FPCM = fat and protein corrected milk; ECM = Energy corrected milk; * values not accounting for carbon sequestration, when
carbon sequestration is included values might vary from 1.95 to 2.18 per kg CO2-eq/kg of FPCM with the approach of Petersen et al., (2013).
Table 4. Carbon footprint values for LCA studies on wool sheep
System functional Enteric Carbon footprint kg CO2-
n Reference Country Breed Production Allocation method
boundary unit (FU) methane eq/FU average (range
1 Biswas et al., 2010 Australia Meat sheep Sub-clover system Farm gate 1 kg wool Tier 2 Economic 16.69
Wheat system Farm gate 1 kg wool Tier 2 Economic 6.58
Mixed System Farm gate 1 kg wool Tier 2 Economic 15.26
2 Wiedemann et al., 2015a Australia Meat wool 7 alloc. methods Farm gate 1 kg wool Tier 2 Sist. exp., bioph., economic (10 - 38) for bioph. alloc.
3 Wiedemann et al., 2016 Australia Meat wool Southern pastoral Farm gate 1 kg wool Tier 2 Sist. exp., bioph., economic 20.1 for bioph. alloc.
East High rainfall Farm gate 1 kg wool Tier 2 Sist. exp., bioph., economic 21.3 for bioph. alloc.
New west Wales Farm gate 1 kg wool Tier 2 Sist. exp., bioph., economic 20.1 for bioph. alloc.
4 Brock et al., 2013 Australia Meat sheep 1 case study Farm gate 1 kg wool Tier 2/3 Economic 24.9
5 Cottle and Cowie, 2016 Australia Meat sheep 1 farm North Farm gate 1 kg wool Tier 2 Mass, prot., econ., syst. exp 8.5 for mass all.
Australia Meat sheep 1 farm West Farm gate 1 kg wool Tier 2 Mass, prot., econ., syst. exp 8.7 for mass all.
Australia Meat sheep 1 farm West Farm gate 1 kg wool Tier 2 Mass, prot., econ., syst. exp 35.8 for econ all.
101.1 Boundaries and contextualization of the impact addressed by LCA
The most part of the studies listed in tables 2, 3 and 4 focuses on biophysical aspects related with
global warming potential of sheep farms or farming systems from cradle of production to farm gate.
The most part of the studies deeply analyzed few farms representative of a large area or conduction
system whereas few of them were based on a large number of farms (Gac et al., 2012, Benoit and
Dakpo, 2012, Ledgard et al., 2011). On the other hand, territorial studies and inventories are not
often based on LCA.
The most part of mitigation actions suggested by the authors included technical approaches and
policies based on biological strategies. On the other hand the cumulative emissions quantified with
LCA are often allocated and distributed following economic criteria at farm gate. From this point of
view economic criteria are principally based on farm gross revenue obtained from selling each
products at processing plants. Jones et al. (2014) highlighted the difference, within the same
boundary, between the farmer approach, which does not allocated the input resources in his
decision making process, and the LCA approach, which is stressing the boundary splitting among co-
products. This aspect should require deeper discussions in order to standardize and build
consistence in the LCA point of view. The economic allocation criteria, within a certain spatial and
temporary boundary, follow the idea that revenues might be the principal driver of production.
Nevertheless, this approach might appear incomplete from a socio-economic outlook.
For that reason, several authors highlighted the needs to consider social and economic aspects in
LCA studies and to enlarge the system boundaries to the multifunctionality of the production
systems (Flysjö et al, 2012; Ripoll-Bosch et al., 2013; Batalla et al., 2014; Zethermeier et al., 2012).
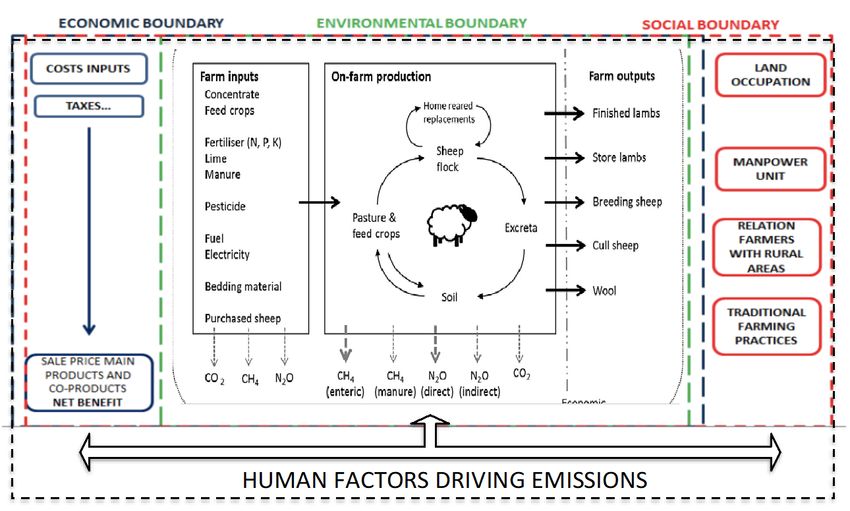
Figure 2 shows the general boundaries of a livestock farm that might be extended to variables that
approaches social boundaries (manpower units, relationships with rural areas, tourism and
traditional cultural aspects, etc.) and economic boundaries (cost and revenues, taxes and national
subventions, local economic advantages of added values, general willingness to pay for
environmental goods and ecosystem services). Integrative analysis should also consider social LCA
(LCAs) and Life Cycle Costing (LCC) (Notarnicola et al., 2017). A particular aspect of the system
contest consisted of multifunctionality. This aspect has important implication on the allocation
methods and the sharing of resources, inputs and impact (Ripoll-Bosch et al., 2013).
To perform exhaustive LCA the farm that is under LCA analysis has an important role in the system
understanding. For that reason, it should be involved in the decision of the system boundaries and
context definition in order to: i) gather high quality data, ii) include all the relevant steps of the
production process in the boundaries (Bicalho et al., 2017) and, iii) consider the implications of the
impact in the socio-economic boundaries.
Remarks: LCA studies are often not contextualized and do not address the big picture of the system.
Environmental impacts should not only focus GHG emissions but should take into account socio-
economic aspects and multifunctionality that are important drivers of the emissions.
11Figure 2. Environmental system boundaries inclusive of economic and social aspects (Adapted from
Jones et al., 2014 and Batalla et al., 2014).
1.2 Functional units
To define a production system it is necessary to perform quantified descriptions of its features.
Functional unit is the quantified performance of a product system, for use as a reference unit (ISO.
14044: 2006E). The functional unit is a very important issue that affect final results and moreover
the impact on the result communication and dissemination. The general goal of LCA is the
quantification of the footprint per kg of product. In terms of CF the cumulative amount of gases
emitted by a given production process is attributed to a kg of the product destined to the market. It
usually refers to what happen in a certain year or short time interval. This approach reveals an
anthropogenic perspective, for which this functional unit results an indicator aimed to minimize the
input use and the impacts per unit of marketable product. It derives from the human challenging of
increasing productivity and production efficiency in order to keep sustainable and resilient the use
and exploitation of natural resources. The CF indicator, expressed in terms of kg of CO2-eq/kg of
product, is easily understandable and easily usable to communicate environmental performances
and for that reason is becoming very popular (Batalla et al, 2014). Even though, it can generate
conflict in other categories inside environmental quality indicators depending how results are
reported and moreover where high yield farms could have less emissions per unit produced (Batalla
et al., 2014). CF indicator cannot be generalized and used for wider environmental impacts from
food products (Röös et al., 2013). As emphasized in the previous sections other environmental focus
than only global warming should be consider when a LCA is performed.
Literature is also concerning the fact that increases of milk yield per animal is the most promising
way to decrease GHGs emission (Zehetmeier et al., 2012). Similar results can be deduced from other
studies (Ripoll-Bosch et al., 2013; Batalla et al., 2015; Vagnoni et al., 2015).
The choice of the functional unit also characterized all the studies listed in tables 2, 3 and 4 and
important differences among them were highlighted. The most part of the considered studies
expressed emission intensities in term of CF per kg of lamb meat, sheep meat, kg of FPCM or kg of
12greasy wool (Table 2, 3 and 4). Functional units refer to the final product in different ways,
depending on the considered production process, the farming system, the purpose of the study and
the sample characteristics either for milk (kg of milk, kg of energy corrected milk, kg of milk solids,
etc.) and for meat (kg of LW, CW, retail eat) or for wool (kg of greasy or cleaned dry wool) (Table 2, 3
and 4). Emission can be also expressed per ha of farm land, in order to emphasize the land use and
occupation, or per kg of protein fixed in the products to emphasize the system ability to produce
human edible protein (Garnett et al., 2014). The protein mass approach has been also largely used
for wool production even if wool is not considerable a food source (O’Brien et al., 2016;
Wiedermann et al., 2015a; 2015b; 2016; Cottle and Cowie, 2016).
Batalla et al. (2014) particularly examined how different functional units might affect results. The
same authors stated that functional unit preferences might affect the results in a relevant manner
and change the benchmarking of the experimental units. Emission intensities from the same LCA
expressed with different functional units are different, might be highly correlated with the original
farm variable used and are specific for defined purposes (Batalla et al., 2014; Table 5).
Table 5. Variability of the CF results depending by the functional unit used. Adapted from Batalla et
al. (2014).
Carbon footprint (CF) Average CF Linked farm variable CF regression vs. Aspect to study
the linked farm
variable
kg CO2-eq/ ha 3,190.75 Farm land, Ha R2 = -0.65 Productive. Efficiency
kg CO2-eq/ Net margin 5.13 Farm net margin, R2 = -0.62 Land Occupation
kg CO2-eq/ Manpower Unit 131,309.69 Manpower units R2 = +0.41 Human resources
kg CO2-eq/kg Energy corrected milk 3.35 Liters of milk per ewe R2 = +0.89 Economic/profitably
Furthermore functional units might cause misinterpretations of the environmental performances of
the products. When foods are ranked for GHG emissions, meat and dairy products showed highest
values of emissions if these are expressed per 100 grams of food, but when emissions are expressed
per 100 Mcal of energy provided to human diet, then processed fruit and vegetables showed highest
emissions than animal products (Drewnowsky et al., 2015). When optimizing diets with regard to
sustainability, it is crucial to account for nutritional value (Werner et al., 2014). Intuitively, diets with
highest nutritional quality are not those with the lowest diet-related GHG emissions (Vieux et al.,
2013) and excluding animal products from the diet does not necessarily mitigate climate change but
might have negative nutritional consequences (Werner et al., 2014).
Remarks: functional units need to be defined considering the purpose of the study and the target
sector. When a LCA study is carried out might be appropriate to show how results might change if
different functional units are used. The standardized use of functional units should allow to evaluate
similarities and differences among studies or scenarios. The use of specific functional units to
conveniently show possible implications should be avoided. Sensitivity analysis could also consider
variability of impact when different functional units are used.
131.3 The allocation methods
Often LCA studies focuses on the emissions of the principal product that drives the managerial
choice of the farmers (i.e. milk production in a dairy farm). However, only focusing on the main
products, without taking into account changes in the co-product systems, can result in erroneous
conclusions because negative changes in the co-product system have the potential to outweigh
positive changes in the main product system (Notarnicola et al., 2016; Zehetmeier et al. 2012;
Wiedemann et al., 2015a). Several paper focused on allocation of ruminant farm products
considering that they are not only oriented to food production but can assumes large
multifunctional roles (Ripoll-Bosch et al., 2013; Zehetmeier et al. 2012). A common feature of most
sheep farms is the interesting co-production of meat and milk or milk and wool (Mondello et al.,
2016), which adds a degree of complexity in the LCA approach (Cottle and Cowie, 2016). In fact,
sheep are often raised in farms that include other livestock species such as beef or dairy cattle or
goats, or crop systems such as forages and grains. In these cases the co-product handling might be
quite easily carried out by dividing the farm in sub-systems (Wiedemann et al., 2015a). On the other
hand, the same sheep production systems have to account for co-products that are jointly produced
such as milk, meat from lamb, meat from culled animal, and wool, breeding live animals (muttons),
etc. (Cottle and Cowie, 2016; Wiedemann et al., 2015a). The relative proportion and quality of meat,
milk and wool varies depending on raised breed of sheep, livestock system, market prices and
product values, etc. The farming systems are often dual purpose and all products are produced in
order to maximize returns, there is not a principal product and by-products but all the systems are
oriented to its co-products. In this sense LCA must account for a distribution of the inputs and
environmental impacts and the final results will be surely affected by methods and criteria utilized in
the impact allocation (Ayer et al., 2007). The options for handling co-products according to ISO
14044 (ISO 2006) have been reported by Cottle and Cowie (2016):
• Clear subdivision of the system (no allocation)
• System expansion (expanding the product system to include the additional functions related
to the co-products). It can be considered a method to avoid allocation while handling co-
products (Wiedemann et al., 2015a).
• Allocation on the basis of physical or biological relationship (mass, protein or energy for
example).
• Allocation on some other basis; most commonly economic (market) value.
All those methods are reasonably applicable to a sheep farming system. On the other hand,
strengths and limitations of each used approach can be disclosed. Recently, several papers
specifically challenged the allocation problem in the sheep sector (Biswas et al., 2010; Ripoll-Bosch
et al., 2013; Coottie and Cowie, 2016; Batalla et al., 2014; Wiedemann et al., 2015; Mondello et al.,
2016; Vagnoni et al., 2015; Atzori et al., 2015). Some of them deeply compared and discussed the co-
product allocation debate (Ripoll-Bosch et al., 2013; Batalla et al., 2014; Wiedemann et al., 2015b;
Cottle and Cowie, 2016; Mondello et al., 2016).
No allocation. The no allocation criteria is based on the assumption that the main product charge for
all the impact of the production process. All the authors agreed that without allocation the emphasis
of the LCA analysis is only focused on the increasing of production efficiency. Following this,
indicator mitigation strategies will be limited to increase production level of animals and crops in
order to reduce impact per unit of product. Therefore, following this approach, intensive systems
are always better performing than extensive ones (Ripoll-Bosch et al., 2013; Wiedemann et al.,
142015a and 2015b; Batalla et al., 2014). As already stated, sheep farms with a single principal product
are very rare and co-products are often produced.
Economic allocation. Economic allocation attributes the environmental impact to the income values
of the co-products. It results the most frequently adopted allocation method and is based on the
assumption that profit and incomes are the most important driver of farm production and
managerial choices (Nguyen et al., 2012; Cottle and Cowie, 2016). In this sense economic allocation
might easily account for co-products and give satisfying results and outcomes especially in dairy
sheep farms (Vagnoni et al., 2015). However the economic allocation is highly dependent from
prices and values at the moment of the LCA analysis (Jones et al., 2014; Mondello et al., 2016).
Possible alternative could be the use of prices that considered large time intervals (Jones et al.,
2014) or to perform sensitivity analyses accounting for price fluctuation (Biswas et al., 2010). The
economic allocation usually gives values that are very different from biophysical allocations (Cottle
and Cowie, 2016).
A particular case of economic allocation is the inclusion of ecosystem services that could be greatly
relevant in farms with high degree of multifunctionality. Ripoll-Bosch et al. (2013), studying Spanish
lamb meat production, focused on the allocation of emission in farm with different levels of
multifunctionality. In particular, ecosystem services carried out by the farms with different degree of
intensity are proportional to the payments that EU gives within the program of Common Agricultural
policy (maintenance of meadow and pastures, indemnities for low production in less favorable
areas, use of autochthonous breeds, maintenance of natural grasslands, etc.). Ripoll-Bosch et al.
(2013) found that accounting only for meat production the GHG emissions of the systems were 19.5
and 25.9 kg CO2-eq per kg of lamb LW, referring to the zero grazing and pasture based system,
respectively. When accounting also for ecosystem services lowest values of meat production impact
was attributable to pasture-based system (13.9 kg CO2-eq per kg of lamb LW) and the highest for
zero-grazing system (19.5 kg CO2-eq per kg of lamb LW). This approach assumes that, if farmers do
not perform ecosystem services, other governmental stakeholders must cover similar actions.
Biophysical allocation. The biophysical allocation assumes that co-products could be separated for
biological criteria such as, produced mass in kg or liters, energy content or protein content or protein
mass of the products following ISO (2006) rules. Protein mass allocation is considered superior to
simple mass allocation as it relates directly to the digestible protein leaving the stomach in individual
animals, which is the major biophysical driver of LW growth and wool (Cronje 2012). Considering
biophysical allocation in dairy sheep farms, the most part of the impact attributed to milk production
always results much higher than other co-products in percentage terms. Mondello et al. (2016)
performed a comparison of allocation methods within the same farm and obtained that impact of
milk production was lower with biophysical allocations than with the economic one. The allocation
based on protein mass attributed the lowest impact to milk compared to other methods (4.56, 4.27,
4.33, 4.03 and 3.36 kg of CO2-eq for kg of milk for no allocation, mass balance, economic energetic
and protein mass, respectively) whereas attributed the highest to meat (83,82, 4.27, 3.85, 4.58 10.32
kg of CO2-eq for kg of meat for no allocation, mass balance, economic energetic and protein mass,
respectively) and also to wool (279.41, 4.27, 2.40, 18.17 and 40.14 kg of CO2-eq for kg of wool for no
allocation, mass balance, economic energetic and protein mass, respectively). Similar comparisons
were performed for meat and wool farms by other authors (Biswas et al., 2010; Wiedemann et al.,
2015). As practical example of resources sharing when handling co-products, the values estimated
by Cottle end Cowie (2016) were reported (Table 6). Detailed methods of biophysical allocation on
meat and wool farms were deeply investigated and tested by Wiedemann et al. (2015). They
calculated three alternative allocation scenarios based on these data: (i) allocation to wool and
sheep meat based on the fraction of protein required for wool or meat divided by total utilized
digestible protein from the whole flock (BA 1); (ii) allocation based on division of the maintenance
15requirements for the breeding flock between wool and meat according to the wool to sheep meat
ratio (as in (i)) together with all maintenance requirements for slaughter lambs directly attributed to
meat and all direct requirements for growth attributed to meat (BA 2); and (iii) allocation of all flock
maintenance requirements and requirements for LW production to the meat product, and allocation
of direct wool protein requirements to the wool product (BA 3). The allocation percentages between
meat and wool reported in Table 7 seem to show little differences among methods. Nevertheless, on
the basis of the obtained results the authors stated that protein allocation provides higher stability
in the long term than the economic allocation (Wiedemann et al., 2105a). Little differences among
biophysical allocation and economic allocation were also found by Eady et al. (2012).
Cottle and Cowie (2016) and Wiedemann et al. (2015a) suggested that the protein mass allocation
can be considered a simple and easily applied allocation approach for use when attributional LCA is
undertaken. In addition, when lambs are the most significant product, the biophysical allocation BA2
was specifically suggested (Wiedemann et al., 2105a). Similar tests should be carried out on dairy
sheep farming systems.
Table 6. Allocation proportion and obtained values of emission intensities for meat and wool sheep
using contrasting methods for handling co-production for Australian farms (Cottle and Cowie, 2016).
Products Mass balance Protein Economic System System System expansion
allocation mass expansion expansion
Allocation proportion
Greasy wool 14-15% 35-37% 55-65% Purpose grown Purpose Purpose mixed
sheep meat beef meat (beef, pork
and chicken meat)
Sheep sales 85-86% 63-65% 35-45%
(lamb + mutton –LW) kg
Emission intensities
Sheep fine wool (greasy 8.5 20.7 35.8 9.0 -6.6 23.7
Sheep meet (lamb and 8.5 6.3 3.6 -
mutton LW)
The total GHG (562,537 kg CO2-eq) per kg of total product (9,995 kg greasy wool + 56,178 kg LW sold) is 8.5 for
the mass balance allocation method.
16You can also read