Textiles and the environment in a circular economy - Eionet
←
→
Page content transcription
If your browser does not render page correctly, please read the page content below

Eionet Report ‐ ETC/WMGE 2019/6

 Textiles and the environment in a circular economy

 November 2019

 Authors:
 ETC experts: Saskia Manshoven (VITO), Maarten Christis (VITO),
 An Vercalsteren (VITO), Mona Arnold (VTT),
 Mariana Nicolau (CSCP), Evelyn Lafond (OVAM)
 EEA experts: Lars Fogh Mortensen, Luca Coscieme

ETC/WMGE consortium partners: Flemish Institute for Technological Research (VITO),
CENIA, Collaborating Centre on Sustainable Consumption and Production (CSCP), Research
Institute on Sustainable Economic Growth of National Research Council (IRCrES), The Public
Waste Agency of Flanders (OVAM), Sustainability, Environmental Economics and Dynamic
Studies (SEEDS), VTT Technical Research Centre of Finland, Banson/World Spotlight II, The
Wuppertal Institute for Climate, Environment, Energy (WI)
Cover photo © istockphoto, credits Karl‐Friedrich Hohl, reference: 642628996

Legal notice
The contents of this publication do not necessarily reflect the official opinions of the European Commission or other institutions
of the European Union. Neither the European Environment Agency, the European Topic Centre on Waste and Materials in a Green
Economy nor any person or company acting on behalf of the Agency or the Topic Centre is responsible for the use that may be
made of the information contained in this report.

Copyright notice
© European Topic Centre Waste and Materials in a Green Economy (2019)
Reproduction is authorised provided the source is acknowledged.

More information on the European Union is available on the Internet (http://europa.eu).

European Topic Centre on Waste and Materials
in a Green Economy
Boeretang 200
BE‐2400 Mol
Tel.: +14 33 59 83
Web: wmge.eionet.europa.eu
Email: etcwmge@vito.be
Contents

Acknowledgements ....................................................................................................................................... 1
1 Introduction: the world of textiles ........................................................................................................ 2
 1.1 Textiles are fundamental to human wellbeing.............................................................................. 2
 1.2 Towards a circular textiles production and consumption system................................................. 2
2 Trends in the production and consumption of textiles ......................................................................... 5
 2.1 Production and consumption trends............................................................................................. 5
 2.2 Collection, reuse, recycling and waste management trends in Europe and elsewhere ............. 14
3 Environmental and social impacts of textiles ...................................................................................... 18
 3.1 Environmental impacts ................................................................................................................ 18
 3.1.1 Resource use........................................................................................................................ 19
 3.1.2 Land use ............................................................................................................................... 20
 3.1.3 Greenhouse gas emissions .................................................................................................. 22
 3.1.4 Chemicals ............................................................................................................................. 23
 3.2 Social impacts .............................................................................................................................. 25
4 From a linear to a circular production and consumption system for textiles ..................................... 27
 4.1 Initiatives towards a sustainable textiles system ........................................................................ 27
 4.2 Envisioning a circular system for textiles .................................................................................... 27
 4.3 Circular business models and policy options for textiles ............................................................ 30
 4.3.1 Choice of materials .............................................................................................................. 30
 4.3.2 Design .................................................................................................................................. 33
 4.3.3 Production and distribution stages ..................................................................................... 34
 4.3.4 Use stage ............................................................................................................................. 37
 4.3.5 Collection, recycling and waste treatment stages............................................................... 41
5 Conclusions .......................................................................................................................................... 45
Acknowledgements

The report has been produced within the task on ‘Textile products and the environment’ of the 2019
ETC/WMGE work program. Lars Mortensen (EEA) has been the project leader and Saskia Manshoven
(ETC/WMGE) has been the task leader.

The authors are grateful to the following experts and organisations for their comments that substantially
improved the quality of the report: Marco Manfroni (European Commission, DG GROW), Ruben Dekker
(European Commission, DG Environment), Josiane Masson (European Commission, DG Environment),
Sandra Averous‐Monnery (UNEP), Emily Macintosh (The European Environmental Bureau), Arthur Ten
Wolde (Ecopreneur.eu), Eline Boon (The Ellen MacArthur Foundation), David Watson (PlanMiljø), John
Wante (OVAM), Bente Bauer (Sustainable Apparel Coalition), Bart Ullstein (BCI), Almut Reichel (EEA),
Dominik Chadid (EEA) and Ioannis Bakas (EEA). Bart Ullstein (BCI) provided a very careful editing of the
report.

Eionet Report ‐ ETC/WMGE 2019/7 1
1 Introduction: the world of textiles
 1.1 Textiles are fundamental to human wellbeing

Textiles are fundamental to the wellbeing of people in Europe and across the world. Textiles provide us
with clothing and footwear – it is illegal in most places not to wear clothes – keeping us warm and enabling
us to express personality and taste. Textiles are also used to make bed linens and towels, carpets and
curtains for our homes, offices and public spaces, as well as providing materials for such other sectors as
furniture and transportation, for example for car seats. At the same time, the textile value chain provides
jobs to millions of people around the world, contributing to economic growth.

The system of production and consumption of textiles is highly globalised with millions of producers and
billions of consumers spread across the world in highly linear value chains involving raw material
extraction, production, transportation, consumption and after‐use disposal. Although the European Union
(EU) is a net importer of textiles, mainly from Asia, it also exports huge amounts to other regions,
representing more than 30 per cent of the world textile market (EC, 2019b). In 2018, the textiles sector in
the EU consisted of 171,000 companies, employing 1.7 million people and with a turnover of EUR 178
billion (Euratex, 2019b). In 2017, the total consumption of textile products (1) by households in the EU27,
Norway, Switzerland, Turkey and the United Kingdom was estimated as 13 million tonnes (2), with a value
of EUR 445 billion (Stadler et al. (2018)).

The textile sector, including the fashion industry, has significant environmental footprint across its value
chain. Natural fibres, such as cotton and wool, are produced using vast areas of agricultural land and large
amounts of water, energy and chemicals, while the manufacture of synthetic fibres is based on fossil fuels.
The use of chemicals and additives in textile production exerts significant impacts on local and regional
water bodies. Their global distribution network emits greenhouse gases and generates packaging waste.
In the use phase, washing and drying of textiles result in significant water and energy use as well as the
release of chemicals and micro‐plastics into rivers and the marine environment. The sector is a major
contributor to climate change through its energy use and waste management. Apparel and footwear have
been estimated to produce as much as 8 per cent of global greenhouse gas emissions through their life‐
cycles (Quantis, 2018). In 2015, greenhouse gas emissions from textile production amounted to 1.2 billion
tonnes of carbon dioxide equivalent (CO2‐eq), more than international flights and shipping combined (Ellen
MacArthur Foundation, 2017).

The textile industry can also have huge social impacts, as we were reminded by the 2013 Rana Plaza
incident in Bangladesh when a textile factory collapsed killing more than a thousand workers. The payment
of extremely low wages and dangerous working conditions are widespread in the industry.

 1.2 Towards a circular textiles production and consumption system

A sustainable textile system should bring wellbeing and value to society through the provision of safe,
high‐quality and affordable textile products and the creation of inclusive jobs with fair wages and working
conditions, while at the same time minimising any negative environmental and social impacts, and
respecting the carrying capacity of the planet. Across the value chain, pollution and waste should be
limited. To ensure the conservation of the value of materials, efficient collection and recycling processes
should be put in place, allowing high‐quality, clean and safe product and materials cycles.

1
 Includes the Classification of Individual Consumption According to Purpose (COICOP) domains for clothing (3.1),
footwear (3.2) and household textiles (5.2).
2
 Amount calculated for 2017 consumption data, based on 2011 data and conversion factors in EXIOBASE 3.4 This
estimate is based on a 30 gram per euro (2017) final expenditure conversion factor, which is derived from EXIOBASE
v. 3.4 in combination with Eurostat expenditure statistics [nama_10_co3_p3] and [prc_hicp_aind]. This conversion
factor includes the value of the textile product itself, as well as the value of trade and transport activities.

Eionet Report ‐ ETC/WMGE 2019/7 2
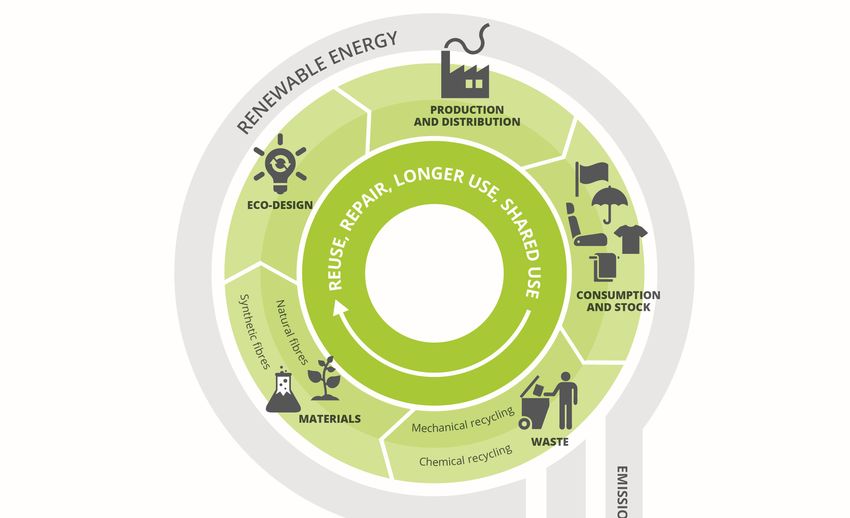
The European Commission has identified textiles, apparel and fabrics, as a priority product category within
a circular economy (EC, 2019b). A more circular and sustainable textile system could contribute to the
achievement of both EU and global goals. In the EU, it would contribute to economic growth and job
creation as well as to meeting the aims of the circular economy and a number of climate, environmental
and waste targets. At the global level, this more circular and sustainable system would contribute to many
of the UN Sustainable Development Goals (SDGs), including Goal 6: Clean water and Sanitation, Goal 7:
Affordable and Clean Energy, Goal 12: Responsible Consumption and Production, and Goal 13: Climate
Action.

Textile production in Europe is regulated through a patchwork of EU and national legislation, including on
production methods and working conditions, and fibre names, related labelling and the marketing of the
fibre composition of textile products (EC, 2019c). Legislation on chemicals, industrial emissions, product
safety, etc. also regulates textiles. The production of textiles within the EU, for example, is covered by the
EU Regulation on Evaluation and Authorisation of Chemicals (REACH) and the Industrial Emissions Directive
(IED). Textiles produced outside the EU are also subject to product regulation, such as EU eco‐label criteria
and green public procurement criteria for textiles. Furthermore, the 2018 revision of the EU Waste
Framework Directive (WFD) includes an obligation for Member States to collect textiles separately by 1
January 2025 (EC, 2019b).

European countries face constraints in influencing production methods and related negative social and
environmental impacts that occur elsewhere. As the EU relies heavily on textile imports, there are key
challenges when it comes to ensuring that textile products entering the EU are subject to the same
standards. Despite such constraints, there are several policy options which can have an effect on
production methods in other regions, some of which have already been implemented. Examples are
policies related to green public procurement, standards and labelling, and waste management.
Transparency and traceability through the value chain are also key.

To move towards a more circular and sustainable system the EU needs to go beyond separate collection
of textile waste and recycling. Regulation of textile production and consumption should go hand‐in‐hand
with technological innovation, aimed at favouring renewable fibres and fabrics, product design that
facilitates longer use and reuse, and efficient production processes that generate less waste and fewer
emissions (Bauer et al., 2018), and phasing‐out of hazardous chemicals. Social innovation related, for
example, to how consumers interact and share clothing is also needed. To foster profound behavioural
change, the scaling of sustainable, circular business models is key (Elander et al., 2017; Watson et al.,
2017). The circular management of textiles requires the creation of safe product and material cycles,
encouraging reuse and recycling, while avoiding waste incineration and landfilling.

A systemic change is needed, involving more stakeholders than the fashion industry alone, to overcome
technological and economic challenges. Among the different textile sectors, the fashion industry is taking
initiatives to improve the sustainability of its supply chains and processes. In the short term, focus is
primarily on implementing efficiency measures to reduce water, energy and chemicals use, while
improving supply chain traceability and working conditions. In parallel, tangible work towards a longer‐
term objective has to start now, transforming the fashion industry to a circular system, embracing the
opportunities of digitisation and the development of sustainable fibres (Global Fashion Agenda, 2019).

Figure 1.1 illustrates a vision of a more circular textile system, including showing how circularity can be
improved in each phase of the lifecycle.

This report, which provides the analytical underpinning for an European Environment Agency (EEA)
briefing, investigates options for a circular and more sustainable textile production and consumption
system.

Eionet Report ‐ ETC/WMGE 2019/7 3
Chapter 2 shows the production and consumption of textiles from a European perspective. It maps textile
value chains, including main trade patterns, and discusses the current systems of production, consumption
and waste management, including economic and employment trends.

Chapter 3 analyses the environmental and social impacts of textiles. It provides an overview of the impacts
of the upstream supply chain of EU textile consumption. The environmental analysis focuses on four
particular hotspots: resource depletion of materials and water, land use, climate change and chemicals’
toxicity. The social impact assessment discusses working conditions, mainly in the production of textiles.

Chapter 4 provides a more detailed vision for a more circular and sustainable textile production and
consumption system. It analyses the potential for various types of new and innovative business models as
well as the role regulation can play in supporting innovation.

Chapter 5 concludes the report.

Figure 1.1 Vision of a circular economy for textiles

Source: EEA and ETC/WMGE, adapted from EEA (2016)

Eionet Report ‐ ETC/WMGE 2019/7 4
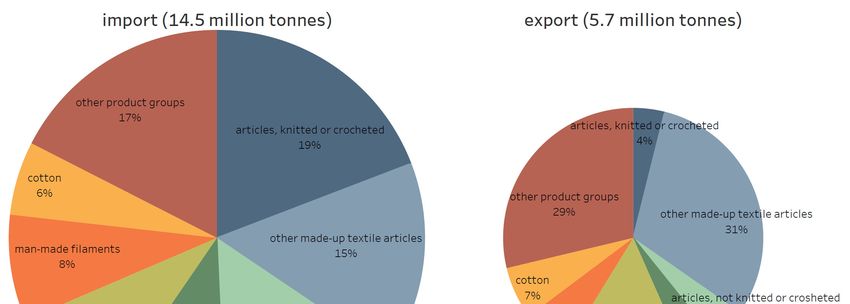
2 Trends in the production and consumption of textiles
 2.1 Production and consumption trends

Textile production and consumption are highly globalised. In 2017, European households consumed nearly
26 kilograms (kg) of textile products (3) per person (Figure 2.1). This estimate comes with some uncertainty,
as various studies in different countries provide different estimates ranging from 9 to 27 kg per person,
depending on the data source and product scope (Watson et al., 2018; Šajn, 2019). An earlier estimate by
the European Commission’s Joint Research Centre (JRC) calculated the average annual EU consumption of
clothing and household textiles at 19.1 kg per person (JRC, 2014).

Only 7.4 kg of textiles per person were produced within the EU itself, making Europe highly dependent on
imports to fulfil its consumers’ demands. Europe also exports a significant amount of textiles, 11 kg per
person. The reason that EU exports exceed EU production is re‐export: some textiles are imported, turned
into specific products and then re‐exported.

The value of imported textiles in European clothing consumption increased by 9 per cent between 2014
and 2018. The net import of textiles into the EU in 2018 sums up to 8.8 million tonnes: 14.5 million
tonnes (4), with a value of EUR 139 billion, were imported in 2018 while only 5.7 million tonnes, with a
value of EUR 61 billion, were exported (Eurostat, 2019a). The export figure includes about 1.5 million
tonnes of worn clothing, 3 kg per person, with a value of EUR 1.3 billion. The difference between total
import and production versus total export and final consumption is related to stocks that had been built
up (Figure 2.2).

Figure 2.1 Overview of the import, export, production and consumption flows of textile
products, EU, 2017, kg per person (5).

The types of products that Europe imports and exports are different. Europe mainly imports finished textile
products, clothing and footwear products and clothing accessories, while exported textiles are typically
intermediate products, such as non‐wovens, fibres and technical textiles, and high quality fabrics in which
European industry specialises (Figure 2.2).

3
 Including clothing, footwear and household textiles (carpets, curtains, bedlinen, towels, etc.)
4
 Textiles defined by the Harmonized Commodity Description and Coding System (2012) Chapters 50–67 (Sections XI
and XII), including fibres, fabrics and finished products, such as clothing, footwear and household textiles.
5
 The waste flow of textiles from stock is not included in this scheme.

Eionet Report ‐ ETC/WMGE 2019/7 5
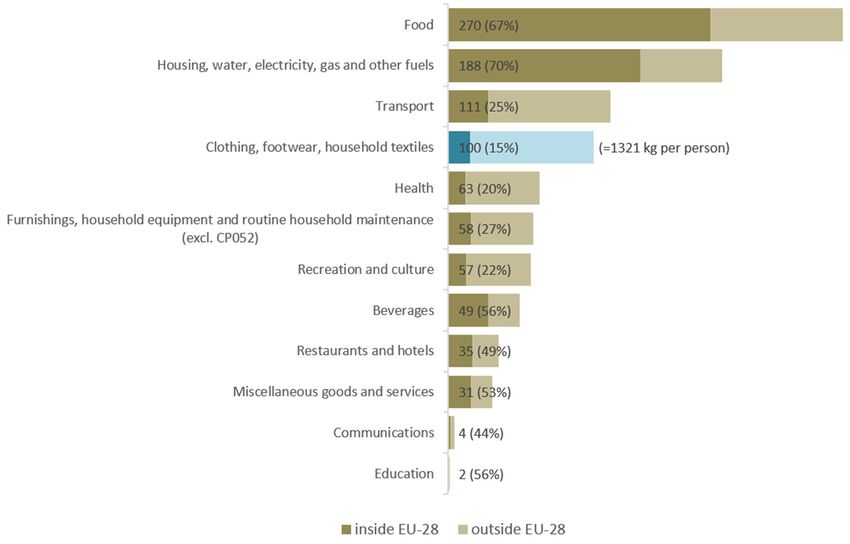
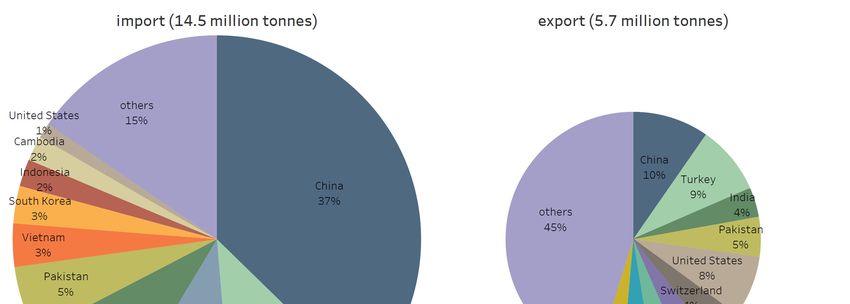
Figure 2.2 Import into and export from EU by product type, including textile fibres, fabrics
and articles, footwear and headgear, 2018, per cent

Note: percentages may not sum due to rounding
Source: The Harmonized Commodity Description and Coding System, Chapters 50–67 (2017)

As can be seen in figure 2.3, 85 per cent of the total quantity of textile imports into the EU come from just
10 countries, with 37 per cent coming from China, 11 per cent from Turkey, 10 per cent from Bangladesh
and 9 per cent from India. Exports are more fragmented, with the largest 10 destination countries
accounting for 55 per cent of total exports by volume, with 10 per cent of exports going to China, 9 per
cent to Turkey, 8 per cent to the United States, 5 per cent to Pakistan.

Eionet Report ‐ ETC/WMGE 2019/7 6
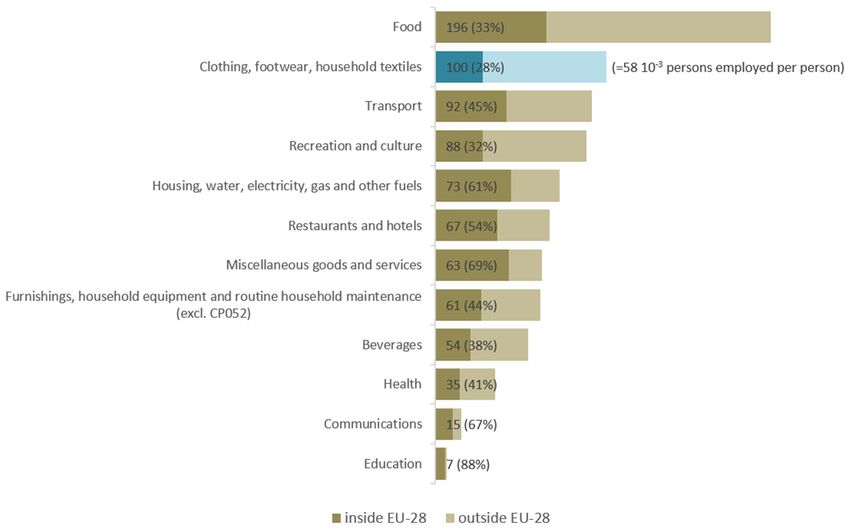
Figure 2.3 Import into and export from EU by country, 2018, per cent

Note: percentages may not sum due to rounding
Source: The Harmonized Commodity Description and Coding System, Chapters 50–67 (2017)

The production of textiles is an important part of the European manufacturing industry, playing a crucial
role in the economy and wellbeing in many regions. In 2017, the EU’s total textile production (6) was 3
million tonnes; production of fibres accounts for 27 per cent of this, yarn production 36 per cent and
woven fabrics 37 per cent (Eurostat, 2019d). Natural and synthetic fibres are both produced and processed
by the European textile industry.

In 2018, there were around 171,000 companies in the EU’s textile and clothing industry, employing about
1.7 million people and generating a turnover of EUR 178 billion (Euratex, 2019b) – the sector is mainly
composed of small businesses with fewer than 50 employees (Business Beyond Borders, 2017). European
producers are global leaders in technical/industrial textiles and non‐wovens – industrial filters, hygiene
products, products for the automotive and medical sectors, etc.– as well as in high‐quality garment design
and production. When it comes to the European clothing industry, the largest producing countries are in
Central and Eastern Europe (Albania, Bosnia and Herzegovina, Bulgaria, Croatia, Georgia, Hungary,
Moldova, North Macedonia, Romania, Slovakia, Turkey and Ukraine (Luginbühl and Musiolek, 2014)).
Worldwide, the number of garments produced annually has doubled since 2000 with, in 2014, 100 billion
items being exceeded for the first time, an annual production of nearly 14 new items of clothing per person
on Earth (Remy et al., 2016).

The global production of textile fibres has almost tripled since 1975 (Ellen MacArthur Foundation, 2017).
When looking at the global textile sector, about 60 per cent of textile fibres produced are synthetic
polymers, while 37 per cent is dominated by cotton (Sandin and Peters, 2018; Palm et al., 2013).

6
 NACE Rev. 2 – Division 13

Eionet Report ‐ ETC/WMGE 2019/7 7
Figure 2.4 World consumption of major textile fibres between 1960 and 2018, million
tonnes

Source: ICAC (2019)

The global annual production and consumption of cotton fibres, currently to most prevalent for clothing,
more than doubled from slightly more than 10 million tonnes in 1960 to about 25 million tonnes in 2010,
and has since remained more or less static (Figure 2.4Source: ICAC (2019)
). Cotton may, however, become an increasingly costly premium product in the future as a result of
challenges related to land use and water consumption (WRAP, 2019). According to a study by the JRC
(2014) focusing on the EU, about 43 per cent of all clothing is made of cotton, 16 per cent of polyester,
and 10 per cent each of acrylic, wool and viscose. About 54 per cent of fibres used in clothing are natural
but in household textiles, about 70 per cent are synthetic – overall cotton and polyester at 28 per cent
each, are the most prevalent, followed by polyamide at 23 per cent. Acrylic and polypropylene are
important fibres in carpet manufacture.

The global consumption of synthetic fibres increased from marginal amounts in 1960 to more than 60
million tonnes in 2016, and continues to rise (Figure 2.4). Polyester, the most commonly used fibre across
the world, is a synthetic, non‐renewable, petroleum‐based fibre made using a carbon‐intensive process
that requires more than 70 million barrels of oil each year (WRAP, 2019). Polyester fabrics are durable,
wrinkle resistant and are used in clothing, home furnishings and variety of industrial applications including
cushioning and insulating materials as well as ropes, car tyres and conveyor belts.

Currently, only 2 per cent of all synthetic polymers is made from bio‐based resources. Of this share, 11 per
cent is produced for textile applications (Nova Institut, 2019). Production of synthetic cellulosic fibres–
lyocell, viscose, etc. – was estimated at 5 million tonnes in 2016. Production is growing and so is the share
produced sustainably from certified forests (TextileExchange, 2018).

To create fabrics with improved properties, such as increased breathability and durability, to achieve
special colour effects or reduce production costs, different fibre types are often blended into composite

Eionet Report ‐ ETC/WMGE 2019/7 8
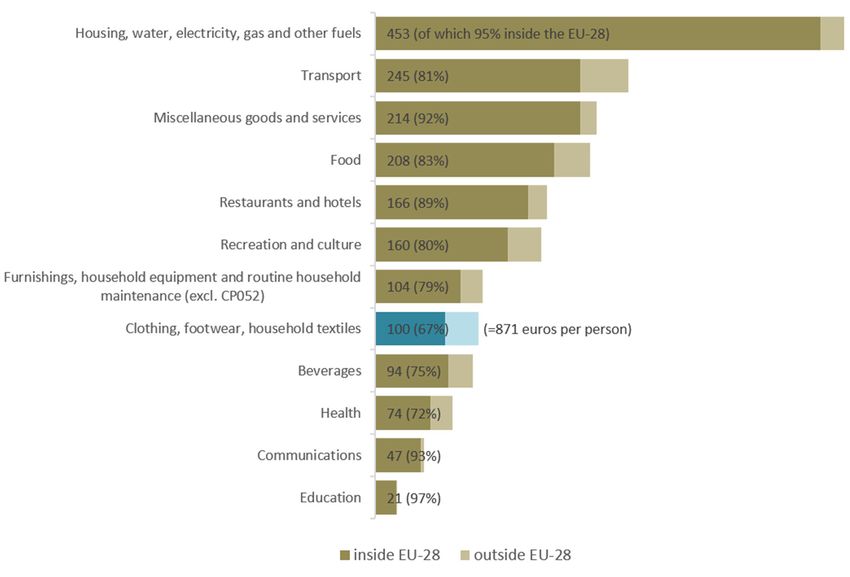
yarns. One of the most common textile materials, polycotton, used in most service textiles, such as sheets,
towels and workwear, is made of a mix of polyethylene terephthalate (PET) and cotton in varying
percentages (Palme et al., 2017).

On average European households spent EUR 871 per person on textile products in 2017 (Exiobase 3.4).
The supply chain of textile products bought in Europe is spread all over the world and it is very complex in
terms of sectors involved. The global distribution of gross value added and employment related to final
consumption of textile products have been calculated by using an extended multiregional input model
based on EXIOBASE v.3.4 data (Stadler et al., 2018). In figures 2.5 and 2.6, 2011 Exiobase data were
combined with 2017 household consumption data from Eurostat (methodology in annex).

As can be seen in Figure 2.5, 67 per cent of the gross value added in the supply chain of textile products
bought by European households is generated in Europe, followed by 23 per cent in Asia and the Pacific.
This is much less than other consumption categories, where the gross value added in Europe varies from
80 to 95 per cent. This illustrates the importance of activities outside Europe for textiles. Forty‐four per
cent of the gross value added is generated in the textile industry; Other important sectors are services, 16
per cent; other industries, 12 per cent; and transport, 11 per cent. The share of agriculture, for the
cultivation of natural fibres, in total value added is low at just 3 per cent.

Figure 2.5: The generation of gross value added in the upstream supply chain (7) of EU
household consumption domains, indexed values with textile consumption equalling 100,
2017.

Source: Exiobase v.3.4 (Stadler et al., 2018)

7
 This includes all activities in industrial and service sectors in the production and supply chain of the textile products
up to purchase by households. It excludes the use of the textile products and the treatment at end of life.

Eionet Report ‐ ETC/WMGE 2019/7 9
Looking at employment in the supply chain of textile products bought by European households, textiles
is the second most important sector after food (Figure 2.6). Labour intensity in agriculture and the clothing
industry is an important factor in this context. Only 28 per cent of employment in the supply chain takes
place in Europe, which is one of the smallest shares of all consumption categories. Forty‐three per cent of
working hours are linked to the textile industry, which is in line with the gross value added. Agriculture,
however, represents 28 per cent of employment compared to just 3 per cent of value added. The
geographical distribution of gross value added differs significantly from the distribution of employment:
56 per cent of the employment takes place in Asia and the Pacific, 28 per cent in Europe and 12 per cent
in Africa. According to the Exiobase socio‐economic model, 40 per cent of the workforce in the textile
supply chain worldwide is female and 89 per cent is low‐ or medium‐skilled. The share of female workers,
50 per cent, is much higher in the textile industry itself compared to the other industries involved in the
supply chain, such as agriculture, trade and transport in which it is 22–38 per cent. Due to the prevalence
of informal employment in agriculture and the production of textiles, the share of female workers is
probably higher in reality, up to 75 per cent globally (EC, 2017). Payment of employees accounts for 52 per
cent of the gross value added of the textile industry worldwide, with large differences in the cost of
employment between regions: EUR 3.44 per hour on average, with a factor of seven difference between
Europe and Asia.

Figure 2.6: The use of employment in the upstream supply chain (8) of EU household
consumption domains, indexed values with textile consumption equalling 100, 2017.

Source: Exiobase v.3.4 (Stadler et al., 2018)

Worldwide, the consumption of technical textiles – industrial textiles, workwear, etc. – accounted to 33.2
million tonnes in 2015, and is estimated to grow to 42.2 million tonnes by 2020 (TextileToday, 2016).

8
 This includes all activities in industrial and service sectors in the production and supply chain of the textile products
up to purchase by households. It excludes the use of the textile products and the treatment at end of life.

Eionet Report ‐ ETC/WMGE 2019/7 10
Technical textiles have a wide variety of uses encompassing civil engineering, agriculture and fishing,
construction, the automotive industry, medical uses, protection and machinery. Technical textiles have
generally high durability requirements and thus are, to a large extent, composed of synthetic fibres.

When looking at the textile consumption of households, it can be seen that textiles and related products
are an important part of current lifestyles in Europe. In 2017, EU households spent 5.3 per cent of their
total expenditure on textile products (10), representing a value of EUR 445 billion on, of which 74 per cent
was on clothing, 17 per cent on footwear and 8 per cent on household textiles (Eurostat, 2019b).

When analysing the trends of the total expenditure of EU households, there is a slight decline in the share
attributed to clothing, footwear and household textiles, from 6.3 per cent in 2000 to 5.3 per cent in 2017
(Figure 2.7Source: Eurostat (2019b)
). Despite this slight decrease in expenditure, the total number of clothing items consumed has increased
and is expected to further increase in the coming years. Concretely, there was a 40 per cent growth in the
amount of purchased clothes per person in the EU between 1996 and 2012 (Šajn, 2019). In other words,
Europeans have been able to buy more pieces of clothing while spending a smaller share of their income
on them. At a global level, the consumption of clothing and footwear is expected to increase by 63 per
cent by 2030, from 62 million tonnes now to 102 million tonnes in 2030.

Figure 2.7 Household expenditure on clothing, footwear and household textiles as a
proportion of total household expenditure in the EU, 2000–2017, per cent

Source: Eurostat (2019b)

A combination of multiple factors and drivers have led to the increased consumption of clothing. These
include production trends based on low‐cost and fast fashion and a respective decrease in the price of
clothing; the increasing affluence of consumers; further trade liberalisation; and technological

10
 Clothing (CP031), Footwear (CP032) and household textiles (CP052).

Eionet Report ‐ ETC/WMGE 2019/7 11
advancement (EEA, 2014). Moreover, a general trend can be seen towards a more consumerist mindset,
in which consumption is seen more as gratification rather than a function of meeting needs.

Throughout the past years, companies have increasingly invested in streamlining and optimising their
supply chain operations as well as in cutting production costs by deploying fragmented, low‐tech
production systems and using cheaper, low‐quality materials (Remy et al., 2016). This process has been
driven by the globalisation and industrialisation of the clothing and textile industry as well as the push to
improve, gain and/or maintain market competitiveness. These developments, on one hand, have led to
lower and more affordable consumer prices (Koszewska, 2018) – for example, between 1996 and 2018,
clothing prices in the EU dropped by more than 30 per cent relative to total harmonised index of consumer
prices (11) inflation (Figure 2.8).

Figure 2.8 Consumer price indices for clothing relative to HICP inflation in the EU, 1996–
2018

Source: Eurostat (2019c)

On the other hand, more efficient and shorter (in time) production processes have contributed to the more
frequent introduction of fashion and clothing lines and shorter market seasons. Fast fashion aims at
consumers who want to follow trends and change their wardrobes frequently. In fast fashion, styles from
high‐end fashion shows are rapidly delivered to consumers at cheap prices, achieved, in art, by using
lower‐quality materials. As such, fast fashion encourages over consumption and the generation of waste
(House of Commons, 2019). A driver of this trend is a pursuit of added value and growth by continuously
promoting the purchase of new products and the disposal of old ones, which are branded as obsolete
simply because they are out of fashion. European apparel companies in 2011, for example, released an

11
 The harmonised index of consumer prices (HICP) measures the price change of consumer goods and services over
time

Eionet Report ‐ ETC/WMGE 2019/7 12
average of five collections as opposed to two clothing lines, which was the norm around the year 2000
(Koszewska, 2018). Accordingly, some of the biggest brands mainly targeting young people are releasing
between 12, 16 and 24 new clothing collections every year (Remy et al., 2016).

This has led to increased consumption accompanied by a decrease in the lifespan of clothes, which are
generally worn fewer times – around seven to eight on average, kept for a shorter period than in the past,
and treated as almost disposable (Remy et al., 2016). In Europe, the average lifespan of clothes varies
between 2.2 and 5 years (WRAP, 2012; Gray, 2017), with clothing items across various categories being
kept by consumers for half as long as they used to be 15 years ago. Garments are prematurely discarded,
because of fast‐changing trends or their general poor quality. More recently, however, the push model is
being challenged by a pull or demand‐driven model in which consumers, rather than clothing brands, guide
the development of the textile and clothing market, through for example social media, bloggers,
influencers and peer reviews. This trend, which is also encouraged by many brands, spurs companies to
quickly develop and produce customised items, based, for instance, on consumers’ designs or simulations,
on demand (Andersson et al., 2018).

Reflecting the complexity of human behaviour, a wide range of factors and drivers are seen to influence
consumer purchasing. Across countries, a clear relation exists between income and per person spending
on clothing (EEA, 2014). Factors such as product fit, price and value for money, quality, brand, durability,
comfort, convenience and latest trends are some of the most frequently mentioned determining factors.
Cultural and societal factors, such as social status, identity, social influence or peer pressure also have a
role to play, as well as marketing and the influence of retailers (Paras et al., 2018). The cultural context,
however, also affects spending on clothing: Italians, for example, tend to spend much more on clothes
than people with higher disposable income from other European countries, such as France or Denmark
(EEA, 2014).

Hiring or leasing clothes is less common. According to a Waste and Resources Action Programme (WRAP)
survey in 2012 in the United Kingdom (UK), the only types of clothes that more than one in ten people
hired were formal wear, 13 per cent, and fancy dress, 11 per cent, while only 2 per cent of respondents
has leased any type of clothing. Around half the respondents, however, said they would consider hiring
clothes more frequently if it were easier to do – for example, through major high‐street retailers (WRAP,
2012).

Although European consumers are increasingly aware of sustainability when shopping for clothes, such
concerns still have a limited impact in informing consumer decisions (Vehmas et al., 2018). Aspects such
as quality, comfort, price and fit score higher in the priority list. According to a recent Cotton Council
International and Cotton Incorporated Global Environment survey conducted in China, Germany, India,
Italy, Mexico, the UK and the United States, for example, sustainability was mentioned as a behavioural
determinant by 60 per cent of respondents, with comfort and price mentioned by 88 per cent, quality by
89 per cent, and fit by 90 per cent (TextileToday, 2018). In another survey conducted by Fashion Revolution
(2018) with 5,000 respondents from France, Germany, Italy, Spain and the UK, 38 per cent and 37 per cent
mentioned they consider social and environmental impacts, respectively, when purchasing clothes. This
rather low prioritisation of sustainability could potentially be explained by the idea that assessing clothing
sustainability is very complex due to a lack of transparency about production conditions and impacts
(Vehmas et al., 2018).

When it comes to shopping habits, online shopping is growing rapidly with only a small majority of
European consumers still preferring to buy their clothes from physical stores (CBRE, 2013). According to a
Mastercard (2017) survey, 48 per cent of European consumers purchase clothing and footwear online,
which makes online shopping for clothes more popular than for tickets, 34 per cent; electronics, 33 per
cent; or books, 31per cent. Online sales platforms are increasingly making it easier for manufacturers to
sell and consumers to shop and return products anywhere in the world, eliminating the need for

Eionet Report ‐ ETC/WMGE 2019/7 13
intermediary actors (CBI, 2018). Consequently, the increase in online sales has a large impact on resource
use and emissions in terms of packaging and transport.

 2.2 Collection, reuse, recycling and waste management trends in Europe and elsewhere

It is estimated that EU consumers discard about 5.8 million tonnes of textiles every year, which equates to
11.3 kg per person (Beasley and Georgeson, 2014). Figure 2.9 shows that separate collection‐to‐
consumption ratios range from 11 per cent in Italy to more than 70 per cent in Germany (Watson et al.,
2018). The differences between countries can be partly explained by differences in infrastructure, such as
the density of collection points and the intensity of collection activities by charity organisations and private
actors. In addition, national policy measures play an important role, such as the availability of subsidies
and research and development (R&D) support for sorting and recycling initiatives and the organisation of
public awareness campaigns to influence consumer behaviour (Watson et al., 2018).

Figure 2.9 Estimated consumption and separate collection rates for clothing and
household textiles in seven EU countries.

Source: Watson et al. (2018)
Note: Figures for Denmark (DK), France (FR), Germany (DE) and the UK include footwear

Reuse of textiles is much more environmentally advantageous than recycling (Schmidt et al., 2016).
Traditionally, the collection of used textiles was dominated by charities along with some private actors
(EEA, 2018). More recently however, voluntary take‐back campaigns have been set up by larger retailers
(Hvass and Pedersen, 2019) and municipalities are also increasingly getting involved (Watson et al., 2018).
Gunther (2016), however, pointed out that consumers do not generally return clothes and the
participation in companies' recycling efforts is limited, regardless of the incentives.

Apart from the benefit of waste prevention, sorting and reuse also offer opportunities for (low‐skilled)
employment. Experience from textile collection and reuse schemes in Flanders, the Nordic countries and
the UK, however, has shown that on average only about 10 per cent of collected used garments are reused
within the same region, with a variation 4–30 per cent (WRAP, 2012; De Kringwinkel, 2017; Schmidt et al.,
2016). Results from the European Clothing Action Plan study point to Denmark as a country where buying
second‐hand clothing is relatively popular, but even there it does not exceed 9 per cent of total purchasing

Eionet Report ‐ ETC/WMGE 2019/7 14
decisions. In the other countries considered – Germany, Italy, Netherlands and the UK – the share of
second‐hand purchases is typically below 5 per cent (Gray, 2017). At the same time, reuse businesses and
peer‐to‐peer reuse trade are increasing due to ease of marketing through the internet. An important
question is whether the purchase of second‐hand textile products actually replaces the purchase of new
items, and to what extent. Based on a survey among more than 200 consumers in Denmark, Estonia and
Sweden, Farrant et al. (2010) estimated that for each 100 second‐hand garments purchased, about 60–85
new items would be saved.

In general, a large share of unsorted collected textiles is sent for sorting in Eastern European countries,
then exported again for reuse or recycling in Africa and Asia. Figure 2.10Source: Eurostat (2019a)
 shows that the export of used clothes from the EU is significant and increasing. Most receiving countries
have a well‐established second‐hand clothing markets: in Uganda, for example, 81 per cent of clothing
purchases are of used clothing (Brooks, 2015). Although there are some benefits, such as the creation of
local jobs in sorting and selling, and the provision of cheap clothes, there are also increasing concerns that
the oversupply of used textiles, together with increased imports of cheap new clothing from Asia may have
contributed to the decline of domestic textile industries in sub‐Saharan countries (Watson et al., 2016). In
January 2018, Burundi, Kenya, Rwanda, Tanzania, South Sudan and Uganda all announced that they
intended to stop importing used clothes from Europe and the United States by 2019 in order to support
their own textile industries (Gittleson, 2018), but as a result of political pressure, only Rwanda remains
committed to this policy (News24, 2018).

Figure 2.10 Export and import of worn textiles, 2000-2018, EU

Source: Eurostat (2019a)

The 2018 revision of the WFD includes an obligation on Member States to collect textiles separately by
1 January 2025 (EC, 2019b). Since global markets for used clothing are becoming saturated, however,
finding suitable outlets for increasing volumes of collected textiles will be a challenge (Ljungkvist et al.,
2018). It will, therefore, be important to make progress in textile‐to‐textile recycling. Currently, the non‐

Eionet Report ‐ ETC/WMGE 2019/7 15
reusable fraction of collected textiles is mostly downcycled into industrial rags, upholstery filling and
insulation, or is incinerated or landfilled. Less than 1 per cent of textile waste is recycled into new fibres
for clothing as technologies for processing textiles to recycled fibres are only starting to emerge (Ellen
MacArthur Foundation, 2017). Textiles that are currently made from recycled content often rely on
polyester fibres made of waste plastic bottles and cannot be recycled themselves with the current
technology. As such, this is not really an example of a circular product, but rather a delayed disposal of
plastic packaging waste (Buchel et al., 2018).

Currently, little textile‐to‐textile recycling takes place due to technical challenges in fibre separation and
fibre quality (Elander et al., 2017; Palm et al., 2014). In mechanical recycling processes, all substances,
hazardous and non‐hazardous, remain in the material and are carried over to the new product.
Furthermore, as the mechanical recycling of most textile materials leads to inferior‐quality fibre of reduced
fibre lengths and strength, mechanical recycling can be regarded as downcycling (Morley et al., 2006).
Currently, mechanical fibre‐to‐fibre (12) cotton recycling is only applicable to 100 per cent cotton textiles.
As a result, recycled fibres need to be mixed with virgin fibre when producing new textiles. The maximum
share of recycled cotton fibres in new cotton clothing is currently about 30 per cent, while recycled denim
in jeans products amounts to 50 per cent (Wolkat, 2019; HNST, 2019). Up to 50 per cent recycled cotton
is also used in some blended yarns, in which cotton is mixed with synthetic fibres such as recycled PET or
nylon (Recover, 2019). Some applications of recycled polyester fibres, such as duvet filling, contain about
50 per cent recycled content (Watson et al., 2017). Other recycled fibres are widely used in insulation
materials for automotive upholstery etc. (Pitkänen, 2019). Overall, at present options for recycling end‐of‐
life technical textiles are quite limited, and significant volumes of them are directed to energy recovery.

The major barrier to high‐quality textile recycling is their diverse mix of materials, coatings, dyes and non‐
textile objects (Elander et al., 2017). Mechanical recycling of mixed fibres does not return a product of the
same quality as the original. When recycling polycotton for example, a separate fractionation step is
required to separate the cotton from the PET. This can be done chemically by depolymerising or dissolving
one of the components while maintaining the other (Palme et al., 2017). Such chemical recycling, however,
needs more development and its environmental impacts further investigated (Sandin and Peters, 2018;
Schmidt et al., 2016).

Table 2.1 Recycling processes for major fibres/textiles
 Material Mechanical recycling Chemical recycling
 Polyester Sorting by type and colour, washing Depolymerisation, repolymerisation and
 and chopping. extrusion into chips
 Extrusion into yarn
 Nylon /polyamide Cleaning and pelletisation (for Depolymerisation and repolymerisation
 homogenous flows only) to make new yarn
 Cotton Separation by colour, shredding and Promising innovative development
 re‐spinning
 Wool Separation by colour, pulling the Not available
 garment back into a fibrous state
 Polycotton Small scale processes for producing Requires pre‐separation into cotton and
 insulation materials and other lower polyester. Still in pilot phase
 grade applications
Source: Rengel (2017)

Textiles that are not collected separately generally end up in mixed municipal solid waste. Following
national municipal solid waste treatment strategies, 34 per cent of this textile waste is incinerated, 25 per

12
 cotton from used/worn textiles converted into cotton to make new textiles

Eionet Report ‐ ETC/WMGE 2019/7 16
cent is landfilled and 41 per cent is sent to mechanical‐biological treatment plants to reduce the organic
fraction prior to its incineration or landfilling (13).

There are substantial differences among European countries about when used textiles are and are not
defined as waste. In some countries all textiles collected through containers are considered waste, while
in others the actual reusability or the intention of the person delivering the textiles (discarding or donating)
is taken into account. This issue is of key importance for collection, transport, processing and ownership.
The handling of waste is regulated by the WFD and requires companies to have collection and processing
permits, waste shipping documents and to report in national waste registers (Watson et al., 2018).

13
 European Reference Model on Municipal Waste Generation and Management, 2018 version, 2015 data for EU,
Norway, Switzerland, Turkey and the UK

Eionet Report ‐ ETC/WMGE 2019/7 17
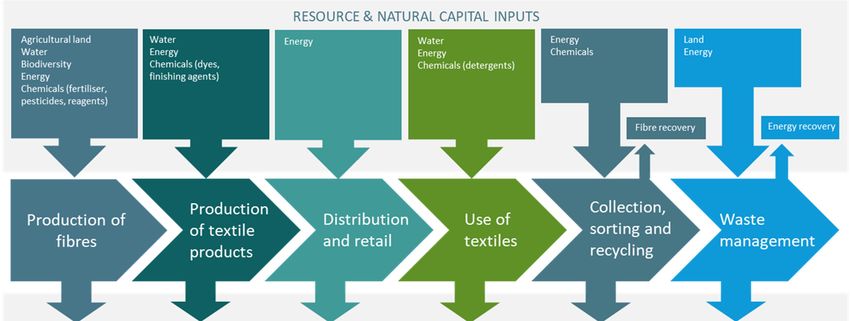
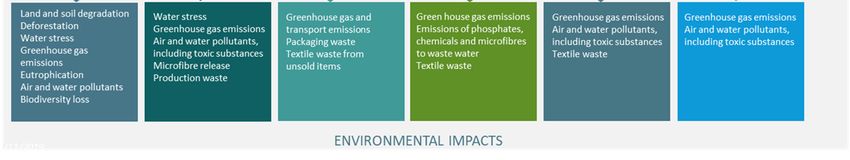
3 Environmental and social impacts of textiles
 3.1 Environmental impacts

The environmental impact of the production and consumption of textiles reflects the high complexity and
linearity of their value chain. The range of impacts varies depending on the different textiles and fibres
considered, as well as the environmental and socio‐economic contexts underlying the production,
distribution, use, and end‐of‐life phase (Figure 3.1). Amongst others, environmental impacts to which the
textile sector is a major contributor include the depletion of material resources and water, land use,
climate change and chemicals’ toxicity (JRC, 2014).

Figure 3.1 Environmental impacts across the textiles life-cycle

Source: EEA and ETC/WMGE, based on EEA (2014)

Environmental impacts in the production phase include the impacts of the cultivation of natural fibres,
due to such factors as changes in land use, extraction of water, and the use of fertilisers and pesticides,
and the energy required for production of synthetic fibres. The spinning and sizing of the fabrics, as well
as the finishing and printing/dyeing of the final products also contribute significantly (JRC, 2014). The
shipping of textiles around the globe adds to transport emissions and packaging waste.

Most impacts generated during the use‐phase are due to the maintenance of textiles. The way that people
use and clean their clothing and household textiles – washing, drying and ironing – has a significant impact
on the environment. Washing frequency is high across the EU, with an estimated average of 6.2 washes
per week per household, with 12 per cent washing most frequently at 60° C, 43 per cent at 40° C and
24 per cent at 30° C (Gray, 2017). The collection and management of end‐of‐life textiles also have impacts
through their transport and processing, not to mention the significant volume of textiles that are finally
incinerated and landfilled.

The following sections focus on the environmental impact of textiles from the perspective of resource and
land use, climate change through greenhouse gas emissions, and chemicals, which are among the most
significant impacts. The global distribution of environmental impacts related to final consumption of

Eionet Report ‐ ETC/WMGE 2019/7 18
textiles has been calculated using an extended multiregional input model based on Exiobase v.3.4 data
(Stadler et al., 2018), using environmentally extended product‐by‐product tables. In figures 3.2, 3.3, 3.4
and 3.5, 2011 Exiobase data were combined with 2017 household consumption data from Eurostat
(methodology in annex).

3.1.1 Resource use

The textiles industry relies heavily on resources, both renewable, such as natural fibres, and non‐
renewable ones, such as oil, to produce synthetic fibres, chemicals for dyeing and processing, and
pesticides and fertilisers for growing cotton (Ellen MacArthur Foundation, 2017).

To produce all clothing, footwear and household textiles purchased by EU households in 2017, an
estimated 675 million tonnes, 1,321 kg per person, of primary raw materials were used (Figure 3.2). This
includes all types of materials, such as fossil fuels as used as feedstock for synthetic fibres and to generate
energy; fertilisers, minerals and metals used for production facilities; and biomass, excluding water. Most,
85 per cent, of the primary material consumption, the highest share of all household consumption
domains, takes place outside Europe. This illustrates that material and energy intensive parts of the textile
supply chain, mostly occur outside Europe, like agriculture and fibre production.

Figure 3.2 The use of primary raw materials in the upstream supply chain ( 2 ) of EU
household consumption domains, indexed values with textile consumption equalling 100,
2017

Source: Exiobase v.3.4 (Stadler et al., 2018)
Note: CP052: household textiles

2
 This includes all activities in industrial and service sectors in the production and supply chain of textile products up
to purchase by households. It excludes the use of t textile products and end‐of‐life.

Eionet Report ‐ ETC/WMGE 2019/7 19
In addition, textile production requires large amounts of water. In 2017, the production of textiles
purchased by EU households required an estimated 53,000 million cubic metres (m³) of water. The major
part, more than 90 per cent of this is used outside Europe (Figure 3.3). This is due to the fact that water
use is mainly related to the growing of fibre crops, such as cotton, which is mostly takes place elsewhere
in the world. This impact is further exacerbated when cotton production occurs in locations with water
scarcity, and its use for agriculture competes with demands for drinking and sanitation as well as the
production of other crops. Depending on these and other factors, such as the quality of irrigation systems,
the global average water footprint of 1 kg of cotton is slightly over 10,000 litres (Chapagain et al., 2006).

Figure 3.3 The water use in the upstream supply chain (3) of EU household consumption
domains, indexed values with textile consumption equalling 100, 2017

Source: Exiobase v.3.4 (Stadler et al., 2018)
Note: CP052: household textiles

3.1.2 Land use

The production phase of textiles dominates the contribution of textiles to land use, in terms of agricultural
land and natural land transformation. Particularly for natural fibres like cotton, the cultivation phase has
an important impact on land use (JRC, 2014).

The land use in the supply chain of textiles purchased by European households in 2017 is comparable to
that of beverages and restaurants and hotels, which are both food related and thus land intensive product

3
 This includes all activities in industrial and service sectors in the production and supply chain of textile products up
to purchase by households. It excludes the use of t textile products and end‐of‐life.

Eionet Report ‐ ETC/WMGE 2019/7 20
domains (Figure 3.3). It is 6 times lower than the land use for food consumed by European households,
but 2–3 times higher than land use related to recreation and culture, and transport.

Figure 3.3 Land use in the upstream supply chain ( 4 ) of EU household consumption
domains, indexed values with textile consumption equalling 100, 2017

Source: Exiobase v.3.4 (Stadler et al., 2018)
Note: CP052: household textiles

For the production of textile products consumed by European households, only 7 per cent of the land use
takes place in Europe. Again, this relates to the fact that the agricultural part of the textile supply chain is
mainly located elsewhere in the world.

Today, the impact on land use of textiles is to a large extent a consequence of the cultivation of one single
fibre crop, cotton. Globally, cotton cultivation covers over 31 million hectares, or 2.4 per cent of the global
arable land area (Kooistra and Termorshuizen, 2006), the largest producers being China and India.

Land use for the cultivation of textile fibre crops has the potential to contribute to food deficits, as it may
interfere with the growing of food crops. The use of productive land for growing fibre crops contributes to
a scarcity of land available for food production, potentially reducing local food availability which can, in
turn, lead to malnutrition. It has been calculated that in India, for example, 9 per cent of national
malnutrition is attributable to cotton cultivation, which occupies 8 per cent of the country’s arable land
(Ridoutt et al., 2019).

4
 This includes all activities in industrial and service sectors in the production and supply chain of textile products up
to purchase by households. It excludes the use of t textile products and end‐of‐life.

Eionet Report ‐ ETC/WMGE 2019/7 21
Despite their durability and lower impacts in the use phase, animal‐based fibres and fabrics, such as silk
and wool from sheep, but also from cashmere and angora goats, alpaca, etc., generate a significant carbon
and land footprint during production due to their extensive use of land and methane emissions (Higg MSI,
2019; Lehmann et al., 2018). For animal fibres, recycling and fair trade initiatives have proved to have a
positive impact on land use (TextileExchange, 2018).

3.1.3 Greenhouse gas emissions

In 2015, greenhouse gas emissions from textiles production amounted to 1.2 billion tonnes CO2‐eq, more
than international flights and shipping combined (Ellen MacArthur Foundation, 2017). These greenhouse
gas emissions occur all over the world and from many economic sectors, including agriculture, the textile
industry and the distribution sector. According to JRC (2014), 51 per cent of the total impact of textiles on
climate change occurs in the production phase, 44 per cent in the use phase, and 5 per cent is due to
transport. The climate change impact during the use phase is caused by the use of detergents, washing
drying and ironing, each contributing an equal share of around 25 per cent of the total impact from the
use phase.

The production of textiles is characterised by high greenhouse gas intensity of, depending on the fibre,
15–35 tonnes CO2‐eq. per tonne of textile produced. This is much more than the 3.5 tonnes of CO2‐eq.
needed for the production of 1 tonne of plastic, or 1 tonne of CO2‐eq. for 1 tonne of paper (Eunomia,
2015).

Energy use in the production of raw materials and in the finishing of textiles are the main contributors to
climate change, with dye is the next most significant factor. The largest contributing fibre type to climate
change in the production phase is acrylic, followed by nylon and polyester, while silk has the least impact
(JRC, 2014). This reflects the higher impact of synthetic fibres compared to natural and recycled ones. For
example, it is estimated that substituting polyester with its recyclable counterpart, rPET, would reduce
CO2 eq. emissions by up to 40 per cent (TextileExchange, 2018).

The production of clothing, footwear and household textiles consumed in the EU generated total emissions
of approximately 334 million tonnes CO2‐eq worldwide in 2017, equivalent to 654 kg CO2‐eq. per European
citizen, making it the fifth largest, in terms of its climate change impact, amongst EU household product
groups. The textile supply chain generates around 30–50 per cent of the greenhouse gas emissions of the
housing, mobility and food supply chains (Figure 3.4). The global nature of the textile value chain is
highlighted by the fact that more 75 per cent of emissions related to the production of textiles consumed
by EU‐households are released elsewhere in the world – the highest share of all household consumption
domains.

Eionet Report ‐ ETC/WMGE 2019/7 22
You can also read