IMPROVING AGRICULTURAL INTERVENTIONS UNDER THE NEW NATIONAL TARGET PROGRAMS IN VIETNAM - June 8, 2020 - World Bank Document
←
→
Page content transcription
If your browser does not render page correctly, please read the page content below

Public Disclosure Authorized

 Report No: AUS0001541

 IMPROVING AGRICULTURAL INTERVENTIONS UNDER THE NEW NATIONAL
 TARGET PROGRAMS IN VIETNAM
Public Disclosure Authorized
Public Disclosure Authorized
Public Disclosure Authorized

 June 8, 2020
© 2020 The World Bank
1818 H Street NW, Washington DC 20433
Telephone: 202-473-1000; Internet: www.worldbank.org

Some rights reserved

This work is a product of the staff of The World Bank. The findings, interpretations, and conclusions expressed in this work do not
necessarily reflect the views of the Executive Directors of The World Bank or the governments they represent. The World Bank does not
guarantee the accuracy of the data included in this work. The boundaries, colors, denominations, and other information shown on any
map in this work do not imply any judgment on the part of The World Bank concerning the legal status of any territory or the
endorsement or acceptance of such boundaries.

Rights and Permissions

The material in this work is subject to copyright. Because the World Bank encourages dissemination of its knowledge, this work may be
reproduced, in whole or in part, for non-commercial purposes as long as full attribution to this work is given.

Attribution—Please cite the work as follows: “World Bank. 2020. Vietnam: Improving agricultural interventions under the new
National Target Programs. © World Bank.”

All queries on rights and licenses, including subsidiary rights, should be addressed to World Bank Publications, The World Bank
Group, 1818 H Street NW, Washington, DC 20433, USA; fax: 202-522-2625; e-mail: pubrights@worldbank.org.
TABLE OF CONTENTS
Acknowledgments .................................................................................................................................... 2
Executive Summary .................................................................................................................................. 3
1. Introduction ........................................................................................................................................ 11
2. Vietnamese Agricultural Performance: Aggregate Regional Analysis ................................................ 19
3. Narrowing the Agricultural Productivity Gaps—Analysis of Potential Pro-poor Value Chains .......... 37
4. Conclusions and Recommendations ................................................................................................... 71
References .............................................................................................................................................. 85
Annexes................................................................................................................................................... 87
Abbreviations and Acronyms
3R3G Three Reductions, Three Gains Technology
ARP Agricultural Restructuring Plan
ASEAN Association of Southeast Asian Nations
CEMA Committee on Ethnic Minority Affairs
CDRA Climate and Disaster Risk Assessment
CRED Center for Rural Economy Development
CSSP Commercial Smallholder Support Project
DARD Department of Agriculture and Rural Development
DFID Department for International Development
EU European Union
FAO Food and Agriculture Organization
GACP Good Agricultural and Collection Practices
GDP Gross Domestic Product
GOV Government of Vietnam
GSO General Statistics Office of Vietnam
HACCP Hazard Analysis and Critical Control Points
ICIMOD International Centre for Integrated Mountain Development
IFAD International Fund for Agricultural Development
IFC International Finance Corporation
IPSARD Institute of Policy and Strategy for Agriculture and Rural Development
IRRI International Rice Research Institute
IT Information Technology
M&E Monitoring and Evaluation
M4P Making Markets Work Better for the Poor
MARD Ministry of Agriculture and Rural Development
MIS Management Information System
MOC Ministry of Construction
MOF Ministry of Finance
MOLISA Ministry of Labor, Invalids and Social Affairs
MONRE Ministry of Natural Resources and Environment
MPI Ministry of Planning and Investment
NCO National Coordinating Office
NGO Nongovernmental Organization
NRD New Rural Development
NTP National Target Program
PforR Program-for-Results
PPP Purchasing Power Parity
PRDP Philippine Rural Development Project
SEDEMA Program for Socioeconomic Development for Ethnic and Mountainous Areas
SPR Sustainable Poverty Reduction
TFP Total Factor Productivity
VHLSS Vietnam Household Living Standards Survey
WDI World Development Indicators

 1
Acknowledgments

This analytical work and the report on the recommendations for improving agricultural interventions
under the new National Target Programs in Vietnam has been prepared by Hardwick Tchale (Senior
Agricultural Economist, SEAAG), Obert Pimhidzai (Senior Economist, EEAPV), and Carolina V. Figueroa-
Geron (Lead Rural Development Specialist, SEAAG).

The report benefited from comments from the following peer reviewers: Jan Joost Nijhoff (Senior
Agricultural Economist, SEAAG), Martin Henry Lenihan (Senior Social Development Specialist, SEAS1),
and Elliot Mghenyi (Senior Agricultural Economist, SAFA1). Additional guidance was received from
Paavo Eliste (Lead Economist, SEAAG), Binh Thang Cao (Senior Agricultural Specialist, SEAAG), Nghi Quy
Nguyen (Senior Social Development Specialist, SEAS1), and Ahmed A. R. Eiweida (Sector Leader and
Lead Urban Specialist, SEAU2).

The team worked closely with several consultants and consulting teams in undertaking this work. We
are therefore greatly indebted to Abhinav Kumar Gupta (Agribusiness and Value Chain Specialist,
Consultant), Douglas Forno (Institutional Specialist, Consultant), Claude Saint-Pierre (Social
Development Specialist, Consultant, Baies); the team from the Institute for Policy and Strategy for
Agriculture and Rural Development (IPSARD) comprising Tran Cong Thang (Director General), Truong
Thi Thu Trang, Nguyen Le Hoa, Nguyen Thi Thuy, Nguyen Thuy Nga, Pham Kieu Hanh, Pham Minh Tri;
and the team from Center for Rural Economy Development (CRED) comprising Vien Kim Cuong, Hoang
Thu Huong, Tran Nhu Trang, Nguyen Lam Giang, and Thai Huyen Nga.

The report was prepared with guidance from Dina Umali-Deininger (Practice Manager, SEAAG), Susan
Shen (Practice Manager, SEAS1), and Rinku Murgai (Practice Manager, EEAPV).

 2
Executive Summary

Main Objectives and Key Clients

The main objective of this analytical work is to recommend improvements to some of the agricultural
interventions under the new National Target Programs (NTPs). The analysis and the recommendations
thereof are meant to inform the design and implementation of two of the new NTPs. First is the new
NTP, focusing on ethnic minority groups, which is being designed by the Committee on Ethnic Minority
Affairs (CEMA) in coordination with other sectoral ministries such as Ministry of Agriculture and Rural
Development (MARD). This proposed NTP will focus on the socioeconomic development of ethnic
minorities and mountainous areas from 2021 to 2030. Second, some of these recommendations,
especially those related to value chain development, program planning and management, are also
relevant for the new NTP for the New Rural Development (NRD) which is being designed and its
implementation will continue to be coordinated by the National Coordinating Office (NCO) under
MARD in collaboration with provinces.1 The final report will therefore be submitted to both CEMA and
MARD to inform the detailed technical designs and implementation plans of several sub-programs
under both the new NTPs on ethnic minorities and the NRD.

This report focuses on improving agricultural incomes as a pathway out of poverty for Vietnam’s lagging
areas. Previous studies (World Bank, 2019a, b) have focused on improving access to off-farm
opportunities in lagging areas, as expanding non-farm wage incomes have been a key driver of poverty
reduction. However, there are also significant gaps in agricultural incomes between the regions, and
between the poor and non-poor within the region. This suggests that agriculture transformation is yet
to be completed, and there are untapped opportunities to further increase agricultural incomes of the
poor. This report thus focuses on closing this gap in agriculture, as another pathway for out of poverty.

While Vietnam has become a major international player in global food markets, there remains a
segment of the rural population that has not benefitted much from the country's success in terms of
economic growth, particularly the success of the agricultural sector. However, the old approach of
maximizing agricultural productivity is not fully compatible with this segment due to their unique
characteristics and challenges in terms of productivity limitations. This means that the agricultural
development strategy should now shift toward the integration of these poorer producers and regions,
facing major productivity challenges, into specialized value chains where they may have a comparative
advantage. While the recent iterations of the NTPs are a step in the right direction in terms of

1
 The World Bank, through the NTP Program-for-Results (PforR) operation, has been supporting the implementation of
three NTPs since 2017: NTP for NRD, Sustainable Poverty Reduction (SPR), and P135 (which is the predecessor of the new
NTP for Socioeconomic Development for Ethnic and Mountainous Areas (SEDEMA). The PforR support is going to close at
the end of 2021.

 3
agricultural interventions, changes need to be made in terms of investing in skills and organizational
capacity of the farmers themselves, prioritizing integration into niche product value chains, balancing
economic with environmental and social concerns, promoting transparent monitoring and evaluation,
and balancing the need for top-down administration with a flexible and participatory approach.

Although this work started when the COVID-19 pandemic was not fully pronounced in Vietnam and
around the globe—as it had just started in China—the pandemic has had significant influence on the
national economy as well as the performance of the agricultural sector. The pandemic has disrupted a
lot of economic activities, including the performance of the food supply chains through the disruption
of commodity flows, the limitations on movement and social distancing measures which affect labor
mobility, and the availability of agricultural inputs due to the disruption of supply contracts. All these
issues are likely to affect productivity negatively in the next production season, both from the demand
and supply market point of view. The implementation of the recommendations highlighted in this
report could help strengthen the strategies for post-COVID-19 economic recovery. Given its enormous
comparative advantage and capacity to increase production, Vietnam, as a net food exporting country,
can capitalize on the global disruption of food supply chains and the emerging surge in food demand
to ramp up its production and exports. In the northern mountainous regions, there may be need for
more support for farmers to recover quickly from the COVID-19 impacts. Some of the
recommendations in this report can help to inform the post-COVID-19 support strategies.

 Methodology: The report’s findings and recommendations are based on three interrelated studies: (a)
 analysis of the agricultural labor productivity and the factors correlated with the level of productivity using
 parametric methods; (b) analysis of pro-poor value chains, focusing on the commodity value chains which are
 relevant and already being produced in Vietnam, including among the ethnic minorities; and (c) analysis of
 lessons and experiences from other countries’ inclusive agricultural development programs, to draw on
 relevant strategies to improve agricultural interventions in the new NTPs, particularly the NTPs for ethnic
 minorities and NRD. The analysis is performed at two levels: (a) regional level to assess the existing differences
 in productivity and the factors that explain such differences, with the aim of understanding the country-
 context factors that may offer potential improvement in other areas, and (b) a slightly deeper analysis of the
 factors affecting productivity in the most lagging regions, that is, the northern mountainous regions—which
 is the focus of the new NTP (that is, SEDEMA).

Key Findings and Conclusions

1. Vietnam has a lot of potential to improve agricultural performance in its lagging regions.

Vietnam has achieved remarkable economic development over the last few decades, realizing major
gains in productivity and output and contributing to national goals related to poverty reduction and
economic transformation, including an increase in per capita income. In 2018, per capita income was
estimated to have grown by 7.1 percent, a little higher than 6.8 percent in 2017. Among Association of

 4
Southeast Asian Nations (ASEAN) countries, Vietnam ranked second after Cambodia whose per capita
income grew at 7.5 percent. Vietnam has almost doubled its per capita income in about a decade.

Vietnam has been a success in terms of agricultural development. Since the early 1990s, it has been
moving steadily to become a major force on the global food market. The country has emerged as one
of the world’s leading exporters of agro-food commodities, ranking among the top five global suppliers
of fish, rice, coffee, tea, cashew nuts, black pepper, rubber, and cassava.2 In 2019, Vietnam was a major
supplier in more than eight key global food value chains, on average generating revenues of over US$3
billion from each commodity, resulting in a total agricultural export revenue of US$40 billion in 2018
and 2019. Since 2010, Vietnam’s agricultural exports have registered positive trade balances, reaching
over US$7 billion in 2018.

Vietnam has gone through significant structural transformation, but agriculture remains one of the
key sources of livelihood and its performance determines the level of labor productivity particularly
among the poorest in the rural areas.

Although Vietnam has undergone rapid structural transformation, especially in the rural economy,
agriculture is still the main source of livelihood for most households, particularly those in the rural
areas. Rural labor is rapidly shifting away from the agriculture sector. Agriculture has, on average, lost
4 percent of its workers annually to other sectors since 2014. Agriculture’s employment share declined
to 40 percent in 2018 from around 50 percent in 2010. But most labor moved into nonagricultural jobs
within rural areas, significantly transforming the rural economy and rural household incomes. Nearly
as many rural workers are now employed in agriculture as in nonagricultural sectors. The share of
agriculture in rural incomes declined to about a third of household income in 2018. However,
agriculture remains a key source of livelihoods though households have mostly diversified their
livelihoods rather than completely abandoning agriculture. About 80 percent of rural households are
still engaged in agriculture, but only 26 percent are purely agricultural. Most households have a
combination of agricultural income and nonagricultural wage incomes, sometimes in combination with
household business incomes as well.

2. The Northern Midlands and Mountainous region’ performance on labor productivity is among the
 lowest, particularly among the ethnic minorities.

Based on the analysis of the Vietnam Household Living Standards Survey (VHLSS) and other studies,
there are some key challenges characterizing the main differences in terms of agricultural
productivity between regions. The Mekong River Delta, South East and Central Highlands regions have
59–77 percent higher aggregate agriculture value added than the Northern Midlands and Mountain

2
 From 2010, the number of commodities of which Vietnam has become one of the top five major suppliers doubled.

 5
region. The Mekong River Delta has the highest average agriculture value added of all regions. The
main factors correlated with differences in agricultural productivity are mostly the composition of crops
grown and the constraints related to landholding. There are also a host of other factors related to
access to productive factors, institutional support services, and market access which are discussed in
detail in Section 2 of the report. Productivity is lower among ethnic minorities. Overall agriculture value
added in the Northern Midlands and Mountain regions is less than the national average, and around
half of that of the most productive regions such as Mekong River Delta and South East regions. About
53 percent of Vietnam’s ethnic minority population lives in the Northern Midlands and Mountain
region. Within this region, ethnic minorities account for 56 percent of the population and 98 percent
of poor people. The South East and Mekong River Delta regions together account for 56 percent of the
country’s population but have less than a tenth of the ethnic minority population between them.

3. Increasing agriculture productivity remains one of the pathways out of poverty

Access to non-farm employment has been a primary driver of poverty reduction, but some
households will remain dependent on agriculture due to structural factors. Rising off-farm incomes
have accounted for nearly three quarters and half of poverty reduction in rural areas and among ethnic
minorities respectively, between 2010 and 2018 (World Bank, 2020). Low non-farm incomes largely
account for the income gap in the Northern Midlands and Mountain Region and among ethnic
minorities. For example, rural ethnic minorities generate 61 percent less non-farm wage incomes per
person than the Kinh & Hoa because fewer ethnic minorities have non-farm incomes and average
earnings of those who do, are lower than the national average. Nearly all (97 percent) rural ethnic
minority households are agricultural and 42 percent of them earn a living solely from agriculture -
double the share of Kinh and Hoa households that are solely dependent on agriculture. There are
similar differences between the poor and non-poor as the share of the rural poor solely dependent on
agriculture (54 percent) is more than twice the national rural average. A segmentation in the labor
market, with older and lowly educated people remaining in agriculture, suggests that a significant share
of people will remain in agriculture as they face limited off-farm income opportunities.

Closing the agriculture income gap will help reduce poverty in rural areas. Differences in the type of
agriculture activities account for the differences in agriculture income between the poor and non-poor
rural farmers within regions. For example, poor farmers in the mountainous areas generate less income
from perennial and industrial crops which are more profitable there. Thus, there are unexploited
opportunities for poor farmers in the region to increase agriculture incomes. This makes boosting
agriculture income an important pathway out of poverty for households in this region, in addition to
expanding off-farm income generating opportunities.

Increasing agricultural productivity in a few of the lagging areas is an appropriate strategy to improve
agricultural productivity and overall livelihoods. There are many reasons why increasing labor

 6
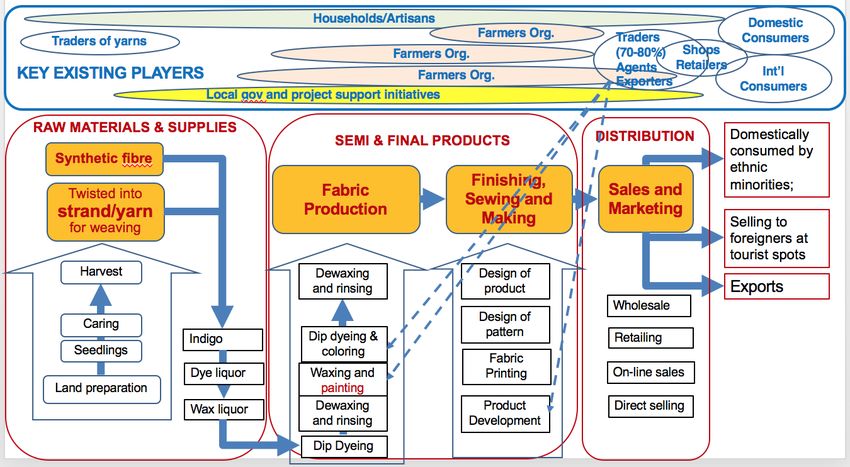
productivity and access to value chains is a valid proposition for these few lagging areas. First, with a
large share of ethnic minority population, the ethnic minorities can only move sustainably out of
poverty if agriculture, which is one of their most important sources of income, is productive. Increasing
agricultural labor productivity is a secure way to allow labor to shift out of subsistence agriculture,
which has so far been insufficiently pursued in Vietnam. Second, mountainous areas and the less fertile
midlands in Vietnam have and will remain with limited potential for most of the major agricultural
commodities exported. However, these areas have kept a unique diversity of agricultural products and
know-how. They have more potential to grow organic food and access niche products. Developing
related value chains and exploiting potential niche markets is vital for the large share of the poor in the
country's mountains and midlands. It is also conducive to improving the quality of life of the urban
population in Vietnam while preserving the environment in the mountains and midlands and nurturing
a unique range of innovative, high-value enterprises.

4. Promoting value chain development therefore offers potential to narrow productivity differences.

One of the key strategies to narrow productivity differences is to promote value chain development,
focusing on niche markets and products. Vietnam is recognized for its success in developing pro-poor
value chains at the local level. The new NTPs are a unique opportunity to scale up this approach. The
analysis of some selected value chains demonstrates some commodities with significant potential to
improve the productivity of the people in the northern regions, particularly among the ethnic minority
groups, given the unique skills and capabilities they have in the production of most of these
nontraditional commodities. Such commodities include spices (for example, cinnamon), medicinal
plants (for example, lemon grass, turmeric, coriander), vegetables, tea, handicrafts (for example,
brocade, indigo) and small livestock (for example, indigenous chickens). Most of these are unique and
produced most by the ethnic minorities than in other areas of Vietnam. Most of these commodities are
also linked to niche markets and products in the region and in developed country markets. However, a
lot needs to be done to develop these into organized supply chains, capable of competing in the
regional and international markets. Investments in infrastructure and logistics are required to promote
the vegetable, tea and poultry value chains. Enhanced value chain organization and production
standards are required to improve the tea and medicinal herbs as well as the spices. For all the
commodities' value chains analyzed, strengthening collective action is important to improve economies
of scale and risk-sharing to encourage farmer innovation beyond the traditional systems. Both
horizontal and vertical links need to be promoted to create avenues to access favorable niche markets,
which drive investment and innovation.

 7
In order to achieve significant scaling-up, it is important to integrate successful agricultural value
chain development in the design of comprehensive national level programs, such the NTP,
particularly in the new NTP focusing on ethnic minorities and the mountainous regions in Vietnam.
Provincial governments should continue to be responsible for designing social and economic
development programs at the provincial level. Centralization of design and implementation of local
level programs contributes to fragmentation of development programs and poor coordination of
market-related decisions due to the high number of provinces. The agricultural value chain
development is better coordinated and implemented by the devolved provincial institutions, such as
the provincial Departments of Agriculture and Rural Development (DARDs) or other similar provincial
institutions. More recently, the regional-level departments have also been authorized to plan
government action in relation to climate change or major infrastructure. Similarly, agricultural value
chain strategies deserve being designed and implemented through a more coordinated approach at
the provincial level.

The specific recommendations to strengthen the design and implementation of agricultural
interventions under the new NTPs include: (i) balancing investment between infrastructure and
livelihood and production support; (ii) enhancing program planning and management; (iii)
mainstreaming the use of community participation tools to enhance community ownership and
accountability; (iv) considering to introduce performance-based budget allocation to provide an
incentive for better performance; (v) strengthening governance and accountability for results; (vi)
prioritizing value chains based on unique features and comparative advantage; (vii) promoting the
"soft" investments in training of rural households in value chain development; (viii) facilitating
upgrading of product quality as a critical step to enter organized value chains; (ix) promoting vertical
linkages (from primary production to the market) and horizontal linkages (coordinated actions among
producers and market operators); and (x) applying adequate care to ensure that the value chain
development is in tandem with a "do not harm" approach. These are elaborated in more detail in
Section 4 of the report.

To facilitate value chain development for the commodities that are relevant to the ethnic minorities,
NCO/MARD and CEMA should consider the following key issues and proposed recommendations.
Other more detailed, granular and commodity-specific recommedations are highlighted in Section 3
and Section 4 of the report. Section 4 also provides additional institutional and process-related
recommendations drawn from international lessons and experiences. These are more relevant to
inform the institutional and operational aspects of the program design.

 8
Table E.1: Overview of issues/constraints and recommendations for agricultural value chain development
among ethnic minorities
 Key issues/constraints Proposed interventions/recommendations
Overall • Small and fragmented • Promote consolidation of land for farmers producing
 production systems similar products.
 • Lack of uniformity in terms of • Promote crop consolidation, with same varieties and
 product quality and quantity land husbandry practices to ensure uniformity and
 quality of products.
 • Encourage collective action among farmers to ensure
 collective decision-making and risk-sharing.
Market and • Lack of market information on • Establish centralized high-frequency market information
market access specific value chains, leading to systems and facilitate cell phone access to farmers.
 difficulty for long-term planning • Provide organizational and business skills training to
 and investment farmers.
 • Weak organizational and • Promote public investment in market access
 marketing skills among farmers infrastructure, including commodity aggregation
 • Remoteness and lack of centers.
 aggregation facilities
Value chain • Noncompetitive structure • Government policy on supply base management to
structure leading to manipulation of small ensure fair competition and effective enforcement of
 ethnic minority producers. productive alliances with buyers and traders/exporters.
 • Ethnic minority producers or • Provide training on new developments of market
 other small players left behind in opportunities to target ethnic minority producers.
 modern trade channels due the • NTP management to invest in regular value chain
 lack of capacity studies to provide timely information to farmers on
 • Untapped opportunities for market developments and requirements.
 value chain development
Value creation Product and service development
 • Limited portfolio of products, • Promote product research and training of farmers on
 mainly traditional niche how to meet product quality standards.
 products • Build up indigenous knowledge base for unique
 • Special certified products too products, which can be branded for specific ethnic
 costly for small players. minority communes/districts/provinces.
 • Lack of knowledge of niche • Support farmers with certification process, on a cost-
 products and niche markets in recovery basis.
 the local, regional, and
 international markets
 • Overuse of inputs (fertilizers and • Provide training on Integrated Pest Management and
 pesticides) Nutrition Soil Management (for input agents and
 • Unprofessional technical advice producers).
 by input distribution agents • Strengthen government regulation over
 pesticides/herbicides market.
 Technical training
 • Inadequate and irrelevant • Intensify on-the-job training and refresher courses for
 knowledge among training extension service providers that serve the ethnic
 providers, especially on value minorities, on key technical skills, including aspects of
 chain development agricultural value chain development.
 • Capacity building mostly supply- • Encourage demand-driven approach to farmers’
 driven training to ensure timely and relevant training of
 farmers.

 9
Access to finance
 • Limited access to finance, • Promote productive alliance models, such as contract
 inputs, and technical assistance farming which may help farmers pre-finance inputs and
 among farmers and farmers’ other operational costs.
 groups • Provide advice to target producers on assessment of
 • Lack of consultation on risk and management of loans.
 assessment and management of • Promote group lending to, as opposed to individual
 risks. household lending, to spread the loan risk and increase
 • Costly credit provided to local the power of producers through collective negotiation
 factories or input material and market access.
 suppliers; prohibitively high
 repayment arrangements for
 farmers.
Value chain • Weak, limited, or nonexistent • Promote ethnic minority producer collaboration
link vertical and/or horizontal links groups—formulation and capacity building.
 among players in the value • Support establishment and development of
 chain. collaborative arrangements between all actors in the
 value chains.
 • Support models that enhance links between actors, for
 example, traceability system, certified production and
 processing system, or information sharing platforms,
 e.g. well-planned study tours.
Sharing value • Unfair sharing of value, leading • Strengthen contract compliance and ethical behavior
created to non-contract compliance among primary producers and buyers and other value
through the including side selling of chain stakeholders, through establishment of
supply chains commodities, with primary mechanisms for legal contract enforcement and close
 producers mostly being on the monitoring.
 receiving end
 • Unethical behavior among both
 suppliers and buyers

 10
1. Introduction

Vietnam’s economy and agricultural performance in particular, have widely been described as a
success story. However, there are a few pockets, considered to be the ‘last mile’ in terms of productivity
growth and poverty reduction, which require strategies to ensure more inclusive socioeconomic
growth.

1.1 Over the past quarter century, Vietnam’s economy has achieved enormous progress, realizing
major gains in productivity and output and contributing to national goals related to poverty
reduction and economic transformation, including an increase in per capita income. In 2018, per
capita income was estimated to have grown by 7.1 percent, a little higher than 6.8 percent in 2017.
Among Association of Southeast Asian Nations (ASEAN) countries, Vietnam ranked second after
Cambodia whose per capita income grew at 7.5 percent (Figure 1 and Table 1). Vietnam has sustained
a fast pace of economic growth, almost doubling the per capita income in about a decade.3 Since 1986,
strong economic and political reforms under Đổi Mới, have spurred rapid economic growth,
transforming the economy to lower-middle-income status. In about 1616 years from 2002 to 2018,
more than 45 million people have been lifted out of poverty. Poverty has declined sharply to less than
6 percent (based on US$3.2 per /day purchasing power parity [PPP] poverty line), and gross domestic
product (GDP) per capita increased by 2.5 times, to around US$2,500 in 2018. While the transformation
process has moved the economic base toward industry and services, strong agricultural performance4
has partly consolidated Vietnam’s economic success by ensuring food security and rural poverty
reduction, including real growth in agricultural exports. Vietnam has become a major supplier of most
food commodities in the international market.

3
 In 2000, the estimated per capita income was around US$400, and it rose to US$2,567 in 2018, with a growth rate
averaging more than 5 percent during the entire two decades. (World Development Indicators - WDI)
https://data.worldbank.org/indicator/NY.GDP.PCAP.CD?locations=VN.
4
 Vietnamese agriculture has been growing between 2.6 percent and 3.0 percent from 2011 to 2015, and at about 3
percent on average since 2016; it contributes about 15 percent of GDP (2018 estimate) and employs some 20.6 million
people, representing 38 percent of the workforce (2018 estimate).

 11
Table 1: Vietnam - Selected economic indicators, 2000–
 Figure 1: GDP per capita growth (%), 2018
 2018
 estimate, regional comparison
 GDP GDP Growth Total Total Trade
 (US$, per in GDP exports imports balance
 Cambodia 7.5
 billions) capita per (US$, (US$, (US$,
 Vietnam 7.1 (US$) capita (%) billions) billions) billions)
 Philippines 6.2 2000 31 402 6.8 14 15 −1.0

 Mynmar 6.2 2005 52 642 8.4 32 36 −4.0
 Indonesia 5.2
 2010 115.9 1,318 6.7 71 84 −13.0
 Malaysia 4.7 2015 193.2 1,667 6.7 162 166 −3.6
 Thailand 4.1 2016 205.3 1,753 6.2 177 174 2.5
 Singapore 3.1 2017 223.0 1,853 6.8 214 212 2.9
 0 5 10 2018 245.0 2,567 7.1 245 238 7.2

 Source: WDI. Source: General Statistics Office of Vietnam (GSO).

1.2 Vietnam is one of the world’s leading exporters of agro-food commodities, ranking among
the top five global suppliers of fish, rice, coffee, tea, cashew nuts, black pepper, rubber, and cassava.
From 2010, the number of commodities in which Vietnam has emerged among the top 5 major
suppliers has doubled. In 2019, Vietnam was a major supplier in more than eight key global food value
chains, on average raking in over US$3 billion from each commodity, resulting in a total agricultural
export revenue of US$40.02 billion in 2018 and 2019 (Figure 2). Since 2010, Vietnam’s agricultural
exports have registered positive trade balances, reaching over US$7 billion in 2018. Even though
Vietnam’s global agricultural export competitiveness hinges on high-output, low-quality, and
undifferentiated products, the country has demonstrated that it is possible to achieve dominance in
the agricultural food value chain within one decade. This strong agricultural export performance and
the increasing international market share achieved prove beneficial to many Vietnamese farmers, if
they are well organized to participate effectively in this growing and thriving agro-export market.

 12
Figure 2: Vietnam agricultural export value, US$, millions (2010–2019)
 45,000

 40,000

 35,000

 30,000

 25,000

 20,000

 15,000

 10,000

 5,000

 0
 2010 2011 2012 2013 2014 2015 2016 2017 2018 2019

 Seafood Vegetable and fruits Cashew Coffee Tea Black pepper Rice Cassava Wood and products Rubber others

Source: GSO.

1.3 Vietnam’s buoyant agricultural export competitiveness has been reliant on fairly strong
sector performance. As shown in Table 2, Vietnam’s agriculture, forestry, and fisheries sector is vibrant,
cultivating many key commodities on 11.5 million ha (agricultural production land – excluding forestry
land). Both the production and average yields of each of these commodities are higher compared to
most countries, both regionally and globally. Since 2015, the sector has expanded by about 3 percent,
with most crops registering increased yields (except cashew and pepper). In terms of land use, there
has been a shift from some of the key food crops, such as paddy, maize, cassava, sugarcane, peanut,
and soybean, toward vegetables, fruits, aquaculture, coffee, cashew, and pepper. This reflects a
renewed vision for the agricultural sector and for the roles and modalities of government in the sector.
This vision was laid out in the Agricultural Restructuring Plan (ARP),5 released as a decision by the Prime
Minister in June 2013. The ARP is a radical change in sectoral strategic direction, which aims to achieve
sectoral growth with efficiency and environmental sustainability. Hence, the plan emphasizes
improvements in quality and sustainability of growth and the quality of products, jobs, and other
results.

5
 The ARP was adopted following the Decision No. 899/QD-TTg dated June 10, 2013 approved by the Prime Minister. It
was based on the recognition that the country’s growth model, based on rice intensification, was unsustainable and could
no longer be relied upon as the basis for sustaining future sector growth and export competitiveness. The ARP thus
focuses on structural transformation toward high-value commodities, increased value-addition, and reduced
environmental footprint.

 13
Table 2: Crop production - Quantity (thousand mt), area (thousand ha), and average yield (mt/ha)

 2015 2018 % change
 Area Quantity Average Area Quantity Average Area Quantity Yield
 Yield Yield
Paddy 7,827 45,179 5.8 7,570 43,979 5.8 −3.3 -2.7 0.6
Maize 1,150 5,230 4.5 1,039 4,906 4.7 -9.7 -6.2 3.8
Rubber 986 1,013 1.0 965 1,142 1.2 -2.1 12.7 15.2
Vegetables 890 15,303 17.2 962 17,093 17.8 8.1 11.7 3.3
Fruits 827 950 14.9
Coffee 643 1,453 2.3 688 1,626 2.4 7.0 11.9 4.6
Cassava 550 10,400 18.9 515 9,940 19.3 −6.4 −4.4 2.1
Cashew 290 352 1.2 301 260 0.9 3.8 −26.1 −28.8
Sugarcane 284 18,322 64.5 269 17,837 66.3 −5.3 −2.6 2.8
Peanuts 200 448 2.2 186 459 2.5 −7.0 2.5 10.2
Pepper 102 177 1.7 150 255 1.7 47.1 44.1 −2.0
Tea 134 1,013 7.6 124 987 8.0 −7.5 −2.6 5.3
Soybeans 101 146 1.4 53 81 1.5 −47.5 −44.5 5.7
Others 1,670 — — 1,368 — — −18.1 — —
Total area 15,654 — — 15,140 — — −3.3 — —
Source: Estimation (only yield) based on data from MARD.

Vietnam’s Agroecological Zones
1.4 There are significant variations in climatic conditions between regions in Vietnam due to the
diverse topography and the length of the country. Based on these differences, the country is divided
into eight agro-ecological regions: the North West, the North East, the Red River Delta, the North
Central Coast, the South Central Coast, the Central Highlands, the South East, and the Mekong River
Delta. Most of these agro-ecological zones coincide with the regions, and thus characterize the regional
differences in terms of agricultural production, crop systems and seasons and crop yields. Market
access is also different, with road networks a bit sparser in northern mountainous regions than in the
other regions.

1.5 Even though Vietnam’s agriculture has performed well and has broadly led to the
transformation of the rural sector, in some areas, particularly in the Northern Midlands and
Mountain regions (predominantly inhabited by the ethnic minorities), agricultural performance has
lagged behind the rest of the country, in terms of agricultural labor productivity.6 For example, in

6
 Agricultural productivity is measured as the ratio of the total value of agricultural outputs to total cost of agricultural
inputs. Output is usually measured as the market value of final output, which excludes intermediate inputs, and this output
value may be compared to many different types of inputs such as labor, land, and other variable or fixed factors of

 14
Figure 3a, estimates of labor productivity from paddy production show that the Mekong River Delta is
by far the most productive region, followed by the South East, the Red River Delta, and the northern
coastal areas. The Northern Midlands and Mountains, as well as the Central Highlands, lag behind in
terms of labor productivity in paddy production. Similarly, in Figure 3b, the Mekong Delta and the South
East perform better in terms of total agricultural labor productivity than the other regions, with the
Northern Midlands and Mountains lagging behind the rest.

 Figure 3a. Paddy rice labor productivity per day (VND, Figure 3b. Average agricultural labor productivity
 thousands) 2018 per day by region (VND, thousands) 2018

 Vietnam 167 Vietnam 188

 Mekong river Mekong river
 389 402
 delta delta

 South east 127 South east 313

 Central
 43 Central highlands 161
 highlands
 North central North central and
 125 161
 and coastal coastal
 Northern Northern midland
 71 88
 midland and… and mountains

 Red river delta 125 Red river delta 161

 VND ('000) per day VND ('000) per day

 Source: Based on VHLSS 2018.

1.6 In all the regions, agricultural labor productivity is consistently lower among the other ethnic
minorities compared to the Kinh-Hoa. In both the performing and lagging regions, agricultural labor
productivity among the ethnic minorities is less than half that of the majority Kinh and Hoa ethnic
groups. However, in the lagging regions such as the Northern Midlands and Mountains, agricultural
labor productivity among the ethnic minorities is much lower both in absolute and relative terms
(Figure 4).

production. This is called partial measure of productivity. Agricultural productivity may also be measured by what is termed
total factor productivity (TFP). This method of calculating agricultural productivity compares an index of agricultural inputs
to an index of outputs. This measure of agricultural productivity was established to remedy the shortcomings of the partial
measures of productivity, notably that it is often hard to identify the factors that cause them to change. This analysis adopts
the partial measure of productivity, as explained in Box 2 in Section 2.

 15
Figure 4. Agricultural labor productivity per day by region and ethnicity, 2018
450
400
Kinh & Hoa Ethnic Minorities
350
VND ('000) per day
300
250
200
150
100
50
0
Red river delta Northern midland North central and Central highlands South east Mekong river Vietnam
and mountains coastal delta
Source: Based on VHLSS 2018.
1.7 To achieve inclusive agricultural growth, these glaring differences in agricultural labor
productivity need to be addressed at the regional and provincial levels, with focus on narrowing the
gap between the Kinh-Hoa and other ethnic minorities. Remoteness and limited access to markets
and nonfarm wage opportunities do affect production choices among poor farmers and depress the
prospects for agriculture to be the key driver of poverty reduction. Almost all the mountainous regions
have poor access. A recent poverty analysis by the World Bank7 shows that limited access to markets
affects not only the opportunities for off-farm wages, as industries and enterprises tend to be far away,
but also resource allocation in agriculture in favor of low-value food crops. Due to poor integration of
food markets, the existence of a price wedge between on-farm production and the market drives many
poor households (including ethnic minorities) to resort to low-level subsistence equilibrium and
farming systems that are biased toward rice and other food crops to meet basic food security. This
means that improving market access (that is, reducing the economic distance) between the rest of
Vietnam and the mountainous regions is another important factor, though not the only necessary one,
to improve agricultural and non-farm opportunities. This would help quicken the process of
convergence between the lagging and non-lagging regions.
1.8 Without raising agricultural productivity, even well-targeted rural development programs,
such as the NTP in Vietnam, may only widen rather than close the productivity gap between lagging
and non-lagging areas. The Government of Vietnam (GOV) strategy for ensuring inclusive growth has
seen 16 NTPs implemented from 2011 to 2015. In 2016, the GOV consolidated the 16 NTPs into 2 NTPs
for the next implementation period until 2020. The NTPs for the NRD and Sustainable Poverty
Reduction (SPR) aim to raise rural incomes and productivity while reducing the significant
socioeconomic disparities between rural and urban areas. In agriculture, the GOV has been
7
World Bank. 2019. Poverty Update Report – Better Opportunities for All: Poverty Reduction and Shared Prosperity in
Vietnam. Washington, DC: World Bank.
16implementing the ARP since 2013. While the two NTPs (NRD and SPR, including P135) and ARP are meant to reinforce and complement each other, there are some differences. The NTP-NRD focuses on provinces that are less well integrated into the mainstream economy; NTP-SPR, particularly P135, targets mainly ethnic minorities and remote areas with integrated interventions, including agriculture, to help them catch up (converge) with the rest of the country. The ARP, on the other hand, is a national program aimed at achieving structural reforms to strengthen investments in the key drivers for long- term sustainable agricultural growth. 1.9 The results of the recent review of the ten-year implementation of the NTPs (NRD and SPR) show that they have led to significant improvements across the board. However, most of the poor living in the northern and central mountainous regions, particularly the extremely poor ethnic minorities, are still lagging compared to other regions (and non-ethnic groups).8 As the GOV is now considering developing NTPs for 2021–25 (Box 1), there is a need to explore how to improve the effectiveness and quality of interventions required to narrow the productivity gap between the lagging and non-lagging regions of the country. There is also a need to consolidate the evidence base on whether and how agriculture can be a significant determinant of poverty reduction in the lagging regions and among ethnic minorities, under what circumstances, and specific investment options with the potential to help achieve program objectives. Box 1: The Proposed NTP on SEDEMA, 2021–2030 Following the Vietnam National Assembly Resolution on the new NTP to support ethnic minorities in the northern mountainous regions, CEMA has formulated the NTP on SEDEMA to be implemented over 2021–2030. The objective of the program is to improve living standards of people in ethnic minority and mountainous areas, develop a livelihood model based on stable jobs, and ensure that the per capita income of ethnic minority people doubles in 2025 compared to per capita income at the end of 2020. Some of the key program areas are to develop agricultural and forestry production, promote regional potential, and strengthen production in value chains. As part of this program, the key areas of investment will include (a) developing agricultural production (including agriculture, fishery and salt production), promoting regional potential and strengths to raise incomes and living standards and produce commodities in value chains; and (b) investing in and developing models of raising cattle and poultry along the value chain, planting areas of Ngoc Linh ginseng and precious medicinal herbs, promoting startups and entrepreneurship, and attracting investment in ethnic minority and mountainous areas. The key areas of support include (a) providing productive land to 90% of poor ethnic minority households living on agriculture, forestry, and fishery and (b) providing credit and other forms of public sector services. The estimated total budget for the program implementation is VND 604,051.49 billion, of which VND 344,700.82 billion is for 2021–25 and VND 259,350.56 billion for 2026–2030. For the agriculture support program, the total budget required for 2021–2030 is VND 16,325 billion. For 2021–2025, the estimated budget for implementation is VND 4,175 billion, of which VND 1,500 billion is expected to be from domestic loans, and VND 1,350 billion is expected to be raised from the community, businesses, and international donors. 8 The results are based on the reports from the recent 10 Year Implementation Review of the NTP. 17
This analytical work’s recommendations are expected to inform the technical design and implementation planning for
 the agricultural elements of SEDEMA.
1.10 Through analysis of the agricultural labor productivity and the factors causing it, informed by
analysis of pro-poor value chains, and the lessons and experiences drawn from other countries’
inclusive agricultural development programs, this report provides recommendations for improving
the quality and relevance of agricultural interventions in the new NTPs, particularly focusing on the
NTP for ethnic minorities and NRD. This analytical work is meant to help the GOV make informed
decisions and/or adjustments required to improve agricultural interventions under the NTPs. The
analysis draws mainly from VHLSS data for 2016 and 2018 to explore how to improve the design and
implementation of agricultural interventions under the new NTPs, especially the NRD and the new NTP
focusing on ethnic minority groups.9 The analysis also draws from a pro-poor value chain analysis as
well as the lessons and experiences from other countries which have faced similar challenges, to
manage the transition of agriculture in their lagging regions.

1.11 This report is arranged as follows: Section I presents a brief overview of Vietnam’s agricultural
success story, as well the limitations in reaching out to the lagging regions. Section 2 focuses on a
detailed analysis of Vietnamese agricultural performance from a regional perspective, concentrating
on the gaps between regions, within regions, and between different ethnic groups. This section also
discusses the key factors causing productivity gaps. It highlights areas needing attention to achieve
some level of convergence over time. Section 3 explores how to narrow the productivity gaps by
promoting strong market integration of the ethnic minorities based on the findings from the analysis
of some of the pro-poor value chains, some of which are already prevalent among the ethnic minorities.
Finally, section 4 draws key conclusions and highlights the recommendations to inform program design
and implementation based on the analysis and the lessons and experiences from other countries which
have implemented similar national poverty reduction programs. Section 4 also highlights the specific
commodity-value chain issues, constraints, and recommendations.

9
 The new NTP focusing on ethnic minority groups is being designed by CEMA in coordination with other sectoral ministries
such as MARD. The new NTP on NRD is being designed by the NCO under MARD. Some of the preliminary sections of this
report have been informally discussed with the NCO and other members of the design teams from MARD and CEMA. The
final report of this work will also be presented to the NCO and CEMA as they are the key audience for this work. The findings
and recommendations highlighted in this report are expected to inform the detailed technical designs and implementation
plans of several subprograms under both the new NTP on ethnic minorities and the new NRD.

 18
2. Vietnamese Agricultural Performance: Aggregate Regional
 Analysis

This section highlights the key differences in agricultural land and labor productivity at the regional level and
discusses the key factors leading to the observed differences. It highlights that regional differences in farm
production systems, access to land for higher-value crop production, and market access explain labor
productivity differences, though ethnic minorities face additional constraints due to poor farm management
skills and disguised unemployment within agriculture owing to their low levels of education and larger household
sizes for the land they own.

Role of Agriculture in Closing Income Gaps in the Rural Economy
2.1 Vietnam is undergoing rapid structural transformation, especially in the rural economy. Rural
labor is rapidly shifting from the agriculture to the non-agricultural sector (Figure 5). The sector has, on
average, shed 4 percent of its workers annually since 2014. Its employment share declined to 40
percent in 2018 compared to around 50 percent in 2010. But most labor moved into nonagricultural
jobs within rural areas, significantly transforming the rural economy and boosting rural household
incomes. Nearly as many rural workers are now employed in agriculture as in non-agricultural sectors.
The share of agriculture in rural incomes declined to about a third of household income in 2018 (Figure
6).

 Figure 5. Trends in agriculture and rural Figure 6. Composition of rural incomes by source
 nonagricultural employment (millions), 2010–18 (%), 2018
 27
 Thousands

 25 15%
 23 30%

 21

 19 23%

 17 4%

 15
 28%
 13
 Q1
 Q2
 Q3
 Q4
 Q1
 Q2
 Q3
 Q4
 Q1
 Q2
 Q3
 Q4
 Q1
 Q2
 Q3
 Q4
 Q1
 Q2
 Q3
 Q4
 Q1
 Q2
 Q3
 Q4

 Household farming Agricultural wages
 2013 2014 2015 2016 2017 2018 Non-agriculture wages Household business
 Agriculture Rural non-agriculture All other income

 Source: GSO Labor Force Survey Reports 2013–18 and based on VHLSS 2018.

2.2 Rising wage incomes made the largest contribution to poverty reduction. Wage incomes
increased by 78 percent and household business income more than doubled during 2010-18, which
was primarily responsible for the 79 percent increase in household income nationally. Income-poverty

 19
decompositions (World Bank, 2020) show that growth in non-agriculture wage incomes accounted for
nearly 12 percentage points of the decline in poverty reduction during 2010-18 period - equivalent to
85 percent of the observed decline in poverty. However, the contribution of rising wages is lower in
rural areas and among ethnic minorities. Close to three quarters and more than half of the reduction
in poverty in rural areas and among ethnic minorities can be attributed to rising wages during 2010-18.
Favorable demographics and incomes from agriculture contributed to the reduction in poverty in rural
areas and ethnic minorities by slightly more than their contribution to the overall reduction in poverty
in the country.

2.3. Indeed, agriculture remains a key source of livelihoods because households have mostly
diversified their livelihoods instead of exiting agriculture. About 80 percent of rural households are
still engaged in agriculture, but only 26 percent are purely agricultural (Table 3). Most households have
a combination of agricultural income and nonagricultural wage incomes, sometimes in combination
with household business incomes. In fact, close to 40 percent of rural households had three or more
income streams in 2018, including remittances and government transfers. Sectoral decompositions of
changes in poverty with households grouped by their livelihood sources suggest that more than half of
the reduction in poverty was due to declining poverty among with a mix of agriculture and other
income sources (World Bank, 2020).

2.4 The extent of dependence on agriculture for livelihood varies across regions, but differences
are starker along poverty and ethnic lines. Households in the Central Highlands, Mekong River Delta,
and Northern Midlands and Mountain regions are the most dependent on agriculture, which
contributes to 60 percent, 42 percent, and 35 percent of household income. respectively, compared to
just 17 percent in the Red River Delta (Table 3). Nearly all (97 percent) rural ethnic minority households
are agricultural; 42 percent of them earn a living solely from agriculture. This is double the share of
Kinh- Hoa solely dependent on agriculture. There are similar differences between the poor and non-
poor as the share of the rural poor solely dependent on agriculture (54 percent) is more than twice the
national rural average. Consequently, agriculture contributes to half of ethnic minorities' household
incomes and 65 percent of poor household incomes, compared to the national average of 32 percent.

 20
Table 3: Households' economic participation by region, ethnicity, and poverty status, 2018
 Vietnam Region
 Rural Minorities Poor RRD NMM NCC CH SE MRD
 Share of income (%)
 Agriculture 0.80 0.97 0.96 0.74 0.94 0.81 0.96 0.59 0.76
 Agriculture only 0.26 0.42 0.54 0.16 0.30 0.24 0.55 0.22 0.27
 Household business 0.54 0.47 0.35 0.60 0.57 0.55 0.32 0.61 0.50
 Nonagricultural wages 0.28 0.18 0.13 0.30 0.27 0.28 0.16 0.26 0.31
 Remittances 0.15 0.15 0.17 0.17 0.13 0.17 0.15 0.14 0.15
 Transfers 0.31 0.29 0.32 0.33 0.30 0.31 0.32 0.30 0.31
 Income share (%)
 Agriculture 0.32 0.50 0.65 0.17 0.34 0.31 0.60 0.26 0.42
 Crop cultivation 0.17 0.27 0.33 0.08 0.17 0.13 0.45 0.15 0.25
 Nonagricultural wages 0.41 0.34 0.27 0.52 0.44 0.44 0.20 0.49 0.30
 Source: Based on VHLSS 2018.
 Note: CH = Central Highlands; MRD = Mekong River Delta; NCC = Northern and Central Coastal; NMM = Northern
 Midlands and Mountain; RRD = Red River Delta; SE = South East.

2.5 Ethnic minorities still generate Figure 7. Average annual income by region and ethnicity
significantly less income per person from (VND, millions), 2018
agriculture despite being more dependent on it Kinh & Hoa 7 8.6
 3
than the Kinh-Hoa (Figure 7). Among crop Ethnic Minorities 4.8

farmers, ethnic minorities on average generate
 Mekong River Delta 9
VND 4.8 million per person annually, compared 8
 South East
to VND 8.6 million per person generated by the Central Highlands 4
Kinh-Hoa. In non-crop-cultivation farming Northern and Central Coastal 6

activities, ethnic minorities generate less than Northern Midland and Mountains 4

half the income generated by the Kinh-Hoa. A Red River Delta 6
 Non-crop agriculture
similar variation is observed at the regional Crop cultivation
 0 5 10 15 20
 Income per capita (VND 'Millions)
level, with crop farmers in the Northern Source: Based on VHLSS 2018.
 Note: For each income source, the comparison is restricted to
Midlands and Mountain region generating far households reporting such type of income.
less income per person than farmers in the
Mekong River Delta, South East, and Central Highlands regions.

2.6 These findings suggest that differences in agriculture productivity also contribute to the
income disparity between regions and ethnic groups. In addition to reducing income disparity, closing
gaps in agriculture is even more important for the poverty reduction agenda, given the greater
dependence of poor households and ethnic minorities on agriculture than other households. As recent
evidence suggests, agriculture can still make a valuable contribution to poverty reduction. For example,
a quarter of the reduction in poverty was due to declining poverty among purely agricultural
households, while agriculture’s contribution to poverty reduction was found to be particularly
pronounced among ethnic minorities (World Bank, 2020). Moreover, the labor market is increasingly

 21
You can also read