Marginal Oil What is driving oil companies dirtier and deeper? - Heinrich-Böll-Stiftung
←
→
Page content transcription
If your browser does not render page correctly, please read the page content below
Marginal Oil What is driving oil companies dirtier and deeper?

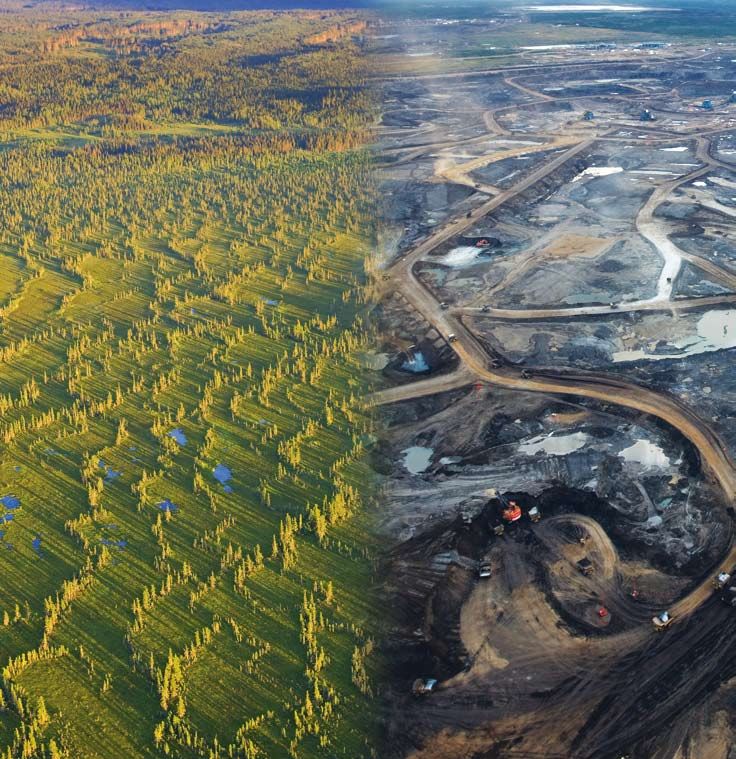
Aerial view of the oil on the sea surface, originating from the leaking of the Deepwater Horizon wellhead disaster, slowly approaching the
coast of Louisiana East of the mouth of the Mississippi river. The BP leased oil platform exploded April 20, 2010 and sank after burning,
leaking an estimate of more than 200,000 gallons of crude oil per day from the broken pipeline into the sea. © Daniel Beltrá / Greenpeace

Front cover:
Left: Fen and the Boreal Forest near McClelland Lake , north of Fort McMurray, Alberta, Canada. This area has been leased for future oil
sands development. Right: Syncrude Aurora Oil Sands Mine, north of Fort McMurray, Canada. © Peter Essick 2009. All rights reserved

Preface

Boreal forest of spruce, poplar and aspen, east of Peace River in northern Alberta, Canada. © Jiri Rezac / Greenpeace

With conventional oil production in decline, the global oil               In November 2010 we therefore jointly organised a
industry is investing heavily in dirtier and riskier forms of         networking and strategy meeting for civil society activists from
unconventional oil such as heavy crude, tar sands, and oil            North America, Europe, Africa, and Latin America. The aim
shale. These investments pose a challenge to the climate, the         was to share information and experiences and better coordinate
environment, and local communities. One new frontier for tar          global efforts to fight marginal oil investments and promote a
sands development is sub-Sahara Africa, a region that is highly       clean and sustainable energy future globally.
dependent on the export of raw materials, but at the same time
is highly vulnerable to the impacts of climate change and the             To this end we will also work with decision makers both in the
subsequent suffering due to the effects of extractive industries’     European Union and globally to ensure that the right policies are
projects. Other affected regions include the Orinoco Belt in          in place and that the voices of the communities are respected.
Venezuela and the Western Amazon in Brazil – biodiversity hot
spots and home to a number of indigenous peoples.                          This paper was prepared as a background document for
                                                                      the strategy meeting. It describes the drivers behind marginal
     Apart from making a mockery of climate protection, experience    oil investments and gives an overview of existing and potential
shows that tar sands production in Canada – currently the biggest     projects across the globe. Since it contains important analysis
producer of tar sands globally – has resulted in serious damage       that we believe should be public knowledge, we have decided
to local communities and the environment, including destruction       to publish it and hope it will productively feed into the ongoing
of the boreal forest and increased pollution, which has impacted      debate, from Cancun to Durban to Rio and beyond.
the health and livelihoods of indigenous peoples. In countries with
weaker political and environmental governance frameworks – such           We would like to thank the two authors of this study, Sarah
as Congo Brazzaville, Nigeria, and Madagascar – the consequences      Wykes and Lorne Stockman, for their excellent work and unfailing
of its expansion are likely to be even more devastating.              commitment, but we also want to thank all participants of the
                                                                      strategy meeting for their important input and feedback. A special
    Having worked with partners around the world on climate,          thanks goes to Alex Quero for making this exciting but rather dry
energy, and resource issues for years, the Heinrich Böll              topic look nice.
Foundation and Friends of the Earth Europe are very concerned
about the increasing investments into “marginal oil”. We see it       Lili Fuhr, Heinrich Böll Foundation
as one major wrong “solution” to the energy crisis the world is
facing and we are concerned about the challenges and risks it         Darek Urbaniak, Friends of the Earth Europe
poses for local communities as well as the climate.

                                                                             Marginal Oil - What is driving oil companies dirtier and deeper?   1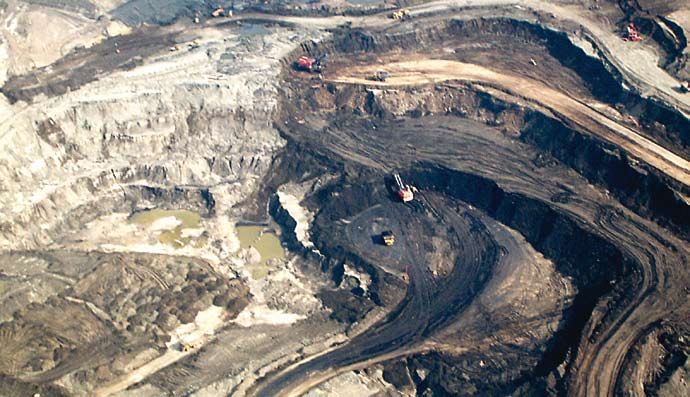
Table of Contents

    Preface                                                                                                                              1
    Executive Summary                                                                                                                    4
    Introduction                                                                                                                         5

1 Driving over the cliff: What’s behind the increasing exploitation of marginal oil?                                                     8
    1.1   International oil companies: The problem of diminishing “easy oil”                                                             9
    1.2   Decreasing access for IOCs                                                                                                     9
    1.3   Continuing resource nationalism: An increasingly harder bargain for IOCs                                                       9
    1.4   Friendly, stable fields in decline                                                                                           10
    1.5   The challenge from “international” NOCs and service companies                                                                10
    1.6   Investor pressure: Is the tail wagging the dog?                                                                              11
    1.7   Growing in the margins                                                                                                       13
    1.8   Increasingly marginal reserves                                                                                               15
    1.9   Energy security – Does marginal oil really bring security?                                                                   18
    1.10 Supply and demand: Hard truths or convenient assumptions?                                                                     19
    1.11 China leading demand growth                                                                                                   20
    1.12 Tight supply and demand triggers policy shifts                                                                                20
    1.13 Declining demand will hit marginal oil first                                                                                  20
    1.14 “Business as usual” or “business as urgently required”?                                                                       20
    1.15 Getting behind demand reduction: The key to killing marginal oil?                                                             22

2 Key marginal oil developments: A brief survey                                                                                        23
    2.1   Bitumen and extra-heavy oil                                                                                                  24
    2.2 Venezuela’s Orinoco: the next big unconventional oil rush                                                                      25
    2.3 Tar sands in Africa                                                                                                            31
    2.4   Marginal oil in sub-Saharan Africa: Onshore and offshore “frontier” oil                                                      32
    2.5 Deepwater investments                                                                                                          33

3 Conclusion: Protecting the global climate, local communities and ecologies                                                           37

    Endnotes                                                                                                                           38
    Acknowledgements                                                                                                                   46
    List of Abbreviations                                                                                                              46

                     This Report has been also produced with the financial assistance of the European Union as a part of “Making
                     Extractive Industries work for Climate and Development” project. The content of this Report is the sole responsibility
                     of Friends of the Earth Europe, Friends of the Earth France, CEE Bankwatch, Milieudefensie, and can under no
                     circumstances be regarded as reflecting the position of the European Union.

2   Marginal Oil - What is driving oil companies dirtier and deeper?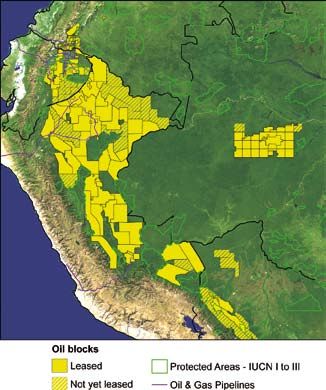
List of Figures
 1 Continuum from conventional to unconventional oil resources                                                                       7
 2 Oil production by source                                                                                                          8
 3 IOCs and NOCs access to reserves and share production                                                                             9
 4 Reserves Replacement Ratio of top 25 IOCs 1995-2006                                                                              11
 5 Estimated tar sands reserves additions as percentage of reserves additions 2005–09                                               12
 6 Reserves Replacement Ration for the period 2005–2009                                                                             12
 7 A chart of Shell’s deepwater engineering milestones showing the different types of
		 rig designs developed for deepwater                                                                                              13
 8 Production costs by resource                                                                                                     14
 9 BP proved and non-proved reserves 2009                                                                                           15
10 Shell total resources 2008                                                                                                       15
11 Chevron total resources 2010                                                                                                     15
12 ExxonMobil resource base 2010                                                                                                    16
13 Total proved and probable reserves growth 2004–2009                                                                              16
14 ConocoPhillips total resources by region 2009                                                                                    16
15 ConocoPhillips 2010–2014 reserve additions                                                                                       16
16 Unconventional oil production by type of resource                                                                                23
17 Global unconventional oil resources                                                                                              24
18 Tar sands and extra-heavy oil resources                                                                                          24
19 Orinoco Oil Belt Project                                                                                                         25
20 Characteristics and results of air quality studies conducted by PDVSA                                                            29
21 Venezuelan Orinoco Belt extra-heavy oil projects                                                                                 30
22 Emissions for diesel by source                                                                                                   31
23 Global oil shale deposits                                                                                                        32
24 Oil and gas wells drilled by leading companies in water depths of 400 meters or more –
		 number of wells in parentheses                                                                                                   34
25 The Brazilian pre-salt deposit                                                                                                   35
26 Frontier developments in the Amazon – the Western Amazon region                                                                  36
27 Oil blocks in the Western Amazon region                                                                                          36

List of Boxes
 1 Definitions                                                                                                                       6
 2 Reserves terminology                                                                                                             12
 3 The high costs of marginal oil                                                                                                   13
 4 The “resource curse”: Is “rent seeking” another driver of marginal oil development?                                              17

                                                                 Marginal Oil - What is driving oil companies dirtier and deeper?    3
Executive Summary
This paper was written for a workshop on the expansion of                       The IOCs response has been to develop technologies to access
investment in tar sands, in their current centre of production in           “difficult oil.” The past decade has seen increasing involvement of
Canada and beyond, and particularly the prospect of investments             IOCs in offshore production at ever-greater depths, Canadian tar
in developing countries. Tar sands development in Canada has had            sands production, the development of gas-to-liquids (GTL), and
serious negative impacts on local communities and ecosystems.               technologies to produce oil shale. Analysis of the top six IOCs’
Current and new developments pose a significant threat to global            reserves profile reveals that they all increasingly rely on such
climate protection efforts, given the highly carbon-intensive               marginal resources.
nature of the production process and the fact that protecting
Alberta’s tar sands industry is feeding the Canadian government’s               However, the push into the margin means spiralling costs for
opposition to national and international mitigation efforts.                the IOCs as, almost without exception, these resources are more
                                                                            expensive to develop and produce than conventional oil and thus
     However, tar sands development is both a symptom and                   rely on a high oil price to be profitable. Marginal oil is a symptom
manifestation of a broader underlying trend: a drive to exploit             of high prices and excessive demand rather than a means of
unconventional oil resources that are more difficult and costly to          combating either.
produce – and usually more carbon-intensive – than conventional
oil. Oil companies are increasingly bent on accessing the world’s                This is why the arguments deployed by the oil industry and
remaining conventional oil resources found in “frontier”                    its supporters that increasing development of marginal resources
locations, where their development often involves a high risk               is the key to improving the energy security of major importing
of irreversible damage to local ecologies and communities.                  states such as the United States are fundamentally flawed.
Current exploration projects include bitumen-type resources in              Development of expensive-to-produce and limited supplies
Venezuela and in Africa, deep offshore oil in Africa and Brazil,            of non-OPEC marginal oil will not reduce OPEC’s hold on the
and heavy oil in the remote Western Amazon.                                 market. Unlike marginal resources, OPEC oil is relatively cheap
                                                                            and easy to bring onstream, and its market share will grow even
     Both these trends represent an ongoing drive towards what can          if marginal oil is developed.
be called “marginal oil” with potentially devastating implications:
for global and local efforts to curtail carbon emissions by transitioning       For the same reasons, more marginal oil will not mean less
away from a fossil fuel-based energy model; for the energy security         money for unsavoury regimes, so long as overall demand increases.
of importing countries; and ultimately for sustainable growth in            The supply and demand balance that supports marginal oil is also
developed, emerging, and developing countries.                              a boon for OPEC producers, because it supports high oil prices.
                                                                            Finally, marginal oil production will not protect oil importers from
    The paper begins by exploring the “macro” forces driving the            a supply crisis because of the global nature of the oil market. No
search for marginal oil. Fundamentally, oil exploration is driven           marginal oil sources (such as Canadian tar sands) have significant
by the economics of global supply and demand. Global oil demand             spare capacity to address a supply crisis.
is on an upward path, mainly due to increasing demand from
emerging economies such as China, according to the International                The only sure answer to improving energy security is cutting
Energy Agency (IEA). However, concerns about China’s rapid                  oil demand. Otherwise, the “business as usual” energy scenario
demand growth may be overblown and need to be balanced with                 will see marginal oil development inevitably expand beyond its
an awareness of the country’s efforts to curtail domestic demand            current centre in North America, with companies pushing to open
in the longer term.                                                         up ever more risky and challenging resources with potentially
                                                                            devastating consequences for the climate, as well as local
     However, while concerns about peaking oil supply are a factor,         ecosystems and communities in producer countries.
it is in fact lack of access by international oil companies (IOCs)
to the remaining “easy-to-produce” oil that is driving them in                   Arguably, the United States is still the pivotal market in terms
search of the “marginal barrel.” In the 1960s, IOCs had access              of its impact on global oil demand. Roll-out of existing technologies
to around 85 percent of global oil reserves: today that has shrunk          combined with robust government interventions across the board
to only 6 percent.1 OPEC controls the vast majority of the world’s          could potentially cut US oil consumption by 40 to 50 percent by
remaining “easy” oil, which means the majority of future non-               2030, setting it on a downward trajectory thereafter and more
OPEC production growth will be in unconventional oil. 2                     than counteracting growth in demand from China.

    The IOCs’ decreasing access is mainly due to geopolitical                   However, even if successful, reducing demand for oil in the
factors such as the continued rise of resource nationalism in               medium term must be combined with a coherent supply-side
key producer countries, as well as rising oil prices. In addition,          approach. Governments cannot cut demand while also putting
what little remaining access IOCs enjoy comes with much less                into place policies aimed at maximizing supply of oil and other
favorable terms attached. They also face increasing competition             fossil fuels, undercutting the political and economic case for clean
from national oil companies (NOCs) that are becoming more                   energy. In addition, reducing oil demand alone will not resolve
technically competent or business savvy and are cash rich.                  the fundamental environmental and social justice issues facing
This insecurity of access has been further exacerbated by the               local communities at the frontline of oil development.
accelerating depletion of oil fields located in politically stable
and “friendly” territories.                                                     For climate protection and for environmental and social justice
                                                                            reasons, further oil investments must be monitored and challenged
    IOCs also face pressure from investors to keep adding new oil           to prevent the ongoing environmental and social damage they entail
reserves to replace existing production. In some cases, the deals           and also to prevent states and other actors from getting “locked
now available to IOCs fail to deliver new reserves, as ownership of         in” to a resource extraction model that makes the transition to a
the reserves tends to remain with the producer state or NOC.                truly sustainable development path more remote.

4    Marginal Oil - What is driving oil companies dirtier and deeper?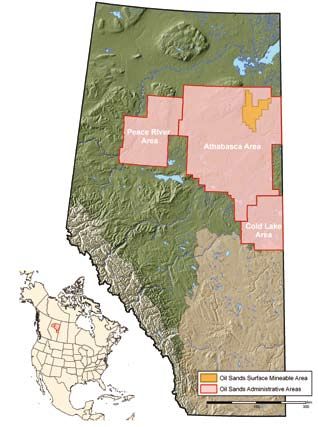
Introduction

The Syncrude tar sands mine, Alberta, Canada. The mining operations strip away boreal forest and mine up to 100 metres into the earth.
© Chris Evans / The Pembina Institute

This paper was designed as input for a workshop convened by           investment in tar sands is therefore dependent on a “business
the Heinrich Böll Foundation and Friends of the Earth Europe          as usual” energy scenario where fossil fuels, especially oil,
in Berlin from November 15–16, 2010.3 Participants comprised          remain the primary source of power and transport fuel, and
activists and researchers working mainly on tar sands                 where demand for oil – and the oil price – remains high.
development in Canada and energy issues at the European level.
Several Southern activists whose countries could soon face new            This paper has now been revised for publication in the
tar sands or extra-heavy oil investment also participated in the      hope that it will be of interest to a wider audience interested in
discussion (for a definition of terms such as tar sands and other     the energy dimensions of the climate crisis and in the social,
terms, as used in this paper, see Box 1).                             environmental, and developmental impacts of continued
                                                                      investment in fossil fuel extraction.
   Both the decision to hold the workshop and the paper’s
production were initially triggered by specific concerns                  However, it inevitably still bears the limitations of its
among activists and researchers over the threat of expansion          original conception. One is that it was primarily conceived
of tar sands within and beyond their current centre of                as a tool to assist advocacy groups in their strategic
production in Canada – particularly into developing countries         planning and coordination. As such, it does not offer a
such as Madagascar and the Republic of Congo (RoC) – and              comprehensive overview or discussion either of current/
over potential imports of tar sands-derived fuel into the EU.         potential developments in the oil sector or of advocacy
Concerns centred on the impacts of such developments on               and campaigns research in the field, but rather presents a
the livelihoods and health of local communities and local             particular argument with supporting evidence aimed at a
ecosystems – impacts already being felt by First Nations              specialist audience.
communities and on the Athabasca River and the Canadian
boreal forest in the case of Canadian tar sands.                          Furthermore, it also assumes a working knowledge
                                                                      of the climate, energy security, and local environmental
     In addition to their potentially disastrous local social and     and social impacts associated with tar sands development
environmental impacts, ongoing tar sands development has              in Canada. Research and advocacy groups, including
serious implications for the global climate crisis – and for long-    the Pembina Institute, the National Resources Defence
term energy security of oil-importing countries, including            Council, Greenpeace, Friends of the Earth, and Platform,
the United States and the EU. Such resources are highly               have discussed such issues in detail in previous briefings,
carbon-intensive to produce, involving emissions per barrel           and any reader wishing to find out more about tar sands
that are three to five times higher than with conventional            development in Canada and its critiques should consult this
oil. Such developments also incur high costs and continuing           rich vein of material.

                                                                             Marginal Oil - What is driving oil companies dirtier and deeper?   5
Box 1      Definitions

    Tar sands (or oil sands as they are called in the oil
    industry) are deposits of sand and clay saturated with
    bitumen. The tar sands in Alberta, Northern Canada, are
    the second largest oil deposits in the world and extend
    over an area the size of England that includes 4.3 million
    hectares of boreal forest. They are now producing over a
    million barrels of oil per day and the number one export
    destination is the United States.

        Bitumen is oil in a solid or semi-solid state that
    requires unconventional extraction methods (either
    mining or, in the case of the deeper deposits, steam
    injection to get it to flow to the surface) and then
    processing or “upgrading” to convert it into synthetic
    crude. Large amounts of fossil fuels are burned and
    large amounts of water used in these processes. NGOs,
    scientists, and local residents have expressed serious
    concerns about the irreparable environmental and
    social damage tar sands projects have caused, including
    serious health impacts from contamination of the
    Athabasca watershed.

       In addition, production of a barrel of Canadian tar
    sands emits on average between three to five times more
    carbon than production of a barrel of conventional oil.
    The clearance of enormous areas of boreal forests is also
    having a huge impact on the sequestration of carbon
    emissions from greenhouse gases.
                                                                        Location of Alberta’s bituminous sands.
    Unconventional oil                                                  Source: Global Forest Watch Canada

    According to the International Energ y Agency (IEA):
    “There is no universally agreed definition of
    unconventional oil, as opposed to conventional oil.
    Roughly speaking, any source of oil is described as                 produce resources requiring processing that usually
    unconventional if it requires production technologies               involves higher levels of carbon emissions.
    significantly different from those used in the mainstream
    reservoirs exploited today.”4 The IEA’s definition of               High carbon oil
    unconventional oil includes extra-heavy oil (with that
    from Canada and from Venezuela’s Orinoco Belt seen                  When discussing unconventional oil, we have
    as the resources currently viable), natural bitumen (oil            substituted the term “high carbon” oil – as shorthand for
    sands) from Canada, chemical additives, gas-to-liquids,             “high carbon-intensity oil” (i.e., oil that involves carbon-
    coal-to-liquids, and oil shales.5                                   intensive production processes). This is on the grounds
                                                                        that this term best sums up the key problem with the
        The US Energy Information Administration (EIA)                  drive to develop these more difficult-to-access resources:
    notes that: “What has qualified as ‘unconventional’ at              They represent a “recarbonization” or intensification of
    any particular time is a complex interactive function               the carbon content of our energy supplies at a time when
    of resource characteristics, the available exploration              we need to be moving in the opposite direction to protect
    and production technologies, the current economic                   the climate.
    environment, and the scale, frequency, and duration
    of production from the resource. Perceptions of these               Frontier oil
    factors inevitably change over time and they often
    differ among users of the term.”6 In the 1960s and 70s,             Frontier oil means exploring for resources in new
    “unconventional” referred to the deepwater resources                geological areas where costs and risks (technical and
    being accessed by, at the time, new technology.                     financial, although it can also mean political) are high.
                                                                        For instance, a recent report named the following as
       Thus, the definition of “unconventional” is mutable:             being the next “new oil frontiers”: West Africa (Sierra
    Other bodies may classify resources as unconventional               Leone, Liberia, Sao Tomé and Principe), ultra-deepwater
    according to the density or gravity of the hydrocarbon              in the Gulf of Mexico, Western Sahara, the Falkland
    resource or the location of the reservoir – excluding               Islands, Uganda, the Bahamas, and the Arctic.7 The
    the technology used to access it. In this paper,                    term “frontier oil” is usually used to cover exploration
    “unconventional” is an umbrella term referring to                   for conventional rather than unconventional resources,
    lower-grade and more technically difficult to access and            whether onshore or offshore.

6    Marginal Oil - What is driving oil companies dirtier and deeper?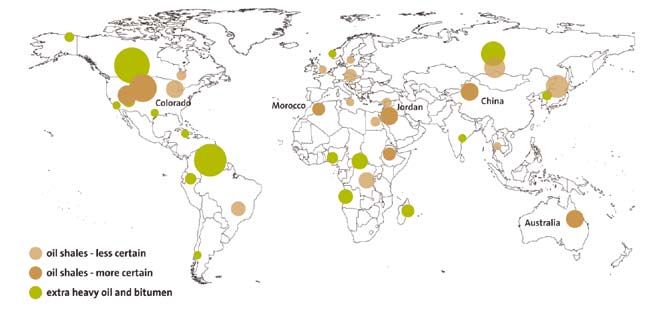
Figure 1: Continuum from conventional to unconventional oil resources

Note: The size of the bubbles indicates recoverable resources. Reservoirs with similar properties in each geographical area have been grouped;
the smallest bubbles each represent approximately 1 billion barrels of recoverable resources.
Source: World Energy Outlook 20108

    Overall, the argument of this paper is that tar sands                     Section One explores the key underlying causes – or “macro”
development in Canada is both a symptom and manifestation                     forces – that are driving this push by oil companies to develop
of a broader, underlying trend: increasing investment by oil                  resources “at the margins” of the industry’s current technical
companies in what is termed unconventional oil. The latter                    or financial capabilities. It argues that, fundamentally,
term is applied, simply put, to oil resources that are (currently)            this trend assumes a “business as usual” scenario of ever-
more technically difficult and costly for companies – and                     increasing oil demand and high oil prices. Such a scenario will
usually more carbon-intensive – to access and exploit than                    take us inexorably toward a potentially unmanageable rise in
conventional crude oil (see Box 1 for further information).                   global temperature,9 as well as exacerbate energy insecurity
                                                                              in importing countries.
    Such resources are also often (but not always) located in
remote areas of high biodiversity or ecological sensitivity and/              Section Two surveys some key current and potential marginal
or have potentially serious effects on local communities and                  oil investments outside Canada, using specific criteria raised
their livelihoods. This is the case with tar sands in Madagascar              by the issues outlined in this paper. These include: the
or the RoC.                                                                   likelihood of project development; its potential impacts on
                                                                              vulnerable communities and ecologies; the attitude of host
    In tandem, the race is on to exploit the world’s remaining                communities to the investment; the openness of political
conventional oil resources. While these may not be so carbon-                 space in the host country; and the involvement of European/
intensive to produce, they are located in “frontier” regions and              US-listed companies.
are more remote or technologically difficult to access and/or
more environmentally/socially high-risk than current fields.
Examples are the deep offshore fields extending from the Arctic
to Brazil and Africa, and the Western Amazon.

    For this reason, the authors have opted to use the term
“marginal oil” to refer to resources that are both at the margins
of profitability in financial terms (what is sometimes referred
to by the industry as the “marginal barrel”) but also high-risk
in terms of their potential impacts on local ecosystems and
communities as well as their implications for global climate
protection efforts.

                                                                                       Marginal Oil - What is driving oil companies dirtier and deeper?   7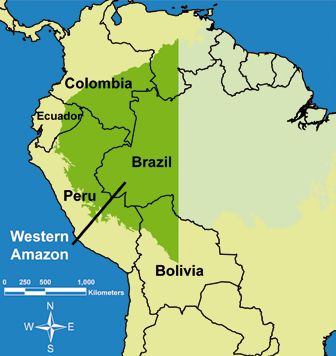
1 Driving over the cliff: What’s behind the increasing
      exploitation of marginal oil?
Figure 2: Oil production by source

       120                                                                                                      60%
                                                                                                                                 Unconventional oil

       100                                                                                                      50%
                                                                                                                                 Other OPEC

         80                                                                                                     40%
                                                                                                                                 Middle East OPEC

                                                                                                                30%
mb/d

         60
                                                                                                                                 Non-OPEC

         40                                                                                                     20%
                                                                                                                                 OPEC market share
                                                                                                                                 (right axis)
         20                                                                                                     10%

           0                                                                                                    0%
                        2000                     2008                     2015                2030

Note: Excludes processing gains. Conventional oil includes crude oil, natural gas liquids (NGLs), extra heavy oil from Venezuela and chemical additives.
Source: World Energy Outlook 200913

In 2011, the IEA forecast that of the 69 million barrels per day                 oil and that is certainly important. But it is mostly political
(Mbpd) of conventional oil in production in 2010, 47 Mbpd                        factors that restrict access to the remaining easy-to-produce
would not be available in 2035.10 In order to meet rising demand,                oil and therefore, the drive into the margins is primarily driven
in a policy environment that is little changed from today’s (what                by the major international oil companies. In some cases, such
the IEA calls the “Current Policies Scenario”) around 67 Mbpd                    as the pre-salt ultra-deepwater resources of Brazil or extra-
of new capacity will have to be brought on stream by 2035.11                     heavy oil in Venezuela, national oil companies are playing a
                                                                                 leading role, but it is IOCs that have generally developed the
    Much of this demand is likely to be met by OPEC, which                       technology to enable them to do so.
retains control of the vast majority of the world’s remaining
“easy-to-produce” oil (see Figure 2). The IEA suggests that                          The actions of both types of companies are driven by the
non-OPEC conventional oil production will peak around                            economics of global supply and demand, and by concerns
2010 and that the majority of future non-OPEC production                         about future energy security. However, given the ever-
growth will be in unconventional oil.12                                          increasing costs of exploiting these resources – financial,
                                                                                 social, and environmental – the question of limits arises. In
    In line with these trends, for the last 10 years the oil                     other words, is the status quo in terms of energy policy being
industry has been moving increasingly toward the production                      maintained to the point where the costs to society outweigh
of unconventional oil such as tar sands and pushing into                         the benefits? To what extent does this inertia undermine the
“frontier” zones, such as ultra-deepwater and the offshore                       transition to cleaner and more efficient energy systems?
Arctic. These oil resources share in common their tendency to
intensify the already high social and environmental impacts                          In addition, are oil company statements about the
of current oil production and their high financial costs. For                    dynamics of supply and demand accurate or are they self-
this reason, we have labelled them “marginal oil.”                               serving and designed to maintain the status quo? Arguably,
                                                                                 to date the public debate on energy security, particularly in
   What are the economic and political factors driving this                      the United States, has focused largely on supply-side issues
push into marginal oil? This section will not discuss the                        rather than demand-side solutions.
specific drivers of every marginal oil project but outline the
macro-forces that underpin the general trend.                                        This section will begin by looking at IOCs and the
                                                                                 difficulties they face accessing the world’s “easier” oil
   The main factor behind the push into marginal oil is                          resources, their struggle to replace reserves, and their
generally thought to be the depletion of “easier-to-produce”                     increasing reliance on marginal resources. It will also discuss

8      Marginal Oil - What is driving oil companies dirtier and deeper?
energy security, its misconceptions, and the inadequacy of Figure 3: IOCs and NOCs access to reserves
supply-side solutions. Finally, demand scenarios will be and share of production
considered, as well as the extent to which policies aimed Access to reserves:
at demand reduction can undermine the economics of
marginal oil. 78% Reserves held
by NOCs ‘Limited
Equity Access’
1.1 International oil companies: The problem of
diminishing “easy oil”
6% Reserves to which
In 2008, Shell’s (then) CEO, Jeroen van de Veer, announced that IOCs have ‘Full Access’
the era of “easy-to-find” oil was coming to an end.14 It would
perhaps have been more accurate to say that for IOCs such as
Shell the era of “easy-to-produce” oil is well and truly over.15 6% Reserves to which
IOCs have ‘Full Access’
There is certainly truth to the proposition that the easy
oil is running out. While there are 70,000 known oil fields in
the world, around 100 “giant” fields account for roughly half
of global production.16 Many of these fields are past their 10% Reserves held by
NOCs ‘Equity Access’
peak or expected to reach their peak in the near future.17 In
some places, such as Iraq, easy oil exists but political and
security concerns are likely to constrain production for the Share of production:
foreseeable future.18
22% Other Companies
Awareness of the accelerating depletion of conventional
18% Other IOCs
oil fields and scepticism about the industry’s ability to
bring sufficient new capacity on stream has triggered
concerns about “peak oil” – the idea that the world has 12% Saudi Aramco
either reached, or will soon reach, the limits of its capacity
to increase oil production. 5% NOC Iran
However, there is much debate about the peak oil 4% Pemex
proposition, primarily because the oil industry has consistently
learned to stretch oil resources further through technological 3% Exxon Mobil
breakthroughs that enable access to oil previously considered
inaccessible or uneconomic to produce. This technological 3% BP
development has primarily been driven by the IOCs because
for many years they have been excluded from, or given only
2% Shell
very limited access to, the easy-to-produce oil.
1.2 Decreasing access for IOCs 31% Other NOCs
Source: Arthur D. Little, January 201021
In the 1960s, IOCs had unlimited access to around 85 percent
of global oil reserves. Today that access has declined to
around 6 percent.19 The decrease in access primarily stems However, one of the first attempts at wholesale
from rising resource nationalism in oil-producing countries, nationalization in the Middle East ended so calamitously
which restricts and denies the IOCs access to the world’s for its proponents that it served as a cautionary tale for
most prolific resources. The exhaustion of oil fields, primarily other countries, explaining the slow pace of nationalization
located in the North Sea and the United States, which were in the decades that immediately followed.23 In 1951, the
mainstays for IOCs from the 1970s to 90s, has also diminished democratically elected Prime Minister of Iran, Mohammad
their reserves in recent years.20 Mossadegh, attempted to wrest control of the nation’s oil
resources from the Anglo Iranian Oil Company (later to
1.3 Continuing resource nationalism: An increasingly become BP). This resulted in two years of economic and
harder bargain for IOCs political turmoil in the country, as the oil industry ground
to a halt and Britain, with some assistance from the United
Resource nationalism – defined here as the tendency of oil- States, sponsored various opposition factions, eventually
exporting states to limit access to IOCs and to assert state leading to a coup in 1953.24 Mossadegh lived the rest of his
control over the development of oil resources – is nothing new.22 life under house arrest and Iran’s oil reverted to the hands of a
Up until the 1960s, much of the Middle East’s oil was still being consortium of foreign-owned companies.
produced by British, French, and American oil companies,
which had unlimited access through the power of the colonial While the 1960s saw some renegotiation of terms, as
governments they represented – a fact that may explain the Middle Eastern states struggled to capture more of the
enduring attraction of resource nationalism in the region. revenues issuing from oil production, it was only in the 1970s
Marginal Oil - What is driving oil companies dirtier and deeper? 9that these states finally wrested back full control of their oil war, as well as the growing backlash against globalization.
reserves from the IOCs.25 Low oil prices from the mid-1980s In many of these states, particularly in the Middle East, the
onwards, however, caused oil-producing states to seek ways presence of IOCs is especially unpopular at present, further
to increase revenues through increasing production. With buoying their underlying and enduring ideological support
more difficult-to-produce reservoirs a challenge for the for resource nationalism.
NOCs, some states in the region (excluding Saudi Arabia)
invited back the IOCs.26 Therefore, the oil boom of the first decade of the new
millennium did not leave the IOCs more secure in terms of
When the Soviet Union collapsed in 1989, a whole new access to the world’s reserves. This insecurity of access has
region of potential resources opened up for the IOCs. Newly been further exacerbated by the accelerating depletion of
independent states such as Kazakhstan and Azerbaijan oil fields located in politically stable and friendly territories
invited IOCs to help them access resources that the Soviet that, over the past three decades, have been the mainstay
state had failed to exploit. Russia signed deals that were, in for the oil companies. These areas are primarily the North
some cases, so favourable to the IOCs that they became “part Sea, including Norway, the United States and conventional
of corporate lore […] analysed in business school textbooks resources in Canada.
for years to come.”27 Although many of these projects were
more difficult to develop than the Middle Eastern oil that was 1.4 Friendly, stable fields in decline
lost to resource nationalism in the 1970s, the IOCs enjoyed a
resurgence and many grew exponentially in this period, on While the IOCs were losing access to resources in the
the back of a wave of mergers and acquisitions. Middle East in the 1960s, their losses were to some extent
compensated by the emergence of offshore oil in politically
But the resurgence did not last long. In the early and mid- stable and friendly countries. The North Sea, in the heart
2000s, Russia, Kazakhstan, Venezuela, Ecuador, and Bolivia of northern Europe, became the most significant new oil
either took back into state control entire fields from the IOCs, province for the IOCs from the early 1970s onwards. North
or renegotiated agreements that favoured the state.28 A new Sea oil boomed during the 1970s and 80s but production
wave of resource nationalism was clearly underway. peaked between 1999 and 2001. It now has one of the fastest
rates of decline in the world.34 While exploration continues
Rising oil prices in this period are thought to have been and some progress has been made on extending the life
a major driver behind these compulsory renegotiations. of North Sea oil fields, there is only hope of slowing, not
When prices are low, available capital is reduced and states reversing, the decline. The North Sea oil boom is well and
are in a weaker position, as competition for resources truly over.
among oil companies is limited. States tend to agree to
easier terms to encourage inward investment. As prices In the most mature oil province in the world, the onshore
rise, states begin to covet the revenues being generated “lower 48 USA”,35 oil production has been in decline since the
and seek to rake back a larger proportion of the wealth they 1970s. In the 1970s and 80s, onshore production in Prudhoe
consider rightfully theirs.29 Bay, Alaska, was a major source of growth for IOCs. However,
this area now has the steepest decline of all major production
The rising oil prices in the 2000s also helped fuel civil zones in the United States.36 In Canada, where tar sands
unrest and conflict in poorly governed oil-exporting states production now dominates oil production, conventional oil
in Africa. Conflicts in Nigeria, Chad, and Sudan disrupted has been in decline for a number of years.37
oil production and jeopardized new projects, undermining
the hopes of some IOCs that Africa could become a major Oil resources in other countries considered friendly and
new source of production.30 These conflicts, while not stable for IOCs, such as Japan, South Korea, Australia, and
completely closing these countries to IOC access (except New Zealand, are also limited. These countries have never
for Sudan), have severely hampered the prospects for really provided the major growth potential that the IOCs seek
production growth. and their limited resources are already in decline.38
A more recent example is the way Exxon was forced to Thus, there is little prospect for the IOCs to maintain
retreat from buying a $4 billion stake in Ghana’s huge new current levels of conventional or easy oil production. This
offshore Jubilee field. As one source put it: “The oil giant was is due to declining production in regions where access is
compelled to cancel the deal due to extreme pressure from relatively straightforward or because access is severely limited
Ghana government and strong resistance from the state oil or too risky in regions where easy and abundant reserves
company, Ghana National Petroleum Corporation (GNPC).”31 of conventional oil still exist. The IOCs have therefore been
Reportedly, GNPC wanted the final say on which companies grappling with access and depletion issues for some time.
form the joint venture operating what is a key economic This explains why their response has primarily been the
element for the country. This included the option of the state development of technology to access increasingly difficult
company bidding itself for a stake, financed with Chinese and marginal sources of oil.
money, and potentially bringing in Chinese company CNOOC
plus another oil major to the deal.32 1.5 The challenge from “international” NOCs and
service companies
The resurgence of resource nationalism in the 2000s is
thought by some commentators to be a particularly potent Another factor increasing pressure on the IOCs to move into
and durable phenomenon.33 Not only because oil prices are marginal resources is the emerging strength of national oil
expected to remain high for some time, but also because of companies in the international arena. NOCs are forging
other factors supporting the view that resource nationalism partnerships with each other, such as that between the Chinese
in the oil-producing states will endure. The emerging role of state company China National Petroleum Corporation (CNPC)
NOCs as partners in overseas oil production is one factor (see and Venezuela’s Petróleos de Venezuela, S.A. (PDVSA), and
Figure 3). Another is the huge political fallout from the Iraq also increasingly with private oilfield service companies.39
10 Marginal Oil - What is driving oil companies dirtier and deeper?Where once NOCs looked to the major IOCs for technical While RRR is just one of many metrics used by analysts,
assistance as well as capital investment, they may now look to it is one that demands strong performance in an area other
independent service contractors for technical help and finance than simple profit generation or return on investment:
the project from their own vast reserves of capital.40 Recent constant reacquisition of a fast-disappearing commodity.
evidence of this is Petrobras’ successful share issue of $70 While investors are not forcing companies to acquire risky
billion in September 2010, the biggest in corporate history.41 reserves in order to maintain RRR levels, there is a mutual
expectation that the status quo in terms of reserves must
Some expert analysts see this trend as putting “the current be maintained.
business model of the international oil companies (IOCs)
in question, possibly as dramatically as did the shift that Poor RRR was a feature of the top IOCs’ performance in
occurred in the late 1960s and early 1970s.”42 Not only are the late 1990s and early 2000s (see Figure 4 below). Companies
IOCs losing deals to NOCs, the nature of the deals that remain were accused of focusing on generating short-term profits at
on offer is also changing. Rather than gaining an equity share the expense of reserves replacement.46 The issue caught the
in an oil field through production sharing agreements, IOCs attention of the wider world when the Shell reserves scandal
increasingly have to accept new arrangements such as partial broke in early 2004.47
equity sharing and fees-for-services arrangements.43
Following the revelation that Shell had been booking
There are certainly profits to be made from these new some of its probable reserves as proven reserves for years,
arrangements, but they fail to deliver a key factor of oil the company had to downgrade 4.47 billion barrels of oil
company value: reserves replacement. Many of these equivalent, around 20 percent of the proven reserves on
arrangements involve ownership of the reserves in question its books. Shell’s share price plunged, heads rolled, and the
remaining with the state or NOC. This is particularly company has spent the last six years struggling to regain its
problematic when investors look to oil companies to maintain reputation and improve its reserves levels. Shell’s subsequent
reserves replacement ratios above 100 percent despite the acquisitions of tar sands resources have resulted in 30 percent
increasing difficulty of doing so. of its total resources now consisting of Canadian tar sands.48
1.6 Investor pressure: Is the tail wagging the dog?
Figure 4: Reserves Replacement Ratio
IOCs are publicly traded companies, that is, owned by of top 25 IOCs 1995-2006
shareholders who trade shares on stock exchanges around
300
the world – in the case of the big five IOCs, their shares
trade in London and/or New York (or Paris and New York for
250
Total). Institutional investors – pension funds, investment
companies, mutual funds, and insurance companies – hold the
200
bulk of shares.44 These investors employ analysts to assess the
value of individual companies and make recommendations
150
as to whether to buy or sell shares in a particular company.
Often analysts specialize in a sector such as oil and gas or
100
pharmaceuticals and so on.
50
Four times a year, the IOCs publish and present financial
results to investors and analysts. They also report annually 0
via their General Meetings and produce a Strategy Update
95
96
97
98
99
00
01
02
03
04
05
06
19
19
19
19
19
20
20
20
20
20
20
20
– the latter in particular is focused on communicating with
the specialist sector analysts. Overall, there is tremendous
100% Replacement Big 5 Next 20
pressure on the companies to show that they are performing
well and making the right strategic decisions to maintain Source: Jaffe and Soligo, 2007
strong performance into the future.
The analysts examine a number of key value indicators to Figure 4 shows how for the biggest IOCs, their RRR was
assess the performance of companies. For oil companies an disappointing for much of the decade between the mid-
important indicator is reserves replacement ratio (RRR). RRR 1990s and mid-2000s (in this analysis, the “Big 5” are BP, Shell,
measures the amount of proved reserves added to a company’s ExxonMobil, ChevronTexaco, and ConocoPhillips). However,
reserve base during the year relative to the amount of oil and toward the end of this period, it starts to improve.
gas produced.45
A recent analysis49 of the top IOCs reserves additions
Investors want to see a ratio above 100 percent. This shows that many of these companies have maintained higher
means, if a company extracts a billion barrels of oil in a year, RRR rates since 2005 by increasingly relying on tar sands to
the investors want to know it has gained access to another replace the production of fast-disappearing conventional
billion barrels for production at a later date. If RRR persistently oil. Four of the top six IOCs could not have achieved 100
comes in at less than 100 percent, then the company is percent RRR without the addition of tar sands reserves (see
essentially running out of oil and gas reserves. Figures 5 and 6).
Marginal Oil - What is driving oil companies dirtier and deeper? 11Figure 5: Estimated tar sands reserves additions as a percentage of reserves additions 2005-09 50
As percentage of total As percentage of total liquids
Company
reserves additions reserves additions
ConocoPhillips51 39% 71%
ExxonMobil 52 20% 51%
Shell 53 16% 34%
Total 54 10% 26%
Chevron55 3% 7%
BP 0% 0%
Average (excl. BP) 56
19.8% 42.6%
Source: Oil Change International, Greenpeace UK and Platform, 2011 57
Figure 6: Reserves Replacement Ratio (RRR) for the period 2005-09 58
Company RRR RRR excluding tar sands 59
ConocoPhillips 145% 88%
ExxonMobil 114% 89%
Shell 60 127% 106%
Total 85% 76%
Chevron 101% 98%
BP 100% n/a
Average 61 112% 92%
Source: Oil Change International, Greenpeace UK and Platform, 201162
Box 2 Reserves terminology
Oil and gas companies are required by financial The new rules also allow companies to report
regulators to report their reserves according to defined unconventional sources of oil such as bitumen and coal
standards. Reserves estimation is not a precise science that is intended for coal-to-liquids production as oil
and therefore reserves are divided into categories such reserves, whereas in the past such resources had to be
as: proven, probable, and possible, among others. There recorded as mining reserves.
is also a wider estimation used called total resources
(TR). Standards for making estimations have been Proven reserves are defined as follows: an estimated
developed by the Society of Petroleum Engineers. quantity of oil and gas that geological and engineering
data demonstrate with reasonable certainty to be
For the biggest IOCs, whose shares are listed on the recoverable in future years from known reservoirs under
New York Stock Exchange, the reporting of reserves existing economic and operating conditions.63
follows the rules of the Securities and Exchange
Commission (SEC). Up until January 2010, the SEC only Total resources generally refers to all the oil and gas a
allowed companies to report proven reserves. New rules company expects to extract in the future. It is a category
now allow, but do not require, companies to report not recognised by the SEC. However, the occasional
probable reserves. Shell’s reserves scandal in 2004 was disclosure of TR has shed light on the level of future
primarily about its reporting of reserves as proven, dependence on marginal oil for many companies. For
which under SEC rules should have been technically example, tar sands resources made up around 8 percent
defined as probable, and therefore not reported at all to of Shell’s proven reserves in 200864 but some 30 percent
the SEC as reserves. of its TR.65
12 Marginal Oil - What is driving oil companies dirtier and deeper?Figure 7: A chart of Shell’s deepwater engineering milestones showing
the different types of rig designs developed for deepwater 67
p
ss ka
ge
l
re Ka
el
an
kle
o
ow
a
ss
ss
L
og t
03 ik
88 in
pr usu
78 ac
97 -P
re
re
97 sa
pr id
pr 0
07 en
05 a
93 r
20 a K
19 ullw
19 uge
20 ong
96 s
in C-1
19 ogn
in erd
19 rsa
19 am
og
og
19 en
19 ar
in um
20 rm
99
N
M
M
U
P
B
A
B
B
R
C
O
G
600 m
800 m
1 000 m
1 200 m
1 400 m
1 600 m
1 800 m
2 000 m
2 200 m
2 400 m
Source: Royal Dutch Shell, 2008
1.7 Growing in the margins
The IOCs’ development of technology to access “difficult oil” 5,000 ft (1,524 m) is officially known as “ultra-deepwater”
can probably be traced back to the North Sea offshore oil and is now the new frontier for the offshore oil industry, as
boom of the 1970s and 80s. The North Sea presented drillers shallower resources become scarcer.69 The first oil discovered
with frequently harsh weather conditions, with high winds in ultra-deepwater was in the Gulf of Mexico in 1986.70
and waves a regular feature of the offshore environment. It However, regular production has only occurred over the last
was here and in the Gulf of Mexico that the IOCs developed decade and current ultra-deepwater production stands at
the engineering skills and technology to find and produce oil around 200,000 bpd.
in treacherous and increasingly deep waters.66 The political
and contractual stability that companies enjoyed in these While pushing back frontiers in offshore drilling has
regions was essential to balancing the financial risks of become one of the key engineering and technology pursuits
developing cutting-edge technology to access and produce of the IOCs, it is not the only one. The past decade has
the resources. seen increasing involvement of IOCs in the offshore Arctic,
Canadian tar sands production, the development of gas-to-
By the early 1990s, drilling in waters over 1,000 ft (305 liquids, and research and development of technologies to
m) deep, generally considered deepwater, had become produce oil shale. For example, in 2007, research on oil shale
commonplace.68 Drilling for oil and gas in waters deeper than extraction was the largest component of Shell’s R&D budget.71
Box 3 The high costs of marginal oil
The development of high carbon oil resources and the then requires upgrading before it can enter a refinery to
push into the margin is more a symptom of high oil prices be processed into products (or if diluted with lighter
than a solution to them. Almost without exception, these products, it can be refined in complex refineries). Mining
resources are more expensive to develop and produce projects also have to deal with large land reclamation
than conventional oil. and water treatment costs.
Canadian tar sands: exploration costs are low as the Shell’s Jackpine 1 tar sands mining project, which
resource is shallow and onshore. The problem with this is in the final stages of construction and includes the
resource, however, is establishing how much can be expansion of Shell’s upgrading capacity to process
extracted and at what cost. The thick, heavy bitumen the mined bitumen, was described recently by a Shell
is burdened with sand, clay, and water and requires executive as “some of the most expensive production
intensive processing before it can be refined into useful that we have.”74 The $14 billion project will have a
products. With the shallower resources, companies maximum capacity of 100,000 b/d and is said to require
can be confident of extracting a large percentage of the oil prices of at least $70–75 a barrel to turn a profit.
resource through opencast mining, but the processing
required is intense. Deeper tar sands resources requiring in situ
production rely on heating the bitumen underground
After mining, the bitumen has to be separated from using high-pressure steam. Initial infrastructure costs
the soil using large amounts of heated water, creating can be lower than in mining projects but profitability
huge amounts of waste known as tailings.73 The bitumen depends on low natural gas prices (cont.overleaf)
Marginal Oil - What is driving oil companies dirtier and deeper? 13Figure 8: Production costs by resource
150
140
130
120
Arctic
110
Production cost (2008 USD)
Biodiesel
Other EOR
All deep water
100
Other Conventional oil
CO2 EOR
Ethanol
90
MENA Conventional oil
80 Oil BTL
shales CTL
70 GTL
Heavy oil
60 bitumen
50
40
30
20 Already
produced
10
0
1000 2000 3000 4000 5000 6000 7000 8000 9000 10 000
Available oil in barrels Competing fuel sources
Source: IEA Resources to Reserves (forthcoming)72
(continued) and the stability of the reservoir in terms The frontiers: More extreme conditions, higher costs
of its steam-to-oil ratio. Some in situ projects have not
achieved, or maintained for long, the expected ratio.75 The push into deeper water is also accompanied by
Raising the steam-to-oil ratio requires more natural gas, spiralling costs. For both ultra-deepwater and offshore
thereby raising costs. Arctic production, this starts with escalating exploration
costs. Finding oil in ever-remoter locations, thousands
Another cost issue challenging the growth in tar of meters deep, drilling into rock and behind salt layers,
sands production in Alberta is the intense competition quadrupled exploration costs between 2003 and 2008.83
for labor, equipment, and services in the region. The
market in Alberta is among the most expensive in the Exploration and production rigs are becoming
world for oil field services and equipment and due to its increasingly specialized, requiring more highly paid
remote location and the specialized nature of the skills personnel, more sophisticated equipment, and more
and equipment required, the situation is unlikely to steel. Drilling 10,000 ft deep requires 10,000 ft of steel
change much.76 tubing, and steel prices have been booming. In the Arctic,
drilling costs are increased by extreme conditions,
Generally, Canadian tar sands production is regarded leading to shortened drilling seasons, as the winter
as the most expensive oil production in the world and freeze shuts downs operations. This can mean that
has been described by the IEA as “the marginal barrel.”77 wells may take multiple seasons to complete. Additional
Minimum oil prices required for new projects to be hazards such as icebergs require ships to be at hand to
profitable are variously quoted as between $60 and $90 push them from the path of the rig. Particularly large
per barrel.78 The IEA claimed in December 2010 that at icebergs will require rigs to cease drilling and move from
mid-2010 prices, “most new oil-sands projects are thought their path.84
to be profitable at oil prices above $65 to $75 per barrel.”79
The IEA produced the above graph (Figure 8) as a
However, as the IEA also stated: “the attractiveness guide to the costs of various forms of oil production. It
of investing in unconventional oil is highly sensitive to highlights the high cost of Arctic production, which is
the outlook for oil price, the extent of the introduction of listed here as potentially more expensive than bitumen.
penalties on CO2 emissions and the level of development However, the graph states that carbon pricing has not
costs relative to conventional oil.”80 been factored in, while various other sources suggest
that for tar sands (bitumen) – and perhaps some of the
Thus in the longer term, the minimum cost of tar sands other unconventional oils – the top end of this price scale
is likely to rise as carbon costs and other environmental would almost certainly be higher.85 Finally, according
remediation costs are factored in. Under the IEA’s 450 to the IEA, while the breakeven oil price for Canadian
Scenario, for example, a projected price of carbon of tar sands projects is “comparable to that of deepwater
$120/ton would add an extra $5 per barrel of oil produced. offshore conventional oil projects [tar sands] production,
One research report put the long-term price required to and therefore investment payback periods, is spread over
implement all proposed Canadian projects by the 2040s a much longer time period.”86
as between $119 and $134 per barrel at 2009 prices.81
Also worth noting is the low cost of Middle Eastern
This extra cost, combined with a lower oil price – given and North African (MENA) conventional oil and other
reduced demand under scenarios such as the IEA’s 450 – conventional oils. The prospect of lower demand is much
“would make the economics of new oil-sands projects less of a threat to MENA producers and the resource
marginal and cast doubt over the most expensive projects.”82 remains sufficient, especially at lower rates of demand.
14 Marginal Oil - What is driving oil companies dirtier and deeper?You can also read