Growing a Better Future - Food justice in a resource-constrained world - Oxfam America
←
→
Page content transcription
If your browser does not render page correctly, please read the page content below
Growing a
Better Future
 Food justice in a resource-constrained world

             www.oxfam.org/grow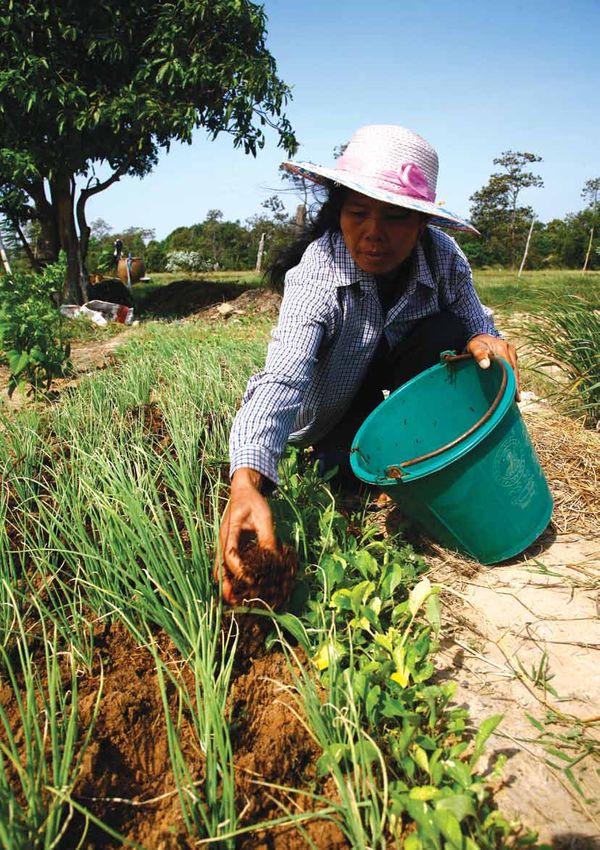
Author: Robert Bailey                                      This publication is copyright but text may be used free of charge for the
                                                                purposes of advocacy, campaigning, education, and research, provided
     Acknowledgments                                            that the source is acknowledged in full. The copyright holder requests
                                                                that all such use be registered with them for impact assessment
     This report was written by Robert Bailey and coordinated   purposes. For copying in any other circumstances, or for re-use in other
                                                                publications, or for translation or adaptation, permission must be
     by Gonzalo Fanjul. Its development was a co-operative      secured and a fee may be charged. E-mail publish@oxfam.org.uk.
     effort, involving Oxfam staff and partner organizations.
     It draws on the findings of a research program managed     Oxfam is an international confederation of fifteen
     by Richard King, Javier Pérez, and Kelly Gilbride.         organizations working together in 98 countries to find
     Alex Evans, Javier García, Silvia Gómez, Duncan            lasting solutions to poverty and injustice:
     Green, Kirsty Hughes, Richard King, Kate Raworth,          Oxfam America (www.oxfamamerica.org),
     Jodie Thorpe, Kevin Watkins, and Dirk Willenbockel         Oxfam Australia (www.oxfam.org.au),
     made specific written contributions to the report,         Oxfam-in-Belgium (www.oxfamsol.be),
     which also draws on an extensive list of case studies,     Oxfam Canada (www.oxfam.ca),
     notes and background research that can be found at         Oxfam France (www.oxfamfrance.org),
     www.oxfam.org/grow                                         Oxfam Germany (www.oxfam.de),
                                                                Oxfam GB (www.oxfam.org.uk),
     Many colleagues contributed with extensive comments        Oxfam Hong Kong (www.oxfam.org.hk),
     and inputs to the drafts of the report. Special mention    Oxfam India (www.oxfamindia.org)
     should be made of Nathalie Beghin, Sarah Best, Phil        Intermón Oxfam (www.intermonoxfam.org),
     Bloomer, Stephanie Burgos, Tracy Carty, Teresa Cavero,     Oxfam Ireland (www.oxfamireland.org),
     Hugh Cole, Mark Fried, Stephen Hale, Paul Hilder, Katia    Oxfam Mexico (www.oxfammexico.org),
     Maia, Duncan Pruett, Anna Mitchell, Bernice Romero,        Oxfam New Zealand (www.oxfam.org.nz),
     Ines Smyth, Alexandra Spieldoch, Shawna Wakefield,         Oxfam Novib (www.oxfamnovib.nl),
     Marc Wegerif, and Bertram Zagema.                          Oxfam Quebec (www.oxfam.qc.ca)
     Production of the report was managed by Anna               The following organizations are currently
     Coryndon. The text was edited by Mark Fried.               observer members of Oxfam International,
     © Oxfam International June 2011                            working toward full affiliation:
                                                                Oxfam Japan (www.oxfam.jp)
     This report and information about the Grow Campaign        Oxfam Italy (www.oxfamitalia.org)
     are available at www.oxfam.org/grow
                                                                Please write to any of the agencies for further
                                                                information, or visit www.oxfam.org.
                                                                Reissued with corrections June 17, 2011.
                                                                For further information on the issues raised in this report,
                                                                please e-mail: advocacy@oxfaminternational.org

ii
Growing a
Better Future
 Food justice in a resource-constrained world

             www.oxfam.org/grow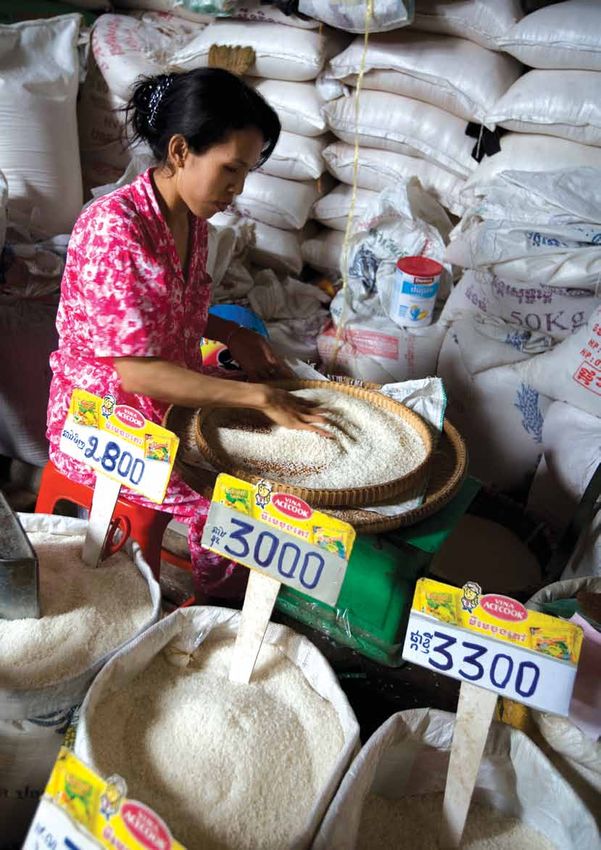
Contents
     ii   Acknowledgements                                  43 3 The new prosperity
     03 List of figures                                     44 3.1 Growing a better future
     05 1 Introduction                                      46 3.2 A new governance for food crises
     11	2 The age of crisis: A skewed and failing system   46 International reform
     12 2.1 A failing food system                           48 National approaches
     14 2.2 The sustainable production challenge            50 A new global governance
     15 Yield increases drying up                           52 3.3 A new agricultural future
     16 Policymaking captured by the few                    54 Four myths about smallholders
     17 Natural resources squeezed                          56 A new agricultural investment agenda
     19 Climate changing                                    58 3.4 Building the new ecological future
     21	Demography, scarcity, and climate change:         58 Equitable distribution of scarce resources
          A perfect storm scenario for more hunger
                                                            59 An equitable transition
     29 Meeting the sustainable production challenge
                                                            62 3.5 The first steps: Oxfam’s agenda
     30 2.3 The equity challenge
                                                            65 4 Conclusion
     32 Access to land
                                                            68 Notes
     33 Women’s access to land
                                                            73 Images
     34 Access to markets
     35 Access to technology
     35 Claiming rights
     36 2.4 The resilience challenge
     36 Increasing fragility
     38 Food prices gone wild
     38 Climate chaos
     39 Government failures
     39 A humanitarian system at breaking point
     40 National-level action
     41 Time to rebuild

02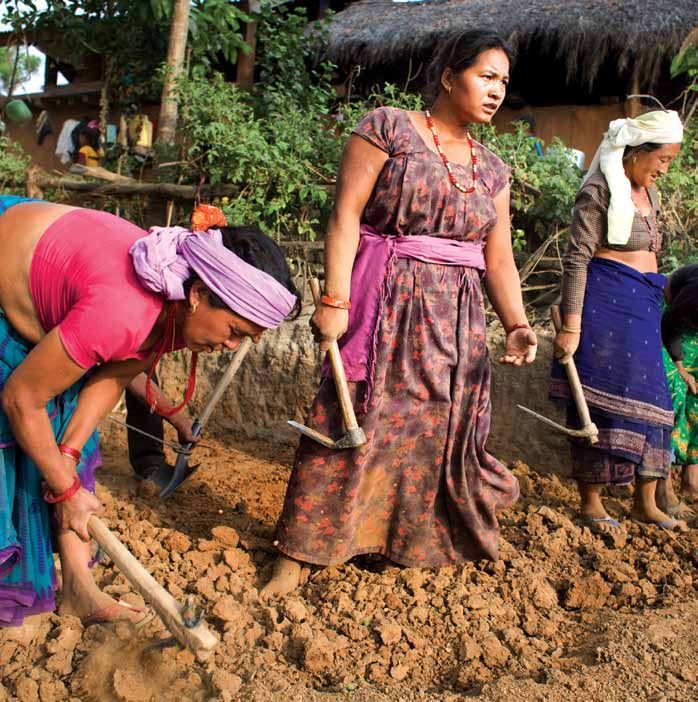
List of figures
12	Figure 1: Real food price changes predicted over    26	Figure 12: The predicted impact of climate change
    the next 20 years                                       on regional staple food production to 2030
13	Figure 2: The challenge of increasing equity        26	Figure 13: The predicted increase in numbers
    within ecological limits                                of malnourished children in sub-Saharan Africa
                                                            in the context of climate change
15	Figure 3: The ecological footprint of food
                                                        27	Figure 14: Predicted dampening impacts of
17	Figure 4: The share of land devoted to
                                                            climate change adaptation on the price of corn
    agriculture has peaked
                                                        30 Figure 15: The food system is riddled with inequity
18	Figure 5: The land grab legacy of the 2008
    food price crisis                                   31 Figure 16: The number of hungry people worldwide
21	Figure 6: The proportion of household expenditure   32 Figure 17: Where are the hungry people?
    allocated to food, with predictions to 2030
                                                        34 Figure 18: Who controls the food system?
22	Figure 7: Predicted increases in world food
                                                        36 Figure 19: The increasing volatility of food prices
    commodity prices
                                                        38 Figure 20: Food prices and oil prices are linked
23	Figure 8: Comparative growth rates in population
    and crop productivity: Corn in sub-Saharan Africa   50 Figure 21: Who are the food superpowers?
    and rice in Asia
                                                        55	Figure 22: Investment in agricultural R&D
24	Figure 9: Predicted food price increases for            ignores Africa
    domestic users to 2030
                                                        56 Figure 23: Who is investing in agriculture?
25	Figure 10: Predicted impact of climate change
                                                        60	Figure 24: Governments are good at investing
    on world market food export prices to 2030
                                                            in public bads
26	Figure 11: The predicted impact of climate change
    on corn productivity to 2030

                                                                                                                 03
1
Introduction

   Chapter 1: Introduction
Niger is the epicenter of hunger. Here, it is chronic.          The list of answers routinely given is bafflingly long, often
     Corrosive. Structural. Systemic. Over 65 percent of             crude, and nearly always polarized. Too much
     people survive on less than $1.25 a day.1 Nearly one in         international trade. Too little international trade. The
     two children is malnourished.2 One in six dies before           commercialization of agriculture. A dangerously romantic
     reaching the age of five.3                                      obsession with peasant agriculture. Not enough
                                                                     investment in techno-fixes like biotechnology. Runaway
     Families are fighting a losing battle against soil depletion,
                                                                     population growth.
     desertification, water scarcity, and unpredictable
     weather. They are exploited by a tiny elite of powerful         Most are self-serving, designed to blame the victims or to
     traders who set food prices at predatory levels.                defend the status quo and the special interests that profit
                                                                     from it. This is symptomatic of a deeper truth: Power
     Shocks rain down upon them like hammer blows: a
                                                                     above all determines who eats and who does not.
     compounding series of disasters, each one leaving
     them more vulnerable to the next. The drought of 2005.          Hunger, along with obesity, obscene waste, and
     The food price crisis of 2008. The drought of 2010.             appalling environmental degradation, is a by-product of
     These events stole lives, shattered families, and               our broken food system. A system constructed by and on
     obliterated livelihoods. The consequences will be               behalf of a tiny minority—its primary purpose to deliver
     felt for generations.                                           profit for them. Bloated rich-country farm lobbies, hooked
                                                                     on handouts that tip the terms of trade against farmers in
     Chronic and persistent hunger. Rising demand on top of
                                                                     the developing world and force rich-country consumers
     a collapsing resource base. Extreme vulnerability.
                                                                     to pay more in tax and more for food. Self-serving elites
     Climate chaos. Spiraling food prices. Markets rigged
                                                                     who amass resources at the expense of impoverished
     against the many in favor of the few. It would be easy to
                                                                     rural populations. Powerful investors who play
     dismiss Niger, but these problems are not unique—they
                                                                     commodities markets like casinos, for whom food is just
     are systemic. The global food system is broken. Niger is
                                                                     another financial asset—like stocks and shares or
     simply on the front line of an impending collapse.
                                                                     mortgage-backed securities. Enormous agribusiness
     At the start of 2011, there were 925 million hungry people      companies hidden from public view that function as
     worldwide.4 By the end of the year, extreme weather and         global oligopolies, governing value chains, ruling
     rising food prices may have driven the total back to one        markets, accountable to no one. The list goes on.
     billion, where it last peaked in 2008. Why, in a world that
     produces more than enough food to feed everybody, do
     so many—one in seven of us—go hungry?

06
An age of crisis
The new era of crisis started in 2008. Lehman Brothers         The paralysis imposed upon us by a powerful minority
collapsed, oil reached $147 a barrel, and food prices          risks catastrophe. Atmospheric concentrations of
leapt, precipitating protests in 61 countries, with riots or   greenhouse gases are already above sustainable levels
violent protests in 23.5 By 2009, the number of hungry         and continue to rise alarmingly. Land is running out.
people passed one billion for the first time.6 Rich-country    Fresh water is drying up. We have pushed ourselves into
governments responded with hypocrisy, professing               the “Anthropocene Epoch”—the geological era in which
alarm while continuing to throw billions of dollars of         human activity is the main driver of planetary change.
taxpayers’ money at their bloated biofuel industries,          Our bloated food system is a major cause of this crunch.
diverting food from mouths to gas tanks. In a vacuum of        But it is also rapidly becoming a casualty. As resource
trust, governments one after another imposed export            pressures mount and climate change gathers pace, poor
bans, pushing up prices further.                               and vulnerable people will suffer first—from extreme
Meanwhile the profits of global agribusiness companies         weather, from spiraling food prices, from the scramble for
rocketed, the returns of speculators soared, and a new         land and water. But they won’t be the last.
wave of land-grabbing kicked off in the developing world,      New research commissioned for this report paints a grim
as private and state investors sought to cash in or to         picture of what a future of worsening climate change and
secure supply.                                                 increasing resource scarcity holds for hunger. It predicts
Now, as climate chaos sends us stumbling into our              international price rises of key staples in the region of 120
second food price crisis in three years, little has changed    to 180 percent by 2030. This will prove disastrous for
to suggest that the global system will manage any better       food importing poor countries, and raises the prospect of
this time around. Power remains concentrated in the            a wholesale reversal in human development.
hands of a self-interested few.

“We lack food. We’re facing hunger,
 but we can’t buy much. ... This year
 things are much worse than before.
 Worse than in 2005 when things were
 bad. Then not everybody faced hunger ...
 just some areas. But now, everyone is
 facing hunger.”
Kima Kidbouli, 60 years, Niger, 2010.

Opposite: Families in Flinigue, Niger receive food
vouchers from Oxfam. The vouchers give them the
freedom to choose what they buy in a specified store.
(August 2010)

Right: Kimba Kidbouli, 60 years, Niger.
                                                                                                       Growing a Better Future    07
                                                                                                        Chapter 1: Introduction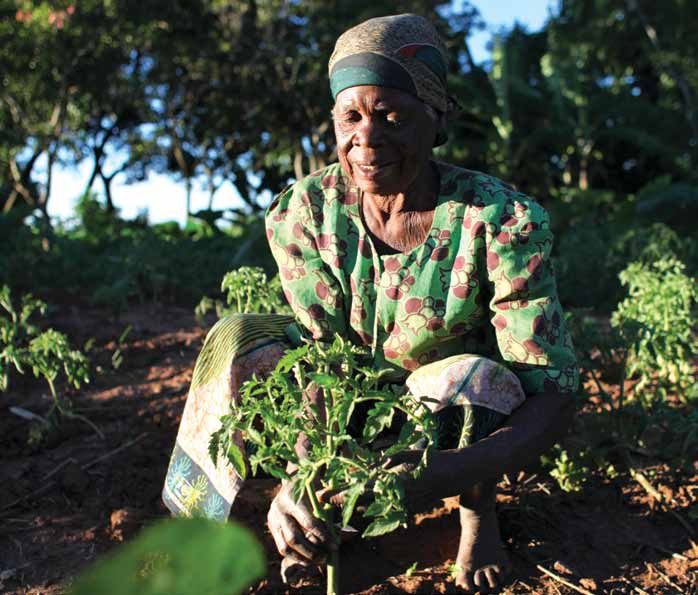
A new prosperity                                                All of this will require overcoming the vested interests that
                                                                     stand to lose out. There is growing appetite to do so as
     This future is not certain. Crisis on the scale we are          these issues rise up the political agenda, pushed by
     experiencing today almost always leads to change: The           events and by campaigners, or grasped by leaders with a
     Great Depression and the Second World War led to a              sense of moral purpose. Though the banks fight reform
     new world order, the United Nations, the Bretton Woods          tooth and nail, public outrage has seen legislative
     system, and the spread of welfare states. The oil and           measures passed in the US, and steps toward regulation
     economic crises of the 1970s replaced Keynesianism              in the UK and elsewhere. And a financial transactions tax
     with laissez-faire economics and the Washington                 is on the agenda in the EU and at the G20, alongside
     Consensus.                                                      measures to rein in commodity speculation and reform
     The challenge before us today is to seize the opportunity       agricultural trade. Though special interests continue to
     for change and set course towards a new prosperity, an          pervert food aid in many rich countries, a concerted
     age of cooperation rather than competition, in which the        public campaign in Canada succeeded in freeing it to
     well-being of the many is put before the interests of the       work effectively; Canada now leads international
     few. During the last food price crisis, politicians tinkered    negotiations to achieve the same outcome globally.
     at the margins of global governance. This time they must        Though agricultural subsidies remain enormous, some
     deal with the root causes. Three big shifts are needed:         reform has reduced their negative impacts in developing
                                                                     countries. Though dirty industry continues to block
     • First, we must build a new global governance to avert        progress on climate change, responsible companies
        food crises. Governments’ top priority must be to tackle     have broken ranks with it.7 A growing number of
        hunger and reduce vulnerability—creating jobs and            countries are adopting bold greenhouse gas reduction
        investing in climate adaptation, disaster risk reduction,    targets or making ambitious investments in clean
        and social protection. International governance—of           technologies. In 2009, the US and Europe added more
        trade, food aid, financial markets, and climate finance—     power capacity from renewable sources such as wind
        must be transformed to reduce the risks of future            and solar than conventional sources like coal, gas and
        shocks and respond more effectively when they occur.         nuclear.8
     • Second, we must build a new agricultural future by           But what is needed is a significant change. Strong
       prioritizing the needs of small-scale food producers in       political leaders with unambiguous mandates from their
       developing countries—where the major gains in                 peoples. Progressive businesses that choose to break
       productivity, sustainable intensification, poverty            ranks with laggards and blockers. Customers that
       reduction, and resilience can be achieved.                    demand they do so. And it is needed now. The window of
       Governments and businesses must adopt policies and            opportunity may be short lived, and many of the choices
       practices that guarantee farmers’ access to natural           that must be taken are already upon us: if catastrophic
       resources, technology, and markets. And we must               climate change is to be avoided, global emissions must
       reverse the current gross misallocation of resources,         peak within the next four years;9 if we are to avoid a
       which sees the vast majority of public money for              spiraling food price crisis, fragility in the global system
       agriculture flow to agro-industrial farms in the North.       must be addressed today.
     • Finally, we must build the architecture of a new
        ecological future, mobilizing investment and shifting the
        behaviors of businesses and consumers, while crafting        “We need to address the question of
        global agreements for the equitable distribution of           global hunger not as one of production
        scarce resources. A global deal on climate change will        only, but also as one of marginalization,
        be the litmus test of success.
                                                                      deepening inequalities, and social
                                                                      injustice. We live in a world in which
                                                                      we produce more food than ever before,
                                                                      and in which the hungry have never been
                                                                      as many.”
                                                                     Olivier de Schutter, Special Rapporteur on
                                                                     the Right to Food at the FAO Conference,
                                                                     November 2009

     Opposite: Women from Dola village construct a pond to
     irrigate their vegetable gardens. Nepal’s hill districts have
     lacked investment in agriculture and are faced with a rise
     in food prices and reduced crop yields as a result of
     climate change. (Nepal 2010)
08
Oxfam’s vision Many other organizations—global civil society,
producers’ organizations, women’s networks, food
Oxfam has been responding to food crises for nearly 70 movements, trade unions, responsible businesses and
years—from Greece in 1942 to Biafra in 1969, Ethiopia in empowered consumers, grassroots campaigns for
1984, and Niger in 2005, plus countless other silent low-carbon living, food sovereignty or the right to food—
disasters that play out beyond the gaze of global media. are promoting positive initiatives to alter the way we
All have been entirely avoidable—the result of disastrous produce, consume, and think about food. Together we
decisions, abused power, and perverted politics. More will build a growing global movement for change.
recently, Oxfam has found itself responding to growing Together we will challenge the current order and set a
numbers of climate-related disasters. path towards a new prosperity.
Prevention is better than cure, and so Oxfam also
campaigns against the vested interests and unfair rules
that corrupt the food system: rigged trade rules, pork-
barrel biofuel policies, broken aid promises, corporate
power, and inaction on climate change.
Growing a Better Future 09
Chapter 1: Introduction2 The age of crisis: a skewed and failing system Chapter 2: The age of crisis: a skewed and failing system
Figure 1: Real food price changes predicted over the next 20 years

                                                                   2030 baseline           2030 climate change
                                                                   180

                                                                   160
     Increase in world market export prices relative to 2010 (%)

                                                                   140

                                                                   120

                                                                   100

                                                                   80

                                                                   60

                                                                   40

                                                                   20

                                                                   0
                                                                         Other processed     Processed meat   Processed rice   Livestock      Wheat         Other crops   Paddy rice   Corn
                                                                         food                products

                                                                   Source: D. Willenbockel (2011) “Exploring Food Price Scenarios Towards 2030,” Oxfam and IDS

                                       2.1                                                                                                 The food system is buckling under intense pressure from
                                                                                                                                           climate change, ecological degradation, population
                                                                                                                                           growth, rising energy prices, rising demand for meat and

                                       A failing food                                                                                      dairy products, and competition for land from biofuels,
                                                                                                                                           industry, and urbanization.

                                       system
                                                                                                                                           The warning signs are clear. Surging and unstable
                                                                                                                                           international food prices, growing conflicts over water,
                                                                                                                                           the increased exposure of vulnerable populations to
                                                                                                                                           drought and floods are all symptoms of a crisis that may
                                                                                                                                           soon become permanent: food prices are forecast to
                                                                                                                                           increase by something in the range of 70 to 90 percent by
                                                                                                                                           2030 before the effects of climate change, which will
                                                                                                                                           roughly the double price rises again (see Figure 1).

12
Figure 2: The challenge of increasing equity within ecological limits
2010 2050
Population:
7billion Population:
9billion
Planetary boundaries Ecological impact of global resource use Resource share of the worst-off 20% of people
We face the unprecedented challenge of pursuing There are three major challenges that must be met:
human development and ensuring food for all, in ways
• The sustainable production challenge: we must
that will both keep the planet within essential ecological
produce enough nourishing food for nine billion people
boundaries and end extreme poverty and inequalities.
by 2050 while remaining within planetary boundaries;
Figure 2 illustrates the task at hand.
• The equity challenge: we must empower women and
Even as global population significantly expands, we
men living in poverty to grow or to buy enough food
must:
to eat;
• Reduce the impacts of consumption to within
• The resilience challenge: we must manage volatility in
sustainable limits, and
food prices and reduce vulnerability to climate change.
• Redistribute consumption towards the poorest.
Running through each are fault lines along which
Achieving the vision for 2050 requires a redistribution struggles for power and resources will play out.
of power from the few to the many—from a handful This chapter sets out each in detail.
of companies and political elites to the billions of people
who actually produce and consume the world’s food.
A share of consumption must shift towards those living
in poverty, so everyone has access to adequate,
nourishing food. A share of production must shift from
polluting industrial farms to smaller, more sustainable
farms, along with the subsidies that prop up the former
and undermine the latter. The vice-like hold over
governments of companies that profit from environmental
degradation—the peddlers and
pushers of oil and coal—must be broken.
Growing a Better Future 13
Chapter 2: The age of crisis:
a skewed and failing system2.2 Agriculture faces a daunting challenge. It must
dramatically increase food production while completely
transforming the way in which food is produced. On
The current trends, demand for food may increase by 70
percent by 205010 due to population growth and
sustainable
economic development. The earth’s population is
expected to grow from around 6.9 billion today to 9.1
billion in 2050—an increase of one-third11—by which
production
time an estimated seven out of ten people worldwide will
live in Low-Income Food Deficit Countries (LIFDCs).12
These are forecasts with big margins of error. Greater
challenge investment in solutions that increase women’s
empowerment and security—by improving access to
education and healthcare in particular—will slow
population growth and achieve stabilization at a lower
level.
But the Malthusian instinct to blame resource pressures
on growing numbers of poor people misses the point,
because people living in poverty contribute little to world
demand. Skewed power relations and unequal
consumption patterns are the real problem.
The global economy is forecast to be three times bigger
by 2050, with emerging economies’ share of output rising
from one-fifth to well over a half.13 This is a good thing
and fundamental to addressing the challenges of equity
and resilience. But for this level of development to be
viable, an unprecedented shift to more sustainable
consumption trends must take place in both
industrialized and emerging economies.
“We started this irrigation scheme
because we were facing problems with
the climate. ... It’s impossible to harvest
enough for the whole year when you
have to rely on the rain. Now we have
access to water during the dry months
we are able to plant several crops in a
year—wheat, rice and tomatoes.
We no longer see the problems
other people face.”
Charles Kenani, farmer, Malawi
Right: Charles Kenani standing in his rice field. The
Oxfam-funded Mnembo Irrigation scheme has helped
400 families in Malawi by transforming their traditional
small low-yield crops into year-round, high volume
harvests that provide continuous food and a source of
income. (Malawi, 2009)
14At present, higher incomes and increasing urbanization The US Department of Agriculture’s Economic Research
leads people to eat less grains and more meat, dairy, Service observed in 2008 that global consumption of
fish, fruit, and vegetables. Such a “Western” diet uses far grain and oilseeds outstripped production for seven of
more scarce resources: land, water, atmospheric space the eight years between 2001 and 2008.
(see Figure 3).
Modern agro-industrial farming is running faster and
In the meantime, in more than half of industrialized faster just to stand still. Put simply, increasing irrigation
countries, 50 percent or more of the population is and fertilizer use can only get us so far, and we’re nearly
overweight,14 and the amount of food wasted by there. With the exception of parts of the developing
consumers is enormous—quite possibly as much as world, the scope for increasing the area under irrigation
25 percent.15 is disappearing.17 Increasing fertilizer use offers ever
diminishing returns and serious environmental
Yield increases drying up consequences.
In the past, rising demand has been met and surpassed But it is not like this everywhere. Throughout the
by increasing crop yields, but the dramatic achievements developing world, there is huge untapped potential for
of the past century are running out of steam. Global yield growth in small-scale agriculture.18 With the right
aggregate growth in yields averaged two percent per kind of investment this potential can be realized—helping
year between 1970 and 1990, but plummeted to just over to meet the sustainable production challenge while
one percent between 1990 and 2007. This decline is delivering agricultural development for people in poverty.
projected to continue over the next decade to a fraction
of one percent.16
Figure 3: The ecological footprint of food
2.2 lbs of: Water footprint Emissions Land use Grain for feed Calories (Kcal)
in gallonsi in lb CO2eii in yd2 iii in lb
BEEF
= 4,100 35.2 9.5 13
2,470
CHICKEN
= 1,000 10.1 7.7 4.0 1,650
EGGS
= 880 12.1 8.0
1,430
MILK = 265 23.2 11.8
610
WHEAT
= 340 1.8 1.8
3,400
RICE = 900
1,300
Elsewhere in this report we have provided metric values for data, however, for the sake of legibility, we have omitted metric equivalents from this graphic.
i
Assumes an average egg weighs 2.1 oz, and the density of milk is 8.3 pounds/gallon.
ii
Based on production in England and Wales
iii
Based on production in England and Wales, assumes all production is on land of an equal grade
Sources: Water http://www.waterfootprint.org/?page=files/productgallery; emissions and land use UK DEFRA (2006),
http://goo.gl/T12ho; grain National Geographic, http://goo.gl/4CgFB; calories USDA National Nutrient Database, http://goo.gl/7egTT
Growing a Better Future 15
Chapter 2: The age of crisis:
a skewed and failing systemPolicymaking captured by the few In the aftermath of the 2008 food price crisis, rich
countries at the G8 Summit announced the l’Aquila Food
Sadly, investment in developing country agriculture, Security Initiative: a commitment to mobilize $20 billion
despite the huge potential benefits, has been pitiful. over three years for investment in developing countries. If
Between 1983 and 2006, the share of agriculture in this was an attempt to atone for past sins, it was, at best,
official development assistance (ODA) fell from 20.4 underwhelming. The pledge amounted to a derisory
percent to 3.7 percent, representing an absolute decline fraction of the subsidies that rich countries were lavishing
of 77 percent in real terms.20 During this time rich-country on their biofuels industries at the time—one of the key
governments did not neglect their own agricultural drivers of the 2008 price hike.25 Incredibly, a large portion
sectors. Annual support spiraled to over $250 billion a of this figure has turned out to be recycled from past
year21—79 times agricultural aid22—making it impossible promises or double-counted against other commitments.
for farmers in poor countries to compete. Confronted with In the case of Italy, the l’Aquila commitment actually
these odds, many developing country governments represented a reduction in aid.26
chose not to invest in agriculture, further compounding
the trend. Rich-country governments have spectacularly failed to
resist the capture of agricultural policymaking by their
The costs of rich-country support are borne not only by farm lobbies. The results? Drastically reduced
poor farmers in the developing world, but also by people agricultural productivity and increased poverty in the
in rich countries, who pay twice—first through higher tax South, and the plunder of hundreds of billions of dollars
bills, and second through higher food prices. It is a year from taxpayers in the North.
estimated that in 2009, the EU’s Common Agricultural
Policy (CAP) added €79.5 billion ($114.0 billion) to tax
bills and another €36.2 billion ($51.9 billion) to food bills.23
According to one calculation, it costs a typical European
family of four almost €1,000 (about $1,400) a year. The
real irony is that the CAP purports to help Europe’s small
farmers, but it is the rich few that benefit the most, with
about 80 percent of direct income support going into the
pockets of the wealthiest 20—mainly big landowners and
agribusiness companies.25 Never, in the field of farming,
has so much, been taken from so many, by so few.
16Figure 4: The share of land devoted to agriculture has peaked
Agricultural area (% of global land area) Agricultural area (hectares/acres per capita)
38 1.6 (4.0)
37 1.4 (3.5)
36 1.2 (3.0)
35 1.0 (2.5)
hectares/acres per capita
% of global land area
34 0.8 (2.0)
33 0.6 (1.5)
1961
1964
1968
1972
1976
1980
1984
1988
1992
1996
2000
2004
2008
Source: Calculated from FAO, http://faostat.fao.org/site/377/default.aspx
Natural resources squeezed Increase in demand is not likely to be met by the
expansion of production area. Nevertheless, whatever
The huge increase in demand for food must be met land there is will surely be prized. The vast majority looks
from a rapidly depleting resource base, squeezed by to be in sub-Saharan Africa and Latin America.29
biofuel production, carbon sequestration and forest
conservation, timber production, and non-food crops. Water, the lifeblood of agriculture, is already scarcer than
As a result, the share of land devoted to food production land. Nearly three billion people live in areas where
has peaked (see Figure 4). demand outstrips supply.30 In 2000, half a billion people
lived in countries chronically short of water; by 2050 the
At the same time, the amount of arable land per head number will have risen to more than four billion.31 By
is decreasing, having almost halved since 1960.27 2030, demand for water is expected to have increased by
Nobody really knows how much land remains, but it isn’t 30 percent.32
much.28 Very often, land that may be termed idle or
marginal in fact plays a critical role in the livelihoods of Agriculture accounts for 70 percent of global fresh water
marginalized people such as pastoralists, indigenous use,33 and is both a driver and increasingly a victim of
peoples and women. water scarcity. Climate change will only exacerbate an
already acute problem, particularly in already stressed
regions. Shrinking glaciers will reduce flows in crucial
“For with the land comes the right to rivers—for example, the Ganges, Yellow, Indus, and
withdraw the water linked to it, in most Mekong rivers all depend on the Himalayas. Rises in sea
countries essentially a freebie that level will salinate fresh water, while floods will
contaminate clean water.
increasingly could be the most valuable
part of the deal.”
Peter Brabeck-Lethmath, CEO, Nestlé
Opposite: Rice prices in Cambodia soared in 2008. The
pile of rice on the left was bought in 2008, and the pile on
the right shows what the same money would have bought
in 2007. (Cambodia, 2008)
Growing a Better Future 17
Chapter 2: The age of crisis:
a skewed and failing systemFigure 5: The land grab legacy of the 2008 food price crisis
FAO Food Price Index (2002–2004 = 100) Number of monthly media stories on land grabs
250
200
150
100
50
0
Jan 2002
Jan 2003
Jan 2004
Jan 2005
Jan 2006
Jan 2007
Jan 2008
Jan 2009
Jan 2010
Sources: FAO http://www.fao.org/worldfoodsituation/wfs-home/foodpricesindex/en/ and http://www.factiva.com
The Middle East offers a taste of what may be to come. Research from the International Land Coalition, Oxfam
Aquifers are rapidly becoming exhausted and the area Novib, and partners identifies over 1,200 land deals
under irrigation is in decline. Saudi Arabia has reportedly under negotiation or completed, covering 80
experienced precipitous falls of over two-thirds in wheat million hectares (nearly 200 million acres),37 since
production since 2007 and on current trends will become 2000—the vast majority of them after 2007. Over 60
entirely dependent on imports by next year.34 Middle percent of the land targeted was in Africa.38
Eastern states are among the biggest land investors in
Of course, investment can be a good thing. But price
Africa,35 driven not by a lack of land but a lack of water.
rises like the one we saw in 2008 spark a frenzy among
Many governments and elites in developing countries are investors, with many acting speculatively or in fear of
offering up large swathes of land amid clouds of losing out. And why not? The land is usually dirt cheap,
corruption at rock bottom prices. Companies and apparently idle and, anyway, investing in land is a
investors are cashing in, while food-insecure one-way bet these days: the price will only go up as
governments are rushing to secure supply. The scramble it becomes more and more scarce. Investors have
began with the 2008 food price crisis and continues been acquiring land in much larger quantities than they
unabated: in 2009, Africa saw 22 years’ worth of land could possibly use, leading the World Bank to wonder
investment in 12 months (see Figure 5).36 if the purpose is to lock in the highly favorable terms
currently on offer and avoid future competition.39
The most comprehensive research to date suggests
that 80 percent of projects reported in the media
are undeveloped, and only 20 percent had begun
actual farming.40
18For people without the income, savings, access to
Box 1: A new breed of land investor
healthcare, or social insurance enjoyed in industrialized
Where there is scarcity, there is opportunity. And countries, shocks from climatic disasters or shifting
financial investors are quick to turn opportunity into seasons often force them to go without food, sell off
profit. Numerous hedge funds, private equity funds, assets critical to their livelihoods, or take their children
sovereign wealth funds and institutional investors are out of school. Short-term coping strategies can have
now buying up farmland in developing countries. One long-term consequences, causing a downward spiral of
is Emergent Asset Management, currently enjoying deeper poverty and greater vulnerability.
the arbitrage opportunity presented by “very, very
Despite the scale and urgency of the challenge,
inexpensive” land values in sub-Saharan Africa.41
governments have failed to take adequate action to
Emergent points out that Zambian land, though some reduce emissions, collectively or individually. Instead
of the most expensive in sub-Saharan Africa, is still they have listened to their industrial lobbies—the small
one-eighth the price of similar land in Argentina or number of companies that stand to lose from a transition
Brazil, and less than a twentieth of that in Germany. towards a sustainable future from which the rest of us
Emergent assumes that land will generate strong would gain (see Box 2).
returns as prices rise—in part because of increasing
demand for land from the food powers of Brazil Box 2: Dirty industry and grubby lobbying
and China.42 Lobbying from dirty industries has kept Europe locked
One of Emergent’s stated strategies is to identify into low ambition on reducing its greenhouse gas
poorly managed or failing farms and buy them up at emissions, marginalizing its influence in negotiations
distressed prices, then turn them around in order to and preventing a transition to a low-carbon economy.
boost returns. Rapidly appreciating land prices Others, meanwhile, race past—most notably China,
provide a ”backstop” should this risky strategy fail. now the world’s biggest sovereign investor in
renewables.46 Some of the most intense lobbying
Agricultural investment is desperately needed. And comes from steel, oil and gas, chemicals, and paper
Emergent argues that it is not simply building up land companies, and the associations that speak on their
banks—it also invests to increase productivity and behalf,47 as well as from wider cross-sectoral umbrella
brings in new techniques and technologies, as well as groups, most depressingly of all BusinessEurope—
making ”social investments” in schools, hospitals and the general European employers’ association –to
housing. But the risk remains that some investors will which most major companies that profess deep
be interested only in the easy return on land, rather concern about climate change belong. These faceless
than the trickier business of growing food. associations have low public profiles, allowing
supposedly ”responsible” companies to keep their
Climate changing hands clean.
Climate change poses a grave threat to food production. Companies not only lobby against greater climate
First, it will apply a further brake on yield growth. ambition, they also lobby to capture regulation for
Estimates suggest that rice yields may decline by 10 themselves. For example, ArcelorMittal, the world’s
percent for each 1°C (1.8 °F ) rise in dry-growing-season largest privately owned steel company, has lobbied to
minimum temperatures.43 Modeling has found that secure free allowances under the EU Emissions
countries in sub-Saharan Africa could experience Trading Scheme (ETS). The company has profited
catastrophic declines in yield of 20–30 percent by 2080, nicely from its lobbying, ending up with allowances to
rising as high as 50 percent in Sudan and Senegal.44 spare—potentially allowing it to increase its emissions
in the future. All these surplus allowances depress the
Second, it will increase the frequency and severity of
carbon price and remove the incentives for investment
extreme weather events, such as heat waves, droughts
in clean technologies that the carbon market was
and floods, which can wipe out harvests at a stroke.
designed to provide. By 2012 ArcelorMittal could
Meanwhile, creeping, insidious changes in the seasons,
potentially make over €1 billion ($1.43 billion) from
such as longer, hotter dry periods, shorter growing
these free handouts,48 turning on its head the principle
seasons, and unpredictable rainfall patterns, are
at the heart of the ETS—that the polluter pays.
bewildering poor farmers, making it harder and harder for
them to know when best to sow, cultivate, and harvest
their crops.45
Growing a Better Future 19
Chapter 2: The age of crisis:
a skewed and failing systemBox 3: Palm oil—eating the world’s forests
The oil palm is a remarkable crop. It is high-yielding and About 80 percent of palm oil ends up in food,55 but a
fast-growing. Its oil provides a versatile ingredient used growing amount is used for biodiesel. Regulations in
throughout the world, though few of us realize it. Palm the EU, US, and Canada that require minimum biofuels
oil can be found in chocolate, bakery products, sauces, content in gasoline and diesel are further driving
chips, margarine, cream cheese, sweets, and ready deforestation either directly or because palm oil is
meals. It is produced mainly by major plantation replacing other edible oils diverted for biodiesel use.
companies in Malaysia and Indonesia, and bought in Oxfam estimates that even if the EU excludes all
vast quantities by food manufacturers such as Unilever, biodiesel produced from deforested land, its mandate
Kraft, and Nestlé. could raise emissions from deforestation by up to 4.6
billion tonnes (5.5 billion tons) of CO2—nearly 70 times
Our hunger for palm oil appears insatiable. Demand is
the annual CO2 saving the EU expects to make by
expected to double from 2010 to 2025.53 This holds
reaching its target to derive 10 percent of its transport
terrifying implications for the rainforests of Indonesia,
energy from biofuels by 2020.56
where every minute plantations eat one more hectare
(2.5 acres) further into one of the planet’s most carbon-
rich major ecosystems.54
Climate change not only threatens agriculture, the way
we now farm also threatens the climate. While not the “... nowadays when it comes to the rains
only contributor to greenhouse gas emissions, or even sometimes you get too much and it
the greatest, agriculture accounts for a significant share
of the damage: somewhere between 17 and 32 percent
destroys the crops. Sometimes you don’t
of all human-induced greenhouse gases.49 Key drivers get any at all and the crops just wilt. If
are emissions from fertilizer use and from cattle.50 that happens, you don’t have any food
Alarmingly, both are set to increase significantly.51
the next year. About the rains, I don’t
The biggest contributor by far to agricultural emissions, know what we can do.”
however, is land-use change;52 converting wilderness to
agriculture can release large amounts of greenhouse Killa Kawalema, farmer, Malawi
gases, particularly in the case of forests and wetlands
(See Box 3).
20Figure 6: The proportion of household expenditure allocated to food, with predictions to 2030
2004 (baseline) 2020 2030
60
50
Proportion of household expenditure on food (%)
40
30
20
10
0
N America S Asia India W Africa C Africa E Africa
Demography, scarcity, and climate Headline figures such as this provide only a partial
picture of the scale of threat. Over the lifetime of a single
change: A perfect storm scenario generation, the world is losing an opportunity to remove
for more hunger the specter of hunger from an under-five population
Predicting the future is a hazardous endeavor. When it larger than all of the children in that age group living
comes to agricultural production and nutrition, there are today in France, Germany, and the UK combined.
many unknowns. Yet detailed scenarios and projections Standing by and failing to prevent that outcome would
developed for this report point unequivocally towards an represent an abdication of responsibility and failure of
overwhelming conclusion: the world faces a real and international leadership without precedent; not least
imminent risk of major setbacks in efforts to combat the because this is an avoidable tragedy if—and only if—
scourge of hunger.57 That risk is not a remote future governments act decisively in the next few years to
threat. It is emerging today, will intensify over the next avert it.
decade, and evolve over the twenty-first century as Why the focus on food prices? First, because world food
ecology, demography, and climate change interact to prices provide a useful barometer of how the tectonic
create a vicious circle of vulnerability and hunger in some shifts in demography, ecology, and climate might play out
of the world’s poorest countries. within the food system. Rising prices signal imbalances
There are alternatives. But the central message to in the supply response to rising demand. Second, food
emerge from the scenario analysis is that the prices have a major bearing on hunger because they
international community is sleepwalking into an influence the capacity of poor people—and poor
unprecedented and avoidable human development countries—to gain access to calories. Of course, prices
reversal. Research carried out for this report explored a cannot be viewed in isolation: purchasing power is also
range of food price scenarios for 2020 and 2030 using influenced by income. But in many of the developing
international trade models.58 In the absence of urgent regions facing the gravest challenges with malnutrition,
and aggressive action to tackle global warming, prices of food still accounts for around half of average household
basic staple foods are expected to skyrocket in the spending—and for an even greater share of spending by
coming two decades. Using a different model that people living in poverty (see Figure 6).60
nevertheless forecasts a similar trend, the International “Exploring Food Price Scenarios Towards 2030”
Food Policy Research Institute (IFPRI) has recently www.oxfam.org/grow
calculated that 12 million more children would be
consigned to hunger by 2050, compared with a scenario
with no climate change.59
Growing a Better Future 21
Chapter 2: The age of crisis:
a skewed and failing systemInternational price projections for the major traded food Global projections of this type simultaneously
staples reflect the severe stresses under which the food obscure and understate scenarios for different regions.
system is buckling. Over the next two decades, prices for Disaggregated data for four African regions points to a
commodities such as rice, wheat, and corn are forecast large and sustained divergence between population
to rise by between 60 and 80 percent (see Figure 7). growth and baseline productivity growth in agriculture.
This will hit the poorest people the hardest. For example, These are regions with a collective population of over
although food accounts for 46 percent of an average 870 million and some of the world’s highest levels of
West African household’s spending, in the poorest malnutrition. In West Africa, the population will increase
20 percent of Malian households, food consumes by 2.1 percent per annum on average, while a simple
53 percent of all household spending; and although in continuation of past productivity gains would increase
much of South Asia 40 percent of all household spending corn productivity by 1.4 percent per annum to 2030
goes on food, for the poorest 20 percent of Sri Lankans, (see Figure 8).
the figure is as high as 64 percent. 61
In South and South-East Africa, corn productivity growth
is projected to be barely any higher, though population
growth is projected to be slower. While the productivity–
population growth divergence is less marked in other
parts of the world, projections for East Asia (excluding
China), India, and the rest of South and Central Asia all
point to a future in which agriculture struggles to keep
pace with the demands associated with a growing
population (see Figure 8b).
Figure 7: Predicted increases in world food commodity prices
2020 2030
100
90
Increase in world market export prices relative to 2010 (%)
80
70
60
50
40
30
20
10
0
Other processed Processed meat Processed rice Wheat Livestock Other crops Paddy rice Corn
food products
22Figure 8a: Comparative growth rates in population and crop productivity:
Corn in sub-Saharan Africa
South and SE Africa population W Africa population C Africa population C and E Africa corn
South and SE Africa corn W Africa corn E Africa population
220
Indexed population and crop productivity growth (2004=100)
200
180
160
140
120
100
2004
2005
2006
2007
2008
2009
2010
2011
2012
2013
2014
2015
2016
2017
2018
2019
2020
2021
2022
2023
2024
2025
2026
2027
2028
2029
Figure 8b: Comparative growth rates in population and crop productivity: Rice in Asia
Other E and SE Asia population India population Other S Asia population C Asia population
Other E and SE Asia rice India, Other S Asia, C Asia rice
160
Indexed population and crop productivity growth (2004=100)
150
140
130
120
110
100
2004
2005
2006
2007
2008
2009
2010
2011
2012
2013
2014
2015
2016
2017
2018
2019
2020
2021
2022
2023
2024
2025
2026
2027
2028
2029
Growing a Better Future 23
Chapter 2: The age of crisis:
a skewed and failing systemFigure 9: Predicted food price increases for domestic users to 2030
2020 2030
180
Increase in domestic user price of crops relative to 2010 (%)
160
140
120
100
80
60
40
20
0
C Africa wheat C Africa corn Andean wheat Andean corn Russia corn Russia wheat China wheat China paddy rice
Regional price projections reflect underlying shifts in The bad news is that these are good case scenarios
supply and demand. Figure 9 provides an insight into the because they do not factor in climate change effects.
magnitude of food staple price inflation for a number of Climate change is a potent risk multiplier in agriculture.
crops and regions. In Central Africa, consumers of corn Our projections capture the simulated impact of climate
face the prospect of a 20 percent increase in prices over change on world prices for the major traded food staples
the next decade, with an equivalent increase over the (see Figure 10). In the case of corn, the incremental
following decade. effect of climate change on price inflation is around 86
percent. There are also marked effects for rice and
In the Andean countries, wheat and corn prices will rise
wheat. In summary, these expected effects would wipe
by 25 percent to 2020; and, in the case of corn, by 65
out any positive impacts from expected increases in
percent to 2030.
household incomes, trapping generations in a vicious
circle of food insecurity.
Opposite: Rice sellers Sok Nain and Mach Bo Pha in Dem
Kor Market in Phnom Penh. Sellers say their profits have
fallen by 30 percent as rice prices in Cambodia soared in
2008. (Cambodia 2008)
24Figure 10: Predicted impact of climate change on world market food export prices to 2030
2030 baseline 2030 climate change
180
160
Increase in world market export prices relative to 2010 (%)
140
120
100
80
60
40
20
0
Other processed Processed meat Processed rice Livestock Wheat Other crops Paddy rice Corn
food products
Growing a Better Future 25
Chapter 2: The age of crisis:
a skewed and failing systemFigure 11: The predicted Figure 12: The predicted impact of
impact of climate change on climate change on regional staple food
corn productivity to 2030 production to 2030
Other
E and
China SE Asia
South and Brazil C Africa W Africa E Africa paddy paddy
Percentage changes in maize productivity relative to 2030 baseline
SE Africa W Africa C Africa E Africa C America Andean wheat corn corn corn rice rice
Percentage changes in domestic output relative to 2030 baseline
-5
-5
-10
-15
-10
-20
-25
-15
-30
-35
-20
-40
-45 -25
Figure 13: The predicted increase in numbers The impact of climate change on food prices is clearly
of malnourished children in sub-Saharan closely linked to the impacts that climate change will
Africa in the context of climate change have on crop production. Here too, our scenarios point
towards some disturbing warning signals. Some of the
major internationally traded grains included in our model
1000 are important food staples for a large group of low-
income countries. For example, corn is a major staple
900
across much of sub-Saharan Africa, Central America
800
and the Andean countries.
Climate change will have adverse effects on aggregate
700 production volumes (Figure 12), as well as agricultural
productivity (Figure 11), across all developing regions.
600
Projections raise particularly worrying concerns for corn
500 production in sub-Saharan Africa. Moreover, the trends
captured in our scenarios to 2030 are consistent with
400 long-term trend analysis carried out by IFPRI for a wider
set of crops. That analysis points to a marked climate
300 change effect in reducing yields of sweet potatoes and
Children, thousands
yams, cassava, and wheat by 2050 (respectively 13, 8,
200
and 22 percent lower than under a scenario without
100
climate change).62
0
2010 2030 2050
26Figure 14: Predicted dampening impacts of climate change adaptation on the price of corn
Baseline Climate change impact Climate change adaptation
120
110
100
90
Percentage price increase relative to 2010 baseline (%)
80
70
60
50
40
30
20
10
0
W Africa C Africa E Africa South and SE Africa
Ultimately, price and production scenarios are only as It should be emphasized that the scenarios developed by
useful as the insights they provide into the threats facing Oxfam’s commissioned research do not define the
vulnerable people, and the policy options for world’s destiny. They highlight plausible outcomes based
governments seeking to avert those threats. So what on business-as-usual scenarios. Other futures are
picture do our scenarios paint for the state of world possible. Strengthening national agricultural policies and
hunger in 2050? reprioritizing agriculture within the international
development agenda more generally would help to raise
The relentless underlying pressure on the world food
productivity among small-scale food producers, in turn
system and the risk multiplier effects associated with
ensuring that regional productivity keeps pace with
climate change raise the specter of an early slowdown in
population growth. Building a new international
the rate at which malnutrition is falling, followed by
governance to avert food crises and respond more
medium-term reversals in many countries. Inevitably, the
effectively when they occur will help shield food-insecure
effects will be uneven. Middle-income countries with
countries and households from future shocks.
strong economic growth and a diversified export base
Unfortunately, inertia in the climate system means action
will be in a position to mitigate the transmission of world
to reduce greenhouse gas emissions today will be
price inflation back to domestic markets. However, many
unable to significantly mitigate climate change within the
low-income and lower middle-income countries are
timescales modeled here, but it will help prevent climate
poorly placed to absorb the impact of higher food import
change having even more devastating impacts further in
prices.
the future. In the face of unavoidable climate change over
Once again, sub-Saharan Africa faces some of the the coming decades, decisive action by rich countries to
gravest threats. Higher prices will translate into support climate change adaptation in the developing
depressed demand for food in a region that already has world is an urgent priority and will considerably
the world’s lowest calorific intake. In a world without ameliorate the level of food price inflation (see Figure 14),
climate change, sub-Saharan Africa would still face preventing millions of additional cases of malnutrition.
problems in combating the hunger epidemic. Under a
simple baseline scenario, child malnutrition levels would
increase by around 8 million to 2030 and by 2050 would
revert to the same level as at the turn of the twenty-first
century—around 30 million. Adding in the effects of
climate change would increase child malnutrition by just
under one million (compared with no climate change) in
2030 (see Figure 13).63 Growing a Better Future 27
Chapter 2: The age of crisis:
a skewed and failing system28
Meeting the sustainable production Recent research commissioned by Oxfam simulating the
evolution of the costs, income, and profits of agroforestry
challenge systems in Bolivia demonstrates this.66 These techniques
Increasing production by 70 percent within 40 years is a achieved the objectives of forest conservation and
massive challenge, but entirely possible. The key is for climate change mitigation, presenting an alternative to
rich-country governments to resist their agricultural the expansion of the agricultural frontier by soy and cattle
lobbies and remove the trade-distorting support farmers through deforestation. Moreover, the income of
measures that stifle investment where the real potential an average household involved in agroforestry is around
for increasing yields lies: the small farms of the five times larger than for any of their immediate
developing world. Such a shift would free up huge alternatives (such as agriculture, small livestock farming,
budgetary resources, some of which could be redirected or chestnut collection).
towards ODA for agriculture—kick-starting the rural
National governments can do much more to manage
renaissance needed.
their scarce resources.
Food availability can also be increased massively by
Pricing water for industry and commercial agriculture will
addressing waste—estimated at between 30 and 50
force businesses and large farms to improve their
percent of all food grown.64 In rich countries, where
efficiency. Removing subsidies that inadvertently
around a quarter of the food purchased by households
encourage profligate water use—such as many provided
may be wasted,65 consumers and businesses must
to electricity generators—is also essential. Governments
change their behaviors and practices. In developing
can invest in water management—a very attractive
countries, where waste occurs post-harvest due to poor
proposition, as estimates suggest that for every dollar
storage and transport infrastructure, governments must
spent, a country can expect eight dollars back in averted
increase investment.
costs and increases in productivity.67 And they can
Pressures on land and water can be reduced through regulate investments in land to deliver wider social and
new practices and techniques that boost yields, use soils environmental objectives: the respect of land rights and
and water more sensitively, and reduce their reliance on the protection of forests and biodiversity.
inputs—techniques such as drip-feed irrigation, water
harvesting, low- or zero-till agriculture, agroforestry,
intercropping, and the use of organic manures. These
would also significantly reduce the carbon footprint of
agriculture.
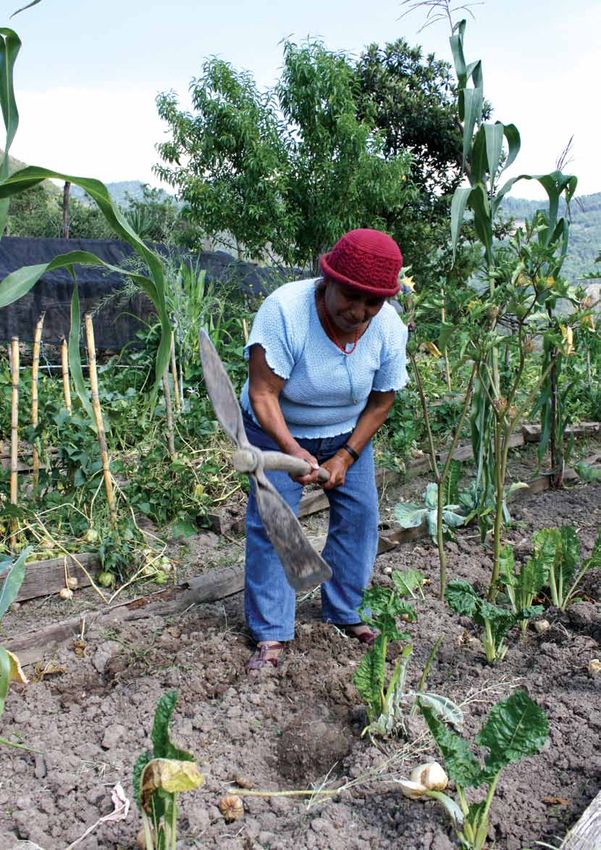
Opposite: Noograi Snagsri now spends less
time working in her fields thanks to the new
integrated farming system where water is
piped directly into the fields. In 2007 farmers
in Yasothorn Province, north-east Thailand,
experienced the longest dry spell in decades.
(Thailand, 2010)
Right: Harvested palm fruit, the raw material
for palm oil, used to produce various food
stuffs, soap and biofuel.
Growing a Better Future 29
Chapter 2: The age of crisis:
a skewed and failing systemYou can also read