Globalising Hunger (CAP) - Food Security and the EU's Common Agricultural Policy Author: Thomas Frit
←
→
Page content transcription
If your browser does not render page correctly, please read the page content below
Globalising Hunger
     Food Security and the EU’s
     Common Agricultural Policy
               (CAP)

         Author: Thomas Fritz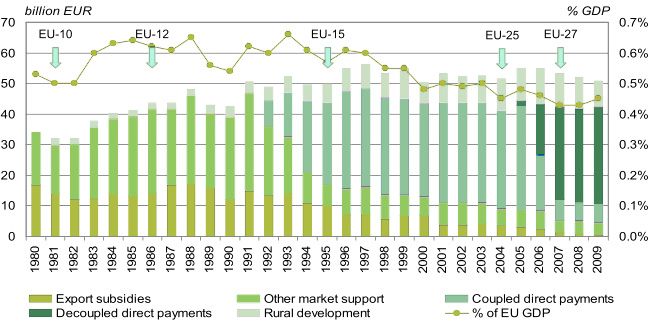
DRAFT 1

Globalising Hunger:
Food Security and the EU’s Common Agricultural Policy (CAP)
Author: Thomas Fritz

1 This is still a draft version. On October 12 the Commission’s legislative proposals for the new CAP will be presented. The final
version of this study will integrate these proposals in order to be useful into the next year when the EP and the Council have their
discussions on the CAP.

Contents

1 INTRODUCTION 4                                       4.3 Opening the flood gates: EU milk exports 48
                                                           Swamping African markets 53
2 GOING GLOBAL:                                            Milk powder in Cameroon 56
  EUROPEAN AGRI-FOOD INDUSTRY 7                            Free trade and the fight against import surges 60

                                                       4.4 Europe plucks Africa: EU poultry exports 65
3 CAP: WINNERS AND LOSERS IN EUROPE 13                     Risking public health 70
                                                           Import restrictions and loopholes 71
 3.1 A never-ending story: CAP reforms 15
                                                       4.5 Feeding factory farms: EU soy imports 74
 3.2 The decoupling fraud 21
                                                           The EU as a land grabber 81
 3.3 Unequal distribution of funds 24                      A toxic production model 85

 3.4 The losers: Small farms 30                        5 RECOMMENDATIONS 88

4 CAP IMPACTS IN THE GLOBAL SOUTH 32

 4.1 Import dependency and food deficit 32

 4.2 Colonising food: EU cereal exports 37
     Changing eating habits: Wheat flour in Kenya 40
     Cereal price shock in West Africa 43
     EPAs: Securing export markets 46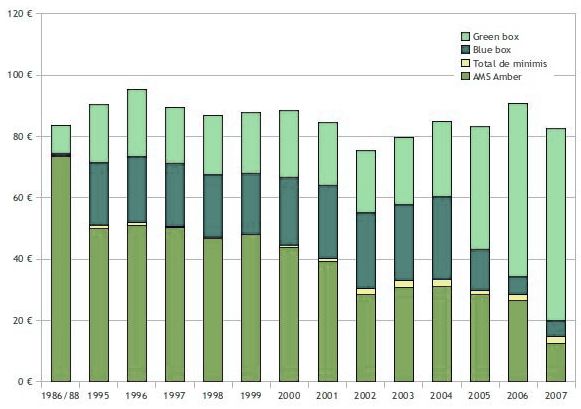
Globalising Hunger: Food Security and the EU’s Common Agricultural Policy (CAP)

                                                                               erous CAP subsidies awarded to European farmers and food
    1 Introduction                                                             processors. At the same time, the EU’s free trade agreements
                                                                               (FTAs) force developing countries to open up their markets for
    After several rounds of reforms, the EU’s Common Agricultural              European surplus production which has been stimulated by
    Policy (CAP) is once again facing a comprehensive overhaul.                generous CAP support. But local farmers and processors in the
    By 2013, the current CAP comes to end and the debate has                   Global South who cannot compete with subsidised European
    started on its future after 2013. The discussion on the €57                goods face the risk of being displaced by unfair competition.
    billion spent on the CAP today –amounting to 40 percent of the             The EU is also a large importer of farm products, particularly
    EU budget – takes places against the background of a dramatic              animal feed like soybeans, thus occupying millions of hectares
    worsening of the global food crisis together with rising and               of farmland abroad which cannot be used for local food pro-
    more volatile food prices.2 For 2010, the number of people                 duction anymore. Therefore, any changes of the EU’s demand
    with hunger is estimated at 925 million, up from 833 million               and supply have strong impacts on agriculture and food secu-
    in 2000-2002.3 But although the Common Agricultural Policy                 rity in the world.
    strongly influences the state of poverty and food insecurity in
    the world, its external dimension is barely taken into account in          In November 2010, the Commission presented a communica-
    the current debate.                                                        tion outlining options for the future CAP and its contribution
                                                                               to achieve food security. However, despite some welcome
    The European Union is a leading world power in agricultural                changes – particularly a fairer distribution of subsidies – it is
    trade: It is the largest exporter of processed food, the second            still based on productivity and global competitiveness of the
    largest exporter of dairy and pork and the third largest exporter          European agri-food industry. According to the Commission, the
    of poultry and wheat. Many of these products benefit from gen-             EU should contribute to meeting “growing world food demand,
                                                                               expected by FAO to increase by 70 percent by 2050”.4
    2 FAO et al., ‘Price Volatility in Food and Agricultural Markets: Policy
    Responses’, Policy Report, 2 June 2011.                                    4 European Commission, ‘The CAP towards 2020: Meeting the food, natural
    3 FAO, The State of Food Insecurity in the World 2010: Adressing food      resources and territorial challenges of the future’, Communication from the
    insecurity in protracted crises, Rome 2010.                                Commission to the European Parliament, the Council, the European Economic
4
Globalising Hunger: Food Security and the EU’s Common Agricultural Policy (CAP)

The growth in demand could offer “an opportunity for EU food                      small farmers is precisely the risk associated with ongoing
exporters”, but exploiting it would require “to enhance the                       dumping of EU food products on world markets and the grow-
competitiveness and productivity of the EU agricultural sector”.                  ing imports of particularly feedstuffs for the European livestock
In the Commission’s vision, agriculture has to serve the needs                    industry.
of the export-oriented food business: “A strong agricultural
sector is vital for the highly competitive food industry to remain                By fostering competitiveness and exports of European agribusi-
an important part of EU economy and trade.”5 In this vision,                      ness, the EU ignores the main challenge for food insecure
the main role of agriculture is to supply cheap raw materials to                  countries today: the reduction of their import dependency.
enable the food industry’s export success.                                        Since the 1980s, the majority of developing countries switched
                                                                                  from net exporters to net importers of food. Nowadays, two
The UN Special Rapporteur on the Right to Food, Olivier De                        thirds of them suffer from food trade deficits and growing ex-
Schutter, criticises the EU’s focus on productivity and trade,                    penses for purchases of cereals, dairy products and vegetable
since food availability as such does not guarantee its adequate                   oils on the world market. In order to reduce their vulnerability
distribution: “The question of global food security cannot be                     against price spikes and recurrent food crises, these countries
reduced simply to a problem of supply or production.” If food                     urgently need a policy shift that fosters domestic agricultural
production would rise in tandem with further marginalisation                      production and limits import dependency. Given Europe’s inter-
of small-scale farmers in the South, “the battle against hunger                   national responsibility in the fight against hunger, the EU should
and malnutrition will be lost”.6 Yet, further marginalisation of                  make every effort to support such a shift. But unfortunately, the
                                                                                  CAP in its present form heads in the opposite direction. It deep-
and Social Committee and the Committee of the Regions, Brussels, 18.11.2010,      ens import dependency in the South to secure export markets
COM(2010) 672 final, p. 2.                                                        for the European food industry.
5   Ibid, p. 4..
6 Olivier De Schutter, ‘The Common Agricultural Policy towards 2020: The          Past reforms of the Common Agricultural Policy largely ne-
role of the European Union in supporting the realisation of the right to food’,
                                                                                  glected its contribution to poverty and malnutrition. Although
Comments and Recommendations by the United Nations Special Rapporteur on
the right to food, 17 June 2011, p. 1.                                            European policy makers adapted the CAP to changes of the
                                                                                                                                                       5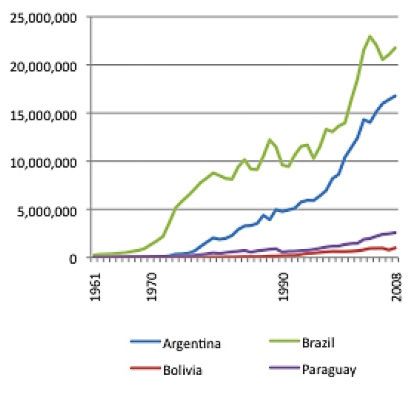
Globalising Hunger: Food Security and the EU’s Common Agricultural Policy (CAP)

    international political landscape, they never seriously tried to
    assure its coherence with stated development objectives like
    the eradication of poverty and hunger. For the EU to fulfill its
    global responsibilities, a far more profound reform of the CAP
    would be required.

    The present publication aims to contribute to such a reform.
    It describes the history of the Common Agricultural Policy, its
    several reforms, its main beneficiaries, its impacts on agri-
    culture, poverty and food security in the Global South as well
    as the linkages between the CAP and European trade policy.
    It analyses the impacts of the scramble for the cheapest raw
    materials, the exports of cereals, dairy and poultry products as
    well as the effects of the growing demand for feedstuffs, by far
    the most important agricultural commodity imported into the
    European Union. The final recommendations outline some of
    the necessary changes the EU would have to implement so that
    the CAP could effectively contribute to the eradication of pov-
    erty and hunger and the realisation of global food sovereignty.

6
Globalising Hunger: Food Security and the EU’s Common Agricultural Policy (CAP)

2 Going global:                                                                 Union, mainly supplied by Argentina and Brazil (for soya
                                                                                meal) and Brazil and the US (for soya beans). In 2010, the EU
European agri-food                                                              imported soybean meal worth €6.4 billion and soybeans valued
industry                                                                        at €4.5 billion. Other important items include coffee, bananas,
                                                                                cocoa beans and palm oil, all of which tropical products
                                                                                provided almost exclusively by developing countries. On the
The European Union is the leading agricultural player in inter-                 other hand, the EU exports mainly processed foods like bever-
national trade. Together with the US, the bloc of 27 EU Member                  ages, essential oils and food preparations as well as important
States is the main food and agricultural exporter in the world.                 amounts of wheat, meat and dairy products.8
In 2010, its agricultural exports reached the record level of €91
billion, thanks to a spectacular growth of 21 percent compared                  Hailing the strong export growth of the past six years, the
to the crisis year 2009. Its global market share accounted for                  European Commission reports that the “resulting improvement
17 percent, approximately the same as the share of the US. The                  in the EU’s trade balance turned it into a net exporter in 2010,
EU is also by far the biggest agricultural importer in the world.               for the first time since 2006, with a €6 billion agricultural trade
Agricultural commodities worth €83 billion entered the EU                       surplus”.9 But despite the recent export success, the European
market in 2010, far ahead of the US with €65 billion. The EU’s                  agro-food industry lost part of its share of the global export
share of global imports was 19 percent (see charts 1 and 2).                    market. According to industry figures, the EU’s share of the
More than 70 percent of EU agricultural imports, worth about                    global food and drink export market has been shrinking from
€60 billion, originate in developing countries.7                                24.6 percent in 1998 to 17.5 percent in 2008. It’s main competi-
                                                                                tor, the US, experienced a similar loss.10 This development is
Soya – beans as well as meal – constitutes the single most                      mainly due to the growing competition of emerging markets
important agricultural commodity imported into the European                     8   Ibid.
7 European Commission, ‘Global and EU agricultural exports rebound’, MAP        9   Ibid., p. 12.
– Monitoring Agri-trade Policy, Directorate-General for Agriculture and Rural   10 CIAA, ‘Data & trends of the European Food and Drink Industry 2009’,
Development, No. 01-11, May 2011.                                               Confédération des industries agro-alimentaire de l’UE, Brussels, March 2010.
                                                                                                                                                               7
Globalising Hunger: Food Security and the EU’s Common Agricultural Policy (CAP)

                    Chart 1 EU27, US & Brazil and China - Agricultural Exports         Chart 2 EU27, US, Japan, China & Russia - Agricultural Imports
    billion euros

                                                                        Sources: COMEXT & GTA

8
Globalising Hunger: Food Security and the EU’s Common Agricultural Policy (CAP)

like Brasil, China, Argentina, Thailand, Indonesia and Malaysia.           CELCAA14 and the umbrella of EU wholesalers and retailers
Brasil, in particular, managed to almost double its food exports           EuroCommerce.
in the last ten years and is today the third largest player in the
global agricultural export market.11                                       In 2009, the High Level Group released its report on the
                                                                           competitiveness of the European agro-food industry outlining
After several studies commissioned by the EU confirmed                     recommendations for the whole food supply chain. These rec-
the weakening competitiveness of the European agro-food                    ommendations reflect main orientations of EU agricultural, food
industry, the European Commission in 2008 established                      and trade policies. Having found that the “European agro-food
the ‘High Level Group on the Competitiveness of the Agro-                  industry is confronted with an overall decrease of its share in
Food Industry’ to advise on ways to reverse this trend. This               the world market”, the High Level Group offers several explana-
expert group, which was later transformed into the ‘High                   tions for this trend:15
Level Forum for a Better Functioning Food Supply Chain’,
consists mainly of representatives of large food corporations,                   · competition of Brazil, China and other emerging
agribusiness associations, the European Commission,                                markets,
the Member States and a few civil society organisations.                         · trade barriers on third country markets, such as
Its membership includes transnational corporations like                            tariffs and non-tariff measures,
Danone, Nestlé, Metro and Unilever and associations
                                                                                 · burdensome customs procedures,
such as the European umbrella of farmers organisations
COPA-COGECA12, the highly influential food processors                            · insufficient access to cheap raw materials.
confederation CIAA13, the liaison committee of food traders
                                                                           14 CELCAA: European Liaison Committee for the Agricultural and Agri-Food
                                                                           Trade.
11   WTO, International Trade Statistics 2010, Geneva, pp.51 and 56.
                                                                           15 High Level Group on the Competitiveness of the Agro-Food Industry,
12 ��������������
     COPA-COGECA: Comité des organisations professionnelles agricoles –    ‘Report on the Competitiveness of the European Agro-Food Industry’, European
Confédération générale de la coopération agricole.                         Commission, Enterprise and Industry Directorate General, 17 March 2009,
13 �������
     CIAA: Confédération des industries agro-alimentaire de l’UE.          HLG.007, p. 11.
                                                                                                                                                          9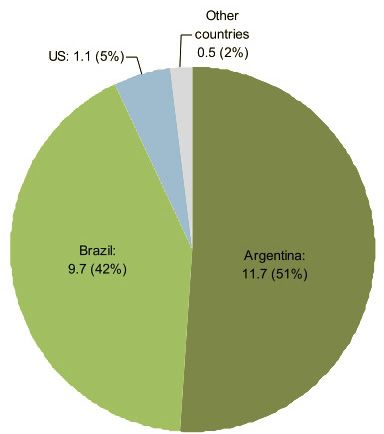
Globalising Hunger: Food Security and the EU’s Common Agricultural Policy (CAP)

     The report highlights access to cheap raw materials as a             future food demand in the EU.18 The High Level Group con-
     “key issue for the European agro-food industry”, since these         cludes that “the development of the European Agro-food com-
     represent a significant part of the production costs.16 Rising       panies becomes more and more dependent on the external
     and increasingly volatile commodity prices and burdensome EU         dimension and access to foreign markets both for exporting
     food safety regulations on genetically modified crops for food       and importing goods”.19
     and feed would pose a threat for the supply with agricultural
     commodities. The report claims that the EU food processing           Having conceived global expansion as almost indispensable,
     industry would find itself in a competitive disadvantage because     the report strongly advocates for further trade liberalisation and
     many of its competitors pay lower prices for these commodities       improved market access “by removing all unjustified obstacles
     than European companies. The High Level Group, therefore,            to trade.”20 Whilst the multilateral approach of reaching a com-
     calls for an EU policy framework that a) “facilitates the suf-       prehensive trade deal in the Doha Round of the World Trade
     ficient supply of competitively priced raw materials” and b)         Organisation WTO should continue to be pursued, the report
     simplifies authorisation procedures for animal feedstuffs and        views bilateral trade agreements as significant complements.
     genetically modified organisms (GMOs)17.                             It urges the conclusion of on-going bilateral trade negotiations
                                                                          between the EU and, inter alia, India, Ukraine, Andean, ASEAN
     One of the main problems for the European agro-food in-              and Central American countries as well as further talks with
     dustry is the maturity of the EU market and the decreasing           China, Russia, Mercosur and Mediterranean countries.
     growth of food demand due to low birth rates in EU member
     states. In the past, population growth in benchmark countries
     like the US, Australia, Brazil or Canada was three to four           18 European Commission, Competitiveness of the European Food Industry –
     times higher than in the European Union, indicating lower            An economic and legal assessment, Enterprise and Industry, 2007, pp. 26-27.
                                                                          19 High Level Group on the Competitiveness of the Agro-Food Industry,
                                                                          ‘Report on the Competitiveness of the European Agro-Food Industry’, European
                                                                          Commission, Enterprise and Industry Directorate General, 17 March 2009,
     16 ��������������
          Ibid., p. 12.                                                   HLG.007, p. 65.
     17 ��������������
          Ibid., p. 23.                                                   20   Ibid.
10
Globalising Hunger: Food Security and the EU’s Common Agricultural Policy (CAP)
All parts of the EU food chain undergo processes of structural internationalisation strategies and transformed themselves
adjustment, consolidation and concentration. The bargaining into global players not only penetrating industrial country
power is particularly high in the intermediate and downstream markets but also emerging and developing country markets.
segments of the food chain where processors and retailers Today, large European processors such as Nestlé, Unilever,
define product requirements for agricultural primary produc- Danone, Associated British Foods, FrieslandCampina, Lactalis
ers. In recent years, sector experts observed “a shift of buyer or Vion rank among the world’s top food and drink companies
power towards the retail end of the supply chain and away (see table 1).23
from the traditionally dominant processors”.21 Due to trade
liberalisation, mergers, acquisitions and global sourcing strat- Due to the concentration process on their domestic markets,
egies, retailers, particularly supermarket chains, managed to European retailers, particularly large supermarket chains,
reinforce their power, while farmers and smaller food proces- are also succesfully conquering global markets (see table 2).
sors struggled to survive by lowering their prices or offering Europe’s largest and the world’s second largest retailer, French
better terms. Carrefour, currently has over 15,600 stores around the globe,
either company-operated or as franchises. The group employs
The EU food processing industry comprises of many differ- 475,000 people and 57 percent of its turnover derives from
ent sub-sectors including meat, beverages, dairy products, outside France. It is present in 34 countries, including, inter
grain mill products, animal feeds, fruits and vegetables. It is alia, China, Indonesia, Malaysia, Thailand, Argentina, Brazil, Co-
the single largest manufacturing sector in the EU in terms of lombia, Egypt, Morocco and Tunisia.24 Similarly, Europe’s num-
turnover and employment, ahead of the automobile, chemicals ber two retailer, the Metro Group, pursues its expansion outside
and machinery industries. In 2008, it employed a workforce Europe through the establishment of Cash & Carry markets in,
of 4.4 million people.22 Many of the food processors pursued inter alia, China, India, Pakistan, Vietnam and Egypt.25
21 Liz Dodd/Samuel Asfaha, ‘Rebalancing the supply chain: buyer power,
commodities and competition policy’, South Centre/Traidcraft, April 2008, p. 9. 23 Ibid.
22 CIAA, ‘Data & trends of the European Food and Drink Industry 2009’, 24 See: www.carrefour.com
Confédération des industries agro-alimentaire de l’UE, Brussels, March 2010. 25 See: www.metrogroup.de
11Globalising Hunger: Food Security and the EU’s Common Agricultural Policy (CAP)
Table 1 Top European agri-food companies 2009-2010 Table 2 Top European Food Retailers 2010
Headquarters Sales (€ billions) Headquarters Sales (US$ billions)
Nestlé Switzerland 25.1 Carrefour France 119.5
Unilever Netherlands/UK 12.0 Metro Group Germany 91.1
Heineken Netherlands 11.0 Tesco United Kingdom 88.8
Groupe Danone France 9.4 Schwarz Group Germany 80.6
Vion Netherlands 8.2 REWE Germany 70.8
Associated British UK 7.9 Aldi Germany 68.7
Food
Edeka Germany 58.5
Carlsberg Denmark 7.3
Auchan France 55.2
Ferrero Italy 6.3
Ahold The Netherlands 38.8
Danish Crown Denmark 6.1
Casino Group France 37.2
Südzucker Germany 5.7
J. Sainsbury United Kingdom 30.1
FrieslandCampina Netherlands 5.7
Leclerc France 29.4
Oetker Group Germany 5.1
Delhaize Group Belgium 27.7
Anheuser-Busch Belgium 4.6
Intermarché France 25.0
InBev
Adapted from: PlanetRetail/Supermarket News 201026
Tate & Lyle UK 4.0
26
26 See: http://supermarketnews.com/profiles/top25-2010/top-25/
12Globalising Hunger: Food Security and the EU’s Common Agricultural Policy (CAP)
3 CAP: Winners and losers In the EU-27 of 2007, agriculture contributes merely 2 percent
to overall GDP and 6.2 percent to total employment.28
in Europe
The main issues for the architects of the Common Agricultural
Policy (CAP) in the late 1950s were the security of food sup-
From the first days of European integration, agriculture formed
plies and the stabilisation of farm incomes, which were lagging
an essential part of the political project leading to the European
far behind incomes in other sectors of the economy. Accord-
Union with its current 27 member states. In 1957, the Treaty of
ingly, article 39 of the EEC Treaty laid down the following
Rome establishing the European Economic Community (EEC)
objectives of the CAP:
not only gave birth to the Common Market, i.e., a customs union
progressively dismantling tariffs on goods amongst the six (a) to increase agricultural productivity by promoting
founding members, but also to the Common Agricultural Policy. technical progress and by ensuring the rational
At that time, Western Europe struggled to overcome a shortage development of agricultural production and the
of food supplies as a result of the devastations of the Second optimum utilisation of the factors of production, in
World War. The EEC, particularly Germany, depended strongly particular labour;
on food imports, and agricultural primary production still played
an important role in the economy of its founding members (b) thus to ensure a fair standard of living for the
(Belgium, Luxemburg, Netherlands, Germany, France and Italy). agricultural community in particular by increasing the
In 1955, agriculture’s share of GDP was 11.5 percent and its individual earnings of persons engaged in agriculture;
share of total employment 21.2 percent, on average, in the six (c) to stabilise markets;
EEC founding countries.27 Due to structural change, these per-
centages decreased considerably during the following decades. (d) to ensure the availability of supplies;
27 Henrik Zobbe, ‘The Economic and Historical Foundation of the Common 28 Pavel Ciaian/D’Artis Kancs/Johan F.M. Swinnen, ‘EU Land Markets and
Agricultural Policy in Europe’, The Royal Veterinary and Agricultural University, the Common Agricultural Policy’, Centre for European Policy Studies, Brussels
Unit of Economics Working Paper 2001/12, Fredriksberg 2001. 2010.
13Globalising Hunger: Food Security and the EU’s Common Agricultural Policy (CAP)
(e) to ensure that supplies reach consumers at Surpluses taken off the market had to be stored or were
reasonable prices.29 exported to third countries. CAP funds not only covered stor-
age costs but also export subsidies compensating exporters
These objectives remained unchanged over the years and were who sold their products on world markets where prices were
finally integrated into the Lisbon Treaty of December 2009.30 far lower than on the internal market. In addition, to protect
EEC farmers from international competition, the Community
In 1962, EEC members agreed that the CAP should be organ- established a system of variable import levies complementing
ised around three principles: 1) free intra-community trade external tariffs and ensuring that agricultural goods entering
for agricultural products, 2) a Community preference for EEC the internal market had at least the same price as competing
suppliers over third country suppliers and 3) common financing domestic products.31
of all CAP expenditures. In the following years, a tariff union
was created to allow free trade of agricultural products among Regarding its aim of stimulating domestic production, the CAP
its members. An intervention system covering most processed system was quite successful in the first years after its incep-
agricultural goods stimulated production, and a minimum price, tion. Shielded from international competition and nurtured by
set well above the world market price, was fixed each year for high guarantee prices, farmers modernised their holdings and
the most important product groups. In case the internal price considerably raised productivity. They strongly mechanised
for a given good fell below the intervention price, the state agricultural production and increased the use of agrochemical
intervened and bought surplus quantities from food proces- inputs such as fertilisers and pesticides. Yet, by the 1970s, the
sors like grain mills or dairies, thereby increasing demand and food trade deficit was overcome and output increased stronger
stabilising prices. than demand leading to growing surpluses in several product
groups like dairy, sugar, meat and grains. At the same time, the
29 http://www.ena.lu/treaty_establishing_european_economic_community_
rome_25_march_1957-2-10730 31 Pavlos Pezaros, ‘Introduction to the Common Agricultural Policy:
30 http://www.lisbon-treaty.org/wcm/the-lisbon-treaty/treaty-on-the- Principles, Objectives and Orientations’, in: Baourakis G. (ed.), The Common
functioning-of-the-european-union-and-comments/part-3-union-policies-and- Agricultural Policy of the European Union: New market trends, CIHEAM-IAMC,
internal-actions/title-iii-agriculture-and-fisheries/181-article-39.html Chania 1998 (Cahiers Options Méditerranéennes, No. 29).
14Globalising Hunger: Food Security and the EU’s Common Agricultural Policy (CAP)
European Community began to develop from a net importer to social impact of the Common Agricultural Policy: “Our policy
a net exporter of food. During the 1980s, criticism of the CAP has not prevented large numbers of farmers leaving the land.
multiplied as overproduction led to the accumulation of the Furthermore, 80% of resources go to 20% of farmers because
infamous “milk lakes” and “butter mountains”, with some of the of the system’s linkage of price support to food volume.”34
surpluses exported at subsidised prices and others destroyed.32
In addition, the CAP came under growing pressure during the
protracted negotiations of the Uruguay Round of the GATT
3.1 A never-ending story: CAP reforms (1986-1994) culminating in the establishment of the World
Trade Organisation WTO. Trading partners claimed that subsi-
The rising costs for stockholding and export subsidies triggered dised EU exports dumped on global markets depressed prices
a first serious of reforms in the 1980s aimed at redressing and incomes of farmers worldwide. In a bid to defend its share
the deficits of the system. Quotas restricting the production of of agricultural markets, the US reintroduced export subsidies,
milk and sugar, a limit on overall CAP spending and set-aside thus depressing world market prices even more. As a result,
payments for farmers leaving part of their land out of produc- shortly before the Uruguay Round, 14 nations, including Aus-
tion were introduced. However, these measures proved to be tralia, Canada, New Zealand, Argentina, Brazil and Thailand,
of only limited success. Stocks of surplus produce continued formed the Cairns Group of agricultural exporters to pressure
to accumulate, and so did the budgetary expenses for the the Europeans and the US into lowering their domestic farm
CAP. In 1991, referring to the growing food surpluses, then support and particularly their export subsidies.35
Commissioner for Agriculture Ray MacSharry, stated that “the
continuation of such a policy is not sustainable physically or The Development and Future of the Common Agricultural Policy – Proposals of
from the point of view of the budget. The status quo cannot be the Commission, Green Europe, 2/91, Brussels 1991.
defended nor maintained.”33 Mac Sharry also referred to the 34 ������
Ibid.
35 Klaus Kogler, ‘Single Farm Payments in the European Union and its
32 ����������������
Brian Gardner, European Agriculture – Policies, production and trade, Implications on New Zealand Dairy and Beef Trade’, AERU Research Report
London/New York 1996. No. 290, December 2009. See also Cairns Group website: http://cairnsgroup.
33 Ray MacSharry, ‘Foreword’, in: Commission of the European Communities, org/Pages/wto_negotiations.aspx
15Globalising Hunger: Food Security and the EU’s Common Agricultural Policy (CAP)
1992: The MacSharry reform solve the overproduction problem. Domestic prices remained
Against this background of mounting criticism, Commissioner above world market prices and surpluses continued to place a
MacShary launched the first major CAP reform in 1992 aiming burden on the EU budget. Thus, further reforms were inevita-
at bringing the high domestic farm prices closer in line with ble. The Agenda 2000, agreed in 1999, built on the MacSharry
the far lower world market prices. The MacSharry reform reform and focussed mainly on stabilising agricultural spend-
redirected the CAP’s main focus from price support to direct ing. Support prices for cereals, milk products and beef were
income aids. Guarantee prices for cereals, dairy products and further cut and compensation payments for affected farmers
meat were lowered, while farmers received direct payments increased. “Rural development” was established as the second
as a partly compensation for the lower farm gate prices. The pillar of the CAP complementing the first pillar covering market
compensation payments such as several specific premiums support measures (see table 3).
had been coupled to production. In the case of cereal farmers,
direct payments for price cuts were based on hectares under By integrating rural development, EU policy makers facilitated
cultivation, whereas livestock farmers received premiums ac- a wide range of support measures such as the diversifica-
cording to heads of cattle they owned. To be eligible for these tion of rural economies, the protection of the environment
payments, farmers were obliged to compulsory set aside part and the improvement of rural living conditions. The Agenda
of their land and to restrict their livestock numbers.36 2010 strengthened agri-environmental measures allowing
EU Member States to make direct payments conditional on
compliance with environmental objectives, the so-called “cross-
1999: The Agenda 2000 compliance”. It also provided for the voluntary “modulation” of
Although the MacSharry reform introduced new orientations to direct payments, i.e., the option to link part of the payments
the CAP, it, nevertheless, remained a gradual reform unable to to criteria like employment generation or the prosperity of
the respective farm. Member States could thus reduce direct
36 Pavlos Pezaros, ‘Introduction to the Common Agricultural Policy:
payments in case farm holdings did not comply with certain
Principles, Objectives and Orientations’, in: Baourakis G. (ed.), The Common
Agricultural Policy of the European Union: New market trends, CIHEAM-IAMC, minimum employment requirements. Savings from modulation
Chania 1998 (Cahiers Options Méditerranéennes, No. 29).
16Globalising Hunger: Food Security and the EU’s Common Agricultural Policy (CAP)
could then be shifted to Pillar Two, in order to finance rural direct payments. From January 2005, farmers were allocated
development measures.37 payment entitlements based on the direct aids they received
during a reference period in the past. Instead of several pro-
duction based payments, they received a single farm payment
2003: The Fischler reform independently of the type or quantity they actually produced,
However, the impact of Agenda 2000 remained modest and thus loosening the link between subsidy and production.
already in 2003 the next CAP overhaul was being undertaken. However, the Mid-Term Review still allowed part of the direct
The 2003 CAP reform, also referred to as “Mid-Term Review” aids for the crop and livestock sectors to remain coupled to
or “Fischler” reform (named after former Commissioner for production.39
Agriculture Franz Fischler), had to accommodate the 2004 EU
enlargement by 10 Central and Eastern European countries, Furthermore, the 2003 Cap reform made cross-compliance
followed by the accession of Cyprus and Malta in 2007. The provisions compulsory. Recipients of single farm payments
accession treaties stipulated that farmers from the new Mem- were required to abide to Community standards relating to
ber States got immediate access to CAP market support and public, animal and plant health, animal welfare and the environ-
intervention mechanisms, whereas direct aids would be phased ment. The modulation mechanism, introduced on a voluntary
in over 10 years.38 basis by the Agenda 2000 reform, was made mandatory,
thereby allowing the reallocation of more Pillar One funds to
Yet, the main innovation of the 2003 reform was the alleged rural development measures of Pillar Two.40
“decoupling” of direct payments from production by introducing
the single payment scheme (SPS) replacing most of the former
39 S.H. Gay/B. Osterburg/D. Baldock/A. Zdanowicz, ‘Recent Evolution of
37 Pavlos Pezaros, ‘The Agenda 2000 CAP reform agreement in the light of the EU Common Agricultural Policy (CAP): state of play and environmental
the future EU enlargement’, European Institute of Public Administration (EIPA), potential’, FAL (Bundesforschungsanstalt für Landwirtschaft)/IEEP (Institute
Working Paper 99/W/02, August 1999. for European Environmental Policy), MEACAP WP6 D4b, March 2005.
38 OECD, ‘Analysis of the 2003 CAP Reform’, Organisation for Economic 40 OECD, ‘Analysis of the 2003 CAP Reform’, Organisation for Economic
Co-operation and Development, Paris 2004. Co-operation and Development, Paris 2004.
17Globalising Hunger: Food Security and the EU’s Common Agricultural Policy (CAP)
Table 3 CAP Pillars, Budget 2011
Financing Type of Payments Budget
(Billions)
Pillar One Financed by the European Agricultural Guarantee Direct Aids 39.7
Fund EAGF. Income support for farmers through the Single Payment Scheme
Interventions in Agricultural Markets 2.9
All Pillar One support is fully financed from EU
resources. Commodity price support through, e.g., export subsidies, purchas-
ing and storage of surpluses, quotas
Measures developed and administered at EU level.
Pillar Two Financed by the European Agricultural Fund for Rural Development 14.4
Rural Development EAFRD Axis 1: Improving the competitiveness of the agricultural and
forestry sector
All Pillar Two actions have to be co-financed
Axis 2: Improving the environment and the countryside
from national or regional funds.
Axis 3: The quality of life in rural areas and diversification of the
EAFRD complements national, regional and rural economy
local actions. Member States may choose from Axis 4: LEADER Programme. Implementation of local develop-
a broad menu of measures. ment strategies through public-private partnerships.
18Globalising Hunger: Food Security and the EU’s Common Agricultural Policy (CAP)
2008: The Health Check Finally, one of the most controversial decisions was the one
The latest reform step to date has been taken with the so- percent yearly increase of the milk quota until its phasing
called “Health Check” of 2008.41 The agreement reached out in April 2015. This decision led to the milk crisis of 2009
among EU agriculture ministers in November 2008 contains a with massive oversupplies, a decline of producer prices and
range of measures, some of which directly carrying forward a further increase of European dairy exports replacing local
the 2003 reform. Most of the remaining payments coupled to producers in third countries (see chapter 4).
production where “decoupled” and moved to the Single Pay-
ment Scheme, with the only exception of premia for suckler Summing up the main characteristics of the CAP reform pro-
cows, goats and sheep, where Member States may still main- cess over the last two decades, its core element – as the Eu-
tain coupled support. Modulation, i.e., shifting funds from Pil- ropean Commission states – was a “shift from product support
lar One (mainly direct aids) to Pillar Two (rural development), to producer support”. Before the 1992 MacSharry reform, more
has been further strengthened, while cross compliance rules than 90 percent of all CAP expenditure went to market support,
have been simplified. Regarding the market mechanisms, i.e., guaranteeing high commodity prices on the internal market
ministers agreed to phase out maize intervention, to abolish by intervention purchases and export subsidies. By 2009, this
intervention purchases of pig meat and to set barley and sor- figure had fallen to 10 percent of the CAP budget (see chart 3).
ghum intervention at zero. Yet, intervention buying of wheat, The amount of export subsidies, for instance, decreased from
butter and skim milk powder is still possible.42 €10 billion in 199143 to €650 million in 2009.44
While the MacSharry reform introduced the shift from price
41 IIEP, ‘Towards the CAP Health Check and the European Budget Review – support to direct payments coupled to production (based on
The Proposals, Options for Reform, and Issues Arising’, Institute for European
Environmental Policy, September 2007. 43 European Commission, ‘Facts and figures on EU trade in agricultural
42 See: http://ec.europa.eu/agriculture/healthcheck/index_en.htm. And: products: open to trade, open to developing countries’, Memo/02/296, Brussels,
Peter Timmerman, ‘The Health Check: further steps to adapt the Common 16 December 2002.
Agricultural Policy to new realities’, Egmont Institute, European Affairs Program, 44 European Commission, Agriculture in the European Union – Statistical and
Working Paper, 2009/01. Economic Information, Report 2010, March 2011, p. 136.
19Globalising Hunger: Food Security and the EU’s Common Agricultural Policy (CAP)
Chart 3 CAP budget 1980-2009
20Globalising Hunger: Food Security and the EU’s Common Agricultural Policy (CAP)
fixed areas or numbers of animals), the 2003 reform suppos- at most minimal trade-distorting effects’ and c) the blue box of
edly “decoupled” these payments from production by introduc- direct payments under ‘production-limiting programmes’ linked
ing the Single Payment Scheme. According to official estimates to fixed areas or livestock numbers. Both, the green and blue
for the period 2010-13, roughly 69 percent of the CAP budget box, have been exempt from reduction commitments under the
will be directed to direct payments, of which over 90 percent AoA. The blue box was an outcome of the Blair House Accord,
are now characterised as “decoupled”. Roughly 7 percent will a 1992 deal between the US and the EU to break the impasse
be spent on market support and 24 percent on rural develop- of the Uruguay Round negotiations. At that time, the EU relied
ment.45 heavily on production-limiting programmes which had been
introduced by the MacSharry reform. Integrating the blue box
into the Agreement on Agriculture allowed the EU to effectively
3.2 The decoupling fraud exclude some 40 percent of its CAP spending from WTO re-
duction commitments.46
However, the EU’s repeated claim that “decoupling” of its direct
payments provides support to farmers without distorting trade Since the 2003 CAP reform and the “decoupling” of direct
or affecting production has long been questioned, particularly in payments, the EU began to shift large parts of its subsidies
connection with the EU’s efforts to safeguard its farm policies from the blue box to the also unconstrained green box,
during the GATT Uruguay-Round and later in the WTO. which today contains the large majority of CAP spending no-
tified to the WTO by the European Union (see chart 4). Ac-
The WTO Agreement on Agriculture (AoA) divides domestic cording to its latest WTO notification of agricultural domestic
support for the farming sector into three categories: a) the support covering marketing year 2008/09, payments worth
so-called amber box of trade-distorting measures subject to €62.6 billion fall into the green box and €5.1 billion into
reduction commitments, b) the green box subsidies of ‘no, or the blue box, while €12.3 billion qualify as trade-distorting
45 European Commission, ‘The CAP in perspective: from market intervention 46 Jim Dixon, ‘Nature Conservation and Trade Distortion : Green Box and
to policy innovation’, Agricultural Policy Perspectives Briefs, Brief no 1 rev, Blue Box Farming Subsidies in Europe’, in: Golden Gate University Law Review,
January 2011. Volume 29, Issue 3, 1999, pp. 415-443.
21Globalising Hunger: Food Security and the EU’s Common Agricultural Policy (CAP)
Chart 4 EU domestic support 1986-07
Support (billion euros)
Year
Compiled by ICTSD from notifications
22Globalising Hunger: Food Security and the EU’s Common Agricultural Policy (CAP)
subsidies. Half of the green box payments – €31.3 billion – In addition, all the compensation payments for cuts in interven-
comprise of ‘Decoupled Income Support’ mainly under the tion prices of feedstuffs (cereals, oilseeds, pulses etc.) continue
Single Payment Scheme, followed by €7.5 billion spent on to serve as a huge input subsidy for European livestock farm-
‘Investment Aids’.47 ers. EU food processors also benefit from these compensation
payments because “the drop in the cost of their agricultural
Many experts contest the non-distorting character of large raw materials has increased their competitiveness”, as Jacques
parts of CAP payments now classified by the EU as trade- Berthelot of French NGO Solidarité points out.49 Thanks to
and production-neutral green box subsidies. They claim that cheaper domestic raw material supply, EU food processors
this “box shifting” exercise amounted to a mere repackaging managed to sell their products on world markets at lower
and repainting of export subsidies and trade-distorting prices, while at the same time reducing their export subsidy
amber box support. Allegedly “decoupled” direct aids would demand.
still have a trade-distorting and surplus-stimulating effect
because they increase farmers’ incomes and lower their The guaranteed revenue stream of direct payments also im-
market risks. They enable the maintenance of production proves the creditworthiness of farmers enabling them to un-
volumes although farmers’ revenues may not cover all of dertake productivity enhancing investments that may stimulate
the production costs. By helping to cover fixed costs, they overproduction. In addition, the EU and its Member States di-
allow farmers to produce at lower prices compared to non- rectly support farm modernisation by granting investment aids
subsidised competitors. These direct payments also permit under CAP’s Pillar Two (Rural Development), which amounted
the use of higher amounts of agricultural inputs increasing to €7.5 billion in marketing year 2008/09. Being classified as
not only farm productivity but also the turnover of the agro- trade- and production-neutral green box subsidies at the WTO,
chemical industry.48 these investment aids cover, inter alia: “Aid for farm moderni-
sation; purchase of machinery, equipment, animals, buildings
47 WTO, Committee on Agriculture, Notification, G/AG/N/EEC/68, 24
January 2011.
49 Jacques Berthelot, ‘Can the CAP manage without market regulation
48 Grey, Clark, Shih and Associates, ‘Green Box Mythology: The Decoupling after 2013? The CAP subsidies are incompatible with the WTO Agreement on
Fraud’, Study Prepared for Dairy Farmers of Canada, June 2006. agriculture’, Solidarité, 2010.
23Globalising Hunger: Food Security and the EU’s Common Agricultural Policy (CAP)
and plantations”.50 Contrary to their alleged non-distortive Consequently, the oversupply of several agricultural and food
character, data from farm surveys show that these payments items continues despite the string of CAP reforms. Although
actually increase productivity and production. the surpluses have generally fallen since the MacSharry
reform of 1992, there are still many sectors where production
In several EU countries large parts of investment aids have exceeds domestic demand. EU figures exhibit considerable net
been given to the livestock sector, thus directly contributing production surpluses for wheat, barley, pork, poultry, skim milk
to overproduction of dairy and meat products. In Germany, powder, butter and cheese, with skim milk powder production
e.g., data for 2005 showed that due to investment aids given exceeding domestic consumption more than 20 percent.52
to dairy farms the productivity increased by 40-73 percent, Therefore, the pressure for the European food industry to seek
the milk performance per cow by 6-10 percent, the number of global markets is set to continue.
cows by 7-47 percent and the milk output by 30-59 percent. In
other countries, too, farmers used investment aids to enhance
their productive capacities: 3.3 Unequal distribution of funds
· In Spain’s Basque Country, 70 percent of beneficiaries
The unequal distribution of CAP funds, i.e., the allocation of
stated they increased productive capacities thanks to
large sums to the biggest farms and food processors also
investment support.
leads to overproduction, as it facilitates the concentration into
· In Sweden, 70 percent of supported investments were larger farming units which realise higher outputs due to greater
used for farm rationalisation. economies of scale. According to OECD figures, in 2007, the 25
percent largest farms in the EU-27 were allocated 74 percent
· In Wales (UK), 91 percent of recipients reported en-
hanced capacity use.51 distorting’, TWN Info Service on Trade and WTO Issues (Aug 07/05), 24 August
2007.
50 WTO, Committee on Agriculture, Notification, G/AG/N/EEC/68, 24 52 European Commission, ‘The CAP in perspective: from market intervention
January 2011. to policy innovation’, Agricultural Policy Perspectives Briefs, Brief no 1 rev,
51 Marita Wiggerthale, ‘Surveys show EU’s Green Box subsidies are trade- January 2011, p. 5.
24Globalising Hunger: Food Security and the EU’s Common Agricultural Policy (CAP)
of total CAP support and the 25 percent smallest farms only 3 detriment of the majority of small family farms serving the local
percent.53 markets but struggling to survive.
These findings are also being confirmed when only considering The change of transparency rules in 2009 requiring Member
direct payments. In 2009, approximately 18 percent of mainly States to publish information on CAP beneficiaries shed some
larger farms in the EU-27 received 85 percent of direct pay- more light on the skewed distribution of EU farm payments.
ments.54 As table 4 shows, 43 percent of the 7.8 million ben- Those receiving the most funds not only comprise large factory
eficiaries (about 3.4 million) were allocated direct payments of farms but also many food processors. Big sugar companies are
less than €500 per holding in 2009. On the other hand, a privi- among the largest beneficiaries. In 2009, for instance, Tereos
leged minority of 0.39 percent of beneficiaries (roughly 31,000) (France) received €177 million, Saint Louis Sucre (France)
received more than €100,000 and 0.1 percent (about 8,000) €143 million, Azucarera Ebro (Spain) €119 million and Süd-
more than €200,000 per holding in the same year. About 1,410 zucker (Germany) €42 million. Big dairy companies, amongst
holdings range in the highest class having received more than them several cooperatives, were also allocated large sums,
€500,000 in 2009 (see table 4). The European Commission as, e.g., Nordmilch AG (Germany) with €51 million, Lactalis
itself admits that “the distribution of direct payments between (France) €22 million and Arla Foods (Denmark) €13 million.56
beneficiaries also mainly reflects the differences in farm size”.55
In other words, this unequal distribution favours large rational- Many of the same companies also enjoyed large payments in
isied, input-intensive and export-oriented factory farms, to the the following year. In 2010, Azucarera Ebro got €61 million,
53 Catherine Moreddu, ‘Distribution of Support and Income in Agriculture’,
Arla Foods €16 million, Nordmilch €8 million and Südzucker
OECD Food, Agriculture and Fisheries Working Papers No. 46, OECD 2011, €2,6 million. Large companies like Dutch dairy cooperative
Annex C. FrieslandCampina received subsidies for several of their
54 European Commission, ‘Indicative Figures of the Distribution of Farm Aid, subsidiaries not only in the Netherlands, but also in Spain and
By Size-Class of Aid’, Financial Year 2009, see: http://ec.europa.eu/agriculture/
Germany. Considering only amounts of more than €1 million,
funding/directaid/distribution_en.htm
55 European Commission, ‘Indicative Figures of the Distribution of Farm Aid, 56 Farmsubsidy.org, 2009 Millionaires, see: http://capreform.eu/2009-data-
By Size-Class of Aid’, Financial Year 2009, p. 7. harvest/
25Globalising Hunger: Food Security and the EU’s Common Agricultural Policy (CAP)
Table 4 Distribution of Direct Payments in the EU-27, 2009
Number of beneficiaries Relative share of number
Direct payments per holding (in thousands) of beneficiaries (in %)Globalising Hunger: Food Security and the EU’s Common Agricultural Policy (CAP)
FrieslandCampina subsidiaries were handed out eight individual and others.60 Food ingredient producer Tate & Lyle sells its
payments ranging from €1,2 million to €3,7 million in 2010 products to customers around the world and owns produc-
alone.57 The same is true for one of the largest food producers tion facilities and sales offices in, inter alia, Mexico, Colombia,
and grain traders in the world, US giant Cargill with yearly Argentina, Brazil, Morocco, South Africa, India, China, Vietnam,
revenues of some $120 billion. In 2008, Cargill received at least the Philippines and Indonesia.61 Nestlé, the food giant headquar-
€10.5 million, collecting CAP subsidies in eight EU countries.58 tered in Switzerland and employing some 280,000 people, has
an almost global presence.62
Taking account of several years of total CAP payments, includ-
ing direct aids, market support and rural development, the Besides large factory farms and food processors, profiteers
website “farmsubsidy.org” presents a list of all time top CAP of the CAP system also include export-oriented food traders
recipients (see table 5). and the big retailers such as supermarket chains. Processors,
traders and retailers all benefit of the cheap domestic raw
All of these CAP recipients are large export-oriented food material supply triggered by the cut and partial phasing out of
companies, several of which with a strong presence outside intervention prices combined with direct compensation pay-
Europe. Dairy company FrieslandCampina, e.g., has a global ments mainly favouring rationalised cereal and livestock farms.
presence with locations in, inter alia, Ghana, Nigeria, Saudi- The direct payments, now by far the most dominant part of
Arabia, China, Indonesia, Malaysia, Thailand, Vietnam and CAP support, act like a gigantic cross-subsidy for the export-
Argentina.59 The same is true for Danish dairy company Arla oriented food business effectively replacing the decreased
Foods with locations in Argentina, Brazil, Mexico, Dominican export refunds. This cross-subsidisation of the food industry
Republic, Lebanon, Saudi-Arabia, Bangladesh, China, Vietnam facilitates sales on international markets at dumping levels, i.e.,
at prices below production costs. Another important profiteer
57 Farmsubsidy.org, 2010 Millionaires, see: http://ftp.farmsubsidy.
talusdesign.co.uk/millionaires2010.xls
58 ��������������������������������������������������������������������
Doreen Carvajal, Stephen Castle, ‘European Subsidies Stray From the 60 http://www.arla.com/
Farm’, New York Times, 16 July 2009. 61 http://www.tateandlyle.com/
59 http://www.frieslandcampina.com/english/ 62 http://www.nestle.com
27Globalising Hunger: Food Security and the EU’s Common Agricultural Policy (CAP)
Table 5 Top CAP beneficiaries (payments up to 2009)
1 FrieslandCampina Netherlands €1,605,926,904 (since 1997)
2 Arla Foods Denmark €951,731,484 (since 2000)
3 Tate & Lyle UK €827,979,239 (since 1999)
4 Avebe Netherlands €589.534,206 (since 1997)
5 Danisco Denmark €484,863,255 (since 2000)
6 Hoogwegt Netherlands €356,925,537 (since 1997)
7 Danish Crown Denmark €292,629,690 (since 2000)
8 Eridania Sadam Italy €225,357,110 (since 2002)
9 Nestlé UK UK €196,777,997 (since 1999)
10 Saint Louis Sucre S.A. France €196,464,108 (since 2004)
Source: www.farmsubsidy.org
28Globalising Hunger: Food Security and the EU’s Common Agricultural Policy (CAP)
of this highly skewed support system is the agricultural input Scheme allows already large farms to further intensify produc-
industry, particularly the agrochemical industry, since the tion and to increase the use of agricultural inputs like chemical
steady income stream guaranteed by the Single Payment fertilizers and pesticides.
Box 1
The Queen is a farmer
CAP funds for the wealthy
‘Feed the rich!’ That seems to be the slogan of those collected €554,000 for his farm. The EU also transferred
showering CAP funds onto the wealthy, among them several €508,000 to Prince Albert II of Monaco, whose fortune is
land-owning aristocrats. For years, the Queen of England estimated at €2 billion. The Prince of this Mediterranean tax
belongs to the largest recipients of European farm subsidies. haven owns a wheat farm in the North of France.64 Germany’s
In 2008, she received €500,000 in CAP aids for private land largest private landowner and Europe’s largest forest owner,
around the Royal Residence of Sadringham. A Buckingham billiardaire Prince Albert of Thurn and Taxis, got €575,000
Palace spokesman said: “The Queen is a landowner and a in 2008 and more than €1 million in 2009 out of the CAP
farmer. She receives subsidy, just as any other farmer would budget.65
do.”63 In the same year, Prince Charles, heir to the throne,
received €200,000 for his landholdings. The third richest
person in the UK, the Duke of Westminster,
‘Queen Elizabeth received 500,000€ of EU subsidies in 2008’, Digital
63 ���������������������������������� 64 ���������������������������������������������������������������������
Doreen Carvajal, Stephen Castle, ‘European Subsidies Stray From the
Journal, 1 May 2009. Farm’, New York Times, 16 July 2009.
65 ����������������������������������������������������������������
Michael Kaczmarek, ‘EU-Agrargeld: Topverdiener, Intransparenz,
Korruption‘, Euractiv.de, 6 May 2010.
29Globalising Hunger: Food Security and the EU’s Common Agricultural Policy (CAP)
3.4 The losers: Small farms percent of all holdings), operating on only 8.4 percent of the
agricultural area of the EU.68
In the primary production sector the number of agricultural
holdings is gradually shrinking while their economic and The EU enlargements in 2004 and 2007 with the accession
physical size is increasing. Almost all EU member states expe- of 12 Central and Eastern European countries along with
rienced a steady decline in the number of agricultural holdings Malta and Cyprus increased the importance of small farms
between 1993 and 2005. Portugal, Belgium, the Netherlands, in the EU. Today, 59 percent of all EU agricultural holdings
Denmark, Spain and Italy, for instance, witnessed declines belong to the accession countries (EU-12). The average size
of 20 to 30 percent.66 According to the latest Eurostat farm of EU-12 farms does not exceede 6 hectares, while it is 22
structure survey, EU-27 farm numbers were shrinking from 15 hectares in the former EU-15 countries. The Eastern Euro-
million in 2003 to 13.7 million in 2007.67 pean farming sectors are therefore characterised by larger
numbers of agricultural holdings with comparatively low
In terms of economic size, in 2007 about 81 percent of all sizes, a lot of them subsistence farms. It is estimated “that
holdings – 11.1 million – are small farms marketing less some 70% of total farms in Bulgaria and 81% in Romania
than half of their production. Of these small holdings, 4.7 self-consume more than half of their production”.69 In seven
million are considered as semi-subsistence and 6.4 million of the 12 new member states most farms produce mainly for
as subsistence farms, with the latter producing primar- self-consumption.70
ily for their own consumption. In terms of physical size,
European holdings of less than 5 hectares are viewed as
small farms. According to this physical measure, there were 68 European Network for Rural Development, ‘Semi-subsistence farming in
Europe: Concepts and key issues’, Background Paper, April 2010.
approximately 9.6 million small farms in 2007 (around 70
69 Carmen Hubbard, Small Farms in the EU: How Small is Small?,
66 Eurostat, ‘Food: from farm to fork statistics’, 2008 edition, Eurostat Paper presented at the 111th EAAE-IAAE Seminar ‘Small Farms: Decline or
Pocketbooks. Persistence’, University of Kent, Canterbury, 26-27th June 2009.
67 Eurostat, ‘Agricultural Statistics: Main results – 2008-2009’, 2010 edition, 70 European Network for Rural Development, ‘Semi-subsistence farming in
Eurostat Pocketbooks. Europe: Concepts and key issues’, Background Paper, April 2010.
30You can also read