CRITICAL EVALUATION OF HUMAN HEALTH RISKS DUE TO HYDRAULIC FRACTURING IN NATURAL GAS AND PETROLEUM PRODUCTION - BAUA
←
→
Page content transcription
If your browser does not render page correctly, please read the page content below
Archives of Toxicology (2020) 94:967–1016
https://doi.org/10.1007/s00204-020-02758-7
REVIEW ARTICLE
Critical evaluation of human health risks due to hydraulic fracturing
in natural gas and petroleum production
Klaus‑Michael Wollin1 · G. Damm2 · H. Foth3 · A. Freyberger4 · T. Gebel5 · A. Mangerich6 · U. Gundert‑Remy7 ·
F. Partosch8 · C. Röhl9 · T. Schupp10 · Jan G. Hengstler11
Received: 6 February 2020 / Accepted: 26 March 2020 / Published online: 9 May 2020
© The Author(s) 2020
Abstract
The use of hydraulic fracturing (HF) to extract oil and natural gas has increased, along with intensive discussions on the
associated risks to human health. Three technical processes should be differentiated when evaluating human health risks,
namely (1) drilling of the borehole, (2) hydraulic stimulation, and (3) gas or oil production. During the drilling phase, emis-
sions such as NOx, NMVOCs (non-methane volatile organic compounds) as precursors for tropospheric ozone formation,
and SOx have been shown to be higher compared to the subsequent phases. In relation to hydraulic stimulation, the toxicity
of frac fluids is of relevance. More than 1100 compounds have been identified as components. A trend is to use fewer, less
hazardous and more biodegradable substances; however, the use of hydrocarbons, such as kerosene and diesel, is still allowed
in the USA. Methane in drinking water is of low toxicological relevance but may indicate inadequate integrity of the gas well.
There is a great concern regarding the contamination of ground- and surface water during the production phase. Water that
flows to the surface from oil and gas wells, so-called ‘produced water’, represents a mixture of flow-back, the injected frac
fluid returning to the surface, and the reservoir water present in natural oil and gas deposits. Among numerous hazardous
compounds, produced water may contain bromide, arsenic, strontium, mercury, barium, radioactive isotopes and organic
compounds, particularly benzene, toluene, ethylbenzene and xylenes (BTEX). The sewage outflow, even from specialized
treatment plants, may still contain critical concentrations of barium, strontium and arsenic. Evidence suggests that the qual-
ity of groundwater and surface water may be compromised by disposal of produced water. Particularly critical is the use of
produced water for watering of agricultural areas, where persistent compounds may accumulate. Air contamination can occur
as a result of several HF-associated activities. In addition to BTEX, 20 HF-associated air contaminants are group 1A or 1B
carcinogens according to the IARC. In the U.S., oil and gas production (including conventional production) represents the
second largest source of anthropogenic methane emissions. High-quality epidemiological studies are required, especially
in light of recent observations of an association between childhood leukemia and multiple myeloma in the neighborhood
of oil and gas production sites. In conclusion, (1) strong evidence supports the conclusion that frac fluids can lead to local
environmental contamination; (2) while changes in the chemical composition of soil, water and air are likely to occur, the
increased levels are still often below threshold values for safety; (3) point source pollution due to poor maintenance of wells
and pipelines can be monitored and remedied; (4) risk assessment should be based on both hazard and exposure evaluation;
(5) while the concentrations of frac fluid chemicals are low, some are known carcinogens; therefore, thorough, well-designed
studies are needed to assess the risk to human health with high certainty; (6) HF can represent a health risk via long-lasting
contamination of soil and water, when strict safety measures are not rigorously applied.
Keywords Hydraulic fracturing · Unconventional natural gas and oil production · Environmental pollution · Human health
risk assessment · Epidemiological studies
Introduction
* Klaus‑Michael Wollin
klaus‑michael.wollin@t‑online.de
Hydraulic fracturing (HF) is widely used to enhance oil
* Jan G. Hengstler
hengstler@ifado.de and gas extraction from source rock and low-permeability
shale (U.S. EPA 2016a). This technique is based on the
Extended author information available on the last page of the article
13
Vol.:(0123456789)968 Archives of Toxicology (2020) 94:967–1016 high-pressure injection of a mixture of water, propping agents In Germany, HF has been used to produce gas for more and frac fluids into a wellbore, with the intention to cause than 4 decades. In Lower Saxony, the German state with the small cracks in oil- or gas-containing deep-rock formations most extensive use of HF, 327 hydraulic stimulations and (Fig. 1). The cracks allow an improved flow of oil or gas from 148 drillings have been performed, most of which exploited their natural reservoirs to the drilling site. HF is required to tight gas at depths of at least 3000 m (BGR 2016). Com- exploit oil or gas (shale oil or shale gas) from bituminous pared to other European countries, Germany has the fourth shale, the so-called ‘non-conventional deposits’. In recent and fifth largest resources of shale gas and shale oil, respec- years, HF has become more economically viable because of tively. The technically recoverable shale gas resources range the development of advanced horizontal drilling techniques between 320 and 2030 billion m3 of natural gas at a depth of in combination with multistage HF, which creates extended 1000–5000 m. Including deposits between 500 and 1000 m fracture networks to enhance the contact area between the deep, the total recoverable lean-burn gas quantities have rock matrix and the wellbore (Vidic et al. 2013). The U.S. increased to between 380 and 2340 billion m3. Energy Information Administration (EIA) estimates that in The impact of HF on the environment is complex. With 2018, U.S. dry shale gas production was about 20.95 trillion respect to human health hazards, the contamination of cubic feet (Tcf) (593.24 × 10⁹ m3), and equal to about 69% groundwater and its use as drinking water has been in the of total U.S. dry natural gas production in 2018 (U.S. EIA center of attention. Moreover, other issues have been raised, 2019). The U.S. EIA’s “Annual Energy Outlook 2019” pre- such as the high demand for water and land, the impact on dicted an increase of natural gas production as a result of the biodiversity and landscape, contamination of air by emissions, continued development of tight and shale resources which induced seismic activity, and the greenhouse-gas balance. Due would account for nearly 90% of dry natural gas production to the rapid development of shale gas extraction, especially in by 2050 (U.S. EIA 2019). China’s shale gas production is the USA, and the public debate about environmental conse- predicted to grow from 0.7 billion cubic feet per day (Bcf/day) quences and human health hazards, possible adverse effects (19.82 × 10⁶ m3/day) in 2016 to 10 Bcf/day (283.17 × 10⁶ m3/ of HF on human health, environmental consequences and day) by 2030 and 19 Bcf/day (538.02 × 10⁶ m3/day) by 2040 the legal frameworks have been discussed (Ewen et al. 2012; (U.S. EIA 2017). China’s natural gas production from other Meiners et al. 2012a, b; SRU 2013; Dannwolf et al. 2014; sources, such as coalbed methane, tight formations and more Kersting et al. 2015; U.S. EPA 2016a). The multifaceted topic traditional natural gas reservoirs, is projected to increase more of HF remains up-to-date against the background of the strong modestly, from 12 Bcf/day (339.80 × 10⁶ m3/day) in 2016 to growth of use in the USA and China, the world’s two largest 20 Bcf/day (566.34 × 10⁶ m3/day) by 2040. economies. From a Public Health perspective, alone in the Fig. 1 Hydraulic fracturing: the overall process 13
Archives of Toxicology (2020) 94:967–1016 969
USA ~ 17 million residents live within one mile of an active required. By contrast, gel fluids are used in the formation
oil and/or gas well and are potentially exposed to pollution as with a higher permeability. Despite the higher water con-
a result of frac operations (U.S. EPA 2016a). sumption of slickwater fluids, they are more cost-effective,
The present review focusses on human health hazards of easier to produce and offer the possibility of water recycling.
HF. The technical procedures will be described only to an Alternative frac fluids consist of foamed materials or
extent that is necessary to understand toxicological risks for emulsions that are generated by the use of nitrogen, carbon
humans. Further aspects, such as energy supply security, influ- dioxide, hydrocarbons and methanol (Montgomery 2013;
ence on ecosystems, biodiversity, landscape, greenhouse gas Saba et al. 2012; Gupta and Hlidek 2009; Gupta and Valkó
balance, and socio-economic factors, will not be addressed. 2007). Moreover, acid-based frac fluids are used for HF in
carbonate formations without the addition of proppants. A
particular challenge for HF is in rock formations where the
The procedure of hydraulic fracturing injection of water reduces permeability. Here, non-water-
based fluids are used that consist of petroleum distillates
The six basic steps of HF have already been comprehen- and propane and, usually, further additives. The use of non-
sively described (e.g., Cheremisinoff and Davletshin 2015; water-based frac fluids has decreased in recent years due
Gandossi and von Estorff 2015; Smith and Montgomery to the improvement of safety and health considerations and
2015; Ahmed and Meehan 2016; U.S. EPA 2016a) and water-based techniques. Nevertheless, the use of hydrocar-
involve (1) the identification of possible production sites bons such as diesel or kerosene is still allowed according
(exploration); (2) site selection and construction of a drill- to the revised criteria of the U.S. EPA (2014). Therefore,
ing place; (3) drilling, casing and cementing; (4) hydraulic typical compound groups in frac fluids are gelling agents,
stimulation; (5) production; (6) dismantling of the drilling thickening agents, stabilizers of clay, biocides, solubilizers,
place and renaturation. Application of frac fluids requires the viscosity modifiers, surface tension reducers, buffers, and
following processes: (i) removing large volumes of ground- anti-foam agents (Stringfellow et al. 2014, 2017a; Elsner
or surface water for the production of frac fluids—between and Hoelzer 2016; U.S. EPA 2016a; King and Durham 2015;
3 and 50 million L of water are pumped into each individual Kahrilas et al. 2015). There are more than 1100 chemicals
well (Vengosh et al. 2014; McLaughlin et al. 2016); (2) pro- listed as potentially present in frac fluids (U.S. EPA 2011).
duction of frac fluid, i.e., proppants and frac fluid additives The Tyndall Centre Manchester (2011) provides an overview
are stored and mixed at the drilling site; (3) injection of of 260 additives, 750 chemicals and additional components
frac fluids into the borehole, (4) storage and processing of that have been used in 2500 different frac fluids between
the produced water; (5) disposal of the flow-back from the 2005 and 2009. Chemicals used for HF in the USA are listed
drilling site and produced water. in FracFocus (http://fracfocus.org), which is organized by
the US Groundwater Protection Council and the Interstate
Oil and Gas Compact Commission (IOGCC). The British
Function and composition of frac fluids Columbia Oil and Gas Commission provides an analog
platform (http://fracfocus.ca/en) in Canada. Indeed, com-
Frac fluids induce small cracks in the relevant rock targets pounds in frac fluids are increasingly made public (Interna-
and allow the transport of proppants into the cracks. Major tional Association of Oil and Gas Producers (IOGP) 2017;
components of frac fluids are the basic fluid, additives and FracFocus 3.0 2020; Cuadrilla 2017). Chemicals used in
proppants. Proppants mostly consist of unprocessed, speci- Germany are listed on the website of the ‘Bundesverband
fied quartz sand but high-strength ceramic, sintered bauxite Erdgas, Erdöl und Geoenergie e. V.’ (BVEG 2017). A com-
or zirconium oxide may also be used (Barati and Liang 2014; prehensive list of frac additives is also available in Meiners
U.S. EPA 2016a). The function of the frac fluid additives is et al. (2012a, b). An overview of frequently used frac fluid
to increase the viscosity of the fluid, and to reduce corrosion chemicals and their function in the fluid is given in Table 1.
of the bore and microbial growth. Frac fluids can be water A similar compilation has been published, comprising
or water/gel based. Water-based systems dominate in cur- 35 chemicals present in at least 10% of frac fluids (U. S.
rent HF, while alternatives constitute only ~ 2% (U.S. EPA EPA 2016a). Besides chemicals listed in Table 1, this com-
2015). Water-based frac fluids (slickwater fluids) contain pilation includes the following substances and compound
polymers to reduce friction and are used in reservoirs with groups: quartz, sodium chloride, mineral oil, naphthalene,
low permeability, such as clay. Slickwater frac fluids are cur- 2,2-dibromo-3-nitrilopropionamide, phenolic resins, hexa-
rently mostly used for the extraction of shale gas (Gandossi methylenetetramine, 1,2,4-trimethylbenzene, benzalkonium
and von Estorff 2015). They have a lower viscosity than gel chloride, 4-nonylphenol (branched, ethoxylated, polymer),
fluids and transport proppants less efficiently into the cracks; formic acid, sodium chlorite, tetrakis (hydroxymethyl),
therefore, larger volumes of water and higher pressure are phosphonium sulfate (2:1), polyethylene glycol, ammonium
13970 Archives of Toxicology (2020) 94:967–1016
Table 1 Frac fluid additives, their function in the fluid and corresponding chemicals (U.S. EPA 2016a, modified)
Additive Function Chemicals reported in 20% or more of disclosures in the EPA
FracFocus 1.0 project database for given additive (U.S. EPA
2015)a
(Inorganic) Acid Dissolves cement, minerals, and clays to reduce clogging of Hydrochloric acid
the pore space
Biocide Controls or eliminates bacterial growth, which can be Glutaraldehyde; 2,2-dibromo-3-nitrilopropionamide
present in the base fluid and may have detrimental effects
on the long-term well productivity
Breaker Reduces the designed increase in viscosity of specialized Peroxydisulfuric acid diammonium salt
treatment fluids such as gels and foams after the proppant
has been placed and flow-back commences to clean up
the well
Clay control Prevents the swelling and migration of formation clays that Choline chloride
otherwise react to water-based fluids
Corrosion inhibitor Protects the iron and steel components in the wellbore and Methanol; propargyl alcohol; isopropanol
treating equipment from corrosive fluids
Crosslinker Increases the viscosity of base gel fluids by connecting Ethylene glycol; potassium hydroxide; sodium hydroxide
polymer molecules
Emulsifier Facilitates the dispersion of one immiscible fluid into Polyoxyethylene(10)nonylphenyl ether; methanol; nonyl
another by reducing the interfacial tension between the phenol ethoxylate
two liquids to achieve stability
Foaming agent Generates and stabilizes foam fracturing fluids 2-Butoxyethanol; nitrogen, liquid; isopropanol; methanol;
ethanol
Friction reducer Reduces the friction pressures experienced when pumping Hydrotreated light petroleum distillates
fluids through tools and tubulars in the wellbore
Gelling agent Increases fracturing fluid viscosity allowing the fluid to Guar gum; hydrotreated light petroleum distillates
carry more proppant into the fractures and to reduce fluid
loss to the reservoir
Iron control agent Controls the precipitation of iron compounds (e.g., F e2O3) Citric acid
from solution
Nonemulsifier Separates problematic emulsions generated within the Methanol; isopropanol; nonyl phenol ethoxylate
formation
pH control Regulates the pH of a solution by either inducing a change Carbonic acid, dipotassium salt; potassium hydroxide;
(pH adjuster) or stabilizing and resisting change (buffer) sodium hydroxide; acetic acid
to achieve desired qualities
Resin curing agents Lowers the curable resin-coated proppant activation tem- Methanol; nonyl phenol ethoxylate; isopropanol; alcohols,
perature when bottom hole temperatures are too low to C12–14-secondary, ethoxylated
thermally activate bonding
Scale inhibitor Controls or prevents scale deposition in the production Ethylene glycol; methanol
conduit or completion system
Solvent Controls the wettability of contact surfaces or prevents or Hydrochloric acid
breaks emulsions
a
This compilation considers 32,885 frac fluid recipes including 615,436 individual components
chloride and sodium persulfate. Methanol represents the general recipe of all frac fluids is not available. The com-
most frequently mentioned chemical, present in approxi- position of frac fluids is highly variable. Furthermore, the
mately 72% of all frac fluids. application of chemicals changes rapidly since companies
Some chemicals are added to frac fluids as tracers to are constantly optimizing the processes. A trend is to use
control the efficiency of injection into rock formations fewer and less hazardous chemicals (Gandossi and von
(U.S. EPA 2016a) and to detect possible contaminations Estorff 2015; Wang and Fan 2015; Kassner 2016; Halli-
of the environment (Kurose 2014). These tracers include burton 2017; Schlumberger 2017). The use of nanomateri-
thiocyanates, fluorobenzoic acids, alkyl esters, and radio- als in frac fluids is still at a more basic level of research
active tracers such as titrated water or methanol. Due to and development (Gottardo et al. 2016). While publica-
the multitude of applied chemicals and different require- tion of the components of frac fluids in registers such as
ments depending on the specific geological conditions, a
13Archives of Toxicology (2020) 94:967–1016 971
FracFocus 3.0 was previously performed on a voluntary water can be recycled to reduce the need for freshwater and
basis, it is a legally binding duty in Germany since 2016. chemicals (Leiming et al. 2016). Despite the advantages of
Chemical transformation processes of frac fluid compo- this method, according to data from ten states in the USA
nents are not well investigated and only scarce information (U.S. EPA 2016a), the fraction of recycled frac fluids by
is available. It is likely that certain chemicals, e.g., oxidants, reusing production water is only about 5%.
undergo chemical reactions in the subsurface considering the
high temperatures of 50–100 °C at depths of 1000–2500 m,
the high pressure and high salinity (Hoelzer et al. 2016). Toxicity of frac fluids
These chemical reaction products can be expected to appear
in flow-back and produced water; however, their identity has The public discussion on HF has focused predominantly
not yet been systematically studied. on the hazardous substances present in frac fluids. In the
EU, the classification of the applied chemicals is performed
according to European chemicals legislation (Gottardo
Consumption of water and frac fluids et al. 2013; COM 2014). The CLP Regulation (classifica-
tion, labeling and packaging of substances and mixtures)
Consumption of 8000–100,000 m3 water per unconventional (Regulation (EC) No. 272/2008) is the basis of classification
well have been reported for six shale gas plays in the period and labeling for the required technical dossiers; it comprises
between 2000 and 2011 (Vengosh et al. 2014). A representa- ten health hazard classes (Table 2) and 16 physio-chemical
tive study for major shale gas plays in Texas estimated the hazard classes, as well as a class for environmental hazards.
water consumption of 14,900 horizontal drilling operations Two questions are particularly relevant when consider-
in the Barnett shale, 390 in the Haynesville Formation and ing the hazard of chemicals used for HF: (a) What are the
1040 in the Eagle Ford Formation (Nicot and Scanlon 2012). hazard characteristics of the individual compounds? (b) Do
During the 2009-6/2011 period, median water use per hori- the applied frac fluid mixtures belong to the categories ‘haz-
zontal well was 10,600 m3, 21,500 m3, and 16,100 m3 in the ardous for human health’ or ‘hazardous to the environment’
three areas, respectively. In another study, by fitting a normal according to chemicals legislation? With respect to (a), frac
distribution to freshwater withdrawal volumes, an average fluids have been shown to contain hazardous compounds
water consumption was estimated to be 15,000 m3 per sin- according to the GHS/CLP. These regulations are binding
gle well in the Marcellus Shale Formation in Pennsylvania. concerning transport, storage and use of the chemicals.
Based on well completion reports submitted to the Penn- Several comprehensive reviews are available which provide
sylvania Department of Environmental Protection (PADEP) an overview of the classification of chemicals in frac fluids
in 2010, it is indicated that 3500–26,000 m3 is required to (Meiners et al. 2012a, b; Stringfellow et al. 2014; Elsner
hydraulically fracture a single well (Jiang et al. 2014). Using and Hoelzer 2016; Xu et al. 2019). Several compounds in
published scientific literature data from 2010 to 2014, water frac fluids, such as biocides, have been classified as hazard-
demand of 8000–19,000 m3 per well lifespan was estimated ous and are also used in consumer products. A well-known
for a Polish shale gas production site (Vandecasteele et al. example is the biocide Kathon CG (CAS RN 55965-84-9),
2015). Data from Germany range from 37 to 4040 m3 water/ a mixture of 5-chloro-2-methyl-2H-isothiazole-3-on (C(M)
frac and consumption of additives of 615–274,764 kg/frac IT) and 2-methyl-2H-isothiazole-3-on (MIT) at a ratio of
(Meiners et al. 2012a, b). On the basis of modeling future 3:1. C(M)IT/MIT (3:1) has been approved by Commission
HF operations in the USA in two scenarios of drilling rates, Implementing Regulation (EU) 2016/131 of 1 February
Kondash et al. (2018) projected cumulative water use and
flow-back/produced water volumes to increase by up to
50-fold in unconventional gas-producing regions and up to Table 2 Classification of health hazards (Regulation 1272/2008/EC,
Part 3 of Annex I)
20-fold in unconventional oil-producing regions between
2018 and 2030, assuming that the growth of water use Hazard class Hazard class
matches current growth rates of HF production. Acute toxicity Carcinogenicity
A relatively new aspect is to reuse the flow-back/produc- Skin corrosion/irritation Reproductive toxicity
tion water. After high-pressure pumping of frac fluids into Serious eye damage/eye irritation Specific target organ
rock formations, the injected fluid returns to the surface via toxicity—single
the borehole. Initially, the fraction of frac fluid is higher exposure
compared to formation water, the natural layer of water Respiratory or skin sensitization Specific target organ
inside gas or oil reservoirs. Later, the fraction of frac fluid toxicity—repeated
exposure
declines (NYSDEC 2011) and the production water consists
Germ cell mutagenicity Aspiration hazard
predominantly of formation water. In principle, production
13972 Archives of Toxicology (2020) 94:967–1016
2016 (COM 2016) to be used, e.g., in private area and pub- Compared to the information available for individual frac
lic health area disinfectants and other biocidal products, and chemicals, only little is known about complete frac fluid
food and feed area disinfectants. In 2018, C(M)IT/MIT has mixtures. Exceptions are self-classifications by users (e.g.,
been classified more strictly as hazard category 2 regarding ExxonMobile 2017). Risk assessment of frac fluids should
acute toxicity after inhalation and dermal exposure. Fur- refer to the total (finally applied) mixture, including the
thermore, the issue of skin and eye irritation has also been basic fluid, specific additives and proppants; this mixture
comprehensively addressed (COM 2018) (Table 3). should be evaluated based on the ratio of individual com-
Classification of compounds frequently used in frac fluids pounds of the entire volume (Regulation (EC) No 1272/2008
according to CLP is given in Table 4. The listed chemicals (CLP), article 2, 2008). In contrast to this regulation, some
were present in at least 20% of all frac fluids listed in the authors assessed only specific mixtures of additives and not
U.S. EPA FracFocus 1.0 project database (U.S. EPA 2015, the complete frac fluid. Using this procedure, Meiners et al.
2016a, Appendix C, Table C-2). This classification only (2012a, b) concluded that six of 88 analyzed additive mix-
informs about the intrinsic toxicity (hazard) of the com- tures should be classified as toxic, six as dangerous to the
pounds; however, conclusions with respect to health risks environment, 25 as harmful to human health, 14 as irritat-
require additional information about exposure scenarios. ing, 12 as corrosive, and 27 as non-hazardous. However, in
Elements of a hazard-based approach in legal requirements the finally used (complete) frac fluids, the concentrations of
of hydrofracking can be found in German water law: frac these compounds or mixtures of additives are so low that
fluid mixtures are only permitted if they are classified as ‘not thresholds of the Regulation (EC) no. 1272/2008 (CLP)
hazardous to water’ or ‘low hazardous to water’. (2008) are usually not exceeded. Therefore, in many cases,
A general problem which can arise during risk evaluation the complete frac fluid mixtures can be classified as non-
of frac fluids is given by the sometimes imprecise or missing hazardous to human health (Ewers et al. 2013; Gordalla et al.
description of their chemical composition and the chemi- 2013). Self-classifications of ExxonMobile (2017) came to
cal identity of individual compounds (Elsner et al. 2015) the conclusion that the total fluid is weakly hazardous to
and/or the lack of toxicological data for the classification water and not hazardous to the environment. According to
of individual frac chemicals as well as frac fluid mixtures.
Table 3 Classification of reaction mass of 5-chloro-2-methyl-2H-isothiazol-3-one and 2-methyl-2H-isothiazol-3-one (3:1) and 2-methylisothia-
zol-3(2H)-one
Chemical name Hazard class and category code(s) Hazard statement code(s)
Reaction mass of 5-chloro-2-methyl-2H-isothiazol- Acute Tox. 3 H301 (toxic if swallowed)
3-one and 2-methyl-2H-isothiazol-3-one (3:1)a Acute Tox. 2 H310 (fatal in contact with skin)
Acute Tox. 2 H330 (fatal if inhaled)
Skin Corr. 1C H314 (causes severe skin burns and eye damage)
Skin Sens. 1A H317 (may cause an allergic skin reaction)
Skin Irrit. 2 H315 (causes skin irritation)
Eye Irrit. 2 H319 (causes serious eye irritation)
Aquatic Acute 1 H400 (very toxic to aquatic life)
Aquatic chronic 1 H410 (very toxic to aquatic life with long-lasting
effects)
2-Methylisothiazol-3(2H)-onea Acute Tox. 2 H330 (fatal if inhaled)
Acute Tox. 3 H311 (toxic in contact with skin)
Acute Tox. 3 H301 (toxic if swallowed)
Skin Corr. 1B H314 (causes severe skin burns and eye damage)
Eye Dam. 1 H318 (causes serious eye damage)
Skin Sens. 1A H317 (may cause an allergic skin reaction)
Aquatic Acute 1 H400 (very toxic to aquatic life)
Aquatic Chronic 1 H410 (very toxic to aquatic life with long-lasting
effects)
Entry in Annex VI, Regulation CLP
a
13th Adaptation to Technical Progress (ATP) (COMMISSION REGULATION (EU) 2018/1480 of 4 October 2018)
13Archives of Toxicology (2020) 94:967–1016 973
Table 4 Classification of International chemical identification CAS RN Classification
commonly used frac chemicals
(according to U.S. EPA Hazard class and Hazard state-
2016a) in accordance with category code(s) ment code(s)
the requirements of the CLP
2,2-Dibromo-3-nitrilopropionamidea 10,222-01-2
Regulation
2-Butoxyethanol 111-76-2 Acute Tox. 4 H332
Acute Tox. 4 H312
Acute Tox. 4 H302
Eye Irrit. 2 H319
Skin Irrit. 2 H315
Prop-2-yn-1-ol; propargyl alcohol 107-19-7 Flam. Liq. 3 H226
Acute Tox. 3 H331
Acute Tox. 3 H311
Acute Tox. 3 H301
Skin Corr. 1B H314
Aquatic Chronic 2 H411
Diammonium peroxodisulfate; ammonium persulfate 7727-54-0 Ox. Sol. 3 H272
Acute Tox. 4 H302
Eye Irrit. 2 H319
STOT SE 3 H335
Skin Irrit. 2 H315
Resp. Sens. 1 H334
Skin Sens. 1 H317
Choline chlorideb 67-48-1
Acetic acid 64-19-7 Flam. Liq. 3 H226
Skin Corr. 1A H314
Ethanol; ethyl alcohol 64-17-5 Flam. Liq. 2 H225
Alcohols, C12–14-secondary, e thoxylatedb 84,133-50-6
Ethanediol; ethylene glycol 107-21-1 Acute Tox. 4 H302
Liquid nitrogenc 7727-37-9
Glutaral; glutaraldehyde; 1,5-pentanedial 111-30-8 Acute Tox. 3 H331
Acute Tox. 3 H301
Skin Corr. 1B H314
Resp. Sens. 1 H334
Skin Sens. 1 H317
Aquatic Acute 1 H400
Guar gum, propoxylatedb 39,421-75-5
Distillates (petroleum), hydrotreated light; kerosine—unspec- 64,742-47-8 Asp. Tox. 1 H304
ified;
Propan-2-ol; isopropyl alcohol; Isopropanol 67-63-0 Flam. Liq. 2 H225
Eye Irrit. 2 H319
STOT SE 3 H336
Potassium carbonateb 584-08-7,
6381-79-9 (ses-
quihydrate
Potassium hydroxide; caustic potash 1310-58-3 Acute Tox. 4 H302
Skin Corr. 1A H314
Methanol 67-56-1 Flam. Liq. 2 H225
Acute Tox. 3 H331
Acute Tox. 3 H311
Acute Tox. 3 H301
STOT SE 1 H370
Sodium hydroxide; caustic soda 1310-73-2 Skin Corr. 1A H314
Polyethylene glycol nonylphenyl e therd 9016-45-9
Hydrochloric acid 231-595-7 Skin Corr. 1B H314
STOT SE 3 H335
Citric acidb 77-92-9
The listed chemicals were present in at least 20% of all frac fluids listed in the U.S. EPA FracFocus 1.0 pro-
ject database (U.S. EPA 2016a, Appendix C, Table C-2)
a
In: LIST OF PENDING ARTICLE 95(1) APPLICATIONS. Prepared as of 15 December 2015. bNoti-
fied classification and labeling according to CLP criteria. cNot classified. dCommittee for Risk Assessment
(RAC) Opinion on an Annex XV dossier proposing restrictions on Nonylphenol and Nonylphenol ethoxy-
lates: “NONYLPHENOL AND NONYLPHENOLETHOXYLATES IN TEXTILES”
13974 Archives of Toxicology (2020) 94:967–1016
this assessment, labeling of the considered frac fluids would MCDA is based on their toxic hazard [chronic Reference
not be necessary (ExxonMobile 2017). Doses (RfDs) and Oral Slope Factors for non-cancer and
Another approach for the assessment of risks for health cancer endpoints], the frequency of use, physio-chemical
and ecological impacts by constituents of the frac fluid was properties, and their mobility in water. It allows a nationwide
introduced by Bergmann et al. (2014). The authors defined or state-specific analysis ranking of frac fluid components.
a risk quotient by dividing the substance’s concentration in The nationwide analysis (U.S.) of the non-cancer MCDA (37
the frac fluid by an assessment value. The assessment val- chemicals in total) indicates the highest Total Hazard Poten-
ues correspond to threshold values for groundwater (LAWA tial Scores for propargyl alcohol, 2-butoxyethanol, N,N-
2017), guidance values for drinking water, or precaution- dimethylformamide, acrylamide, and naphthalene (ranked
ary values of drinking water for substances that cannot from high to low). For 2-butoxyethanol, N,N-dimethylfor-
(or can only partially) be toxicologically assessed (Dieter mamide, and naphthalene, the Occurrence Score and the
2014). If a compound has a risk quotient < 1, no risk can be Physical Properties Score shape the ranking. The cancer
expected, while a risk quotient ≥ 1 suggests a possibility of MCDA, based on the nationwide analysis of ten chemicals
increased risk. A high risk can be expected if the risk quo- in total, shows acrylamide, bis(2-chloroethyl) ether, quino-
tient exceeds a value 1000. Using this approach, the authors line, 1,4-dioxane, and benzyl chloride with the highest Total
concluded that six of eight evaluated substances used in frac Hazard Potential Scores. For the first three substances, the
fluids lead to a high risk to human health. OECD (2018) and tox score determines the overall score.
NRC (2009) describe a similar approach with the metrics
hazard quotient (for an individual compound) and hazard
index when reviewing the assessment of combined expo-
sures (Fig. 2). It should, however, be kept in mind that the Produced water
approach by Bergmann et al. (2014) uses the principles
of drinking water assessment and, as such, may be criti- ‘Produced water’ (or ‘production water’) has been defined as
cally discussed whether it represents an adequate basis. For any type of water that flows to the surface from oil and gas
example, the threshold values for groundwater were often wells (U.S. EPA 2016a). It represents a mixture of flow-back
justified by drinking water limit values or comparable (i.e., injected fluid returning to the surface) and reservoir
derived toxicological guidance values. Toxicological based water, i.e., the water present in natural oil and gas deposits.
regulations for drinking water are based on the principle Early after hydraulic stimulation, e.g., within 1 or 2 days,
that 2 L of water per day can be consumed throughout life the produced water contains a relatively high fraction of
without an increased risk to human health. Although high flow-back with frac fluids. Later, the fraction of reservoir
standards should also be maintained concerning frac flu- water in the produced water increases. Produced water con-
ids, the intended use differs widely from that of drinking tains a complex mixture of potentially harmful inorganic
water and may, therefore, require different procedures for and organic chemicals from naturally occurring geogenic
risk assessment. compounds, constituents of the frac fluid, and transformation
A multi-criteria decision analysis (MCDA) framework products from biotic and abiotic processes [Hoelzer et al.
to estimate potential risks for drinking water resources by 2016; Sun et al. 2019 (review)]. Substantial constituents in
frac chemicals was presented by Yost et al. (2017). The produced water are the following chemical groups:
Fig. 2 The Hazard Index The Hazard Quoent (HQ) is equal to divide exposure by the safe dose / reference value. In the
approach to assess combined context of human health risk assessment, the DNEL, Acceptable Daily Intake (ADI), Thresholds of
exposures to multiple chemicals
Toxicological Concern (TTC), RfD or Benchmark Dose Lower Confidence Limit (BMDL) are commonly
(OECD 2018; NRC 2009)
used as safe dose.
HQ = Exposure / Safe Dose
The Hazard Index (HI) is equal to the sum of each chemical compound’s Hazard Quo
ent:
n
Hazard Index = ∑ Hazard Quoents, n = number of chemical substances
n=1
Uncertainty is already incorporated into the HI and, therefore assessment factors do not need to be
applied.
Interpreta
on: HI ≤ 1: combined risk acceptable; HI > 1: poten
al concern.
13Archives of Toxicology (2020) 94:967–1016 975
• inorganic salts including those from chloride, bromide, et al. 2019), appears inadequate because produced water
sulfate, sodium, magnesium and calcium; on its own is not a subject of protection.
• metals including barium, manganese, iron, and strontium;
• radioactive materials including radium-226 and
radium-228; Environmental pollution and toxicological
• oil, grease and dissolved organics, including BTEX; risks
• hydraulic fracturing chemicals, including tracers and
their transformation products; Incidents in the surface installations of HF plants may
• produced water treatment chemicals. lead to contamination of near-surface groundwater and of
surface waters with frac chemicals and production water.
Interacting factors that can influence the chemical com- Leaks of the drilling holes will cause contamination of the
position of produced water include the composition of surrounding rock and groundwater. Surface waters can be
injected hydraulic fracturing fluids; the targeted geologi- contaminated by the release of insufficiently treated produc-
cal formation and associated hydrocarbon products; the tion water and by leakage from aboveground reservoirs for
stratigraphic environment; subsurface processes and the storage of production water. Recently, four mechanisms have
residence time. Therefore, very different types of contami- been reported to be particularly relevant for the quality of
nation have been observed in produced waters. Already water resources (Vengosh et al. 2014): (a) contamination
in flow-back and produced water, more than a thousand of near-surface groundwater by leaking gas wells, diffusive
geogenic organic compounds have been identified using emissions (stray gas), frac fluids and flow-back water; (b)
GC-FID, GC–MS, and GC × GC–TOF–MS techniques but contamination of surface water from inadequately treated
only in a qualitatively manner (Luek and Gonsior 2017). production water; (c) accumulation of toxic and radioac-
Tables 5 and 6 summarize organics, inorganics and fur- tive compounds in sediments of rivers and lakes exposed to
ther parameters analyzed in produced water that have been production water or frac fluids and (d) overexploitation of
reported quantitatively above the limit of detection. The water resources.
use of U.S. EPA’s drinking water MCLs (Maximum Con-
taminant Levels) to assess the toxicological risk of chemi-
cals in produced water, as it has been performed by some
authors (Akob et al. 2015; Ziemkiewicz and He 2015; Sun
Table 5 Concentrations of organic parameters in produced water from unconventional reservoirs (including shale, tight formation, and coalbed
methane)
Parameters Shale formation Tight forma- Coalbed methane
tion
Barnett Marcellus Cotton Valley Powder river Raton San Juan Black Warrior
Group
TOC (mg/L) 9.75 (6.2–36.2) 160 (1.2–1530) 89.2 (1.2–5680) 198 (184–212) 3.52 (2.07– 1.74 (0.25– 2.91 (0.95– 6.03 (0.00–
6.57) 13.00) 9.36) 103.00)
DOC (mg/L) 11.2 (5.5–65.3) 117 (3.3–5960) 3.18 (1.09– 1.26 (0.30– 3.21 (0.89– 3.37 (0.53–
8.04) 8.54) 11.41) 61.41)
BOD (mg/L) 582 (101– 141 (2.8–
2120) 12,400)
Benzene 680 (49–5300) 220 (5.8–2000) 4.7 (BDL– 149.7 (BDL–
(µg/L) 220.0) 500.0)
Toluene 760 (79–8100) 540 (5.1–6200) 4.7 (BDL– 1.7 (BDL–6.2)
(µg/L) 78.0)
Ethylbenzene 29 (2.2–670) 42 (7.6–650) 0.8 (BDL– 10.5 (BDL–
(μg/L) 18.0) 24.0)
Xylenes 360 (43–1400) 300 (15–6500) 9.9 (BDL– 121.2 (BDL–
(μg/L) 190.0) 327.0)
The data are given as average (min.–max.) or median (min.-max.) (from U.S. EPA 2016a, Appendix E; modified)
The data sources corresponding to U.S. EPA (2016a) (Appendix E, Table E-9, modified) were Hayes and Severin (2012), Barbot et al. (2013),
Hayes (2009), Blondes et al. (2014), Dahm et al. (2011), and DOE (2014)
13976 Archives of Toxicology (2020) 94:967–1016
Table 6 Levels of inorganic and organic parameters in flow-back and produced water from unconventional reservoirs
Authors (year) Parameters Concentration Matrix, study site
Akob et al. (2015) Barium 15,000 mg/L (median) Produced water
3780–22,400 mg/L (range) Marcellus shale, Burket shale
Chloride 109,000 mg/L–184,000 mg/L (Pennsylvania)
Sodium 44,800 mg/L–63,100 mg/L
Calcium 16,300–39,200 mg/L
Strontium 3390–10,300 mg/L
Bromide 760–1470 mg/L
Non-volatile dissolved 6.7–49.3 mg/L
Organic carbon (NVDOC)
Low molecular-weight 0.7–5.6 µg/L
Organic acid anion (LMWOA)
Benzene < 1.0–1,8 µg/L
Toluene 1.0–1.3 µg/L
Tetrachloroethylene < 1.0–11.7 µg/L
Lester et al. (2015) Aluminum 0.064 mg/L Flow-back; Denver–
Arsenic 0.067 mg/L Julesburg (Colorado)
Boron 3.105 mg/L
Barium 8.542 mg/L
Calcium 524.1 mg/L
Chromium 0.058 mg/L
Cesium 0.073 mg/L
Copper 0.288 mg/L
Iron 81.42 mg/L
Potassium 101.3 mg/L
Lithium 3.519 mg/L
Magnesium 106.4 mg/L
Manganese 1.471 mg/L
Sodium 6943.9 mg/L
Nickel 0.042 mg/L
Rubidium 0.230 mg/L
Silicon 19.65 mg/L
Strontium 60.25 mg/L
Titanium 0.028 mg/L
Vanadium 0.120 mg/L
Zinc 0.051 mg/L
Acetone 16,000 µg/L
2-Butanone 240 µg/L
Xylenes 30 µg/L
1,4-Dioxane 60 µg/L
2-Methylphenol 150 µg/L
3- and 4-Methylphenol 170 µg/L
2-Methylnaphthalene 4 µg/L
Dimethyl phthalate 15 µg/L
Phenanthrene 3 µg/L
Pyrene 0.9 µg/L
Butyl benzyl phthalate 4.2 µg/L
Bis(2-ethylhexyl) phthalate 29 µg/L
Phenol 830 µg/L
2,4-Dimethylphenol 790 µg/L
13Archives of Toxicology (2020) 94:967–1016 977
Table 6 (continued)
Authors (year) Parameters Concentration Matrix, study site
Ziemkiewicz and He (2015) Barium 10.2 mg/L; 2580 mg/L; 514.68 mg/L (minimum, Flow-back,
maximum, mean)
Strontium 117 mg/L; 4660 mg/L; 1365 mg/L Marcellus Shale
Natrium 2440 mg/L; 119,000 mg/L; 26,202 mg/L (West Virginia)
Magnesium 107 mg/L; 2260 mg/L; 835 mg/L
Calcium 1010 mg/L; 19,900 mg/L; 7269 mg/L
Potassium 44.2 mg/L; 488 mg/L; 260.66 mg/L
Iron 14.7 mg/L; 149 mg/L; 67.08 mg/L
Manganese 1.38 mg/L; 10.2 mg/L; 5.5 mg/L
Arsenic Nd
Chromium Nd; 0.14 mg/L; 0.085.5 mg/L
Mercury Nd
Lead Nd; 0.1 mg/L; 0.1 mg/L
Selenium Nd; 0.34 mg/L; 0.26 mg/L
Silver Nd
Aluminium Nd; 13.3 mg/L; 4.61 mg/L
Zinc Nd; 0.35 mg/L; 0.14 mg/L
Nitrate Nd; 0.3 mg/L; 0.02 mg/L
Nitrite Nd; 0.8 mg/L; 0.06 mg/L
Sulfate Nd; 108 mg/L; 55.93 mg/L
Chloride 4700 mg/L; 79,000 mg/L; 42,683 mg/L
Phosphate Nd; 90 mg/L; 9.49 mg/L
Bromide 52.5 mg/L; 970 mg/L; 465.96 mg/L
Benzene Nd; 372 µg/L; 194.47 µg/L
Ethylbenzene Nd; 235 µg/L; 85.34 µg/L
Styrene Nd; 141 µg/L; 141 µg/L
Toluene Nd; 2450 µg/L; 621.71 µg/L
Xylene (m,p) Nd; 3380 µg/L; 825.75 µg/L
Xylene (o) Nd; 673 µg/L; 205.5 µg/L
MBAS Nd; 0.61 mg/L; 0.42 mg/L
Gross Alpha 1.84 pCi; 20,920 pCi; 5866 pCi
Gross Beta 9.6 pCi; 4664 pCi; 1172 pCi
Radium-226 15.4 pCi;1194 pCi; 358 pCi
Radium-228 4.99 pCi; 216 pCi; 94.6 pCi
Thorium-228 0.3 pCi; 2.35; 1.29 pCi
Thorium-230 0 pCi; 9.37 pCi; 2.13 pCi
Thorium-232 0 pCi; 0.38 pCi; 0.07 pCi
Uranium-238 n/a; n/a; 0.34 pCi
Potassium-40 Nd 221 pCi; 62.44 pCi
Ziemkiewicz (2013) Benzene 6 µg/L; 19.7 µg/L; 21 µg/L (flow-back cycle at Flow-back, dry well
days 7, 14 and 35)
Toluene 3.8 µg/L; 12 µg/L; 6.8 µg/L Marcellus Shale
Xylene (m,p) 0.7 µg/L; 6.2 µg/L; 3.2 µg/L (West Virginia)
Benzene 370 µg/L; 18 µg/L; 122 µg/L (flow-back cycle at Flow-back, wet well
days 7, 14 and 35)
Toluene 2070 µg/L; 170 µg/L; 525 µg/L Marcellus Shale
Xylene (m,p) 2424 µg/L; 375 µg/L; 525 µg/L (West Virginia)
13978 Archives of Toxicology (2020) 94:967–1016
Contamination of groundwater A critical question is to which degree fluid may ascend
from deeper formations and reach groundwater (Reagan
The potential to contaminate groundwater has been consid- et al. 2015). Model simulations have shown that frac fluids
ered to be the most relevant risk of HF (Gagnon et al. 2016; may ascend by only approximately 50 m even if large cracks
Vengosh et al. 2014). Groundwater contaminations may be of more than 1000 m across rock formations occur (Ewen
caused by et al. 2012). The largest possible up-flow in vertical fissure
systems was estimated to be approximately 215 m under
• Blowout, i.e., the accidental release of flow-back, produc- worst-case assumptions. Other authors also reported that
tion water and hydrocarbons; release of frac fluid by leak- vertical leakage over larger distances is very unlikely (Groat
age of containers; leakage of production water pipelines. and Grimshaw 2012; BGR 2016). However, the horizontal
• Leaking boreholes by deficient casing and cementing; flux in deep water layers in the geological setting coal seam
this also refers to leaking drainage wells for disposal of (Münsterland, Germany) may reach several km, at a rate
production water. of ~ 20 m per year (Ewen et al. 2012).
• Migration of frac fluid components from deeper into
more superficial formations.
• Rising of gas (i.e., ‘thermogenic methane’). Methane in water due to HF activities
• Rising of deposited production water from deep wells. and conventional oil and gas production
Frac chemicals exhibit a relatively low volatility and Groundwater and drinking water
many of the most frequently used have a high solubility in
water and a negative or very low octanol–water partition Methane in ground and drinking water is a common phe-
coefficient (Kow), which supports transfer into ground- nomenon already known from conventional oil production
water (U.S. EPA 2016a). Solubility of frac fluids may be (Muehlenbachs 2011). In groundwater, it can not only be
increased by the presence of solvents, such as methanol or of thermogenic origin but can be formed under methano-
ethanol. Changes in common water quality parameters can genic conditions via a biological pathway. The discrimina-
be associated with impacts from hydraulic fracturing activi- tion between thermogenic and biogenic methane is possible
ties. Measurable changes in methane levels, total dissolved by measuring the typical δ13C–CH4 and δ2H–CH4 isotope
solids (TDS), ratios of geochemical constituents, and iso- fingerprint, the ratio between methane and the sum of ethane
topic ratios might suggest an impact by HF but could also be and propane, and the percentage of helium in a water sam-
from either natural or anthropogenic sources. Specific frac ple (McIntosh et al. 2019). In HF, methane may reach the
chemicals or specific tracer substances were comparatively ground and drinking water through damaged cementing and
little investigated as groundwater contaminants (U.S. EPA casing of boreholes (Darrah et al. 2014; Dyck and Dunn
2016a). 1986; Sherwood et al. 2016). Such damage is relatively fre-
A general problem in assessing the influence of HF on quent, with 219 incidents concerning the integrity of a total
the quality of groundwater represents the lack of baseline of 6466 boreholes being reported between 2008 and 2013
monitoring before the onset of oil or gas production. How- (Vidic et al. 2013).
ever, such baseline monitoring is an important prerequisite Up until now, methane has been used as an indicator
for a sound evaluation of possible consequences of HF, par- substance for inadequate well integrity and geological dis-
ticularly in regions with former conventional oil and gas turbance (stray gas). Its use has recently been re-examined
production. more intensively. Methane is a relatively non-toxic, colorless
and odorless gas. At high concentrations of 300,000 ppm
or 30% in the breathing air, it acts as an asphyxiant that
Table 7 Action level of the U.S. Department of the Interior (DOI 2001) for methane
Action level Atmospheric (% volume) Concentration in water (mg/L) Soil gas (% volume)
Occupiable spaces (homes) Un-occupiable spaces
Immediate action > 1.0% > 3.0% > 28 mg/L > 5.0%
Warning, investigate > 0.5% but ≤ 1.0% > 1.0% but ≤ 3.0% > 10 mg/L but ≤ 28 mg/L > 3.0% but ≤ 5.0%
Monitor to determine > 0.25% but ≤ 0.5% > 1.0% but ≤ 3.0%
concentration trends
No immediate action ≤ 0.25% ≤ 1.0% ≤ 10 mg/L
13Archives of Toxicology (2020) 94:967–1016 979
displaces oxygen in the lungs and causes CNS symptoms and biological origin, respectively. Ethane and propane were
and suffocation. Action levels for methane in air and water detected in 27% and 8% of all samples, with medians of
have been recommended not for toxicological reasons but 50 nL/L and 23 nL/L, respectively. Lower Saxony’s methane
because of the risk of explosions of air/methane mixtures values indicate that 6% (n = 60) exceed the warning thresh-
(Table 7). A drinking water concentration of a similar mag- old of 10 mg/L and 1.3% exceed the threshold for immediate
nitude has been proposed in Canada (3 L methane/m3 cor- action of 28 mg/L of U.S. DOI (Table 7). The data of this
responding to 2 mg methane/L) (Ontario Government 2006). survey can serve as a possible baseline tool for monitoring
The Canadian threshold value is intended as an ‘Aesthetic in future.
Objective’. Aesthetic Objectives are established for param- Several studies observed an association between the dis-
eters that may affect the taste, smell or color of the drink- tance of gas production sites and methane in drinking water
ing water and are not based on thresholds of adverse health and domestic wells. Methane concentrations in drinking
effects. Methane in drinking water causes the release of gas water wells in the Marcellus and Utica shale gas formations
bubbles and violent spurting from water taps. were 19.2 (average) and 64 (maximum) mg/L if a gas well
was within a distance of 1 km (Osborn et al. 2011). These
Methane baseline monitoring in Lower Saxony, concentrations are so high that they increase the risk of fire
Germany and explosions (Table 7). By contrast, drinking water wells
in the same region and a similar hydrogeology without gas
It is important to monitor background levels in surface water wells in the neighborhood contained methane concentrations
in regions with frac activities. Therefore, a comprehensive of only 1.1 mg/L (Osborn et al. 2011). Similar results were
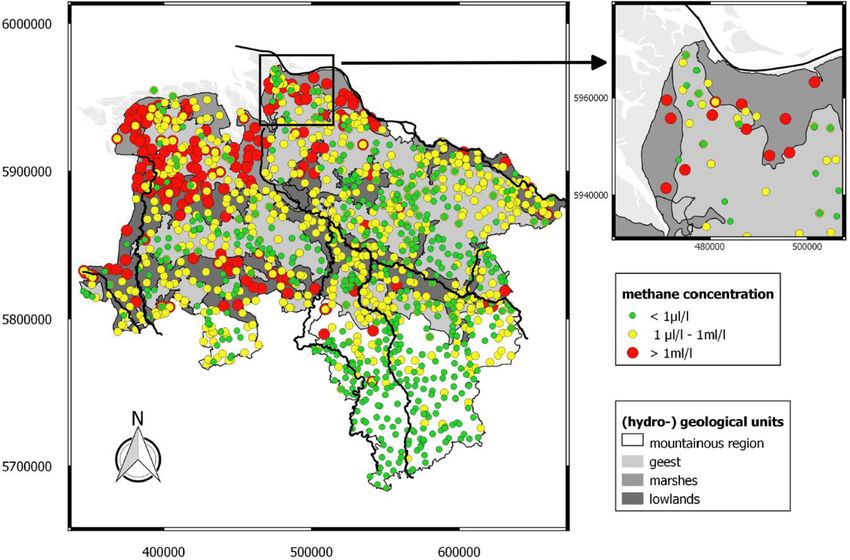
survey has been performed in Lower Saxony (Germany), obtained in a study of 141 water wells in the Appalachian
where the occurrence of methane, ethane and propane in Plateau (Jackson et al. 2013). Concentrations of methane
near-surface groundwater of ~ 1000 groundwater wells was were approximately sixfold higher in drinking water wells
analyzed (Schloemer et al. 2018). Lower Saxony is the larg- within a distance of 1 km from gas wells compared to drink-
est hydrocarbon province in Germany, where 327 hydraulic ing water wells without neighboring gas production. In
stimulations in 148 production wells at depths of > 3000 m contrast to these findings, a third study (Siegel et al. 2015)
have been performed since 1961 (BGR 2016). The back- did not observe a relationship between methane concentra-
ground values for dissolved methane vary from 20 nL/L tions in individual home wells and oil or gas wells in the
(14.2 ng/L) to 60 mL/L (42.7 mg/L) [v/v], i.e., a range of ~ 7 neighborhood.
orders of magnitude (Fig. 3). Most analyses are indicative
of methanogenic processes. Samples with high δ13C con-
tents and methane levels above 10 mL/L (7.1 mg/L) can
be mostly accounted for by secondary methane oxidation
Fig. 3 Methane in Lower
Saxony’s groundwater (geodetic
coordinates of sampling points
according to WGS84 (1984))
13980 Archives of Toxicology (2020) 94:967–1016
Compromised groundwater quality there is hydrological evidence of localized upwards directed
by vertical mixing hydraulic gradients, which could contribute to potential
upward migration of dissolved compounds from depths of
Mixing groundwater layers of different depths (vertical mix- HF stimulation. Analysis of groundwater samples of MW01
ing) due to extensive groundwater production required for and MW02 collected in 2010, 2011, and 2012 resulted in
HF can compromise the quality of groundwater. One expla- the detection of a multiplicity of frac fluids components and
nation for this is that high-quality groundwater is mixed increased iron concentrations that indicates the pollution by
with higher water layers that are contaminated by nitrates HF activities. Methanol, ethanol, and isopropanol quantities
or pesticides from surface-related activities. Moreover, high- of up to 863, 28.4, and 862 μg/L, respectively, were meas-
quality groundwater close to the surface can be mixed with ured. Tert-butyl alcohol was detected at 6120 μg/L in one
groundwater of deeper hydrogeological formations, leading well. Tert-butyl alcohol in groundwater has been associated
to increased concentrations of chemicals such as arsenic, with degradation of tert-butyl hydroperoxide used for HF but
chloride, fluoride, manganese, and uranium. Examples it can also be produced by the degradation of methyl tert-
of these effects have been documented by the U.S. EPA butyl ether (MTBE) associated with diesel fuel. Diethylene
(2016a). glycol and triethylene glycol were detected in both wells
at maxima of 226 and 12.7 μg/L, respectively, in MW01,
and at 1570 and 310 μg/L, respectively, in MW02. Tetra-
Studies of groundwater contamination ethylene glycol was detected only in MW02 at 27.2 μg/L.
by frac fluids Diesel range organics (DRO) and gasoline range organics
(GRO) were detected in MW01 and MW02 with maximum
Studies investigating the influence of HF on groundwater DRO concentrations of 924 and 4200 μg/L, respectively,
quality are challenging due to potential preexisting con- and GRO concentrations of 760 and 5290 μg/L, respectively.
taminations. It has been estimated that up to three million 1,3,5-, 1,2,4-, and 1,2,3-trimethylbenzene were measured
abandoned oil and gas wells exist in the USA (Gagnon et al. at maximum concentrations of 71.4, 148, and 45.8 μg/L,
2016). This emphasizes the importance of identifying all respectively, in MW02, and at an order of magnitude lower
historical data on groundwater quality in relation to previ- concentrations in MW01. Naphthalene, methylnaphtha-
ous industrial activities. DiGiulio and Jackson (2016) per- lenes, and alkylbenzenes were also detected in MW02 at
formed a comprehensive analysis of publicly available ana- concentrations up to 7.9, 10.2, and 21.2 μg/L, respectively.
lytical data and reports of U.S. EPA, U.S. Geological Survey Trimethylbenzenes and naphthalenes have been used in frac
(USGS), Wyoming Oil and Gas Conservation Commission fluid mixtures. The aromatics benzene, toluene, ethylben-
(WOGCC), and Wyoming Department of Environmental zene, m-/p-xylenes, and o-xylene were detected in MW02
Quality (WDEQ) published from August 2009 to Decem- at maximum concentrations of 247, 677, 101, 973, and
ber 2015. They used these data to evaluate the impact on 253 μg/L, respectively, but not in MW01. 2-Butoxyethanol,
underground sources of drinking water as a result of acid which was used extensively for well stimulation in the Pavil-
stimulation and hydraulic fracturing in the Pavillion Field, lion Field, was detected in both monitoring wells at maxima
Wyoming. The field comprises 181 production wells, includ- of 12.7 μg/L. Other substances such as phenol, substituted
ing plugged and abandoned wells. Acid stimulation and phenols, ketones, lactate, formate, acetate, propionate, and
hydraulic fracturing began in June 1960 and October 1964, benzoic acid were also measured quantitatively in the moni-
respectively, and occurred only as deep as 213 and 322 m toring wells. Detection of organic compounds or degradation
below the ground surface, respectively. These depths are products of chemicals that have been used in frac fluids for
comparable to deepest domestic groundwater use in the area. production well stimulation in MW01 and MW02 provide
In response to complaints of residents regarding foul taste evidence of an impact to groundwater and indicate upward
and odor in water from domestic wells within the Pavillion solute migration to depths of groundwater use under the spe-
Field, the EPA conducted domestic well sampling in March cific hydrogeological conditions. Additionally, the anoma-
2009 and January 2010. In 2010, the U.S. EPA installed two lous concentrations of major ions in domestic wells suggest
monitoring wells (MW01 and MW02) with screened inter- an influence of well stimulation. Detection of DRO/GRO
vals at 233–239 m and 296–302 m below the ground surface, and further organic compounds in domestic wells < 600 m
respectively. MW01 and MW02 were installed to evaluate from unlined pits used up until the mid-1990s to dispose die-
potential upward solute transport of chemicals associated sel–fuel-based drilling mud and production fluids suggests
with well stimulation to maximum depths of groundwater an impact on domestic wells. DRO and GRO in samples of
use (~ 322 m). In general, the overall vertical groundwater these domestic wells ranged from 17.3 to 479 µg/L, and 21.6
gradient in the Pavillion Field is directed downwards but to 48 μg/L, respectively.
13Archives of Toxicology (2020) 94:967–1016 981
A comprehensive analysis of a possible influence of or produced water/flow-back, it could be used as an indi-
shale gas production on the quality of groundwater has cator of the impact on groundwater from these sources.
been performed in the Marcellus Shale, a production site in All pre-drilling bromide concentrations were < LOD
Pennsylvania (Boyer et al. 2012). A relatively high number (0.10 mg/L). However, in 1 of 26 water wells, bromide was
of domestic drinking water wells (n = 233) in rural areas detected at a concentration of 0.5 mg/L after well stimula-
close to gas production sites were studied. Samples were tion (Boyer et al. 2012). This water quality change may
taken before, as well as 8 months and up to 800 days after have been caused by mixing with existing formation water
drilling HF activities. The authors did not observe any during the drilling or frac procedure. The elevated bromide
significant changes in drinking water after frac activities, concentration still falls below WHO’s (2009) health-based
analyzing the conventional organic and inorganic param- drinking water value of 6 mg bromide/L. None of the con-
eters of drinking water quality [e.g., pH, turbidity, TDS, trol water wells or wells near gas wells that had only been
dissolved organic carbon (DOC), total dissolved nitrogen drilled and not fracked had measurable bromide concen-
(TDN), chloride, iron, barium, sodium, manganese, sul- trations during the post-drilling testing. The fact that the
fate, magnesium, strontium, calcium, arsenic, lead, nitrate, sum parameter DOC was unchanged despite the elevated
chromium, cadmium, selenium, mercury, silver, bromide, bromide suggests that this parameter would not be suitable
sulfide, methane, BTEX, MBAS-tensides, oil and grease, for qualitatively detecting organic frac chemicals.
and radioactivity]. Individual frac fluid organics were not A further study of drinking water quality was performed
analyzed. It should be taken into account that drinking in the Barnett Shale, a production site in Texas (Fontenot
water quality of the 233 private water wells sampled was et al. 2013). The authors analyzed samples from 91 private
partially already impaired before the onset of HF activi- drinking water wells located at a distance of either more or
ties, with many values exceeding drinking water standards: less than three km from active natural gas wells, and 9 sam-
pH (17% of 233 samples), TDS (3% of 233 samples), iron ple reference sites outside the Barnett Shale region. Some
(20% of 222 samples), barium (1% of 218 samples), man- water samples from active wells within three km distance
ganese (27% of 203 samples), arsenic (4% of 115 sam- exceeded the drinking water maximum contaminant levels
ples), turbidity (32% of 102 samples), coliform bacteria (MCL) of the U.S. EPA for arsenic (29 of 90 samples), sele-
(33% of 125 samples), fecal coliform bacteria (33% of nium (2 of 10 samples), strontium (17 of 90 samples), and
122 samples), and lead (7% of 104 samples). Most nota- TDS (50 of 91 samples). The MCLs were exceeded by maxi-
ble was the exceedance of the drinking water standards mum factors of 16 (arsenic) and 2 (selenium). Samples from
in pre-drilling samples for both bacterial parameters by reference sites, as well as wells more than three km away
factors of more than 201, followed by manganese, iron, from active natural gas wells, contained lower concentra-
lead, turbidity by factors of 133, 68, 22, and 21, respec- tions of arsenic, selenium, strontium and barium. However,
tively. The BTEX aromatics were all below the limit of the MCLs for TDS had already been exceeded in the histori-
detection (LOD). Pre- and post-drilling methane concen- cal data (1989–1999) (61% ≥ MCL) and in the non-active
trations were tested in 48 water wells. This compound was and reference area (78% ≥ MCL). Methanol was detectable
already present in about 20% of pre-drilling samples, par- in 29% of all samples, of which 24 samples were from active
tially at peak concentrations as high as 58.30 mg/L that extraction area wells and ranged from 1.3 to 329 mg/L.
led to an explicit risk of explosions. Most post-drilling Methanol in samples from non-active and reference area
methane levels were generally near or below the LOD wells ranged from 1.2 to 62.9 mg/L (n = 5). Ethanol was
(< 0.02 mg/L), even after drilling and frac activities had detected in eight samples from active extraction area wells
occurred. Methane increased at one drilled site to ~ 9 mg/L in concentrations ranging from 1 to 10.6 mg/L, and in four
but this well also had a moderate level of methane before samples from non-active and reference area wells ranging
drilling occurred. The obtained data on methane concen- from 2.3 to 11.3 mg/L. Both alcohols were often included
trations from all 48 private water wells were used to com- as anticorrosive agents in frac fluids (Table 1) but can also
pare pre- to post-drilling methane levels. Among these occur naturally in groundwater and be formed as a by-prod-
samples, there were no statistically significant increases uct of microbial metabolism. The spatial pattern of the data
in methane levels after drilling, and no statistically signifi- suggests that elevated levels of some parameters could be
cant correlations to distance from drilling. Therefore, the attributed to different factors. These include the mobilization
authors interpreted these observations as a lack of impact of geogenic components, hydrogeological changes due to a
of HF activities (Boyer et al. 2012). lowered groundwater line, or damaged casing/cementing.
Bromide is typically not detected in undisturbed According to the authors, the evidence for a direct associa-
groundwater and occurs in drinking water at levels well tion of elevated concentrations in the groundwater to Barnett
below those of health concern (WHO 2017). As bromide shale HF activities remains uncertain.
can be found at relatively high concentrations in formation
13You can also read