3.3 Economic Assets at risk and potential impacts
←
→
Page content transcription
If your browser does not render page correctly, please read the page content below
CHAPTER 3      ASSETS AT RISK AND POTENTIAL IMPACTS

                                                               Chapter                  3
                                                               Assets at risk
                                                               and potential
                                                                  impacts

                                                                         3.3
                                                                      Economic
                                                                       sectors

                                                          Coordinating Lead Author

                                                          Jaroslav Mysiak

                                                                               Online Version

Mysiak, J., Molinari, D., Tsionis, G., Toreti, A., Okuyama, Y., ‘Economic sectors’, in: Casajus Valles, A., Marin Ferrer, M., Poljanšek, K., Clark, I. (eds.), Science
for Disaster Risk Management 2020: acting today, protecting tomorrow, EUR 30183 EN, Publications Office of the European Union, Luxembourg, 2020,
ISBN 978-92-76-18182-8, doi:10.2760/571085, JRC114026.

                                                                                                                                             237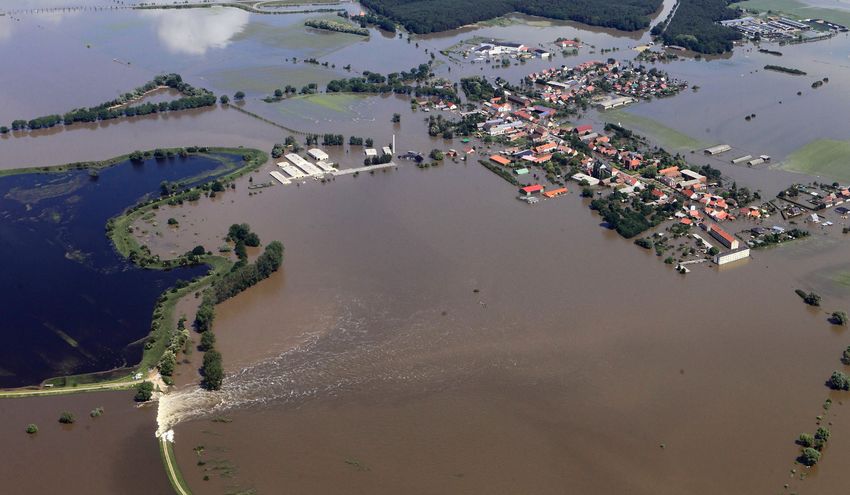
3.3
          Economic sectors

CONTENTS
Introduction . . . . . . . . . . . . . . . . . . . . . . . . . . . . . . . . . . . . . . . . . . . . . . . . . . . . . . . . . . . . . . . . . . . . . . 240
3.3.1 Residential sector . . . . . . . . . . . . . . . . . . . . . . . . . . . . . . . . . . . . . . . . . . . . . . . . . . . . . . . . . . . . 242
      1 Importance of the residential sector  . . . . . . . . . . . . . . . . . . . . . . . . . . . . . . . . . . . . . . . . . . . . . . . . . . . .  243
      2 Assessment of the potential damage and losses . . . . . . . . . . . . . . . . . . . . . . . . . . . . . . . . . . . . . . . . . .  243
         2.1 Methodologies for impact assessment  . . . . . . . . . . . . . . . . . . . . . . . . . . . . . . . . . . . . . . . . . . . . . .  243
         2.2 Taxonomies . . . . . . . . . . . . . . . . . . . . . . . . . . . . . . . . . . . . . . . . . . . . . . . . . . . . . . . . . . . . . . . . . . . . . .  244
         2.3 Exposure data . . . . . . . . . . . . . . . . . . . . . . . . . . . . . . . . . . . . . . . . . . . . . . . . . . . . . . . . . . . . . . . . . . . .  244
         2.4 Vulnerability models  . . . . . . . . . . . . . . . . . . . . . . . . . . . . . . . . . . . . . . . . . . . . . . . . . . . . . . . . . . . . . .  245
         2.5 Loss modelling . . . . . . . . . . . . . . . . . . . . . . . . . . . . . . . . . . . . . . . . . . . . . . . . . . . . . . . . . . . . . . . . . . .  246
         2.6 Risk metrics . . . . . . . . . . . . . . . . . . . . . . . . . . . . . . . . . . . . . . . . . . . . . . . . . . . . . . . . . . . . . . . . . . . . . .  246
      3 Assessment of the impact after an event  . . . . . . . . . . . . . . . . . . . . . . . . . . . . . . . . . . . . . . . . . . . . . . . .  246
         3.1 Post-event collection of damage and loss data . . . . . . . . . . . . . . . . . . . . . . . . . . . . . . . . . . . . . . .  246
         3.2 Case study: the Umbria flood in 2012 . . . . . . . . . . . . . . . . . . . . . . . . . . . . . . . . . . . . . . . . . . . . . . .  248
      4 From single to multi-hazard risk assessment . . . . . . . . . . . . . . . . . . . . . . . . . . . . . . . . . . . . . . . . . . . . .  252
      5 Disaster risk prevention . . . . . . . . . . . . . . . . . . . . . . . . . . . . . . . . . . . . . . . . . . . . . . . . . . . . . . . . . . . . . . . .  253
         5.1 Risk insurance . . . . . . . . . . . . . . . . . . . . . . . . . . . . . . . . . . . . . . . . . . . . . . . . . . . . . . . . . . . . . . . . . . . .  253
         5.2 Building codes and standards  . . . . . . . . . . . . . . . . . . . . . . . . . . . . . . . . . . . . . . . . . . . . . . . . . . . . . .  254
      6 Conclusions and key messages  . . . . . . . . . . . . . . . . . . . . . . . . . . . . . . . . . . . . . . . . . . . . . . . . . . . . . . . . .  255
3.3.2 Agriculture . . . . . . . . . . . . . . . . . . . . . . . . . . . . . . . . . . . . . . . . . . . . . . . . . . . . . . . . . . . . . . . . . . 256
      1 Introduction  . . . . . . . . . . . . . . . . . . . . . . . . . . . . . . . . . . . . . . . . . . . . . . . . . . . . . . . . . . . . . . . . . . . . . . . . . .  257
      2 Risks and impacts . . . . . . . . . . . . . . . . . . . . . . . . . . . . . . . . . . . . . . . . . . . . . . . . . . . . . . . . . . . . . . . . . . . . .  258
      3 Risk management tools . . . . . . . . . . . . . . . . . . . . . . . . . . . . . . . . . . . . . . . . . . . . . . . . . . . . . . . . . . . . . . . .  259
      4 The 2018 drought . . . . . . . . . . . . . . . . . . . . . . . . . . . . . . . . . . . . . . . . . . . . . . . . . . . . . . . . . . . . . . . . . . . . .  262
      5 Projections for the coming decades  . . . . . . . . . . . . . . . . . . . . . . . . . . . . . . . . . . . . . . . . . . . . . . . . . . . . .  264
      6 Conclusions and key messages  . . . . . . . . . . . . . . . . . . . . . . . . . . . . . . . . . . . . . . . . . . . . . . . . . . . . . . . . .  265
3.3.3 Industry and energy  . . . . . . . . . . . . . . . . . . . . . . . . . . . . . . . . . . . . . . . . . . . . . . . . . . . . . . . . . . 268
      1 Introduction and background  . . . . . . . . . . . . . . . . . . . . . . . . . . . . . . . . . . . . . . . . . . . . . . . . . . . . . . . . . . .  269
      2 Risks in industry and energy industries . . . . . . . . . . . . . . . . . . . . . . . . . . . . . . . . . . . . . . . . . . . . . . . . . .  269
         2.1 Risks within industries . . . . . . . . . . . . . . . . . . . . . . . . . . . . . . . . . . . . . . . . . . . . . . . . . . . . . . . . . . . . .  270
         2.2 Risks among industries . . . . . . . . . . . . . . . . . . . . . . . . . . . . . . . . . . . . . . . . . . . . . . . . . . . . . . . . . . . .  270

                         238
CHAPTER 3        ASSETS AT RISK AND POTENTIAL IMPACTS

             2.3 Effects on macroeconomy and environment. . . . . . . . . . . . . . . . . . . . . . . . . . . . . . . . . . . . . . . . . .  271
          3 Risks from climate change  . . . . . . . . . . . . . . . . . . . . . . . . . . . . . . . . . . . . . . . . . . . . . . . . . . . . . . . . . . . . .  272
             3.1 Climate change risk management for the manufacturing and energy industries . . . . . . . . . .  273
             3.2 Governance for reduction of climate change risk  . . . . . . . . . . . . . . . . . . . . . . . . . . . . . . . . . . . . .  274
          4 Estimation methods . . . . . . . . . . . . . . . . . . . . . . . . . . . . . . . . . . . . . . . . . . . . . . . . . . . . . . . . . . . . . . . . . . .  274
             4.1 Assessment of damage  . . . . . . . . . . . . . . . . . . . . . . . . . . . . . . . . . . . . . . . . . . . . . . . . . . . . . . . . . . .  274
             4.2 Assessment of losses  . . . . . . . . . . . . . . . . . . . . . . . . . . . . . . . . . . . . . . . . . . . . . . . . . . . . . . . . . . . . .  275
             4.3 Assessment of higher-order effects  . . . . . . . . . . . . . . . . . . . . . . . . . . . . . . . . . . . . . . . . . . . . . . .  276
          5 Countermeasures against risks  . . . . . . . . . . . . . . . . . . . . . . . . . . . . . . . . . . . . . . . . . . . . . . . . . . . . . . . . .  276
             5.1 Risk management  . . . . . . . . . . . . . . . . . . . . . . . . . . . . . . . . . . . . . . . . . . . . . . . . . . . . . . . . . . . . . . . .  277
             5.2 Business continuity management . . . . . . . . . . . . . . . . . . . . . . . . . . . . . . . . . . . . . . . . . . . . . . . . . . .  278
          6 Case studies . . . . . . . . . . . . . . . . . . . . . . . . . . . . . . . . . . . . . . . . . . . . . . . . . . . . . . . . . . . . . . . . . . . . . . . . . .  280
             6.1 The 2013 floods of the Danube and Elbe rivers in Germany . . . . . . . . . . . . . . . . . . . . . . . . . . . .  280
             6.2 Industrial accidents triggered by natural hazards . . . . . . . . . . . . . . . . . . . . . . . . . . . . . . . . . . . . .  282
          7 Conclusions and key messages  . . . . . . . . . . . . . . . . . . . . . . . . . . . . . . . . . . . . . . . . . . . . . . . . . . . . . . . . .  284
Conclusions  . . . . . . . . . . . . . . . . . . . . . . . . . . . . . . . . . . . . . . . . . . . . . . . . . . . . . . . . . . . . . . . . . . . . . . 286
References . . . . . . . . . . . . . . . . . . . . . . . . . . . . . . . . . . . . . . . . . . . . . . . . . . . . . . . . . . . . . . . . . . . . . . . 288
     Introduction  . . . . . . . . . . . . . . . . . . . . . . . . . . . . . . . . . . . . . . . . . . . . . . . . . . . . . . . . . . . . . . . . . . . . . . . . . . .  288
         3.3.1 Residential sector . . . . . . . . . . . . . . . . . . . . . . . . . . . . . . . . . . . . . . . . . . . . . . . . . . . . . . . . . . . . . . .  288
         3.3.2 Agriculture  . . . . . . . . . . . . . . . . . . . . . . . . . . . . . . . . . . . . . . . . . . . . . . . . . . . . . . . . . . . . . . . . . . . . .  294
         3.3.3 Industry and energy . . . . . . . . . . . . . . . . . . . . . . . . . . . . . . . . . . . . . . . . . . . . . . . . . . . . . . . . . . . . .  299
     Conclusions  . . . . . . . . . . . . . . . . . . . . . . . . . . . . . . . . . . . . . . . . . . . . . . . . . . . . . . . . . . . . . . . . . . . . . . . . . . . .  302

                                                                                                                                                         239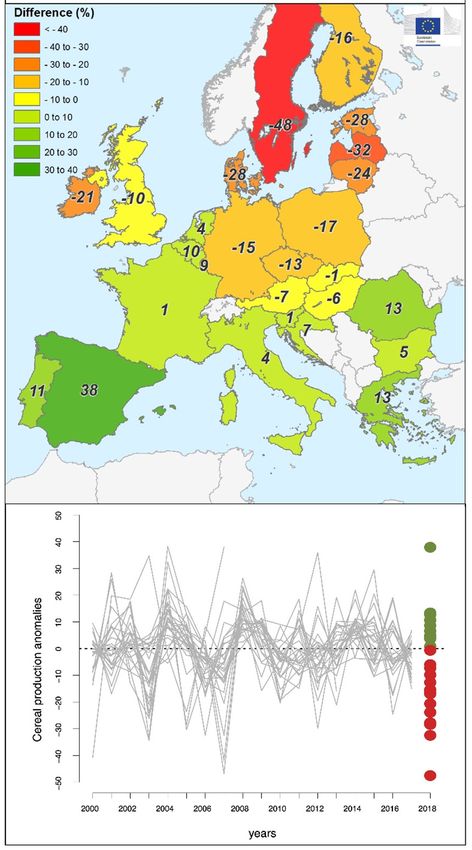
3.3
      Economic sectors

                                              Introduction

Natural hazards are a major threat to sustainable development, economic stability and growth, territorial
cohesion, and community resilience. According to the estimates of the European Environment Agency, the
economic damage due to only natural hazard risks in the EU amounted to more than EUR 557 billion (1) in
1980–2017, mostly triggered by extreme weather and climate-related events whose frequencies and/or
intensities are expected to increase as a result of human-induced climate change. The bulk of this damage
was caused by relatively few low-probability, high-impact hazard events.

These estimates account only for the direct economic damages to physical assets only and omit often
significant indirect economic losses generated by slow-onset hazards, spillover effects and indirect costs
from the disruption of social networks, economic flows and ecosystem services. As a result of neglected
attention to disaster risk impacts in the past, it is not easy to portray the spatial and temporal patterns of
disaster damage and losses with reasonable precision.

The Sendai framework for disaster risk reduction 2015–2030 (UN, 2015) emphasised multi-hazard, inclusive,
science-based and risk-informed decision-making, and laid down priorities for action and policy targets. The
policy targets include a commitment to substantial reduction of economic damage. A sound understanding
of risk does not only imply accounting for past damage and losses. Model-based economic risk assessment
has been propelled by high-performance computing, large-scale hazard and disaster loss/impact models,
and high-resolution exposure datasets of the Copernicus Earth observation programme.

A better understanding of natural hazard risk and ensuing economic losses is important for coordinating
responses to shocks and crises within the European Economic and Monetary Union (Aizenman et al., 2013;
Ureche-Rangau and Burietz, 2013). In the absence of financial protection tools for coping with disasters,
the incidence of major disasters in several EU Member States may exacerbate economic imbalances and
deteriorate credit ratings (Mysiak and Perez-Blanco, 2015).

This subchapter reviews the methods and models used, recent advances, and challenges in analysing
disaster damage and losses in residential, agricultural and industrial sectors. Gross fixed capital formation in
residential housing sector amounts to 5 % of gross domestic product (GDP) in the EU-27 (Eurostat, 2020).
Housing statistics and prices are important indicators of living conditions and therefore regularly collected

               240
CHAPTER 3      ASSETS AT RISK AND POTENTIAL IMPACTS

by national statistical offices and Eurostat. The characteristics of residential building stocks are surveyed by
statistical censuses, and those of residential built-up areas can also be obtained from very high-resolution
remote sensing data (e.g. European Settlement Map (Sabo et al, 2019; European Commission, 2020). Housing
prices are sensitive to past experiences of risk and availability of insurance coverage. Insurance premiums
determined at actuarial risk pricing, on the other hand, are a function of a property’s hazard exposure.

The agricultural sector contributes around 1.1 % of the EU’s GDP but manages almost 40 % of the EU’s
total land area and represents an important employment opportunity for the rural population. Agriculture
is heavily exposed to weather- and climate-related hazards (storms, droughts, floods, heat and hail), other
risks such as pests and diseases, and market volatility. Assessments of economic impacts of water scarcity
or droughts may be based on statistical, crop growth and/or Ricardian land price models. The econometric
models exploit the historical covariation between yields and weather on an annual or more frequent basis to
infer the effect of climate variability and change (e.g. Schlenker and Roberts, 2011). The Ricardian method
assumes that agricultural land rents reflect the expected productivity of agriculture (Moore and Lobell, 2014;
Van Passel et al., 2017).

Hazard-induced disruptions of energy supply or industrial production set off supply and demand shocks
that affect regional economies in and beyond the areas directly affected by the disasters. The damage
to tangible productive assets is equivalent to losses caused by disruption of production networks (Rose,
2004). The demand for liquid capital may increase its price; the level of fiscal consolidation and perceived
trustworthiness play a role. Efforts to restore productive and non-productive capital losses generate new
demand and change consumption patterns, which may lead to changes in prices, trade levels and fiscal
revenues. These effects can be modelled by input–output, computable general equilibrium, social accounting
matrix and econometric models.

(1) EU-28 Member States as in 2018 (including the United Kingdom), European Free Trade Association countries and Turkey, based on the NatCatService of Munich Re, esti-
    mated for the European Environmental Agency and Eurostat climate change indicators.

                                                                                                                                            241
3.3.1 Residential sector

   Lead Authors:

   Daniela Molinari 			 Politecnico di Milano, Italy

   Georgios Tsionis 		  European Commission, Joint Research Centre

   Contributing Authors:

   Adamantia Athanasopoulou European Commission, Joint Research Centre

   Dionysios Bournas 		     European Commission, Joint Research Centre

   Roxana Ciurean 			       British Geological Survey, United Kingdom

   Daniela De Gregorio 		                                     Italy University of Naples Federico II, Italy

   Mattia Leone 			                                           University of Naples Federico II, Italy

   Tiziana Rossetto 			                                       University College London, United Kingdom

   Maria Luísa Sousa 			                                      European Commission, Joint Research Centre

   Giulio Zuccaro 			                                         University of Naples Federico II, Italy

   Molinari, D., Tsionis, G., Athanasopoulou, A., Bournas, D., Ciurean, R., De Gregorio, D., Leone, M., Rossetto, T., Sousa, M.L., Zuccaro, G., ‘Res-
   idential sector’, in: Casajus Valles, A., Marin Ferrer, M., Poljanšek, K., Clark, I. (eds.), Science for Disaster Risk Management 2020: acting
   today, protecting tomorrow, EUR 30183 EN, Publications Office of the European Union, Luxembourg, 2020, ISBN 978-92-76-18182-8,
   doi:10.2760/571085, JRC114026.

      242
CHAPTER 3   ASSETS AT RISK AND POTENTIAL IMPACTS

                          1 Importance of the residential sector
.
Residential buildings constitute one of the main types of assets exposed to natural hazards, with a relatively
high economic value. Residential construction contributed to 4.4 % of EU gross domestic product (GDP) in 2018.
The total built-up residential area in the EU is more than 200 000 km2. Natural hazards may result in damage
to buildings and reduction in their market value. For instance, the price of houses in the north of the Netherlands
dropped by almost 4 % for every percentage point increase in peak ground velocity due to induced seismic activ-
ity (Duran, 2017), while the price of houses within a 100-year floodplain is reduced by 4.6 % after a flood, and
requires 5 to 7 years to recover (Beltrán et al., 2018).

Residential buildings are also important for the safety and quality of life of citizens; therefore, they are essential
for achieving the Sustainable Development Goal 11 for inclusive, safe, resilient and sustainable cities as well
as the targets of the Sendai framework for disaster risk reduction (UNISDR, 2015a) to reduce the number of af-
fected people by disasters and direct economic losses. Residential buildings are the target of EU policies for risk
prevention and mitigation. The Union Civil Protection Mechanism encourages measures to promote resilience at
building level, whereas Directive 2007/60/EC on the assessment and management of flood risks (Floods Direc-
tive) requires the assessment of the risk to assets and humans, as the basis for risk mitigation.

This section examines the impact of floods, landslides, earthquakes, tsunamis and volcanic eruptions on the resi-
dential sector. Other hazards, e.g. technological and human-made ones, are excluded, while the impact on people
is discussed in subchapter 3.2.

                2 Assessment of the potential damage and losses
    Similar models and methodologies are used to assess damage to buildings due to
     different natural hazards. Harmonised and high-quality data on building features
         and damage, available at different geographical levels, are key to calibrate
                           models in a multi-hazard perspective.

                       2.1 Methodologies for impact assessment
Models of hazard, vulnerability and the distribution of exposed buildings are used to estimate damage and losses
(e.g. Casagli et al., 2017; Cloke et al., 2017; Loughlin et al., 2017; Papadopoulos et al., 2017; Silva et al., 2017).
Scenario-driven approaches estimate the impact of specific events, while probabilistic ones consider the proba-
bility of occurrence of all possible events that may affect a site, and a probabilistic estimation of damage and
losses, including relevant uncertainties. Depending on the purpose, there are different methodologies; there is no
single one that is fit for all purposes.

‘Hazard’ refers to processes and phenomena that have the potential to cause damage. It is characterised by its
temporal likelihood (i.e. return period), spatial likelihood and magnitude or intensity, such as extent of affected
area, depth and duration of floods, peak ground acceleration and displacement for earthquakes, velocity and
mass for landslides, or density and thickness of volcanic deposits. Hazard scenario can be defined as the maxi-
mum probable/credible or historical event or an event with a given return period and magnitude.

                                                                                                    243
2.2 Taxonomies
A taxonomy is used to categorise buildings into classes, taking into account the characteristics relevant to as-
sessing the impact of hazards (e.g. Fotopoulou et al., 2013; Zuccaro and De Gregorio, 2013; Du et al., 2014;
Pitilakis et al., 2014a; Zhang et al., 2016; Silva et al., 2018). As Table 1 illustrates, the technical literature indi-
cates that the same building attributes, such as year of construction, number of floors, construction material and
system, are important to characterise the vulnerability of buildings exposed to different hazards. There is a clear
need to better understand the response of structural and non-structural elements to different hazards (see for
example Mavrouli and Corominas, 2010). Taxonomies may be expanded to include additional information and
define more detailed typologies. However, the data for all attributes are not easy to collect (if available at all) at
the local, regional or national level.
Table 1. Building characteristics that are used to assess the vulnerability to natural hazards Source: Authors.
Volcanic
Characteristic Earthquake Flood Landslide Tsunami
eruption
Number of floors X X X X X
Construction material X X X X X
Year of construction or design code level X X X X X
Load-bearing structural system X X X X X
Level of maintenance X X X X
Height above ground X X X X
Irregularity in geometry and resistance X X X X
Presence and type of claddings X X X X
Number and type of openings X X X X X
Presence of domestic plants X
Geometry and structure of roof X
2.3 Exposure data
‘Exposure’ refers to the buildings present in hazard-prone areas. The most basic sources of information on build-
ing exposure, albeit not fully harmonised across countries, are the cadastres and national housing censuses that
are performed regularly and may furnish an exhaustive picture of the housing stock. Open community-based
web geographical information systems (GISs), such as OpenStreetMap, are becoming available and used to iden-
tify exposed buildings. Such information, however, often does not include important attributes, e.g. roof pitch or
openings as a percentage of wall area, for studying risk under natural hazards. Cadastral and census data could
be integrated with spatial information from the geodatabases that are becoming freely available from local
authorities and contain such attributes as location, use, year of construction, level of maintenance and number
of floors. Improved exposure data may be obtained by combining census data and data collected on site (e.g.
Cacace et al., 2018).
Exposure data for buildings located in earthquake-prone regions were collected initially for a few European cit-
ies, often at a high level of geographic disaggregation. Later, inventories providing the population or fractions
of building types at national, regional or local level were developed (Jaiswal et al., 2010; Crowley et al., 2012,
244CHAPTER 3 ASSETS AT RISK AND POTENTIAL IMPACTS
2018; Gamba, 2014; Zuccaro et al., 2015). However, these datasets typically exclude some of the attributes that
affect buildings’ response to other hazards. Exposure to floods and landslides relates to the number (or total
surface/volume) of buildings present in the affected areas and their monetary value. Real estate market value
or reconstruction costs are used and values can be depreciated to take into account the age of the assets (Merz
et al., 2010). Very few studies have collected specific exposure data for tsunami hazards. Census, land cover or
socioeconomic data are mainly adopted to quantify the number of people and assets within potential tsunami
inundation areas (e.g. Grezio et al., 2012; Løvholt et al., 2014). For volcanic risk analysis at local level, e.g. Vesu-
vius, Campi Flegrei and Ischia in Italy and Santorini in Greece, exposure data for ordinary buildings are collected
by in situ surveys and combined with census information (Zuccaro et al., 2018a; Zuccaro and De Gregorio, 2019).
2.4 Vulnerability models
Vulnerability represents the susceptibility of an element at risk of being adversely affected by a hazardous event.
The vulnerability of buildings is commonly modelled using fragility functions, which give the probability that, for
a given hazard intensity, structures of a certain typology will exceed various damage levels. Empirical fragility
functions are based on observed damage data from past events, numerical ones are based on numerical sim-
ulations of varying degrees of sophistication and hybrid ones combine numerical analyses with observed and/
or experimental data (e.g. Spence et al. 2004a,b, 2005; Quan Luna et al., 2011; Mavrouli and Corominas, 2010;
Pitilakis et al., 2014a; Yepes-Estrada et al., 2016; Charvet et al., 2017; Park et al., 2017). Uncertainties in damage
estimates originate from the variability of the hazard characteristics, geometric and material parameters of the
buildings, type of structural model and analysis, resistance models, definition of damage states, etc.
Fewer than a handful of numerical tsunami fragility functions exist in the literature. This is due to a general lack
of understanding of tsunami inundation processes and flow interaction with the built environment, and of how
to implement tsunami loads into structural analysis software (Rossetto et al., 2018). The past few years have
seen an increase in research activity with laboratory experiments (e.g. Foster et al., 2017) and structural analysis
approaches (e.g. Petrone et al., 2017).
When insufficient data are available or the scope of the study requires it, vulnerability indices and matrices may
be employed (e.g. Papathoma and Dominey-Howes, 2003; Vicente et al., 2011; Hu et al., 2012; Jakob et al., 2012;
Kappes et al., 2012; Dall’Osso et al., 2016; Kang and Kim, 2016). Vulnerability indices are composed of a weight-
ed combination of indicators that represent aspects of the building, the site or socioeconomic features that
contribute to the vulnerability of an asset or area. Comparison of vulnerability index values across geographical
areas allows the ranking of their relative vulnerability.
While most studies estimate vulnerability of buildings as separate entities, in reality they represent elements
within a highly interconnected territorial system. Systemic vulnerability is assessed by characterising the physical
vulnerability and functional interdependencies between buildings with different occupancy, lifelines and transport
infrastructure (Pascale et al., 2010; Pitilakis et al., 2014b; Mota de Sá et al., 2016; Zuccaro and De Gregorio,
2019). Such an approach can identify areas of greater risk, and support better emergency and spatial planning.
Adaptive simulation, data mining and artificial intelligence techniques of surrogate modelling or meta-modelling,
combined with health monitoring of buildings, offer possibilities of improving models (Zio, 2018).
The approach depends on the scope, context and temporal and spatial scales of analysis (Sterlacchini et al., 2014;
Schneiderbauer et al., 2017). As housing characteristics vary between countries, transferability of vulnerability
245models is a challenge; integrating multiple methods may help a better understanding of vulnerability (Papathoma-
Köhle et al., 2017) and estimation of uncertainty.
2.5 Loss modelling
Damage-to-loss models are obtained by correlating observed damage with repair costs, or are based on expert
judgement or analytical models (Martins et al., 2016; De Martino et al., 2017; FEMA, 2018). The economic
impact of disasters includes the costs of reconstruction, evacuation, clean-up, loss of contents, etc., and requires
complex modelling (Zuccaro et al., 2013). A new generation of models based on statistical approaches, machine
learning algorithms and in-depth description of damage mechanisms has emerged in the last decade (e.g. Dottori
et al., 2016; Zio, 2018). They account for a large number of hazard and vulnerability parameters, and outperform
simple data-driven models. All types of models need sufficiently large and detailed loss datasets to be calibrated.
Data-driven models also need to be validated for different contexts.
2.6 Risk metrics
Direct losses in residential buildings mean the monetary value of physical damage and costs for cleaning, repair,
demolition, etc. Indirect loss includes costs occurring as a consequence of direct loss, e.g. decrease in market
value or evacuation costs. These metrics may be expressed as loss exceedance curves (probability that various
levels of loss will be exceeded), average annualised losses or average annualised loss ratios (FEMA, 2017). This
last is useful to compare the relative risk across different regions, since it is normalised by the replacement or
market value. ‘Intangible damage’ refers to consequences that cannot be evaluated in monetary terms, such as
loss of memorabilia
3 Assessment of the impact after an event
Knowledge from ex post damage assessment may improve the efficiency of
preparedness, response, recovery and mitigation measures, at both the individual
and community levels. Standardisation of methods and procedures for ex post
damage collection and recording would benefit from being set at the EU level.
3.1 Post-event collection of damage and loss data
Data collected in the aftermath of disasters are the basis for tailoring risk mitigation strategies, both after
an event (e.g. for identifying priorities for intervention and guiding compensation) and before an event (e.g. to
support preventative measures) (Ballio et al., 2015). For instance, the extensive review of flood impacts done by
Pitt (2008) after the 2007 floods in England served to improve policies and techniques of flood risk management
in the United Kingdom in the following years (United Kingdom, Government, n.d.).
The standardising of disaster damage data collection has been constantly advocated so that consistent and
246CHAPTER 3 ASSETS AT RISK AND POTENTIAL IMPACTS
reliable data can be provided to public administrations, scientists and practitioners. Promoting improvements in
the knowledge base for disaster loss management, including loss databases, is a key priority at both international
and EU levels (e.g. Sendai framework for disaster risk reduction, EU disaster prevention framework, EU Solidarity
Fund, green paper on insurance of natural and man-made disasters, and Floods Directive). Accordingly, an EU
working group was created to support and encourage Member States to build a process for loss data collection
and recording. According to the guidelines it provided (De Groeve et al., 2013, 2014, 2015), in order to optimise
required efforts, the process should guarantee the multi-usability of collected data; in detail, it should consider
all exposed sectors, and data must be collected at relevant time intervals to capture direct and indirect losses,
regarding both observed damage and its explicative variables, and in the finest possible detail. In fact, most of
the available procedures for ex post damage assessment are still sector- and hazard-specific, hampering the
harmonisation process desired at international level.
Concerning the residential sector, procedures for the post-earthquake survey of damage are the most developed
(Khazai et al., 2014; FEMA, 2018). Several countries have established inspection forms, primarily to assess
the safety of buildings in the aftermath of a disaster, but also to support the implementation of short-term
countermeasures, and estimate compensation and reconstruction costs (García and Cardona, 2003; ATC, 2005a,b;
Anagnostopoulos and Moretti, 2006a,b; Baggio, et al., 2007; NZSEE, 2009; Santos, 2011; Roldán et al., 2013; Cruz
et al., 2014). It must be stressed, however, that, whereas detailed damage data are collected, losses are usually
reported as total economic losses, limiting the possibility of understanding damage mechanisms, improving risk
models, etc.
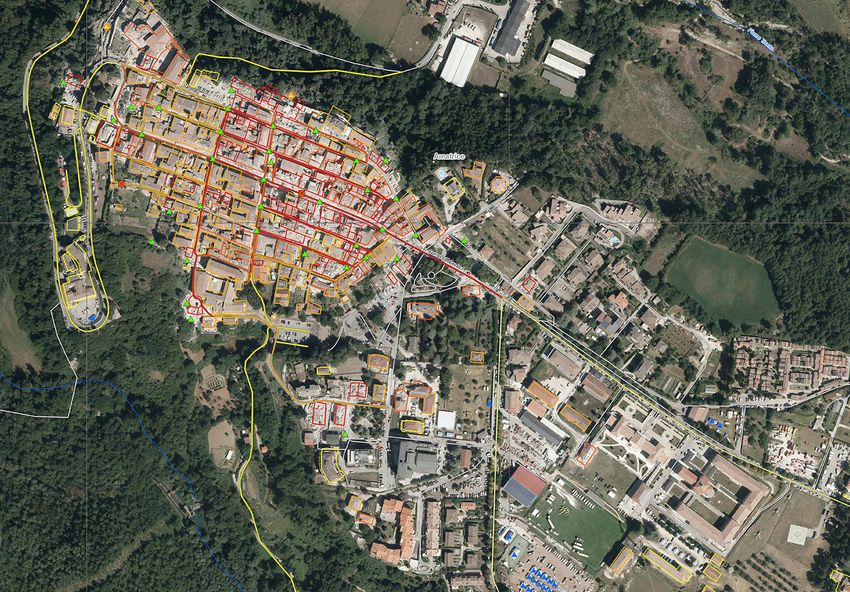
Figure 1. Destroyed (red) and highly damaged (orange) buildings Tsunami damage survey procedures are
in Amatrice, 25 August 2016.
Source: extracted from Copernicus Emergency Management traditionally focused on the evaluation of
Service, 2016. ©EU, 2016 tsunami intensity rather than impacts (e.g.
Rossetto et al., 2007). Still, new approaches
are emerging. For example, on the occasion
of the 2010 Chile earthquake and tsunami,
the International Tsunami Information Centre
developed a questionnaire to collect information
on structural performance as well as general
tsunami impacts (UNESCO, 2010), although
aggregated over an area.
More recently, following the 2011 great east
Japan tsunami, Japan’s Ministry of Land, In-
frastructure and Transportation developed a
damage scale for the evaluation of tsunami
damage to residential buildings (MLIT, n.d.).
An unprecedented amount of detailed disag-
gregated damage data was collected (Tohoku
Earthquake Tsunami Joint Survey Group, 2011)
and then adopted for numerous empirical fragility studies (e.g. Suppasri et al., 2012; Macabuag et al., 2016). A
particular complication arises in the assessment of damage in areas affected first by earthquake and then by
tsunami inundation. Unless there is evidence of the damage due to the earthquake before the tsunami hit, it is
almost impossible to attribute the final damage state to one of the two hazards. To adopt a consistent evalua-
247tion of damage, the UK Earthquake Engineering Field Investigation Team and Indonesian Tsunami and Disaster
Mitigation Research Centre proposed a damage scale capable of capturing damage mechanisms under both
earthquakes and tsunami (EEFIT-TDMRC, 2019).
Numerous databases and digital catalogues on landslides and their consequences have been compiled at re-
gional, national and multinational scales in recent years and used for disaster relief, research and economic
purposes (e.g. CNR, n.d.). Procedures for collecting building damage data after landslides have been proposed
by Papathoma-Köhle et al. (2017) and Del Soldato et al. (2017). The “LANDslides and Floods National Database
(LAND-deFeND)” (Napolitano et al., 2018) allows the storing of physical, geographical and socioeconomic data
on geohydrological hazards and their consequences with different levels of detail (from local to regional events).
There are not many procedures for post-flood damage assessment, basically owing to the limited need to eval-
uate the safety of buildings after such events.
A questionnaire developed after the 2002 Elbe flood in Germany (Thieken et al., 2005) addressed several topics:
flood warning, precautionary and emergency measures, flood impact, contamination and cleaning up, character-
istics of the affected households and related losses, flood experience and recovery, and socioeconomic charac-
teristics of residents. Still, the survey was conceived mainly with research objectives, to capture information to
improve capabilities to forecast damage. Collected data are stored in the German flood damage database (Krei-
bich et al., 2017) and have been used for empirical studies on flood damage to residential buildings (e.g. Thieken
et al., 2007, 2008; Merz et al., 2013). In Italy, the Reliable Instruments for Post-event Damage Assessment (RIS-
POSTA) procedure (Berni et al., 2017) was developed to survey flood damage to buildings, and more generally to
all exposed elements, in a multi-usability perspective (see the case study on the Umbria floods below).
Disaster loss data are available from a number of sources (e.g. CRED, n.d.; Munich Re, n.d.; Swiss Re, n.d.; UNDRR,
n.d.), including the Copernicus Emergency service (European Commission, 2016), which uses satellite and aerial
images to map damage after disasters, as shown in Figure 1 for the 2016 Amatrice earthquake. A comprehen-
sive picture of available tools for disaster data collection, storing and reporting can be found at the Risk Data
Hub (DRMKC, n.d.), developed by the European Commission Disaster Risk Management Knowledge Centre. The
Risk Data Hub is a web-based GIS tool to access and share curated risk data, tools and methodologies at local,
regional, national and European levels and covers a variety of natural hazards that may affect the residential
sector, namely flood, forest fire, earthquake, volcano, landslide, subsidence and cyclone.
3.2 Case study: the Umbria flood in 2012
Context
In November 2012, a severe flood occurred in the Umbria region (central Italy) after a widespread, high-intensity storm.
Flooding occurred with different features throughout the region, assuming the typical characteristics of riverine or
flash floods. Out of 92 municipalities, 58 were affected. The total losses amounted to EUR 115 million, corresponding
to 0.6 % of the regional GDP. After the event, a data collection campaign was performed by Politecnico di Milano,
with the support of the regional civil protection, the main objective being to understand the damage and its causes, to
identify criticalities and priorities for intervention. Data for the post-damage assessment were mostly acquired from
248CHAPTER 3 ASSETS AT RISK AND POTENTIAL IMPACTS
local authorities and utility companies, which collect such information for the purpose of compensation. Damage to
the residential and industrial/commercial sectors was surveyed in the field (Menoni et al., 2016).
Figure 2 shows the distribution of losses among the different sectors. As regards physical damage to the residen-
tial sector, collected data were analysed in terms of both damage and its explicative variables, as key information
for the understanding of damage mechanisms and causes. In particular, the following aspects were investigated:
structural and non-structural damage, water depth, velocity, sediment and contaminant loads at building loca-
tions, exposure/vulnerability of the buildings (materials, presence of basement, year of construction, etc.) and
mitigation actions taken by owners before or during the event. The analysis highlighted that the most damaged
component of buildings is plaster. Windows and doors were only damaged in long-lasting or high-velocity floods.
Floors were usually not damaged, except where materials were not waterproof (e.g. wood). Domestic electrical
plants were affected in most cases. Contents (furniture, appliances, etc.) were generally lost, apart from those
cases in which people were able to move them to a safer place after receiving flood warnings (Menoni et al.,
2016).
Figure 2: Distribution of losses among the different sectors after the 2012 flood in Umbria. Source: Menoni et al., 2016.
Besides repairing damage, costs were related to cleaning up and to the civil protection assisting evacuees. As
regards cleaning, the number of person-days declared by private residents varied between 1 and 30, depending
on the damage suffered by the building. In total, 95 families (about 300 people) needed to be evacuated because
houses were not habitable or accessible, for between 2 and 7 days, at a total cost for the civil protection of about
EUR 150 000. Finally, the loss of memorabilia has been highlighted as significant intangible damage by most
people living in damaged buildings (Politecnico di Milano e Regione Umbria, 2015; Menoni et al., 2016).
Lessons learned
The most important outputs of the campaign for disaster risk management were the following.The collection of
very detailed data on damage and its explicative variables for 52 residential buildings and 10 industrial/commer-
249cial buildings. Data on residential buildings were used for:
• carrying out a cost-benefit analysis of flood proofing and construction of flood barriers versus relocation,
leading to important recommendations on how to reduce the vulnerability of buildings (IDEA Project – De-
liverable D4, 2016), a procedure that can be easily applied to other areas;
• analysing damage mechanisms in support of the development of In-depth Synthetic Model for Flood
Damage Estimation (INSYDE), an expert-based model for the estimation of flood damage to residential
buildings, validated for the Italian context, but transferable to other regions (Dottori et al., 2016; Molinari
and Scorzini, 2017).
- The development of the RISPOSTA procedure (Ballio et al., 2015; Berni et al., 2017) for the collection of
damage/loss data to all exposed sectors after flood events. In particular, specific forms were created for
field surveys of residential and industrial buildings (see Table 2), filling a gap in the current state of the
art. RISPOSTA is now embedded into Umbria’s emergency management regulations.
- A model to assess event scenarios (Menoni et al., 2016) that offers a more comprehensive overview
of the different types of damage that may affect communities and territories as a consequence of
floods, and facilitates the understanding of causes of damage and its mitigation by reducing pre-event
vulnerabilities. In particular, the model supports (a) loss accounting and damage compensation at dif-
ferent spatial scales, (b) forensic investigation in support of the recovery phase and (c) validation and
calibration of improved damage and risk models. The model was applied to develop the complete event
scenarios of the 2012 and 2013 floods in Umbria (Politecnico di Milano and Regione Umbria, 2015,
2018). The application of such a common model facilitates comparison between events, geographical
regions and times.
Gaps and challenges
The experience highlights that the appropriate implementation of available risk management tools is the main
challenge for the prevention of flood damage to residential buildings. A first issue regards promoting the adoption
of floodproofing measures or the construction of flood barriers (both identified by the cost–benefit analysis as
effective). This can be done with public financial aid (e.g. incentives, subsidies, loans), by including requirements
in building codes for flood-prone areas, by reducing insurance premiums for owners adopting virtuous behaviours
and by increasing public risk awareness.
A second issue relates to the use of flood damage models (such as INSYDE) for the identification of risk mitiga-
tion strategies. The limited availability of the required data, their complex formulation and the high uncertainty
of their results prevent the implementation of such tools by decision-makers. The research community needs
to make efforts to develop more usable but still reliable tools and to support decision-makers in dealing with
uncertainty. To this end, a simplified and user-friendly version of INSYDE has been developed and validated in
the Flood-IMPAT+ (an Integrated Meso & micro scale Procedure to Assess Territorial flood risk) project (Galliani
et al. 2020).
The last challenge regards the prioritisation of strategies to mitigate the impact of flood events. Procedures such
as RISPOSTA re-engineer the whole process to provide a standardised framework for collecting damage and loss
data in the aftermath of flood events, optimise time and effort needed, improve the quality of data and produce
250CHAPTER 3 ASSETS AT RISK AND POTENTIAL IMPACTS
analytical reports of damage. Wider use and reuse of damage data are permitted when they are collected in a
systematic way, in line with the Sendai framework (UNISDR, 2015a). RISPOSTA proved effective in the 2012 floods
in Umbria, reaching a good level of commitment by private and public stakeholders.
Table 2. Information collected in RISPOSTA by means of the forms for damage to residential buildings Source: Molinari et al., 2014.
Form Section Description
1. General information Building location
Typology, period of construction, structure, footprint area,
2. Building features elevation, etc. to characterise exposure and vulnerability
A: General
information
Water depth and velocity, duration, sediment and
3. Flood event contaminant loads to characterise stress on the buildings
Identification of affected parts of the building: number of
4. Damage description housing units, attached buildings, common areas
1. General information Identification of property, affected floors, residents
B. Damage to Full characterisation of exposure, vulnerability, location and
housing unit stress on floor X
(for every 2. Damage to affected floor X Direct damage, e.g. to coating, plaster, windows, doors,
unit in the contents
building) (for every affected floor in the unit)
Indirect damage: loss of usability, clean-up cost
Mitigation actions
1. General information Description of affected floors
C. Damage
to common 2. Damage to affected floor X
areas Same as section B.2
(for every affected floor in the common
area)
1. General information Building location, identification of property
D. Damage
to attached 2. Building features Same as section A.2
building
(for every 3. Flood event Same as section A.3
attached
building)
4. Damage description Same as section A.4
2514 From single to multi-hazard risk assessment
Multi-hazard risk assessment supports more effective disaster resilience strategies
and better allocation of resources. Assessment methods should make use of
harmonised models to provide results with comparable metrics, enabling the
prioritisation of interventions.
Tackling natural and man-made hazards (including cascading effects) in a holistic way is essential to improve the
resilience of the built environment and effectively allocate resources for risk mitigation. Such an approach allows
the integration of multipurpose disaster risk reduction (DRR) and climate change adaptation (CCA) measures in
the planning of new developments, urban regeneration and retrofitting buildings, to address in a coherent way
the Sustainable Development Goals, the objectives of the 2015 Paris Agreement and the priorities of the Sen-
dai Framework. The different backgrounds of the disaster risk and climate change domains have limited so far
the establishment of an integrated methodological approach to DRR and CCA. Still, the recent path set by the
Intergovernmental Panel on Climate Change (IPCC, 2014) reconciles climate risk assessment with the scientific
framework in the field of risk science and theory of decisions (since UNDRO, 1980). Adopting this framework in
a multi-hazard perspective means standardising hazard characterisation, exposure and vulnerability analysis
methods (Marzocchi et al., 2009; Kappes et al., 2012; Garcia-Aristizabal et al., 2013), considering the similarities
illustrated in Table 1. From this perspective, the following recommendations are derived from several past Euro-
pean research projects.
1. Define the time and spatial frames for the analysis. The probability of disastrous events from multiple
hazard sources over the residential building’s life (50–100 years, considering new design or retrofit) de-
fines at the same time the potential expected damage and the type of DRR/CCA measures to implement to
reduce losses. The spatial extension of the analysis can be hazard driven or exposure/vulnerability driven.
In the first case, the multi-hazard characterisation gives information on the expected extent of the areas
potentially affected (e.g. local for climate extremes, local to regional for earthquakes, supra-regional for
volcanic eruptions), thus determining the areas to include in the analysis. In the second case, considerations
such as administrative jurisdictions, planning domains and specific retrofitting programmes can guide the
definition of spatial extent, in relation to the purpose of the assessment (e.g. assessing the multi-risk con-
ditions of all residential buildings in a region, to determine tax incentives for DRR/CCA).
2. Hazard characterisation needs to be performed by experts in the specific field, deriving different events’
probabilities of occurrence, magnitude, time and spatial extension, considering the future impact of climate
change. Cascading effects analysis requires to determine the probability of hazard transitions within possi-
ble chains of events (Zuccaro et al., 2018a).
3. Exposure assessment must include the collection of all relevant (georeferenced) information in rela-
tion to the vulnerability of buildings considered in the analysis, including their geometric, typological, mor-
phological, construction and performance features. This phase can take advantage of harmonised datasets,
which must be promoted in the future, including by benefiting from significant innovations in the field of
satellite surveys and big data analytics.
4. Vulnerability analysis represents the crucial step to build a reliable and flexible multi-hazard damage
model. Multi-hazard vulnerability assessment for residential buildings must integrate the different charac-
teristics that determine vulnerability to specific hazards, e.g. combining them in multi-hazard vulnerability
classes or treating them as dynamic vulnerability in cases of cascading effects (Zuccaro et al., 2018a). Few
studies have assessed the vulnerability of buildings in a multi-hazard context (Kappes et al., 2012) and
252CHAPTER 3 ASSETS AT RISK AND POTENTIAL IMPACTS
even fewer the changes in vulnerability due to the dynamic nature of the damaging process (El Mous-
saoui et al., 2017; Zschau, 2017), mainly because of the limited knowledge of process interactions and
the scarcity of observed damage data, and then because of model limitations. However, there is room for
improvement, as many of the vulnerability features are common to all hazards (subsection 2.2 above).
5. Risk assessment. Given the diversity of potential impacts of multiple hazards on the exposed ele-
ments, a major aspect to consider in multi-risk assessment is the need to develop common damage met-
rics across the different hazards considered. This allows (1) implementation of risk analyses and indexes
able to provide a synthesised view of the hazards affecting a given location, (2) quantification of the
expected impacts of single events, to compare the expected losses (Grünthal et al., 2006) from different
hazards with the same return period, and (3) calculation of the cumulative damage from cascading effect
scenarios on selected elements at risk (Junttila and Zuccaro, 2017), as shown in Figure 3. The output of
such analyses enables the identification of DRR/CCA priorities, by means of multi-criteria or cost–benefit
analysis tools (Garcia-Aristizabal et al., 2015; Zschau, 2017).
Figure 3. Cumulative damage on buildings due to a Sub-Plinian eruption in Nea Kameni, Santorini island. Source: Junttila and Zuccaro (2017).
Note: AF, ashfall; CF, failure of the communication network; EF, failure of the energy distribution system; EQ, earthquake; LS, landslide;
VG, volcanic gas emission; WF, failure of the water supply system.
5 Disaster risk prevention
Risk prevention is key to mitigate negative consequences of natural hazards.
Building codes that are effectively implemented, incorporate state-of-the-art
knowledge and consider the impact of climate change are instrumental to reduce
disaster losses. Insurance should be promoted to decrease the economic and
social impact of disasters.
5.1 Risk insurance
Risk insurance is a means to transfer risk, provide compensation for damage, incentivise risk reduction measures
253and shorten recovery time (Mysiak et al., 2017). Insurance schemes for residential buildings have been introduced
and redesigned in earthquake-prone countries after major disasters (Ranghieri and Ishiwatari, 2014; Başbuğ-Er-
kan and Yilmaz, 2015; CCS, n.d.; CEA, n.d.; EQC, n.d.) and similarly for floods (CCR, n.d.; CCS, n.d.; FEMA, n.d.; Flood
Re, n.d.). Governments, private insurers and public–private partnerships offer policies that cover damage to build-
ings and contents, emergency repairs and reconstruction, but their potential for mitigation has not been fully
exploited (Kousky, 2019). Insurance is obligatory in certain cases, e.g. for real estate sales and new homeowners
in Turkey, and often risk-related premium rates are offered (i.e. depending on the hazard at the location of the
building and the type of construction), with discounts for joint policies or for hazard-resistant buildings.
Despite being affordable, insurance is not widely used: the annual premium is 3 ‰ of the insured amount in
Tokyo, but fewer than 40 % of households in Japan are insured for earthquake (Ranghieri and Ishiwatari, 2014).
The number of policies is higher in areas of higher hazard, and it increases after major events, though many pol-
icies are not renewed (Başbuğ-Erkan and Yilmaz, 2015). Nonetheless, risk perception and damage of residential
properties after disasters lower market values and increase insurance premiums (e.g. Nakagawa et al., 2009;
Beltrán et al., 2018; Ortega and Taspınar, 2018).
Low-income households are less willing to purchase insurance, even after major disasters (Naoi et al., 2012), and
affordable public insurance may have the detrimental effect of encouraging further development of risk-prone
areas, where premiums would otherwise be very high. Moreover, middle- and high-income households abandon
properties in high-risk areas without appropriate or affordable insurance, which are subsequently rented by
low-income or otherwise marginalised social groups, leading to social segregation and possibly the creation of
ghettos. These processes may be rather quick, and urban planning plays a pivotal role.
5.2 Building codes and standards
Over the years, developed countries have successfully implemented effective regulatory frameworks and codes
for the safety of the built environment. In fact, in the last decade they have experienced 47 % of all disasters
globally, but have accounted for only 7 % of disaster-related fatalities (UNISDR, 2015b). On the other hand,
low- and middle-income countries have not been able to carry out such reforms, and many experience recurring
human and economic losses each time a disaster hits (World Bank, 2018). There are valuable lessons that can
be adapted to the needs of developing countries (see Box 1).
Risk-informed and affordable standards for the design and construction of buildings, e.g. the Eurocodes (Euroc-
odes, n.d.), that incorporate state-of-the-art scientific and technical knowledge have proven to be effective and
cost-efficient measures to mitigate disasters and build back better after major events. Equally important is a
regulatory system that is incrementally improved over time and takes into account the needs of disadvantaged
segments of the population (World Bank, 2015, 2018). This is also recognised in Priority 3 of the Sendai frame-
work (UNISDR, 2015a), which encourages the revision and development of building codes, focusing on the local
context and the capacity for implementation and enforcement.
Given the long working-life and economic value of buildings, it is essential that they are resilient to the future
impacts of changing climate (European Commission, 2013). In this context, adaptation of structural design to cli-
mate change is a key aspect to be considered in construction standards, at least for new structures, as intended
for the second generation of the Eurocodes.
254CHAPTER 3 ASSETS AT RISK AND POTENTIAL IMPACTS
BOX 1
Building safely to avoid damages
Building codes have contributed to making Japan one of the world’s most earthquake-resilient countries, as they
were incrementally improved and continually incorporated lessons learned from disaster experiences (World
Bank, 2018). Indeed, 97 % of buildings that collapsed during the 1995 Kobe earthquake had been built with old
codes, while those that complied with the most updated ones accounted for only 3 % (World Bank, 2015). In
2003 two earthquakes were recorded in Paso Robles (California) and Bam (Iran): the death toll in Paso Robles
was 2 as opposed to more than 40 000 in Bam (Kenny, 2009). Similarly, the extent of damage and collapse of
buildings during the two 2017 earthquakes in Mexico confirmed that structures built in accordance with anti-seis-
mic codes can better withstand ground-shaking events (Swiss Re, 2018)
6 Conclusions and key messages
Policymakers
Despite the significant scientific advances and the experience gained after past disasters, the application of mitigation
measures is still insufficient. The implementation of building codes that incorporate state-of-the-art knowledge and consider
the impact of climate change should be promoted by policymakers along with insurance schemes to decrease the economic
and social impact of disasters. To this end, it is important also to promote behavioural drivers for individual protection, in
order to encourage citizens in the adoption of virtuous behaviours.
Scientists
Models and methods for assessing the impact of natural hazards on residential buildings are conceptually similar but have
reached different levels of sophistication. Furthermore, many of the parameters that affect the vulnerability of buildings
are common to various hazards. There is therefore an opportunity for scientists to share the fragmented hazard-specific
knowledge and for developing methods for multi-risk assessment to increase the efficiency of integrated mitigation actions.
Such methods also require the definition of common metrics, spatial and temporal scales, and assessment thresholds
across hazards.
Policymakers, practitioners and scientists
The ageing building stock and society’s need for resilience – i.e. minimum disruption of activities and services, and speedy
recovery after a disaster – call for new technical solutions and policy tools. The lack of harmonised, good-quality data on
exposure and observed damage remains a major gap. To improve our capacity to assess and reduce losses, new devel-
opments are needed in the use of innovative and disruptive technologies (e.g. satellite and remote sensing, nature-based
solutions, machine learning and artificial intelligence) for collecting data, monitoring the condition of assets, and developing
dynamic models and tools for real-time decision-making (Zio, 2018; Zuccaro et al., 2018b). In this respect, shared effort by
practitioners, scientists and policymakers is welcome.
2553.3.2 Agriculture
Lead Author:
Andrea Toreti European Commission, Joint Research Centre
Contributing Authors:
Simona Bassu European Commission, Joint Research Centre
Dioniso Perez Universidad de Salamanca, Spain / Centro
Euro-Mediterraneo sui Cambiamenti Climatici
(CMCC), Italy
Fabian Capitanio University of Naples Federico II, Italy
Rodrigo Rudge Ramos Ribeiro Getulio Vargas Foundation, Brazil
Daniela Molinari Politecnico di Milano, Italy
Heidi Webber Leibniz Centre for Agricultural Landscape
Research, Germany
Toreti, A., Bassu, S., Perez Blanco, D., Capitanio, F., Ramos Ribeiro, R.R., Molinari, D., Webber, H., ‘Agriculture’, in: Casajus Valles, A., Marin
Ferrer, M., Poljanšek, K., Clark, I. (eds.), Science for Disaster Risk Management 2020: acting today, protecting tomorrow, EUR 30183 EN,
Publications Office of the European Union, Luxembourg, 2020, ISBN 978-92-76-18182-8, doi:10.2760/571085, JRC114026.
256CHAPTER 3 ASSETS AT RISK AND POTENTIAL IMPACTS
1 Introduction
.
Agriculture is a key socioeconomic sector of the EU, employing about 9.7 million people and with a regular labour
force of 20.5 million (many people help on farms without being employed; Eurostat, 2019). Some 10.5 million
farms manage 47 % of the total land area of the EU, most of them (96 %) being family farms and 66 % being
smaller than 5 ha (Eurostat, 2019). However, 51.6 % of the total EU agricultural economic output is produced by
just 2.9 % of farms (classified as agricultural enterprises). Crop and animal production contribute nearly equal
shares (56.3 % versus 43.7 %) to the total agricultural economic output (European Commission, 2019). The
former mainly comprises vegetables and horticulture, cereals, fruits and wine, while the animal output mainly
consists of meat, milk and eggs (European Commission, 2019).
In the EU, 28 % of the population lives in rural areas, with large differences between the Member States (from
0.3 % in Malta to 56 % in Lithuania; Eurostat, 2019). The number of farms has been steadily decreasing in
recent years (with estimated losses of up to 4.2 million farms since 2005; Eurostat, 2019); but the amount of
land used for agriculture has remained almost unchanged. Land abandonment, however, driven by agroclimatic-
environmental and socioeconomic conditions, represents a potential problem for 11 % of the EU’s agricultural
land (mainly arable, pasture and permanent crops) in the coming decade (Perpiña Castillo et al., 2018). The
agriculture sector faces many risks associated with climate variability and extremes, pests and diseases, market
volatility, socioeconomic crises and shocks. Unfavourable climate conditions, extreme weather and climate
events (such as storms, droughts, floods, frost, heat and cold waves) have severe impacts on agriculture (see for
example Lesk et al., 2016; Zampieri et al., 2017; Webber et al., 2018; Chavas et al., 2019), e.g. on crop yield, soil
erosion, livestock production and infrastructure.
The frequency and severity of extreme events have increased, and this increase is projected to continue in the
coming decades as a result of global warming (see for example Toreti et al., 2013, 2019a; Russo et al., 2014;
Alfieri et al., 2015, 2017). Drought as severe as in 2018 and heatwaves as intense as in 2003 could become
common occurrences by mid-century (Russo et al., 2014; Toreti et al., 2019a). Extreme precipitation events could
intensify by more than 30 % in some areas of Europe (Toreti et al., 2013).
At the same time the world’s population is expected to grow to 9.7 billion by 2050 (UN, 2019), increasing
agricultural demand and changing nutritional patterns (e.g. Tilman et al., 2011; Davis et al., 2016; FAO, 2017;
Gouel and Guimbard, 2019). Therefore, it is essential to study and better understand natural hazards and their
impacts on the agriculture sector.
The impacts of climate change, variability and extremes are and will be uneven across regions and countries. Al-
though elevated atmospheric CO2 concentration and warmer climate conditions during the growing season may
bring positive effects (especially in countries in mid-northern latitudes; Ciscar et al., 2018; FAO, 2018), concur-
rent and recurrent extremes may offset them and induce heavy losses as well as higher interannual variability.
The 2018 drought in Europe is an example of such an event (Toreti et al., 2019a). The impacts of extreme events
can be amplified (in terms of losses and damages), in particular in production systems that are not ready to
cope with them. Examples are systems characterised by low levels of agro-management (Zampieri et al., 2020;
Webber et al., 2014); lack of diversification (Lin, 2011); and lack of integration between production of crops,
crops and forests (Altieri et al., 2015; Lin, 2011). Optimal and sustainable management practices, technological
innovations and effective sectoral adaptation strategies can reduce the impacts of unfavourable climate condi-
tions and extremes. The sensitivity of each crop and region is different, and so are the mitigation and adaptation
strategies needed. Farmers represent a key component of the system for identifying and applying optimal solu-
257You can also read