Epistemic uncertainties and natural hazard risk assessment - Part 1: A review of different natural hazard areas - NHESS
←
→
Page content transcription
If your browser does not render page correctly, please read the page content below
Nat. Hazards Earth Syst. Sci., 18, 2741–2768, 2018
https://doi.org/10.5194/nhess-18-2741-2018
© Author(s) 2018. This work is distributed under
the Creative Commons Attribution 4.0 License.

Epistemic uncertainties and natural hazard risk assessment – Part
1: A review of different natural hazard areas
Keith J. Beven1,2 , Susana Almeida3 , Willy P. Aspinall4 , Paul D. Bates5 , Sarka Blazkova6 , Edoardo Borgomeo7 ,
Jim Freer5 , Katsuichiro Goda3 , Jim W. Hall7 , Jeremy C. Phillips4 , Michael Simpson7 , Paul J. Smith1,8 , David
B. Stephenson9 , Thorsten Wagener3,10 , Matt Watson4 , and Kate L. Wilkins4
1 Lancaster Environment Centre, Lancaster University, Lancaster, UK
2 Department   of Earth Sciences, Uppsala University, Uppsala, Sweden
3 Department of Civil Engineering, Bristol University, Bristol, UK
4 School of Earth Sciences, Bristol University, Bristol, UK
5 School of Geographical Sciences, Bristol University, Bristol, UK
6 T. G. Masaryk Water Resource Institute, Prague, Czech Republic
7 Environmental Change Institute, Oxford University, Oxford, UK
8 Waternumbers Limited, Halton Mill, Halton, Lancaster, LA2 6DN, UK
9 Department of Mathematics and Computer Science, Exeter University, Exeter, UK
10 Cabot Institute, University of Bristol, Bristol, UK

Correspondence: Keith J. Beven (k.beven@lancaster.ac.uk)

Received: 6 July 2017 – Discussion started: 21 August 2017
Revised: 7 September 2018 – Accepted: 24 September 2018 – Published: 24 October 2018

Abstract. This paper discusses how epistemic uncertainties         butional models, common in current practice, will underes-
are currently considered in the most widely occurring natural      timate the potential variability in assessing hazards, conse-
hazard areas, including floods, landslides and debris flows,       quences, and risks. A commonality across all approaches is
dam safety, droughts, earthquakes, tsunamis, volcanic ash          that every analysis is necessarily conditional on the assump-
clouds and pyroclastic flows, and wind storms. Our aim is to       tions made about the nature of the sources of epistemic un-
provide an overview of the types of epistemic uncertainty in       certainty. It is therefore important to record the assumptions
the analysis of these natural hazards and to discuss how they      made and to evaluate their impact on the uncertainty esti-
have been treated so far to bring out some commonalities           mate. Additional guidelines for good practice based on this
and differences. The breadth of our study makes it difficult       review are suggested in the companion paper (Part 2).
to go into great detail on each aspect covered here; hence the
focus lies on providing an overview and on citing key liter-
ature. We find that in current probabilistic approaches to the
problem, uncertainties are all too often treated as if, at some    1   Introduction
fundamental level, they are aleatory in nature. This can be
a tempting choice when knowledge of more complex struc-            With the increasing appreciation of the limitations of tradi-
tures is difficult to determine but not acknowledging the epis-    tional deterministic modelling approaches, uncertainty esti-
temic nature of many sources of uncertainty will compromise        mation has become an increasingly important part of natural
any risk analysis. We do not imply that probabilistic uncer-       hazards assessment and risk management. In part, this is a
tainty estimation necessarily ignores the epistemic nature of      natural extension of the evaluation of frequencies of hazards
uncertainties in natural hazards; expert elicitation for exam-     in assessing risk, in part an honest recognition of the limita-
ple can be set within a probabilistic framework to do just that.   tions of any risk analysis, and in part because of the recog-
However, we suggest that the use of simple aleatory distri-        nition that most natural hazards are not stationary in their
                                                                   frequencies of occurrence.

Published by Copernicus Publications on behalf of the European Geosciences Union.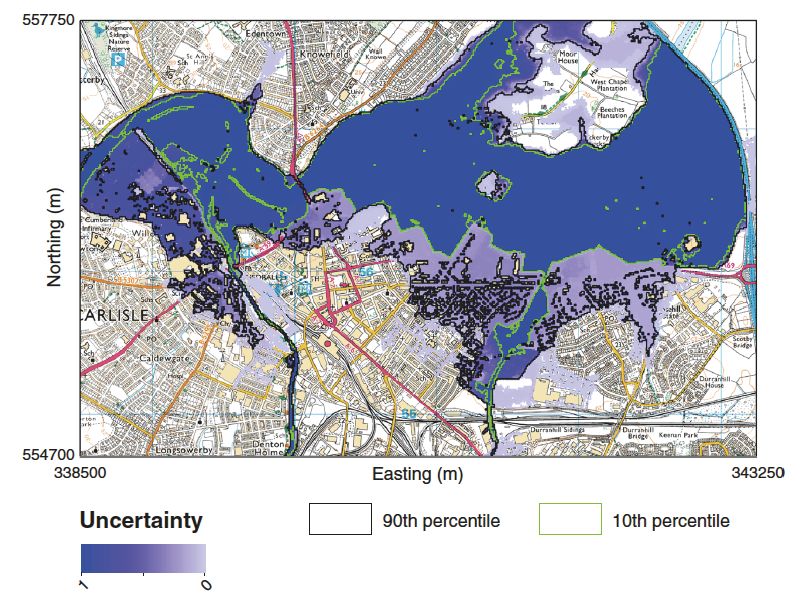
2742                                                     K. J. Beven et al.: Part 1: A review of different natural hazard areas

                                                                    ties” and they are now sometimes called “Knightian uncer-
                                                                    tainties”. While Knight’s thinking predated modern concepts
                                                                    and developments in probability theory (e.g. de Finetti, 1937,
                                                                    1974; Cox, 1946), the distinction between uncertainties that
                                                                    can be treated simply as aleatory and as additional knowl-
                                                                    edge uncertainties holds.
                                                                       An argument can be made that all sources of uncertainty
                                                                    can be considered as a result of not having enough knowl-
                                                                    edge about the particular hazard occurrence being consid-
                                                                    ered: it is just that some types of uncertainty are more ac-
                                                                    ceptably represented in terms of probabilities than others. In
                                                                    current parlance, these are the “aleatory uncertainties” while
                                                                    the Knightian real uncertainties are the “epistemic uncertain-
                                                                    ties”. Aleatory uncertainties represent variability, impreci-
                                                                    sion and randomness, or factors that can be modelled as ran-
                                                                    dom for practical expediency, which can be represented as
Figure 1. Hazard–magnitude–footprint–loss, illustrated by an ashy
                                                                    forms of noise within a statistical framework. Within epis-
volcanic eruption (© Jonty Rougier).
                                                                    temic uncertainties it is possible to subsume many other un-
                                                                    certainty concepts such as ambiguity, reliability, vagueness,
                                                                    fuzziness, greyness, inconsistency, and surprise that are not
   The consideration of uncertainty in risk assessments has,        easily represented as probabilities.
however, been relatively uncommon, particularly in respect             This distinction is important because most methods of
to the epistemic uncertainties, i.e. those that are not well        decision-making used in risk assessments are based on the
determined by historical observations and therfore represent        concept of risk as the product of a probability of occurrence
gaps in knowledge. In this review we discuss the impact of          of an event (the hazard, magnitude and footprint compo-
epistemic uncertainties on risk assessment and management           nents in the model cascade) and an evaluation of the con-
for different types of natural hazards. Throughout, we believe      sequences of that event (the loss component). If there are
it is important to think about the full hazard–magnitude–           important uncertainties in the assessment of the occurrence
footprint–loss setting (e.g. Rougier et al., 2013), which may       that are not easily assessed as probabilities, or if there are
be stakeholder specific (Fig. 1). This means that any risk          significant epistemic uncertainties about the consequences,
assessment involves a modelling cascade, each element of            then some other means of assessing risk decisions might be
which involves epistemic uncertainties, with the potential for      needed. Given the lack of knowledge, there is also plenty of
the uncertainty in risk to grow, or be constrained by addi-         opportunity for being wrong about the assumptions used to
tional data, within each component in the cascade (e.g. Beven       describe sources of uncertainty or having different belief sys-
and Lamb, 2014).                                                    tems about the representations of uncertainties (e.g. Marzoc-
   Probabilistic risk analyses typically assume – even though       chi and Jordan, 2014; Beven, 2016); hence testing the impact
they do not have to – that the different sources of uncer-          of the assumptions and choices made is becoming increas-
tainty can, at some fundamental level, be treated as random         ingly important (Pianosi et al., 2016). Epistemic uncertain-
or aleatory variables (and that all possible futures have been      ties are also sometimes referred to as “deep uncertainties” in
considered so that the probability assessments can be taken         risk analysis and natural hazards (e.g. Cox Jr., 2012; Stein
as complete). There is, however, an increasing appreciation         and Stein, 2013).
that this is not the only type of uncertainty that arises in such      For the practical purposes of this review, we will define
analyses across natural hazard areas (Hoffman and Ham-              epistemic uncertainty as those uncertainties that are not well
monds, 1994; Helton and Burmaster, 1996; Walker et al.,             determined by historical observations. This lack of determi-
2003; Brown, 2004, 2010; Van der Sluijs et al., 2005; Wa-           nation can be because the future is not expected to be like
gener and Gupta, 2005; Refsgaard et al., 2006, 2007, 2013;          the past or because the historical data are unreliable (imper-
Beven, 2009, 2012, 2013, 2016; Warmink et al., 2010; Stein          fectly recorded, estimated from proxies, or missing); because
et al., 2012; Rougier and Beven, 2013; Beven and Young,             they are scarce (because measurements are not available at
2013; Simpson et al., 2016; Mulargia et al., 2017; Almeida et       the right scale or long enough period); because the structure
al., 2017). In particular, since the time of Keynes (1921) and      of that uncertainty does not have a simple probabilistic form;
Knight (1921), it has been common practice to distinguish           or because we expect the probability estimates to be incom-
between those uncertainties that might be represented as ran-       plete (unbounded or indeterminable, e.g. Brown, 2004).
dom chance, and those which arise from a lack of knowl-                In what follows we consider the key sources and impact of
edge about the nature of the phenomenon being considered.           epistemic uncertainties in different natural hazard areas. We
Knight (1921) referred to the latter as the “real uncertain-        also recognize that different types of hazard mitigation strat-

Nat. Hazards Earth Syst. Sci., 18, 2741–2768, 2018                         www.nat-hazards-earth-syst-sci.net/18/2741/2018/
K. J. Beven et al.: Part 1: A review of different natural hazard areas                                                          2743

egy might have different sensitivities to the treatment of epis-      vides estimates of frequency as if the series of historical
temic uncertainties (e.g. Day and Fearnley, 2015). We see             floods is drawn from a stationary distribution, which is not
the typical audience of this opinion piece as a natural hazard        easily modified to allow for future change (e.g. Prudhomme
scientist who is likely aware of uncertainties in his/her own         et al., 2010).
specific hazard area, while having a limited understanding of             The epistemic uncertainty is then convolved into a ques-
other hazard areas and of the approaches available to deal            tion of what statistical distribution should be used. This ques-
with epistemic uncertainties. Our aim is to discuss how epis-         tion has often been resolved by institutionalizing the uncer-
temic uncertainties have been recognized and treated in the           tainty into a particular choice of standard distribution. Dif-
different hazard areas, to bring out some commonalities and           ferent countries have chosen different distributions and, in
differences. It is difficult to go into great detail on each aspect   some cases, have changed that choice over time. There are
covered here; hence the focus is on providing an overview             good theoretical reasons to choose the generalized extreme
and on citing key literature. In the second part of the pa-           value (GEV) distribution. Asymptotically a sample of ex-
per we discuss the different opinions about the options for           tremes with independent occurrences in successive time pe-
addressing epistemic uncertainty and we discuss open prob-            riods (e.g. years) from an arbitrary underlying distribution of
lems for implementing these options in terms of what might            events should have the form of the GEV distribution. It was
constitute good practice (Beven et al., 2018).                        the distribution of choice for the analysis of annual maxi-
                                                                      mum floods in the UK Flood Studies Report (NERC, 1975).
                                                                      However, the time series available for the analysis of floods
2     Floods                                                          are often relatively short, so the asymptotic condition may
                                                                      not be approached, and the occurrences of events may not be
2.1    Floods and key epistemic uncertainties
                                                                      independent in time or space (e.g. Eastoe and Tawn, 2010;
Floods account for about one-third of all economic losses             Keef et al., 2013). Thus, in revising the UK methodology in
from natural hazards globally (UNISDR, GAR 2015). The                 the Flood Estimation Handbook, a change was made to rec-
frequency and magnitude of flood disasters is likely to in-           ommend the Generalized Logistic Distribution as it resulted
crease with a warming atmosphere due to climate change and            in fewer sites being assigned parameters that suggested some
with increased exposure of a growing population (Winsemius            upper limit to flood magnitudes (IH, 1999). Many other dis-
et al., 2016), which suggests that the fractional contribution        tributions have been used elsewhere. A recent development
to global disaster losses is likely to increase even further.         in flood risk management has been concerned with the joint
There are five aspects of flood risk assessment that involve          occurrences of flood events, rather than looking at individ-
important epistemic uncertainties. The first is the assessment        ual sites independently. This requires specifying not only one
of how much rainfall or snowmelt input occurs (either in past         distribution but joint distributions and the correlation struc-
or future events); the second is the frequency with which such        ture between them (e.g. Keef et al., 2013), but which may not
events might occur and how that might be changing; the third          be well defined by historical data.
is how much of that input becomes flood runoff; the fourth is             The choice of a particular distribution essentially controls
the footprint of the flood inundation; and the fifth is the as-       the form of the upper tail of the distribution and consequently
sessment of either past or potential damages (see discussion          the assessment of risk. This is common to the other natural
in Sect. 11 below). These all apply in the assessment of ex-          hazards that are considered below. Good practice suggests
pected damages for events of different magnitude for making           that the statistical uncertainty associated with the tail of the
decisions in managing the flood risk and in the management            fitted distribution should be evaluated (although this is rarely
of flood incidents in real time (e.g. Sayers et al., 2002).           reported even where it is provided by the analysis software),
                                                                      but essentially we have additional epistemic uncertainties as
2.2    Uncertainty quantification in flood hazard                     to which distribution to choose and whether to treat that dis-
       estimation                                                     tribution as stationary or whether clusters of events might
                                                                      come from some more complex stochastic structure (e.g.
In the context of flooding, uncertainties in inputs and runoff        Koutsoyiannis, 2003, 2010; Montanari and Koutsoyiannis,
generation are often avoided by estimating the probability            2012). If this is the case, then it might result in a signifi-
of exceedance for different magnitudes of event in terms of           cant increase in the range of uncertainty relative to classical
an extreme value distribution of discharges. That does not            statistical analysis (e.g. Koutsoyiannis and Montanari, 2007)
mean that such uncertainties are not important (such as lack          irrespective of other sources of epistemic uncertainty.
of knowledge about the effects of a poorly known spatial pat-             These issues have led some people to return to considering
tern of inputs on runoff generation, the role of antecedent           the inputs and runoff generation over a catchment more di-
conditions in controlling runoff generation, or estimates of          rectly in flood risk estimation. This approach was pioneered
historical flood peak discharges), only that they are assumed         by Eagleson (1972) using a simple derived distribution model
to contribute to some underlying statistical distribution of          of runoff generation, but increased computer power has al-
events that is fitted to the available historical data. This pro-     lowed continuous simulation over long periods of time us-

www.nat-hazards-earth-syst-sci.net/18/2741/2018/                             Nat. Hazards Earth Syst. Sci., 18, 2741–2768, 2018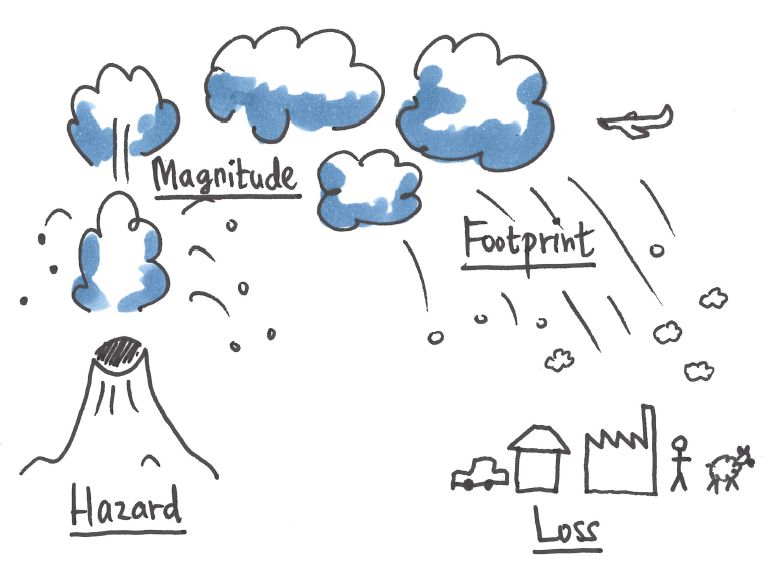
2744                                                    K. J. Beven et al.: Part 1: A review of different natural hazard areas

ing rainfall-runoff models, which has the advantage that the
variation in antecedent wetness of a catchment prior to an
event is part of the simulation (e.g. Beven, 1987; Cameron et
al., 1999, 2000; Lamb and Kay, 2004; Blazkova and Beven,
2004, 2009; Wagener et al., 2004). In some cases it is pos-
sible to use long series of observed rainfall data to simulate
discharges, but for the very long series that are needed to es-
timate more extreme events it is necessary to use a stochastic
model of the inputs (similar to the weather generators used
to produce future sequences in climate change impact assess-
ments). However, this only shifts the epistemic uncertainty
issue of the choice of appropriate distributions or more com-
plex stochastic structures for the space–time characteristics
of rainfall (e.g. Chandler et al., 2014). The extreme events
generated from such a weather generator depend on the tails
of the assumed distribution(s) and there will again be epis-
                                                                   Figure 2. Uncertainty in inundation extent resulting from simula-
temic uncertainty about what type of distribution to use, even
                                                                   tions of the flood with annual exceedance probability of 0.01, river
where rainfall series are longer than discharge records.           Eden valley in the vicinity of Carlisle, Cumbria, UK. The uncer-
   A further advantage of the continuous simulation approach       tainty scale results from a behavioural ensemble of LISFLOOD-FP
is that the weather generator can be modified to represent         inundation models with different parameters sets, weighted accord-
future climates (e.g. Cameron et al., 2000; Wilby and Des-         ing to fit to the 2005 flood outline, and driven by realizations from
sai, 2010; Prudhomme and Davies, 2009; Prudhomme et al.,           the joint distribution of peak discharges in the river Eden and the
2010), and that input data might be more readily available         Caldew and Petteril tributaries (from full details see Neal et al.,
for sites for which there are no discharge records (the pre-       2013).
diction in ungauged basins problem, Wagener et al., 2004;
Blöschl et al., 2013; Hrachowitz et al., 2013). This latter case
still requires that the parameters of a rainfall-runoff model be   of conditioning process (e.g. Fig. 2; see also other examples
specified. This is also an epistemic uncertainty issue, even if    in Beven et al., 2014).
extrapolations from gauged sites are often made using sta-            Recent improvements in flood inundation modelling have
tistical regression or pooling group methods (e.g. Lamb and        been less a result of reducing uncertainties in inputs and hy-
Kay, 2004); a process that will be influenced by model struc-      draulic parameters, but rather due to reductions in uncer-
tural uncertainty and other uncertainty sources (e.g. McIn-        tainties in topography as lidar surveys have become more
tyre et al., 2005; Wagener and Wheater, 2006). Experience          widely available or in land surface properties through re-
in predicting the flood characteristics in this way has been       motely sensed information (e.g. Wood et al., 2016). How-
somewhat mixed; successful in some basins, but with signifi-       ever, lidar cannot identify all the barriers to flow on a flood
cant over or underestimation in others (Lamb and Kay, 2004;        plain (e.g. Sampson et al., 2012). A further issue can be that
Blöschl et al., 2013). Improvements to such methods might          effective hydraulic parameters identified for one magnitude
still be possible but epistemic uncertainty will remain a con-     of event might not hold for a larger magnitude event (e.g.
straint on accuracy.                                               Romanowicz and Beven, 2003), which would introduce epis-
   Further uncertainties arise in the estimation of the foot-      temic uncertainty. It is also common to assume that the effec-
print of the flood event. There may be different areas at risk     tive parameters are spatially constant which, when interact-
of inundation according to whether the risk is from pluvial,       ing with other sources of uncertainty, might mean that it is
fluvial, coastal, or groundwater flooding. By making assump-       not possible to get good fits for inundation observations ev-
tions about various sources of uncertainty in the modelling of     erywhere in the modelled domain (e.g. Pappenberger et al.,
inundation, a (Monte Carlo based) forward uncertainty anal-        2007; Savage et al., 2016).
ysis can be used to predict uncertainties in inundation areas         In many situations, flooding is constrained by the exis-
and depths (e.g. Berry et al., 2008). In some cases, histor-       tence of natural levees or artificial flood defences. Such de-
ical flood mapping is available that can be used to condi-         fences are always associated with a residual risk of being
tion hydraulic models of inundation and constrain the uncer-       overtopped and/or failing, a risk that will vary due to fac-
tainty in model predictions (Bates et al., 2014). The gener-       tors including construction methods, programme of mainte-
alized likelihood uncertainty estimation (GLUE; Aronica et         nance, and unauthorized modifications (van Gelder and Vri-
al., 1998; Romanowicz and Beven, 2003; Pappenberger et al.,        jling, 2014). These are all subject to epistemic uncertainties
2007; Neal et al., 2013; Beven et al., 2014; Beven and Lamb,       but are often dealt with through using fragility curves that
2014) and more formal Bayesian methods (Romanowicz et              give a probability of failure as a function of water level (e.g.
al., 1996; Hall et al., 2011) have both been used in this type     Lamb et al., 2017). Although expressed in terms of probabil-

Nat. Hazards Earth Syst. Sci., 18, 2741–2768, 2018                         www.nat-hazards-earth-syst-sci.net/18/2741/2018/
K. J. Beven et al.: Part 1: A review of different natural hazard areas 2745
ities, such fragility curves are often treated as deterministi- Dams (ICOLD, 1995) has estimated that some 0.5 % of all
cally known (Gouldby et al., 2010). dams failed in the period 1951–1986. The most fatalities es-
timated are for the failure of several dams in Henan Province
2.3 Uncertainty quantification in real-time flood in China in 1975 which killed an estimated 171 000 people
management and destroyed the houses of 11 million people.
Multiple causes that are subject to epistemic uncertainties
In flood incident management, epistemic uncertainties might (e.g. hydrological forcing, landslides upstream, poor design,
lead to deterministic predictions being biased, even where or poor maintenance) make dam failures difficult to predict,
models of flood discharges and extent of inundation have and most countries take a highly precautionary approach to
been calibrated for past events. This is usually handled in regulating for dam safety. Dams and spillway channels for
one of two ways. Traditionally it was handled by the experi- large dams are commonly designed to cope with the estimate
ence and expertise of the flood forecasters who would make of the flood with an annual exceedance probability of 0.0001.
subjective adjustments to model outputs available to them as This is a much smaller probability than for designing nor-
an event progressed and more information became available. mal flood defences, because of the potential consequences
In doing so they would qualitatively allow for perceived epis- of a failure, but means that such estimates are dependent on
temic uncertainties based on past experience. This approach epistemic uncertainties in estimating such tail probabilities.
is still used in many countries. An extension of this approach In addition, the greatest forcing might not come from the
is to base estimates of the uncertainty in model predictions highest flood peak if it is of short duration, but from the in-
based on the performance of the model in past events. A flow volume associated with an event of longer duration but
method such as quantile regression can be used for this sit- smaller peak. One way of assessing such effects is to run a
uation (López López et al., 2014). The problem for both ap- continuous simulation model and examine the impact of the
proaches is that past experience may not be a good guide to most extreme events generated over with long realizations
the peculiarities of a new event. (e.g. Blazkova and Beven, 2009). The continuous simulation
A different strategy is to assume that all uncertainties can approach means that the antecedent conditions prior to any
be treated statistically and use a data assimilation approach event are handled naturally, but clearly the outputs from such
to correct for over or under-prediction as the event proceeds. simulations are dependent on the epistemic uncertainties as-
Techniques such as the Kalman filter, or stochastic autore- sociated with all the model components, including the tail as-
gressive modelling, can be used with the advantage that an sumptions for the driving distributions, the choice of rainfall-
estimate of the variance of the forecast can also be updated runoff model, and the estimation of model parameters given
at the same time (see, for example, Sene et al., 2014; Young the historical data.
et al., 2014; Smith et al., 2012, 2013a). No explicit account Predicting the downstream footprint of a dam failure and
of potential epistemic uncertainties is normally made in this the consequent threat to life and potential damage can also
approach; the aim is only to improve the forecast and min- be difficult. There are hydraulic models available designed
imize the forecast variance at the required lead time as new to cope with the high discharges and sharp wave fronts ex-
data become available for assimilation. The approach will of- pected with a dam failure (Cao et al., 2004; Xia et al., 2010),
ten work well when the required lead time is less than the but the application in any real case study will depend on the
response time of the upstream catchment so that the data as- epistemic uncertainty associated with the characteristics of
similation can rely on measured inputs. It works less well in a breach in the dam acting as an upstream boundary con-
flash flood situations in small catchments with short response dition for the hydraulic model and the momentum losses in
times so that forecasts of the inputs are needed to produce a the downstream area as a highly sediment-laden fluid inter-
forecast with reasonable response time (Alfieri et al., 2011; acts with the valley bottom infrastructure and vegetation. It
Smith et al., 2013b; Yatheendradas et al., 2008). Rainfall is also difficult to verify the outputs of such a model (though
forecasts from numerical weather prediction (NWP) models see Hervouet and Petitjean, 1999; Begnudelli and Sanders,
are still not sufficiently accurate for this purpose but are now 2007; and Gallegos et al., 2009; for examples of field scale
used routinely (such as in the European Flood Awareness validation), while predictions of velocities, as well as depths,
System hosted at ECMWF, Bartholmes et al., 2009; De Roo will be important in assessing the consequences.
et al., 2011) for providing flood alerts some days ahead.
2.4 Floods and the safety of dams 3 Landslides and debris flows
The safety of dams is an interesting example of a hazard 3.1 Landslides and key epistemic uncertainties
that involves both natural forcing and engineering design, but
one in which the consequences of failure can be catastrophic. Globally, landslides are directly responsible for several thou-
Lists of dam failures (e.g. Vogel, 2001) show that such events sand deaths per year (Petley, 2012). A widely cited example
are not common, but the International Commission on Large is that of the Welsh village of Aberfan, where a flowslide
www.nat-hazards-earth-syst-sci.net/18/2741/2018/ Nat. Hazards Earth Syst. Sci., 18, 2741–2768, 20182746 K. J. Beven et al.: Part 1: A review of different natural hazard areas
from a colliery spoil tip killed 144 people, 116 of whom effects of spatial heterogeneities, and additional factors such
were children, at the Pantglas Junior School in October 1966 as root strength (Christian et al., 1994; Rubio et al., 2004;
(Johnes, 2000). More recently, the Gansu mudslide, which Hall et al., 2004; Hürlimann et al., 2008; Hencher, 2010).
occurred after heavy rain in August 2010 in China, killed Although spatial variability of soil properties has been rec-
an estimated 1765 people. However, despite the large risks ognized as an important source of epistemic uncertainty in
posed by landslides, the ability of research to guide and in- the literature (e.g. El-Ramly et al., 2002; Griffiths and Fen-
form management decisions is limited by high levels of un- ton, 2004), it has often been ignored in previous analyses us-
certainty in model assessments of slope stability. In landslide ing limit equilibrium methods. The use of constant values for
risk assessment epistemic uncertainties arise from a range of soil properties over soil deposits may lead to unreliable esti-
sources, including errors in measurement data, gaps in the mates of the probability of failure of a slope (El-Ramly et
understanding of landslide processes and their representation al., 2002; Griffiths and Fenton, 2004; Cho, 2007; Griffiths et
in models, and from uncertain projections of future socio- al., 2009). To account for this source of uncertainty in slope
economic and biophysical conditions (Lee and Jones, 2004). stability problems, some investigators combine limited equi-
librium methods with random field theory (e.g. Cho, 2007).
3.2 Uncertainty quantification in landslide hazard Random field theory allows soil properties to be described by
estimation a randomly generated distribution, instead of a single value
across the entire modelled space.
Landslide risk can be assessed qualitatively or quantitatively. The finite-element method has the added advantage of be-
The choice depends on the scale of work (national, regional, ing capable of simulating water flow and coupled hydrome-
local or site-specific), and also on the quality and quan- chanical behaviour under saturated and unsaturated condi-
tity of data available. For site-specific slopes, physically tions (Alonso et al., 2003; Gens, 2010). Time-varying bound-
based deterministic models centred on slope stability anal- ary conditions to simulate the effect of rainfall and vegetation
ysis are commonly used to assess the probability of landslide can be used (e.g. Nyambayo and Potts, 2010). Even at sites
occurrence. Stability conditions are generally evaluated by where the costs of extensive field investigations can be justi-
means of limit equilibrium methods, where the available soil fied, there is much that remains unknown about the subsur-
strength and the destabilizing effect of gravity are compared face, including the detail of water flow pathways and knowl-
in order to calculate a measure of the relative stability of the edge of the hydromechanical behaviour of soils. Understand-
slope known as the factor of safety. The limit equilibrium ing the trade-off between data support, model complexity,
method relies on significant simplifications, such as that the and predictive uncertainty is therefore crucial.
failing soil mass is rigid, the failure surface is known, and To accommodate uncertainty caused by parameter vari-
the material’s failure criterion is verified for each point along ability in both limit equilibrium and finite-element methods
this surface. These simplifications limit both accuracy and of analysis, Monte Carlo simulation and/or the first-order–
applicability. Epistemic uncertainties related to the limited second-moment (FOSM) method are commonly used (e.g.
understanding of system processes and functioning can lead Christian et al., 1994; Wu and Abdel-Latif, 2000; Haneberg,
to large errors in such model predictions. For example, in 2004; Cho, 2007). These methods consider the uncertainties
1984, an embankment dam in Carsington, England, slipped, introduced by the inputs in different ways. Monte Carlo sim-
despite the fact that limit equilibrium analysis had indicated ulation starts by repeatedly sampling from the probability
that the slope was not expected to be at risk of failure. This distributions of the random variables. A deterministic com-
discrepancy has been shown to be caused by epistemic errors, putation on each of generated input set is performed and the
as brittle soils may exhibit strain-softening behaviour when factor of safety is calculated. Subsequently, the aggregated
loaded, leading to progressive failure, a phenomenon which results of all sets provide an approximation of the probability
cannot be reproduced using conventional limit equilibrium distribution of the factor of safety. Alternatively, the FOSM
stability analyses. For this type of soil, finite element anal- method can be used to estimate the probability of slope fail-
ysis using appropriate numerical algorithms and constitutive ure. This probabilistic method determines the stochastic mo-
models are required to achieve a more accurate prediction of ments of the performance function. As the input variables are
stability, which means that better accounting of process un- randomly distributed, the performance function is also ran-
certainty can sometimes be remedied by more detailed mod- domly distributed, which the FOSM method characterizes in
elling (Potts et al., 1990). terms of its mean and standard deviation. In both methods,
All physically based slope stability models are subject therefore, the uncertain parameters are treated as aleatory
to epistemic uncertainties in both the constitutive relation- variables.
ships chosen and the parameter values required by those re- Detailed slope stability models require geotechnical infor-
lationships. Parameter variability is often assessed by making mation on site conditions that can be prohibitively costly
small scale laboratory measurements of parameters, such as to obtain and so tend to be employed only in small ar-
cohesion and coefficient of friction but the resulting values eas for cases where high risk is anticipated, while simpler
may not be directly applicable on a large scale because of the strategies might suffice in many straightforward cases. Over
Nat. Hazards Earth Syst. Sci., 18, 2741–2768, 2018 www.nat-hazards-earth-syst-sci.net/18/2741/2018/K. J. Beven et al.: Part 1: A review of different natural hazard areas 2747 large and complex areas, where the use of detailed physi- possibility of limited information concerning a real system, cally based models is not feasible, statistical and data-driven fuzzy-based risk assessment models have been suggested in models relating the probability of spatial landslide occur- the literature (e.g. Ercanoglu and Gokceoglu, 2002; Lin et al., rence (i.e. susceptibility) and local geo-environmental con- 2012). For example, based on a landslide inventory database, ditions (e.g. geological, topographical and land-cover con- Ercanoglu and Gokceoglu (2002) applied factor analysis to ditions) are used instead (e.g. Guzzetti et al., 1999, 2005, determine the important weights of the factors condition- 2006; Ercanoglu and Gokceoglu, 2002). These models have ing landslides in the area (slope angle, land use, topograph- become standard in landslide susceptibility assessment at a ical elevation, dip direction of movement, water conditions, regional scale (Corominas et al., 2014). By estimating where and weathering depth). Fuzzy-set theory is then applied, ac- the slope is most likely to fail (but not the recurrence of fail- counting for the judgemental uncertainty (fuzziness, vague- ure, i.e. the temporal frequency or magnitude of the expected ness, imprecision) introduced by the way experts approach landslide), these models can be of great help in land-use plan- the problem. In a rule-based fuzzy model, the fuzzy prepo- ning, guiding planners in the delimitation of suitable areas for sitions are represented by an implication function (e.g. “If future development. Guzzetti et al. (2006), for example, es- slope angle is very low then landslide susceptibility is non- tablished for the Collazzone area, Italy, a landslide suscepti- susceptible”) commonly called fuzzy if-then rules or fuzzy bility model through discriminant analysis by finding a com- conditional statements. The fuzzy if-then rules are then used bination of predictor variables that maximizes the difference to produce a fuzzified index map for each factor conditioning between the populations of stable and unstable slopes with landslides. These maps are thereafter combined (by overlay- minimal error. The generalization of a very complex prob- ing) to produce a landslide susceptibility map. lem into a relatively simple statistical model, necessarily in- In the context of long-term landslide risk management, as troduces errors in model predictions, arising from errors in for other natural hazards fields, such as floods or earthquakes, the predictors used to establish the model, uncertainty in the the probability of exceedance is often calculated for differ- classification of the terrain units, etc. ent sizes of events in terms of an extreme value distribution. Despite the above discussed limitations of more complex This approach has advantages over a simulation-based anal- models for landslide risk studies, computational advance- ysis, the results of which may be affected by uncertainties ments do make the use of mechanistic models more feasible in input forcing data. However, this does not mean that un- for future applications – even when considering uncertainty certainties in factors contributing to landslides are ignored and when running the model over regional scales. Almeida in probabilistic estimates of landslide risk. Instead, proba- et al. (2017) demonstrated this possibility by applying the bilistic estimates implicitly account for input uncertainty by widely used CHASM model (Holcombe et al., 2012) within a fitting a statistical distribution of events to available histori- Monte Carlo (MC) framework. The MC framework allowed cal data. As in the case of floods, the epistemic uncertainty for the consideration of uncertainties due to poorly defined is convolved into a question of what statistical distribution geophysical slope properties, which is particularly problem- should be used and how uncertainty in the tail behaviour atic for developing regions such as the study’s Caribbean is estimated. Probabilistic models such as binomial model, island location where data support is poor, but hazard risk Poisson model (Crovelli, 2000) and the power-law distribu- is especially high. More importantly, Almeida et al. (2017) tion (Hungr et al., 1999; Dussauge-Peisser et al., 2002) have demonstrated how epistemic uncertainty can be considered been suggested in the literature to estimate the frequency (or as well. The uncertainty considered originated from a lack return period) of landslides of a given size. of knowledge about how intensity–duration–frequency (IDF) curves might vary under future climate change. Such IDF 3.3 Uncertainty quantification in real-time landslide curves provide the design rainfall used by engineers in slope warning systems failure risk assessments. Almeida et al. (2017) used a bottom- up approach in which (in this case) a classification and re- In the context of real-time warning systems, slope failure gression tree (CART) was developed to identify how much is commonly estimated by establishing landslide-triggering the design rainfall has to change before specific slopes be- thresholds of the initiating agent. The application of trigger- come significantly more likely to fail (for a more general ing thresholds has been used, for example, in early warn- discussion of such an approach see Ray and Brown, 2015). ing systems in areas prone to rainfall-induced landslides, by Hence, while future rainfall intensities are unknown, this in- establishing relationships between landslide occurrence and formation still enables engineers to assess which slopes are rainfall indicators, such as antecedent rainfall, duration, in- at a higher risk of being impacted than others. tensity and cumulative rainfall (Aleotti, 2004; Cepeda et al., Another large source of uncertainty affecting the assess- 2012). An empirical model between rainfall and landslide ment of landslide susceptibility is often introduced by the un- initiation has been used to issue warnings during the storms avoidable imprecision with which experts approach a prob- of 12 to 21 February 1986 in the San Francisco Bay Area lem, given limited information. To account for the uncertain (Keefer et al., 1987). Since information regarding data qual- and inexact character of the available information and for the ity is often lacking, one common way to deal with uncer- www.nat-hazards-earth-syst-sci.net/18/2741/2018/ Nat. Hazards Earth Syst. Sci., 18, 2741–2768, 2018
2748                                                   K. J. Beven et al.: Part 1: A review of different natural hazard areas

tainty involves tracing the rainfall threshold curves that cor-   recorded observations, which may arise for instance from
respond to different percentiles and then deciding on a mini-     missing data or incomplete and short records (Hong et al.,
mum threshold satisfying some performance criterion (e.g.         2014; Hu et al., 2014). However, the information content of
rainfall threshold curve established so that includes 90 %        such indices can be low as rainfall or groundwater levels are
of the historical events; Aleotti, 2004). Nevertheless, epis-     not the sole drivers of drought impacts. By contrast, more
temic uncertainty introduced by lack of knowledge on land-        complex indices such as PDSI and the crop moisture index
slide occurrence can be significant. For example, Gariano et      provide a more applicable representation of drought, but with
al. (2015) show that even a small (1 %) underestimation in        more sources of potential uncertainty due to multiple data
the number of the considered landslides can result in a sig-      sources, parameterizations, and model structures imposed by
nificant decrease in performance of an early warning system.      the indices. For instance, the Palmer drought severity index
                                                                  or the crop moisture index assume that land use and soil prop-
                                                                  erties are uniform over large spatial scales, which makes it
4     Droughts                                                    difficult to accurately identify the spatial extent affected by
                                                                  a drought (Narasimhan and Srinivasan, 2005). Parameter un-
4.1    Droughts and key epistemic uncertainties
                                                                  certainty in some drought indices is rarely considered when
Drought has the potential to cause widespread fatality and        characterizing drought, yet it has been shown to play a sig-
economic damage, particularly when a drought event might          nificant role in the identification of major drought events and
last for years or even decades (van Loon et al., 2016a, b). As    in the derivation of relevant drought statistics (Samaniego
with floods, droughts may be characterized either in terms        et al., 2013).
of their natural severity or their impacts. The definition of        Under specific local conditions, shortage of rainfall can
drought depends on the type of water deficit being considered     have an influence on water availability for human use at a
(rainfall, stream flow etc.). Drought follows the hydrological    regional scale within 4 months (Marsh et al., 2007). Long
cycle, as precipitation deficits (meteorological droughts) lead   droughts can be difficult to characterize as multiple periods
to low soil moisture levels (agricultural/soil drought) and       of drought can be interrupted by wet weather events, with-
decreased river flows (hydrological drought) which in turn        out sufficient rainfall arriving to restore water storage. Ac-
may lead to lowering of reservoir levels and water shortages      knowledging this, long drought events such as the 1890–
(socioeconomic drought). Drought periods associated with          1910 drought in England and Wales and the Millennium
high temperatures may also have cascading impacts such as         drought in Australia can be pernicious, gradually depleting
the large number of excess deaths in Europe in the sum-           water stored in aquifers and reservoirs. Historically, drought
mer of 2003 (Robine et al., 2008). Unlike many other haz-         indices and other water availability metrics such as deploy-
ards, droughts other than in their most meteorological defi-      able output (DO) in the UK have been presented without
nitions are co-creations of human and environmental effects,      associated quantification of uncertainty. This is unfortunate,
in which the hazard–footprint–loss chain is non-linear. Epis-     both in terms of the complexity of the calculation of such
temic uncertainties in drought risk assessments stem from         figures and because these terms are widely adopted by le-
unknown future climate conditions, from unknown future            gal and regulatory systems. Recently, a risk-based approach
water demand scenarios and lack of knowledge about how            has been proposed by Hall et al. (2012). Under this ap-
society might respond to long-term droughts, from low-flow        proach, probabilistic uncertainties are considered explicitly
measurements with poorly understood errors, and from struc-       within the model and simulations are based on environmen-
tural errors in hydrological models used to assess the im-        tal time series, allowing metrics such as the probability of
pact of potential future rainfall deficiencies altered by cli-    water shortages to be determined. This allows uncertainties
mate change (Singh et al., 2014). Epistemic uncertainties in      to be examined simultaneously – conditional on the time se-
estimates of drought-related consequences and losses stem         ries used to inform the model being representative of those
from the scarcity of data on and the difficult valuation of the   driving the real system. As with other hazard areas, defin-
impact and damage induced by water shortages.                     ing the probabilities required may also be subject to lack of
                                                                  knowledge.
4.2    Uncertainty quantification in drought hazard                  Estimation of stream flow, and in particular low flows, is
       estimation                                                 essential for hydrological drought analysis, thus the choice of
                                                                  methods to model and estimate low-flow characteristics can
Drought hazard is widely assessed using indices, such as          introduce epistemic uncertainties in drought risk assessment.
the standardized precipitation index (SPI) or Palmer drought      Distributions fitted to low flows are susceptible to bias in-
severity index (PDSI). The most straightforward of these          troduced by the fitting methodology and distribution choice
consider single environmental variables, such as precipita-       (Ries and Friesz, 2000). Uncertainty is introduced in obser-
tion (SPI) or groundwater level (Standardized Groundwa-           vations because many river gauging methodologies are espe-
ter Index, Bloomfield and Marchant, 2013). In such cases,         cially poor at recording low flows (Barmah and Varley, 2012;
sources of uncertainty are restricted to the reliability of       Tomkins, 2014; Coxon et al., 2015). As gauging methods

Nat. Hazards Earth Syst. Sci., 18, 2741–2768, 2018                       www.nat-hazards-earth-syst-sci.net/18/2741/2018/
K. J. Beven et al.: Part 1: A review of different natural hazard areas 2749 record proxy observations of flow, epistemic uncertainty in within the range of the UKCP09 scenarios. Epistemic uncer- functional relationships (i.e. changes in channel cross sec- tainties arising from emissions scenarios and climate model tion or vegetation affecting the correlation between stage choice has been addressed using a similar approach by Paton and discharge) is likely to have a relatively greater effect et al. (2013). on the absolute errors of low-flow observations (Tomkins, Although climate models may provide information about 2014; McMillan and Westerberg, 2015). While there is sig- future drought risks, there are issues here about how far nificant attention paid to information-rich events such as re- current climate models can reproduce the type of block- cession rates following flood events, the assumption that re- ing high-pressure conditions that lead to significant droughts cession parameters determined in this way are optimal for in Europe. Consequentially, the probabilities of multi-year determining the hydrology of extended low-flow series is not droughts under future climates will almost certainly be valid (Prudhomme et al., 2012, 2013). Hydrological mod- poorly estimated. In this context, the historical periods of els, which are routinely applied to model low-flow occur- 1933–1934 and 1975–1976 in the UK are still used as ex- rence and to characterize hydrological drought duration and treme cases for water resource planning purposes. This is deficits in response to particular climatological conditions, a form of precautionary approach that does not require any also introduce epistemic uncertainty in drought risk assess- estimate of probability associated with that event, but one ments. For example, Duan and Mei (2014) have shown that which involves some epistemic uncertainty about whether a hydrological model structural uncertainty induces large dif- more extreme event might occur in future. Worst-case sce- ferences in drought simulation, while Hartmann et al. (2017) nario approaches have been applied by Kasprzyk et al. (2009) demonstrated that fluxes connecting surface and groundwater and Harou et al. (2010) to assess drought risk and evaluate are often modelled with insufficient process realism in large- drought management strategies in water resource supply sys- scale hydrologic models, the scale where drought assessment tems undergoing change when human interventions modify is most relevant. vulnerability in a risk-based analysis, in addition to any cli- Drought risk can be characterized using metrics of drought mate changes (Mechler et al., 2010). duration and intensity (the deficit of water during a drought event), or the joint probability of a sequence of reduced flow events either in isolation or in combination with a water sup- 5 Earthquakes ply system model to assess future drought risk. Drought du- ration is indicative of drought severity rather than directly 5.1 Earthquakes and key epistemic uncertainties responsible for consequence in itself, as a long period of low flow is not necessarily worse than a short, sharp drought. In- Predicting earthquake occurrence is difficult, especially large tensity can be considered a more robust metric of shortage seismic events in the very near future. Recently, the 2011 as deviation from a threshold state can develop as a con- Tōhoku earthquake in Japan has highlighted that estimation sequence of brief periods of extreme shortfall, longer mild of the maximum magnitude of mega-thrust subduction earth- shortfall or some combination of the two. Both these meth- quakes involves significant epistemic (“deep”) uncertainty ods are sensitive to the identification of a threshold, which related to segmentation of seismic sources and maximum can be non-stationary due to environmental factors. Autocor- magnitude (Stein et al., 2012; Kagan and Jackson, 2013), relation in drought series can be difficult to identify due to the which can lead to the gross underestimation of earthquake requirement of capturing both the different temporal scales scenarios. In a rather different scenario, during the 2010– (daily, annual) and the continuous range of low flows, as cor- 2011 Christchurch sequences in New Zealand, the complex relation in Q99 events may be independent from correlation behaviour of interacting fault systems caused clustering of in Q95 events. multiple major events in the Canterbury region that also re- Epistemic uncertainties related to future climate condi- sulted in major economic impact. Generally, earthquake haz- tions influence drought risk assessment for water resource ards are influenced by the stochastic nature of earthquake oc- planning purposes. A number of studies have investigated currence and their size as well as by uncertainties in ground forward uncertainty analysis of the potential impacts of cli- motions at sites of interest, which are contributed to by un- mate change on droughts (e.g. Wilby and Harris, 2006). Bor- certainties in source, path, and site characteristics. gomeo et al. (2014) developed a risk-based method to in- A standard approach for characterizing potential future corporate epistemic uncertainties related to climate change earthquakes is probabilistic seismic hazard analysis (PSHA; in water resources planning and to assess drought and Cornell, 1968; McGuire, 2001, 2004). PSHA was an engi- water shortage risk in water supply systems. This risk- neering endeavour to develop a set of seismic hazard esti- based method incorporates climate change epistemic uncer- mates for aiding the revision and implementation of seismic tainty by sampling the United Kingdom Climate Projec- design in national building codes, using numerical methods tions’ (UKCP09) change factor distribution. Sampling dif- that reflected limitations in the computing power of the time. ferent vectors of change factors allows for exploration of In PSHA, key uncertainties related to earthquake occurrence some degree of epistemic uncertainty in the future climate, in time and space, earthquake magnitude, and ground mo- www.nat-hazards-earth-syst-sci.net/18/2741/2018/ Nat. Hazards Earth Syst. Sci., 18, 2741–2768, 2018
2750                                                      K. J. Beven et al.: Part 1: A review of different natural hazard areas

tion prediction are all captured. However, in the past, ma-          the condition tree of analysis assumptions outlined by Beven
jor earthquakes have often been surprises, indicating that our       and Alcock (2012). Nevertheless, major difficulties arise be-
knowledge is not perfect and that some of the probabilistic          cause not all models, which analysts wish to apply are based
assumptions were inappropriate. We learn new things from             on consistent data or assumptions, and the probabilities of al-
these events and are sometimes required to revise theories           ternatives in the logic tree are often poorly known, unknown,
and pursue alternative frameworks in the light of new obser-         or unknowable (Bommer, 2012; Stein and Stein, 2013).
vations (e.g. Mulargia et al., 2017).                                   Thus, in practice, given these epistemic sources of uncer-
                                                                     tainty, it is not a trivial task to assign weights to individual
5.2    Uncertainty quantification in earthquake hazard               branches of the constructed logic tree and, often, resorting
       estimation                                                    to expert elicitation is the only practical solution. For major
                                                                     industrial facilities (e.g. dams and nuclear power plants), the
PSHA takes into account numerous earthquake sources and              development of the logic tree is often carried out according
scenarios and integrates their contributions probabilistically       to the Senior Seismic Hazard Analysis Committee (SSHAC)
as if all variables considered are aleatory in nature. Out-          guidelines for using expert advice (Budnitz et al., 1997). In
puts from PSHA are provided in various forms, such as site-          the face of epistemic uncertainties and a wide spread in ex-
specific hazard curves for safety-critical facilities and a re-      perts’ opinions, special care is essential to avoid the inflation
gional hazard contour map. The contour map shows expected            of elicited uncertainties and parameter distributions (Aspinall
ground motions (e.g. peak ground acceleration and spectral           and Cooke, 2013).
accelerations) across a wide area or region at a selected an-           Two of the critical elements in PSHA, which are linked but
nual exceedance probability level (typically 1 in 500 to 1 in        are both subject to considerable epistemic uncertainties, are
10 000).                                                             the estimation of long-term occurrence rates of large earth-
   Representations of uncertainties in PSHA. PSHA involves           quakes and the evaluation of the maximum magnitude for
various types and sources of uncertainties, and thus it is cru-      use in a PSHA, for a given seismotectonic environment. On
cial to adopt an adequate mathematical framework to han-             occasion, the upper bound of the maximum magnitude may
dle uncertainties as probabilities for individual model com-         not be constrained either physically or statistically (Kagan
ponents and their dependency (Woo, 2011). Physically, these          and Jackson, 2013). The difficulty simply stems from the
uncertainties can be associated with earthquake occurrence           fact that records of seismicity data are insufficient to derive
processes in time and space, seismic wave propagation, and           such long-term occurrence rates reliably, solely from histor-
seismic effects on structures and socioeconomic systems.             ical catalogues or instrumental databases. The quality, com-
PSHA also allows the identification of critical hazard sce-          pleteness, and reliability of an earthquake catalogue evolves
narios at different probability levels through seismic disag-        over time, affected by the distribution of human settlements
gregation (McGuire, 2004). This essentially closes the loop          and the way in which major events in the historical record
between probabilistic and deterministic seismic hazard ap-           have been reported or recorded, by advances in measurement
proaches, which are complementary in nature (McGuire,                technology and, more recently, the wider geographical cov-
2001). The deterministic scenario approaches (e.g. Zuccolo           erage of seismographic networks. This often results in inho-
et al., 2011) allow the use of more definitive models and data,      mogeneous detection and monitoring capabilities of instru-
but without attempting to associate a probability with a given       mental catalogues (Tiampo et al., 2007), which need to be
scenario. For evaluating seismic risk impact to safety-critical      accounted for in evaluating earthquake occurrence rates. In
facilities and infrastructure, both approaches should be im-         addition, new information from terrestrial and ocean geodesy
plemented and should also be accompanied by rigorous sen-            (McCaffrey et al., 2013; Bürgmann and Chadwell, 2014) will
sitivity analysis.                                                   help constrain seismic hazard estimates derived from PSHA.
   Epistemic uncertainties arise both in the choice of struc-           Epistemic uncertainties in earthquake occurrence charac-
ture for the component models and in the effective values            terization. Estimating frequency of occurrence of events for
of the parameters necessary. As with the other natural haz-          an individual fault or fault system and their magnitudes is
ards, this means that when model predictions are compared to         highly uncertain and depends strongly on assumptions (Mur-
observational data the prediction errors can have a complex          ray and Segall, 2002). In particular, it is difficult to deter-
structure that may not be simply aleatory. In PSHA, repre-           mine the continuity of fault segmentation (Shen et al., 2009).
sentations of alternative hypotheses and assumptions for in-         In such cases, different hypotheses regarding the rupture be-
dividual model components are often framed with a logic tree         haviour of the fault system may be represented by branches
approach (Kulkarni et al., 1984), and the final estimates of         of a logic tree. Recent PSHA studies for potentially active
seismic hazard parameters are obtained by integrating rele-          but less well-instrumented seismically active regions (e.g. the
vant uncertain model components and by weighting of alter-           East African Rift) have extended the modelling basis for re-
native assumptions. A benefit of using a logic tree, despite its     gional seismicity beyond historical and instrumental earth-
simplicity, is the transparency in characterizing epistemic un-      quake catalogues by using information from mapped geo-
certainties. In this regard, the logic tree approach is similar to   logical faults and geodetically determined rates of strain ac-

Nat. Hazards Earth Syst. Sci., 18, 2741–2768, 2018                           www.nat-hazards-earth-syst-sci.net/18/2741/2018/
You can also read