Litter and Informing Action
←
→
Page content transcription
If your browser does not render page correctly, please read the page content below
A Global Platform for Monitoring Marine
      Litter and Informing Action

                                          Draft version: 18 May 2020

Emily Smail1,2,3, Jillian Campbell4, Daniel Takaki2,3, Hans-Peter Plag2,5, René Garello2,6, Samy
Djavidnia2,7, José Moutinho8, Ghada El Serafy9,10, Alessandra Giorgetti11, Matteo Vinci11, Maria
  Eugenia Molina Jack11, Kate Larkin12, Dawn J. Wright13, Francois Galgani14, Konstantinos
         Topouzelis15, Stewart Bernard16, Anne Bowser17, Guido Colangeli18, Linwood
Pendleton2,19,20,21,22, Leah Mupas Segui2,3, Llorenç Milà i Canals4, Morgan Simpson23, Armando
                           Marino23, Imanol Zabaleta24, Malcolm Heron25

1University   of Maryland Earth System Science Interdisciplinary Center, College Park, MD, USA
2GEO      Blue Planet, College Park, Maryland, USA
3NOAA/NESDIS/SOCD,          College Park, Maryland, USA
4UN    Environment (UNEP), Nairobi, Kenya
5Department of Ocean, Earth and Atmospheric Sciences and Mitigation and Adaptation
Research Institute, Old Dominion University, Norfolk, VA, USA
6TELECOM-Bretagne,      France
7European     Marine Safety Agency, Lisbon, Portugal
8AIR   Centre (Atlantic International Research Centre), Portugal
9Deltares,   Delft, The Netherlands
10Technical    University of Delft, The Netherlands
11OGS     (Istituto Nazionale di Oceanografia e di Geofisica Sperimentale), Trieste, Italy
12EMODNET,       Oostende, Belgium
13Esri,   | Redlands, CA, USA
14IFREMER,      Bastia, France
15Department     of Marine Sciences, University of the Aegean, Greece
16CSIR,    Cape Town, South Africa
17Woodrow      Wilson International Center for Scholars13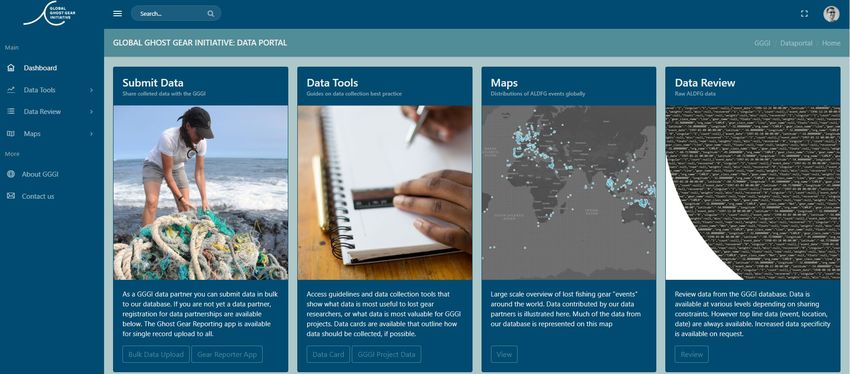
18EOGround Segment Infrastructure and Operations Management Division, Directorate of Earth
Observation Programmes, Frascati (RM) Italy14
19WWF,     Washington DC, USA15
20Ocean    Data Foundation and REV Ocean, Oslo, Norway
21IUEM/LABEXMER,       Brest, France17
22Global   Change Institute, University of Queensland, Brisbane, Australia18
23The   University of Stirling Biological and Environmental Services, Stirling, UK19
24RWA    Group, Zürich, Switzerland
25James    Cook University, Townsville, Australia

                                                                                         ii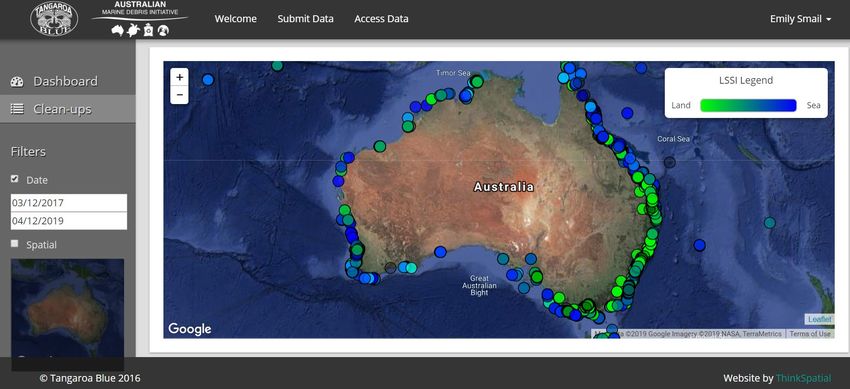
Table of Contents

Background and context ............................................................................................................... 1

Section 1: Monitoring technologies ............................................................................................... 4

Section 2: Existing marine litter databases and major datasets ................................................. 21

Section 3: Indicators and Applications of Technologies .............................................................. 32

Section 4: Monitoring the plastics value chain ............................................................................ 45

Section 5: Existing and Developing Global Data Platforms ........................................................ 52

Section 6: Proposed Features of a Global Platform and Required Resources ........................... 60

Section 7: Marine Litter in a Digital Ecosystem for the Environment – Thought on A Pilot
Project ......................................................................................................................................... 66

Section 8: Future Developments ................................................................................................. 69

References.................................................................................................................................. 71

                                                                                                                                                 iii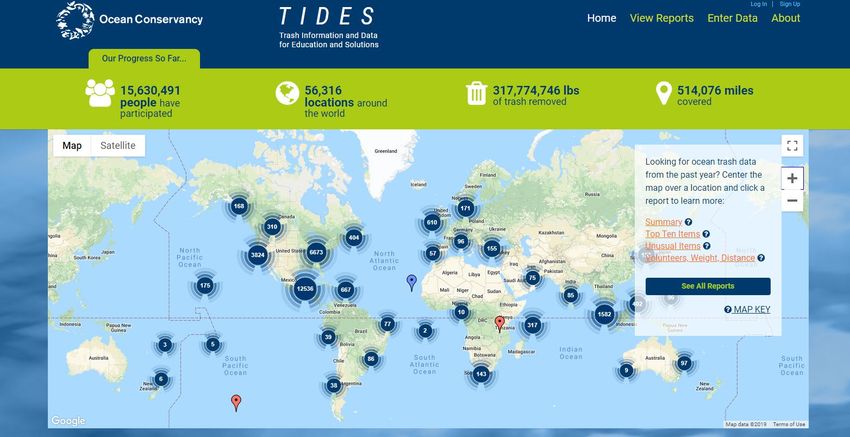
List of Tables
Table 1. Size categories for routine marine litter monitoring (GESAMP, 2019) ............................ 4
Table 2. Technology readiness levels (NOAA, 2017) ................................................................... 4
Table 3. Advantages and disadvantages for extracting and purifying microplastics in organic
matrices (GESAMP, 2019) ............................................................................................................ 7
Table 4. Summary of technology for marine litter monitoring ..................................................... 17
Table 5. Monitoring parameters for marine plastic litter to track progress against SDG Target
14.1 (UN Environment, 2019). .................................................................................................... 43
Table 6. SDG Targets and Indicators Related to a Life-cycle Approach………………………….56
Table of Figures
Figure 1. Research articles published about marine litter and sub categories of marine litter:
beach litter, ingestion and entanglement, seabed and seafloor, water column, and sources of
marine litter. Data was collected using a Web of Science search and analysis from 1990-2019.
.................................................................................................................................................... 21
Figure 2. Results of the survey conducted for this paper about marine litter databases and
datasets. Participants provided information about their main areas of focus of data collection
and analyses were in regards to marine litter. ............................................................................ 22
Figure 3. The Marine Debris Monitoring and Assessment Project Database (MDAMP v.2.0.18,
viewed on November 20, 2019). ................................................................................................. 23
Figure 4. The Marine LitterWatch Data Viewer (viewed on November 20, 2019). ...................... 24
Figure 5. The Deep-sea Debris Database (viewed on November 20, 2019) .............................. 25
Figure 6. Map showing the locations of data collected for the COASST program as of 2018
(Image credit: Hillary Burgess). ................................................................................................... 26
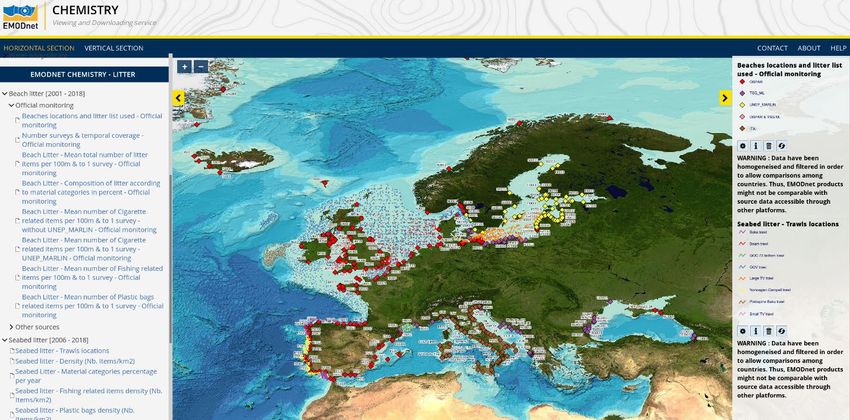
Figure 7. The EMODNET Chemistry – Litter viewing and downloading service. Map showing the
location of beaches (legenda specify the different reference lists used to describe litter items)
and seafloor litter surveys (legenda specify the different sampling gears used during the
surveys) (viewed on November 25, 2019). ................................................................................. 27
Figure 8. The Australian Marine Debris Initiative Database (viewed on December 3, 2019)...... 28
iv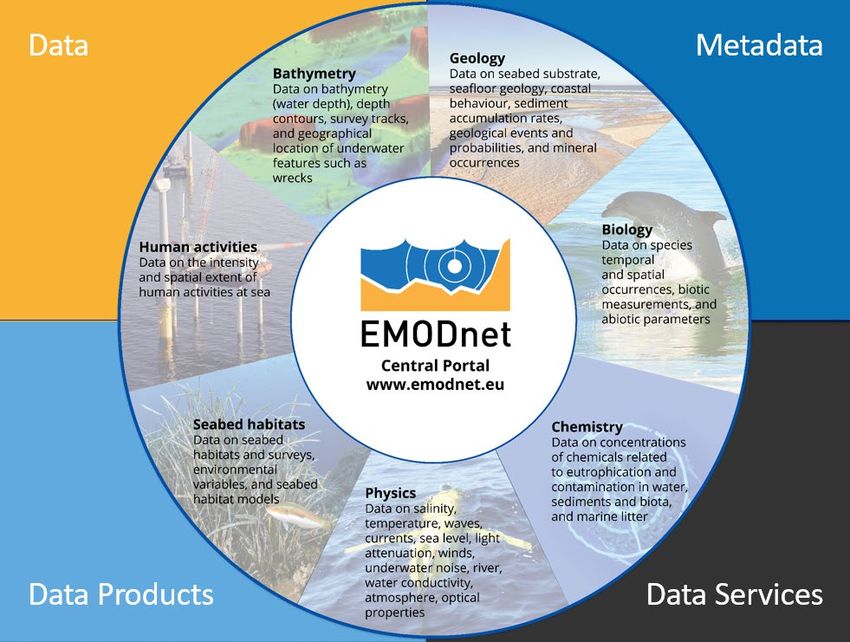
Figure 9. The Trash information and Data for Education and Solutions Database (viewed on
December 3, 2019) ..................................................................................................................... 29

Figure 10. Global map of litter distribution in Litterbase (Image source: https://www.maritime-
executive.com/article/ocean-litter-portal-established) ................................................................. 30

Figure 11. The Global Ghost Gear Initiative Data Portal (viewed on December 3, 2019). ......... 30

Figure 12. Contribution of various sources to total primary microplastic emissions (a) and the
amounts entering the aquatic environment (b) in mainland China in 2015. Source: Wang et al.,
2019. ........................................................................................................................................... 38

Figure 13. Losses of microplastics and macroplastics to the environment (marine, freshwater,
and terrestrial compartments) by polymers and plastic applications (when exact plastic (or
polymer) types cannot be identified). Source: Ryberg et al. (2019) ............................................ 46

Figure 14. Global plastic life cycle value chain estimated losses to the environment for the year
2015. Source: Ryberg et al. (2019) ............................................................................................. 46

Figure 15. Losses of macroplastics and microplastics to the environment (all marine, freshwater,
and terrestrial compartments combined) characterized according to region and loss sources.
Losses from maritime activities like fishing or shipping, and losses from building industry and the
transportation sector could not be assigned to specific regions and are only indicated in the
global estimates. (p) is loss during production stage, (u) is loss during use stage, (e) is loss
during end-of-life stage. Source: Ryberg et al. (2019) ................................................................ 47

Figure 16. Plastic and Steel Containers and Packaging Waste Management in the Untied States
from 1960 – 2017. ....................................................................................................................... 51

Figure 17. Components of the GEOSS Platform. ....................................................................... 53

Figure 18. The Conceptual Architecture of ODIS (Spears et al., 2017) ...................................... 55

Figure 19. EMODnet open access marine data, metadata and data products across seven
thematic areas. Data and web services offer unique ways to discover, visualize, download and
work with marine data. ................................................................................................................ 57

Figure 20. The Living Atlas of the World includes over 7000 ready-to-use datasets, maps and
apps for empowering many environmental data systems. Partners with and contributors to the
Atlas include NOAA, the Marine Conservation Institute, the European Space Agency,
NatureServe, GRID-Arendal, and the UN Environment Programme World Conservation
Monitoring Centre. ...................................................................................................................... 58

Figure 21. Digital elements that could facilitate a digital ecosystem for the environment. From
Campbell and Jensen (2019a). ................................................................................................... 67

                                                                                                                                                  v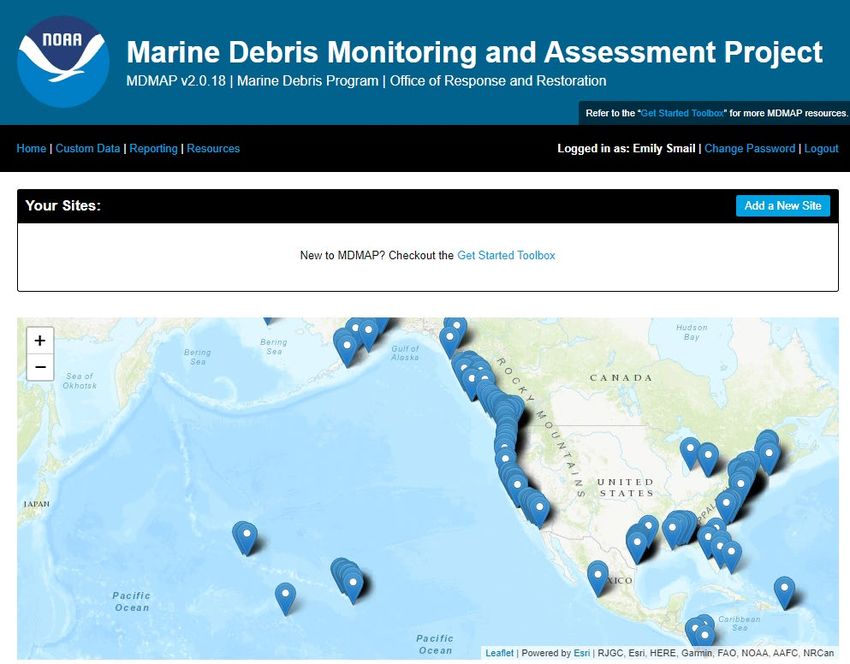
1   Background and context
 2   Marine litter is “any persistent, manufactured or processed solid material discarded, disposed of
 3   or abandoned in the marine and coastal environment”. All the world's oceans and seas, even in
 4   remote areas far from human contact, contain marine litter due to its transboundary nature. The
 5   continuous growth in the amount of solid waste thrown away and the slow rate of degradation of
 6   most items are together leading to a gradual increase in marine litter found at sea, on the sea
 7   floor and coastal shores. It has become an economic, environmental, human health and aesthetic
 8   problem posing a complex and multi-dimensional challenge.

 9   Marine plastics are of particular interest due to the fact that in the last 50 years, plastic production
10   has increased more than 22-fold while the global recycling rate of plastics in 2015 was only an
11   estimated 9% (Geyer et al., 2017). This rise in plastic production and unmanaged plastic waste
12   has resulted a growing threat to marine environments with an estimated 5-13 million tons of plastic
13   from land-based sources ending up in marine environments annually (Jambeck et al., 2015).

14   The UN Sustainable Development Goals recognize the importance of marine plastics through a
15   target related to marine litter (SDG target 14.1) and in four UN Environment Assembly resolutions
16   (from UNEA-1 in 2014, UNEA-2 in 2016, UNEA-3 in 2017 and UNEA-4 in 2019). However, there
17   are large gaps in knowledge in terms of understanding marine litter and microplastics: a reliable
18   figure for the volume of plastics entering the ocean, the accumulated volume of plastics in the
19   marine environment, mapping of the source and sink location of plastics, and basic data on
20   microplastics are currently lacking. There is a need to use existing data from remote sensing,
21   citizen science, and in situ monitoring to better understand marine litter and microplastics;
22   however, much of the research in this field is at an initial stage and only data related to beach
23   litter is available in many regions (UN Environment, 2018).

24   Sustainable Development with Goal 14, Target 14.1 recognizes the consistent need for monitoring
25   and reporting of marine litter: “by 2025, prevent and significantly reduce marine pollution of all
26   kinds (…)”. This target provides a deadline for progress on reducing marine litter and further
27   informed by SDG indicator 14.1.1b, “plastic debris.” UN Environment is proposing four core sub-
28   indicators for SDG 14.1.1b:

29           1) Plastic debris washed/deposited on beaches or shorelines (beach litter)

30           2) Floating plastic debris and debris in the water column

31           3) Plastic debris on the seafloor/seabed

32           4) Plastic ingested by biota (e.g. sea birds) (optional).

33   Despite the growing interest in monitoring the above areas, there is a wide range of non-
34   comparable monitoring approaches that limits the development of indicators and spatial or
35   temporal assessments (Galgani, Hanke & Maes, 2015). The focus of this paper is on the
36   monitoring of marine litter, not on the sources and pathways of marine litter. This is only one part
37   of the picture as these measures only capture the accumulation of plastics and do not cover
38   marine litter more broadly, do not cover microplastics, and do not cover the sources and pathways
39   for marine litter. In order to effectively monitor, manage, and avoid the generation of marine litter,
40   there is a need to consider the following:

                                                                                                           1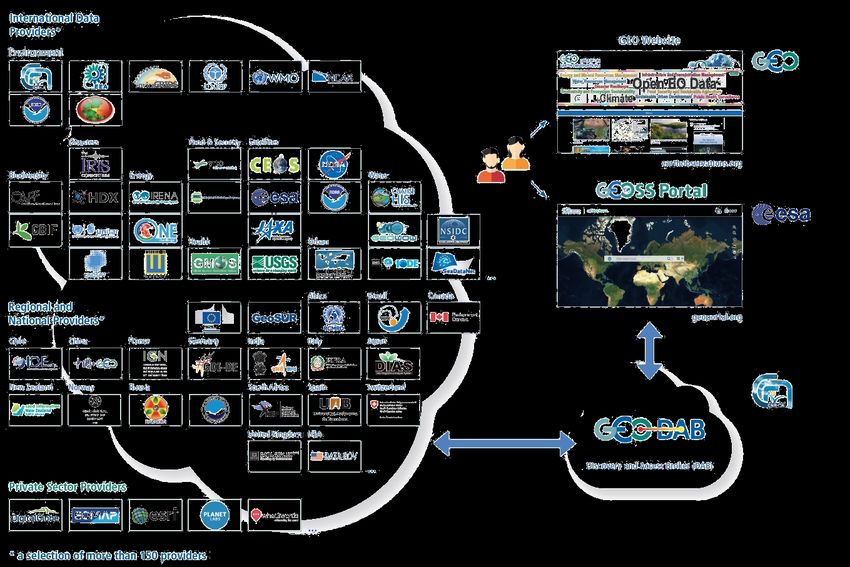
41      -   Plastic flow: How marine litter moves in the marine environment in a way that allows
42          tracking the origin of plastic pollution is
43      -   Life-cycle approach: Monitoring should encompass not only the amounts of plastic
44          already in the ocean, but quantify flows and stocks of plastic across the life cycle of plastic-
45          using products. This requires a holistic approach assessing production and use /
46          consumption practices across the life cycle of products.
47      -   Waste management practices: Leakages in the waste management system, illegal
48          dumping, and leakages in the recycling process are a leading contributor to marine litter.
49          The SDGs capture waste management as an important contributor to marine litter.
50      -   Plastic in waterways: There is a lack of information on how plastic and microplastics
51          move through rivers, sewage systems and other waterways to end up in the marine
52          environment.
53      -   Plastic types: There is a need to track plastics and microplastics by type of plastic,
54          including plastic related e-waste and chemicals (and toxicity) in plastics. It is not possible
55          to get a complete picture of marine litter without information on what can be recycled and
56          what has chemicals.
57      -   Consumer awareness: Communication of information and data must builds public
58          awareness so that consumers can make informed decisions.
59      -   Microplastics: Understanding the sources of microplastics and the impact of
60          microplastics on human health is a priority.
61      -   Trade-offs: Understanding when a specific alternative to a plastic product is better or
62          worse than the use of plastics is a challenge. Life Cycle Assessment (LCA) is the tool best
63          suited for such purpose, although it still does not incorporate indicators for the impacts of
64          marine litter. Without considering LCA results alongside marine litter indicators, it is difficult
65          to provide policy advice that would result in benefits and not costs to human health and
66          the environment.

67   Marine litter observation is currently very sparse, and as a result, there is a knowledge gap about
68   the biological and physical process that transport plastics through marine ecosystems and
69   potentially to humans (Katija et al. 2017). Therefore, any quantitative approach to integrating
70   source and dispersion/accumulation dynamics must take a multidisciplinary approach combining
71   forward or inverse hydrodynamic or dispersion models with multisource Earth observation data.

72   While standardized methods for monitoring marine litter will greatly improve the understanding of
73   the marine litter, development and reporting of indicators will require integrated and comparable
74   data. Currently, peer-reviewed journals and databases hosted by NGOs and government
75   authorities hold much of the data on marine litter. As suggested by Galgani, et al. (2015) and
76   Maximenko et al. (2019), a joint international database would facilitate the collection of data for
77   marine litter indicators and improve standardization and comparability. Such a database would
78   also support policy decisions related to the reduction of marine litter and support analysis of the
79   efficacy of mitigation efforts.

80   This paper outlines a concept for the development of a global data platform for marine litter
81   including the vision, feasibility, potential structure and funding needed. This paper will further
82   discussions on developing a long-term project in support of such a platform that could be hosted
83   on the UNEP World Environment Situation Room. This paper is organized into eight sections:

84   Section 1 provides a summary of existing and developing monitoring technology.

                                                                                                            2
85   Section 2 provides a summary of existing marine litter databases and major published datasets.

86   Section 3 explores indicators for monitoring marine litter.

87   Section 4: explores life cycle indicators for plastic litter and linkages with other monitoring
88   initiatives across the plastics value chain

89   Section 5 provides a summary of existing and developing platforms of relevance.

90   Section 6 outlines the proposed features of a global platform for monitoring marine litter and
91   informing action, next steps and required resources.

92   Section 7 outlines a proposed pilot project for the development of marine litter in a digital
93   ecosystem for the environment.

94   Section 8 provides insights into aspirational, future developments.

95

                                                                                                  3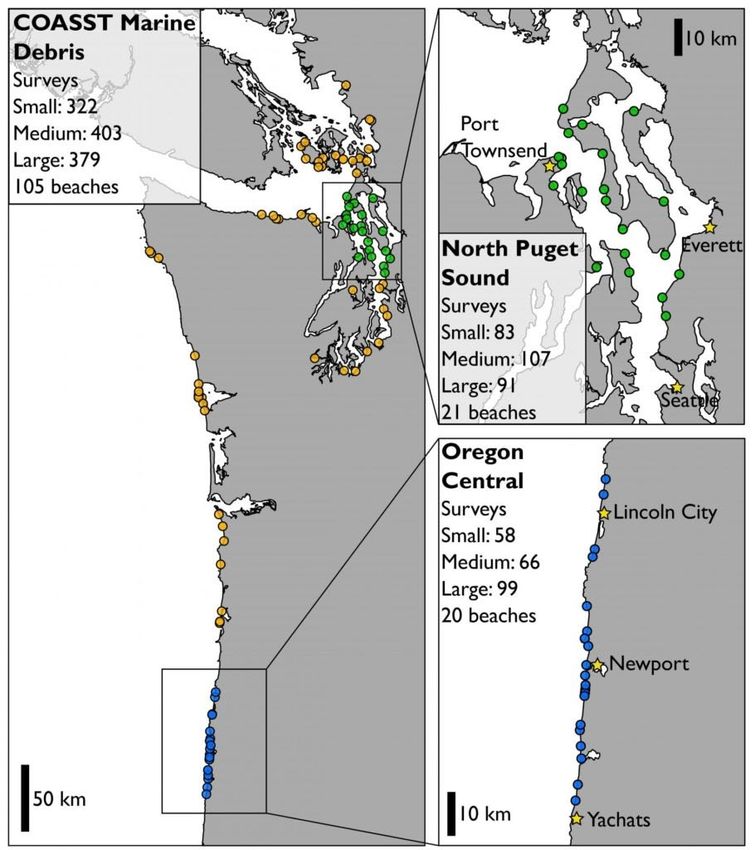
96   Section 1: Monitoring technologies
 97   There is a need for regular and standardized monitoring of marine litter in order to understand
 98   long-term changes in marine litter and for the successful development and implementation of
 99   mitigation strategies. The diverse nature, sources and impacts of marine litter require a wide
100   range of technologies and methods for monitoring. Recent efforts to compile information on
101   existing methodologies and recommend standardized methodologies for global monitoring
102   include the Joint Group of Experts on the Environmental Aspects of Marine Environmental
103   Protection (GESAMP) Guidelines for the monitoring and assessment of plastic litter and
104   microplastics in the ocean (GESAMP, 2019) and the Global Manual on Ocean Statistics (UN
105   Environment, 2018).

106   One challenge for implementing and further developing monitoring methodologies for marine litter
107   is an understanding of the existing technologies for monitoring marine litter. This section
108   summarizes technologies for the monitoring of marine litter and describes how to use these
109   technologies to collect the necessary data for a global view of marine litter. For an overview of
110   the observing system technologies required for the development of a future integrated marine
111   debris observing system, see Maximenko et. al. (2019).

112   For this paper, we have grouped technologies based on applicability to the size classes
113   recommended in the GESAMP 2019 methodology (Table 1). In addition, we have assigned
114   technology readiness levels (Table 2) based on the National Oceanic and Atmospheric
115   Administration (NOAA) policy on research and development transitions to support prioritization of
116   data standardization and integration. Readiness levels are defined by NOAA as “a systematic
117   project metric/measurement system that supports assessments of the maturity of research and
118   development projects from research to operation, application, commercial product or service, or
119   other use and allows the consistent comparison of maturity between different types of research
120   and development projects” (NOAA, 2017).

             Table 1. Size categories for routine marine litter monitoring (GESAMP, 2019)

                                Size Category           Size Range
                                Mega                    >1m
                                Macro                   25 mm – 1 m
                                Meso                    5-25 mm
                                Micro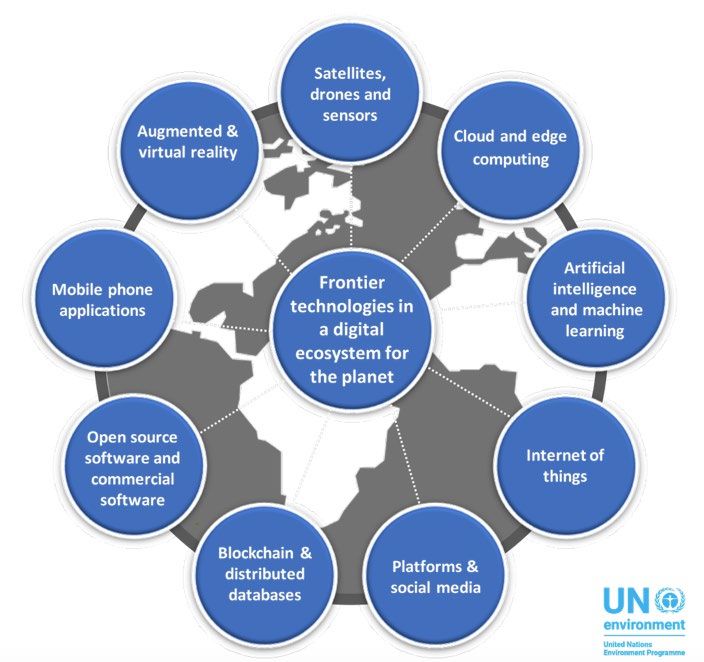
commercialization or other uses for societal benefits
             3                    Proof-of-concept (viability established)
             4                    Validation of system, process, product, service or tool in
                                  laboratory or other experimental environment
             5                    Validation of system, process, product, service or tool in
                                  relevant environment
             6                    Validation of system, process, service, or tool in relevant
                                  environment (potential demonstrated)
             7                    Prototype demonstrated in an operational or other relevant
                                  environment (functionally demonstrated in pseudo real world
                                  environment)
             8                    System, process, product, service, or tool completed and
                                  “mission qualified” through test and demonstration in
                                  operational or other relevant end-to-end environment
                                  (functionality demonstrated)
             9                    System, process, product, service or tool approved for
                                  deployment and use in decision making (transition complete)

121   Human observers
122   Visual human observation is the most wide spread and technically simplistic way to collect data
123   about marine litter. Human observers monitor beach/shoreline litter, floating litter, water column
124   litter, seabed/seafloor litter, marine litter ingestion/entanglement and sources of marine litter.
125   Human observation is most appropriate for macro- and mega-litter based on what is consistently
126   visible to the naked eye (GESAMP, 2019).

127   Protocols and guidelines for monitoring beach/shoreline litter with visual observations vary widely
128   by organization (UN Environment, 2016, Arctic Council, 2015; European Commission JRC, 2013;
129   Opfer et al., 2012; Cheshire et al., 2009; NOWPAP CEARAC, 2007). For litter on the
130   beach/shoreline surface, analysis is typically done through done through visual transects and
131   counting collected items from beach cleanup efforts. Some organizations employ apps to facilitate
132   data entry and reporting (e.g., NOAA Marine Debris Tracker App 1, European Environment
133   Agency’s Marine LitterWatch App 2, Ocean Conservancy’s Clean Swell App 3).

134   Human observers typically monitor floating litter using transects from ships. While different
135   methods are used, visual surveys from ships for floating marine litter have been used for almost
136   50 years and is an important source of data (GESAMP, 2019). These observations are generally
137   limited to mega- and macro-litter. Human observations of water column litter, and the analysis of

      https://marinedebris.noaa.gov/partnerships/marine-debris-tracker
      1

      https://play.google.com/store/apps/details?id=com.litterwatch&hl=en_US
      2

      https://www.coastalcleanupdata.org/#download
      3

                                                                                                       5
138 meso-litter, require collection of materials with net tows. Observers sort items by type and size
139 and analyze items by count and/or weight (GESAMP, 2019; Lebreton et al., 2018).
140 Underwater visual surveys by SCUBA divers can monitor and collect marine litter in shallow
141 waters. Distance and transect sampling is commonly used to measure marine litter density
142 (Galgani et al., 2013; Spengler, 2008; Buckland, 2001). This method is limited in its depth typically
143 to 20-30 m at most, requires SCUBA equipment and skilled observers, and is most appropriate
144 for macro-litter. In addition to professional surveyors, recreational divers also play a role in
145 surveys. For example, divers through Project AWARE’s Dive Against Debris program are
146 encouraged to collect and report marine litter found underwater, and they are directed to collect
147 and observe at the same locations when they do for further data validation (GESAMP 2019).
148 Visual reporting of abandoned, lost, or otherwise discarded fishing gear is an important part of
149 monitoring entanglement and entanglement risk. Overall, monitoring entanglement has a
150 straightforward observational methodology, where it is important to note the size, location,
151 impacted species or habitat, as well the type of litter when reporting on entanglement (GESAMP
152 2019). Networks for reporting of entanglement and litter with entanglement risk include the NOAA
153 SOS Whale Network 4 and the International Association of Geophysical Contractors Marine Debris
154 and Ghost Net Initiative 5. For example, in a study on pollution incidents reported by observers on-
155 board fishing vessels in the Western and Central Pacific Ocean, 71 - 80% percent of the incidents
156 reported were documented as waste dumped overboard, and only 13 -17 % as abandoned, lost
157 or dumped fishing gear, depending on the type of vessel (Richardson et al. 2017). Increased
158 observer coverage and data collection on-board ships such as fishing vessels may provide
159 essential information. Extending such observations to other vessels would provide more
160 information about the quantities and types of pollution caused by shipping. Reporting pollution
161 incidents on-board using navigation logs would continue to be an appropriate form for use by an
162 expanded, cross-fleet observer program that is quality controlled and standardized to Global
163 information Systems (IMO, GOOS, etc.).
164 Human observation of the sources of marine litter include monitoring floating riverine inputs and
165 leakage from waste sites. In Europe, the Riverine Litter Observation Network 6 uses human
166 observation of floating macro litter on the river surface. An added challenge to visual observations
167 of floating litter in riverine environments include surface water speed and turbulence (González-
168 Fernández & Hanke, 2017). In order to establish and estimate the link between land-based waste
169 management and losses of waste into the marine environment, human observers are used to
170 conduct terrestrial litter surveys of inland, riverine and coastal areas (Schuyler et al., 2018).
171 Data collected from human observers has been tested and used extensively for analysis in
172 regions including the North-East Atlantic, Baltic Sea and United States (Hardesty et al., 2017;
4
https://www.westcoast.fisheries.noaa.gov/protected_species/marine_mammals/disentanglement_networ
k.html
https://www.iagc.org/ghost-net-contact-form.html
5
6
https://mcc.jrc.ec.europa.eu/main/dev.py?N=simple&O=394&titre_page=RIMMEL%2520observation%25
20Network
6173 OSPAR, 2017; European Commmission JRC, 2013). However, since standardized global
174 protocol/process for collecting data using human observations has not yet been implemented, we
175 have assigned human observers a readiness level of 8.
Readiness Level: Human Observers
8: System, process, product, service or tool completed and “mission qualified” through test and
demonstration in operational or other relevant end-to-end environment (functionality
demonstrated)
176 Microscopy
177 Meso- and micro-litter analyses use microscopy, which has applications for the monitoring of
178 beach/shoreline litter, floating litter, water column litter, seabed/seafloor litter, marine litter
179 ingestion and sources of marine litter. Sample collection for beach/shoreline litter is typically done
180 by collecting sediment with a spoon, spoon trowel or sediment core and passing the sample
181 through various sieves depending on the size class of interest (GESAMP, 2019). Floating/water
182 column samples require filtration either after the samples are collected or using in situ filtration
183 equipment (Choy et al., 2019; GESAMP, 2019). Samples for ingestion are typically taken from
184 dead organisms or from items associated with live animals such as regurgitated pellets, scat and
185 nesting materials (GESAMP, 2019). In addition, submersible microscopes (e.g. holographic
186 (4deep) or cytometric) can autonomously measure micro-plastics in typical outflow areas. The
187 use of digital holographic microscopy, matched with the continuous advancements in deep
188 learning techniques, can provide new opportunities for the use of coherent imaging systems in
189 many areas, including potentially microplastics pollution analysis (Rivenson et. al., 2019)
190 Microplastics are often subject to microscopic analysis. Methods for sample preparation and
191 analysis vary widely based on sample type (e.g. water sample, sediment sample, ingested
192 sample) and microscopy type (e.g. light microscopy, electron microscopy, etc.). Prior to analysis,
193 microplastics undergo a chemical digestion to remove all organic matter from samples. Chemical
194 digestion methods, along with their advantages and disadvantages, are broken down into three
195 general categories: oxidative, acidic, alkaline/basic and enzymatic (Table 3).
Table 3. Advantages and disadvantages for extracting and purifying microplastics in organic
matrices (GESAMP, 2019)
Purification Method Advantages Disadvantages
Oxidative Digestion • Inexpensive • Temperature needs to be
controlled
• Several applications may be
needed
Acid Digestion • Rapid (24 hr) • Can attack some polymers
Alkaline Digestion • Effective • Damages cellulose acetate
• Minimal damage to most
polymers
Enzymatic Digestion • Effective • Time-consuming (several
• Minimal damage to most days)
7polymers
196 Methods for extraction of ingested litter from samples vary widely (Courtene-Jones et al., 2019;
197 GESAMP, 2019; van Franeker et al., 2011; Zhao et al., 2016) and need a standardized approach
198 to ensure consistency.
199 Another challenge for analysis of marine litter by microscopy is the potential for sample
200 contamination. Careful procedures to avoid sample contamination during analysis are being
201 implemented in research studies such as burning off contaminants from glassware, pre-filtering
202 of reagents through glass fiber filters, handling of samples in laminar flow hoods and analysis of
203 blanks to estimate potential contamination (GESAMP, 2019; Wesch et al., 2017; Zhao et al.,
204 2016).
205 Analysis by light microscopy typically consists of counting microplastics and characterizing their
206 color, shape and sizes (Vandermeersch et al., 2015). Scanning electron microscopy can provide
207 additional detail about the surface texture of particles but is only viable for analysis of small
208 quantities of samples do to the intensive processing and analysis required (GESAMP, 2019).
209 Overall, various microscopic approaches have trade-offs in terms of precision and accuracy of
210 material identification with some methods potentially underestimating microplastics pollution due
211 to false positives (Zarfl, 2019). As protocols for cleanly and accurately collecting, processing and
212 analyzing samples for microscopy are still being researched, we have assigned a readiness level
213 of 3 to light microscopy.
Readiness Level: Microscopy
3: Proof-of-concept (viability established).
214 Weighing
215 Technology for calculating the mass of marine litter is frequently used for the analysis of macro,
216 meso- and micro-litter beach/shoreline litter, floating litter, water column litter, seabed/seafloor
217 litter, marine litter ingestion/entanglement and sources of marine litter (Lebreton et al. 2018;
218 Lebreton et al., 2017; NOAA Marine Debris Program, 2015). Mega-debris is difficult to weigh,
219 compounded by the fact marine life heavily colonize mega-debris such as fishing nets. Challenges
220 for accurately weighing larger items include sand or debris entangled in the item and consistency
221 in properly drying samples (GESAMP, 2019). Technologies for weighing macro- and meso-litter
222 tend to be simple including scales and drying ovens (Ryan et al., 2014).
223 Accurate mass (or gravimetric analysis) of micro-plastic requires proper sorting, extraction and
224 sample purification as outlined in the light microscopy section. Consistency in mass
225 measurements have shown to be consistent across labs when the same method is applied for
226 analysis (NOAA Marine Debris Program, 2015). One critical aspect to consider for mass
227 calculation is that most methods for microplastics analysis include an density separation step
228 where settled solids are discarded and only floating solids are analyzed (GESAMP, 2019; NOAA
229 Marine Debris Program, 2015). One consideration regarding this approach is that scanning
230 electron microscopy images have shown microplastics to have extensive fouling by microbial
231 communities (Zettler et al., 2013) which can cause plastic debris to sink (Andrady, 2011).
8232 Accordingly, following proper steps prior to analysis of the weight of micro-litter will ensure that
233 biofouling does not result in an underestimate.
234 As standardized approaches to removing sand, biofouling and water residue from samples have
235 not been implemented and methods often vary widely or are not specifically reported, we have
236 assigned a technology readiness level of 3 to weighing marine litter.
Readiness Level: Weighing Litter
3: Proof-of-concept (viability established).
237 Spectroscopy
238 Spectroscopy, the analysis of absorption or scattering of light, allows for the discrimination
239 between organic and inorganic particles as well as various types of plastics as these materials
240 produce different spectral signals (Lenz et al., 2015). While the waste management and recycling
241 industries have utilized near-infrared spectroscopy to identify plastics since 1998, the utilization
242 of spectroscopy for analysis of marine litter is fairly recent (Choy et al., 2019; Yu et al., 2019; Zhu
243 et al., 2019; Zulkifley et al., 2014).
244 The focus of spectroscopy techniques such as Fourier Transform Mass Spectroscopy (FTIR) and
245 Laser Raman Spectroscopy have been on the analysis of microplastics in the marine environment
246 (Choy et al., 2019; GESAMP, 2019; Yu et al., 2019). New spectroscopic approaches such as staining
247 and semi- or fully-automated spectroscopic analysis are currently under development (GESAMP,
248 2019). As sample collection, treatment and analysis methods are still in the research and development
249 phase for the identification of marine plastics by spectroscopy, we have assigned a readiness level of
250 1 to spectroscopy.
Readiness Level: Spectroscopy
1: Basic research and/or development principles observed and reported.
251 Mass Spectronomy
252 Mass spectronomy measures the mass to charge ratio of ions in a sample, providing information
253 about chemical composition. Mass spectronomy technologies used for analysis of microplastic
254 particles include thermal extraction and desorption gas chromatography mass spectrometry
255 (TED-GC-MS) and pyrolysis gas chromatography mass spectrometry (Py-GCMS). These
256 technologies require the thermal degradation of plastics, separation of degradation products
257 through chromatography, and analysis of the products with mass spectronomy (GESAMP, 2019;
258 Dumichen et al., 2017) . Other forms of mass spectronomy identify chemicals associated with
259 plastic samples (GESAMP, 2019; Kuhn et al., 2018). For example, inductively coupled plasma
260 spectroscopy (ICP-MS) can identify metals associated with plastics, which can provide
261 information about hazardous metals associated with microplastics (Kuhn et al., 2018). As the
262 application of mass spectronomy to the analysis of marine litter is still in the research and
263 development phase, we have assigned a readiness level of 1 to mass spectronomy.
9Readiness Level: Mass Spectronomy
1: Basic research and/or development principles observed and reported.
264 Visual Imagery and Video
265 Ship-based cameras, unmanned aerial vehicles (UAVs), balloons, high altitude pseudo satellites
266 (HAPS), remotely piloted aircraft systems (RPAS) and satellites collect visual imagery. Fixed-
267 wing drones are increasing the distance and duration of drone flights. Blimps have the advantage
268 of longer stable flights. Model studies should guide the use of both drones and blimps, as they
269 are limited in terms of timing and spatial coverage.
270 The use of small aircraft, drones, unmanned aerial vehicles (UAVs), balloons, and satellites are
271 promising for the analysis of beach litter as well as sea surface litter. The advantages of aerial
272 technologies include access to imagery from difficult to access beaches, more rapid, complete
273 beach coverage, and high-resolution imagery. Aerial imagery can be processed manually or
274 automatically using machine learning tools that are currently in development (Deidun et al., 2018;
275 Martin et al., 2018; Moy et al., 2018). The various aerial technologies have strengths and
276 weaknesses based on cost and coverage. For example, UAVs offer ultra-high resolution imagery
277 but are prohibited to fly over people, limiting survey locations (Moy et al., 2018). Validation of
278 results using ground measurements is an important component for the development of these
279 technologies and further tests are necessary to understand the limitations and appropriate
280 applications of aerial technologies for monitoring of beach litter (Deidun et al., 2018; Moy et al.,
281 2018).
282 Photographing marine litter using a camera fixed to the bow or mast of a vessel is an emerging
283 approach for monitoring floating marine litter. High-resolution cameras or other sensors (e.g.
284 Lidar) mounted on ships can increase the observations on the floating litter and with the use of
285 AI, provide in situ observation in real time. Further testing is necessary to validate the consistency
286 of these sensors. In addition to ship-based cameras, autonomously operated vehicles (AOVs)
287 have the potential to monitor of surface/subsurface marine litter at sea. For example, Wave
288 Gliders that use wave energy for propulsion often have video cameras that can be used for marine
289 litter quantification (Galgani et al., 2013).
290 Remotely operated vehicles (ROVs), such as submarines or manned submarines, can view
291 seabed litter plastic or take core or surface samples to detect presence of microplastics and other
292 litter (Woodall et al., 2014). ROVs are often preferable for litter surveys on continental slopes,
293 uneven terrain, or the deep seafloor. Litter can accumulate in certain locations on the seafloor
294 such as coastal canyons, as well as areas with steep slopes, rocky bottoms, or ocean trenches.
295 These areas would specifically benefit and often necessitate the use of ROVs to observe and/or
296 collect marine litter. Video cameras can record high-resolution images while other light devices
297 such as lasers can measure transect areas, object size and distances on the seafloor. Proposed
298 learning algorithms aimed at more successful vision detection of litter will be useful in exploring
299 and mapping litter by autonomous underwater vehicles. While ROVs have proven useful, the high
300 cost of operation as well as the specific skill set required for both operation and observation
301 remain a limitation.
10302 There are various technologies to estimate riverine sources directly with varying levels of effort,
303 scale and accuracy. Drone or field surveys of river mouths can assess accumulated plastic.
304 DRONET 7 is developing a standard methodology for drone-based surveys of plastic.
305 Visual imagery and video are used in relevant environments but do need standardization.
306 Accordingly, we have assigned a readiness level of 5 to the analysis of marine litter by visual
307 imagery and video.
Readiness Level: Visual Imagery and Video
6: Validation of system, process, service or tool in relevant environment (potential
demonstrated).
308 Synthetic Aperture Radar
309 Synthetic Aperture Radar (SAR) provides high-resolution image of the radar reflectivity of an
310 observed scene. SAR has potential to provide information about expected locations of marine
311 litter and detect mega-litter on the water’s surface but is sensitive to parameters such as surface
312 roughness. Waves (surface and internal), winds, currents, upwelling and several other
313 oceanographic phenomena influence surface roughness. Interestingly SAR is also sensitive to
314 presence of substances that can dampen the surface waves, such as oil spills, algal blooms or
315 any other substances influencing the water surface tension and often defined surfactants.
316 Two main mechanisms could lead to the detection of plastics on water surface: a) detection of
317 large plastic debris and b) detection of microplastics or small concentration of plastic pieces in
318 the water column.
319 a) Plastic debris: SAR can detect large metallic objects on the sea surface; however, it is still
320 unknown if large concentration of plastic debris can produce changes in pixel brightness
321 (i.e. increase or decrease backscattering). In an experiment by Topouzelis &
322 Papakonstantinou (2019), Sentinel-1 detected large squares of plastic bottles but not
323 detect all experimental squares.
324
325 b) Microplastics: Plastic in the ocean is heavily colonised by microbes that produce
326 substances and biofilms (surfactants). Marino et al. (2019) showed that surfactants such
327 as sea-slicks and biofilms were visible on Sentinel-1 images as dark curved stripes. They
328 hypothesized these “stripes” occur because of the microbial colonisation of micro-plastics.
329 Additionally, ocean colour images showed very low chlorophyll-a concentrations, which
330 suggests these features were not produced by algal blooms. These signatures present
331 dependency on a range of winds, appearing at wind speeds up to 10ms–1.
https://www.theplastictide.com/blog-1/2018/4/22/launching-the-marine-litter-dronet
7
11332 As the use of SAR for marine litter, monitoring is still in the research and development phase, we
333 have assigned a readiness level of 1 to SAR.
Readiness Level: Synthetic Aperture Radar
1: Basic research and/or development principles observed and reported.
334 Multispectral and Hyperspectral imaging
335 Satellite remote sensing of beach litter and sea surface litter is currently in the research and
336 development phase, primarily repurposing missions that were not originally designed for litter
337 monitoring. Satellite imagery relevant for remote sensing of beach litter includes visual imagery
338 and spectral analysis. Commercial satellite imagery is the primary technology of relevance when
339 detecting litter on beaches and rivers, given the very high-resolution needed to discern this litter.
340 For spectral analysis, research activities to map the spectral signatures of marine plastics are
341 underway and show promise for potential characterization of marine litter on beaches (Acuna-
342 Ruz et al., 2018; Garaba & Dierssen, 2018). Preliminary studies have shown the synergetic use
343 of satellite images and UAVs to detect floating litter (Topouzelis et al, 2019). Current high-
344 resolution satellite sensors can monitor floating mega litters. Statistical indicators and density heat
345 maps can be derived in accordance to predefined requirements. Future satellite sensors may
346 show improved functionality for measuring marine litter on beaches but these concepts are still in
347 development. Given the current state of technology and applications research, we have assigned
348 a technology readiness level of 1 for satellite remote sensing of beach and sea surface litter.
349 Multi-spectral satellite remote sensing of plastic in the water column is currently only possible for
350 larger elements on or close to the water surface, and under good atmospheric conditions (no
351 clouds). The Copernicus Sentinel 2 constellation is likely to be the most valuable existing mission
352 with freely available data and relatively high-resolution (10m GSD) spectral radiometry with global
353 coverage. Commercial higher (i.e. very high-resolution) satellite data are available for purchase
354 but have low temporal resolution. In all cases, cloud cover and sea surface conditions affect the
355 detection of debris no matter the resolution. An initial assessment of observation requirements for
356 measuring marine plastic debris from space can inform further sensor development (Martínez-
357 Vicente et al, 2019).
358 As the plastic elements sink or decompose, the likelihood of detection with remote sensing
359 methods decreases significantly. There are some promising methods for looking at anomalies or
360 particular signatures to identify ocean plastic. For example, ESA’s Sentinel-3 satellite has an
361 ocean color imager that is potentially detecting unique signatures or large agglomerations of
362 plastic. However, this sensor only images at 300 m resolution, and even with a revisit rate of
363 almost every 2 days, it will not detect most plastic of interest. Commercially available
364 hyperspectral sensors such as HyMap may be more suited for detecting plastics (Garaba et al.,
365 2018; Goddijn-Murphy et al., 2018).
366 As multispectral and hyperspectral imaging is still in the research and development phase, we
367 have assigned a readiness level of 1.
Readiness Level: Multispectral and Hyperspectral imaging
121: Basic research and/or development principles observed and reported.
368 GPS tags and transmitters
369 Debris tagged with GPS tags and transmitters can provide direct tracking of floating marine items.
370 Compiling trajectories of marine litter can reconstruct the path of plastic from source to fate. Argo
371 tracking sensors, or GPS devices, can track debris but remain too expensive to implement widely.
372 The upcoming Kineis constellation from CLS 89, or a low-tech solution such as PandaSat 10
373 proposed by WWF, could provide more affordable solutions in 2021. Large floating plastic debris
374 is tagged and tracked using satellite trackers deployed from vessels in the Pacific2. However,
375 these do come with the caveat of introducing electrical trash into the environment. For areas close
376 to shore, cheaper, accurate IoT (internet of things) technology can be deployed using
377 conventional 3G networks, or Lora systems to provide better coverage where mobile data is
378 lacking. Deployment of Iridium satellite connectivity is prohibitively expensive. Accordingly, the
379 use of GPS tags and transmitters to monitor the trajectory of marine litter have been assigned a
380 readiness level of 1.
Readiness Level: GPS tags and transmitters
1: Basic research and/or development principles observed and reported.
381 HF Coastal Ocean Radar
382 The primary product of HF Coastal Ocean Radar (HFR) is mapping of surface currents within
383 200km of the shore, and some systems produce maps of significant wave height to about one-
384 third of the range for currents. The spatial and temporal resolutions vary in the range 300m –
385 20km, and 5min – 3hour respectively, depending on the operating frequency and whether the
386 system is based on a wide aperture (for high resolution) or a compact configuration. Wind
387 directions are observed, and U10 wind speeds are derived from the significant wave height
388 measurements. HFR systems are located on land and usually run continuously, producing data
389 with latency times of the order of minutes to data hubs and archives.
390 HFR is useful for mitigating the effects of plastics in the ocean in three ways.
8
https://mcc.jrc.ec.europa.eu/main/dev.py?N=simple&O=394&titre_page=RIMMEL%2520observation%25
20Network
https://www.cls.fr/en/kineis-unique-constellation/
9
10
https://space-science.wwf.de/project/pandasat/
13391 a) The 2D field of surface current vectors can be analysed to identify locations and properties
392 of meso-scale eddies in coastal waters, and convergences in the surface field where
393 down-welling occurs to concentrate surface debris. The advantage of 24/7/365 data is
394 that it can be used for time scales of tidal effects up to seasonal variability.
395 b) The high-resolution configurations provide Langrangian Tracking of parcels of surface
396 water and provide insights into horizontal diffusion and Coherent Lagrangian Structures
397 that set boundaries to surface drifters.
398 c) Maps of wind speed and directions improve the tracking of floating objects.
399 HFR installations are generally in areas of environmental or social concern where direct
400 measurements are useful, but realistically HFR installations are sparse and their main use will
401 most likely be to provide insights into accumulation dynamics, and to validate dynamical models.
402
Readiness Level: HF Coastal Ocean Radar
1: Basic research and/or development principles observed and reported.
403 Modeling
404 The abundance of litter in the marine environment has steadily increased over the last few
405 decades and recent studies have showed relatively high concentrations of microplastics particles
406 (particles up to 5 mm) in coastal sediments (Browne et al., 2011). By various means (e.g. transport
407 accidents, inappropriate disposal of packing materials as well as microplastics beads used in
408 cosmetics), different types of plastics enter the water column, with serious ecological implications
409 for marine organisms, such as fatal entanglement in macro plastics or the ingestion of
410 microplastics by fish and birds (Leslie et al., 2011). With these concerns in mind, many questions
411 arise: Which areas probably have the highest concentrations of plastic litter (hotspots)? What are
412 the transport routes of plastic litter in the water bodies and in which areas do they end up? How
413 are different types and sizes of plastic behaving? The fate of the plastics in the marine
414 environment is also uncertain: they might accumulate or degrade due to fragmentation and
415 microbiological decay. To address these issues, it is essential to develop an integrated approach
416 that highlights the role of transport and fate models to provide the means to include different
417 processes and investigate their relative contribution.
418 High-resolution hydrodynamic models are considered critical to resolving the key marine litter
419 questions as they offer a platform that can integrate (and give much greater value to) the very
420 sparsely available observation data (Martinez-Vicente et. al., 2019). An analogous example is the
421 assimilation of the relatively sparse Argo float data into the Mercator global forecast, greatly
422 improving the performance and reliability of the model (e.g. Turpin et. al., 2016). There are
423 certainly technical hurdles e.g. establishing common currency, metrics and uncertainties between
424 specific observation types and models; establishing the necessary sub-mesoscale global nests
425 of models required for appropriate simulation of litter dispersion and accumulation (D’Asaro et al
14426 2018). The combination of high-resolution numerical simulations and sparse observations will
427 certainly play a major role in better understanding global dispersion and accumulation.
428 Numerical modeling of beach litter primarily aims to forecast litter accumulation on beaches to
429 support cleanup efforts and identify potential hot spots (Granado et al., 2019; Haarr et al., 2019;
430 Yoon et al., 2010). One challenge for predicting beach litter accumulation is the fine resolution
431 required, ranging from a few 100 m to 1 km, which can be limiting for forecasting along shorelines
432 that lack high resolution data and oceanographic models (Critchell & Lambrechts, 2016).
433 Combining local and regional high-resolution circulation models with satellite-observed surface
434 debris could provide a basis for forecasts of beaching events. This approach is discussed for
435 forecasting beaching of Sargassum and could be used for marine debris. Research efforts to
436 develop and improve beach litter forecasts through new techniques, such as machine learning
437 and GIS-based tools, are underway but are still in the research and development phase (Aydin &
438 Butler, 2019; Critchell et al., 2015; Critchell & Lambrechts, 2016; Granado et al., 2019; Yoon et
439 al., 2010).
440 A very important auxiliary input for modeling the trajectories of plastics in the ocean are ocean
441 surface currents. The output of regional and global Ocean General Circulation Models (OGCM)
442 can map and predict past and future trajectories of marine plastic. This can assist in identifying
443 sources and accumulation locations (van Sebille et al., 2012). The data used to generate these
444 models include wind speed and direction, mapped sea level anomaly (MSLA), and sea surface
445 temperature, which are available almost daily. These models can be fine-tuned using data from
446 buoys, or GPS tracked plastic pieces (GESAMP, 2019; van der Mheen et al., 2019). The TOPIOS
447 project (http://topios.org/), among others, is developing three-dimensional modeling of marine
448 plastic. To improve the knowledge regarding the distribution and possible accumulation zones of
449 marine plastic litter in the North Sea and within the CleanSea project, microplastics transport is
450 simulated with a hydrodynamic-based particle tracking model. The model calculates how the
451 position of microplastic particles evolves in time from their release until the end of the simulation.
452 The settling velocity of the plastic particles in the water system is dependent on the ambient
453 conditions (temperature/salinity) as well as on the particle characteristics (density/size/shape).
454 The developed model is generic and can be extended to other European regional
455 seas.(http://cleansea.eu) (Stuparu et al., 2015).
456 Modeling is a promising approach to improve the existing knowledge regarding the litter dynamics
457 in marine environments and obtain new insights in areas where information is lacking (Thompson
458 et al., 2009). For example, the data regarding the abundance of plastic litter on the seabed is very
459 limited. Also, it is assumed that substantial quantities of plastic litter has accumulated in the
460 natural environment due to the continued input of marine litter over the last decades; however,
461 the location of possible accumulation areas is not well delimited. The modelling approach
462 provides a link between the source and the fate of microplastics. By describing microplastics
463 pathways, an overview of estimated accumulation areas is possible and can be a helpful tool for
464 guided monitoring and data collection campaigns.
465 As modelling of marine litter is still in the research and development phase, we have assigned a
466 readiness level of 1.
Readiness Level: Modelling
1: Basic research and/or development principles observed and reported.
15467
16468 Table 4. Summary of technology for marine litter monitoring
469
Technology Readiness Size Class Application Area Pros Cons
Level
Human eye 8 Mega- and • Beach/shoreline litter • Advanced technology not • Depends on regular sampling
macro-litter • Floating/water column required and commitment of human
litter • Can be implemented by resources
• Ingestion of marine citizen science volunteers • Dependent on human error
litter/entanglement • Well-developed methods • Resource and time intensive
• Sources of marine litter and studies exist • Requires global agreement
and implementation of
comparable methods
Weight 3 Mega-, • Beach/shoreline litter • Allows for relatively quick • Beach litter water content,
macro-litter • Floating/water column and simple analysis of sand and biofouling can bias
and micro- litter beach litter quantities results
litter • Can be linked with • Presence of light weight items
• Ingestion of marine
litter/entanglement voluntary beach clean-up such as Styrofoam and
efforts wrappers may lead to
• Sources of marine litter
underestimates of beach litter
severity
Microscopy 3 Meso- and • Beach/shoreline litter • Provides information about • Sample collection and analysis
micro-litter • Floating/water column smaller classes of litter has risk for contamination
litter • Provides important • Sample preparation and
• Ingestion of marine information about ingestion analysis varies and requires
litter/entanglement agreement and
implementation of
• Sources of marine litter
comparable methods
• Time consuming
• Human error in identifying
material types
17Spectroscopy 1 Meso- and • Beach/shoreline litter • Provides information about • Time consuming and
micro-litter • Floating/water column types of plastics in a expensive
litter sample • Consistent sample preparation
• Ingestion of marine • Can provide information methods not agreed upon
litter/entanglement about the fate and • Limited number of samples
breakdown of litter can be analysed
• Sources of marine litter
Mass 1 Micro-litter • Beach/shoreline litter • Provides information about • Time consuming and
Spectronomy • Floating/water column chemicals associated with expensive
litter litter (such as • Limited number of samples
contaminants) can be analysed
• Ingestion of marine
litter/entanglement
• Sources of marine litter
Visual 6 Mega- and • Beach/shoreline litter • Simple and affordable • Limited to large debris items
Imagery and Macro-litter • Floating litter technology • Image processing can be time
Video • Variety of systems consuming
• Ingestion of marine
litter/entanglement available including
cameras attached to air
• Sources of marine litter
planes, drones, and
submersibles
• Access to hard to reach
beaches
Hyperspectral 1 Macro-litter • Beach/shoreline litter • Ability to survey large • Regulatory issues can restrict
Imaging • Floating litter areas in short periods of areas of operation of airborne
time by using satellites, platforms
• Sources of marine litter
planes or drones • Limited to large debris items
• Access to hard to reach • Imagery can be limited by
beaches weather conditions
• Image processing can be
challenging and time
consuming
• Further research and
18You can also read